Article

Effects of Rhizobium Inoculation on N2 Fixation, Phytochemical Profiles and Rhizosphere Soil Microbes of Cancer Bush Lessertia frutescens (L.)

by
Manaka J. Makgato
1,2,
Hintsa T. Araya
2,*,
Christian P. du Plooy
2,
Salmina N. Mokgehle
2 and
Fhatuwani N. Mudau
1,3
1
Department of Agriculture and Animal Health, College of Agriculture and Environmental Sciences, University of South Africa, Private Bag X6, Florida 1710, South Africa
2
Agricultural Research Council-Roodeplaat, Vegetable, and Ornamental Plants, Private Bag X293, Pretoria 0001, South Africa
3
School of Agricultural, Earth and Environmental Sciences, University of KwaZulu Natal, Scottsville, Pietermaritzburg 3201, South Africa
*
Author to whom correspondence should be addressed.
Agronomy 2020, 10(11), 1675; https://doi.org/10.3390/agronomy10111675
Submission received: 5 October 2020 / Revised: 22 October 2020 / Accepted: 26 October 2020 / Published: 29 October 2020
(This article belongs to the Section Soil and Plant Nutrition)

Abstract

:
Plant-beneficial microorganisms are determinants of plant health and productivity. However, the effects associated with secondary plant metabolism and interactions in the rhizosphere for Cancer bush Lessertia frutescens (L.) is unclear. The study was conducted to understand the mechanism of rhizobium inoculation for L. frutescens, variations in phytochemicals, soluble sugars, and soil–plant interactions in the rhizosphere. Four rhizobium inoculation levels (0, 100, 200, and 400 g) were evaluated under the field conditions to establish the antioxidant properties, soluble sugars, and rhizosphere soil microbial diversity at 150, 240, and 330 days after planting (d.a.p). Although inoculation did not significantly affect plant biomass and N2 fixation of L. frutescens, total phenolics and flavonoids were enhanced with the application of 200 g at 240 days after planting. The antioxidant values analyzed through FRAP (Ferric reducing power assay) were highest with 100 g inoculation at 240 days after planting. Water-soluble sugars such as fructose, sucrose, and glucose increased with the application of 400, 200, and 100 g rhizobium inoculation. The rhizosphere′s carbon source utilization profiles (CSUP) did not vary significantly, depicting the weaker ability in converting C, P, and N profiles. The lowest ß glucosidase activity was observed in the bulk soil with the lowest alkaline and acid phosphatase activities. Soil microbial populations present in the bulk sample demonstrated the smallest overall enzyme activities. The variation of different variables studied indicate the potential of rhizobium inoculation. However, further studies are required to ascertain the inoculation′s effectiveness for plant growth and rhizosphere microbial populations of L. frutescens.

1. Introduction

Large-scale medicinal plants′ production using modern cultivation technologies is being practiced globally to meet the demand of plants for their bioactive compounds and ingredients in food. The adoption of agronomic practices such as cultivation period, temperature, inoculation source, harvesting period, and other environmental factors is crucial for agricultural production. Inoculation of medicinal plant species with rhizobium and the association formed with various microorganisms can be formulated as biofertilizer and biocontrol tools to improve sustainable agriculture [1]. The plant–bacterial interactions in the rhizosphere contribute to plant health and soil fertility [2,3]. Medicinal plant compounds quantity and quality can be enhanced through sustainable technology of inoculating with plant growth-promoting rhizobacteria (PGPR). This includes the symbiotic rhizobia and Arbuscular mycorrhiza (AM) fungi. The rhizobium species have been reported to promote growth and yield through root morphology, growth physiology, and biological nitrogen fixation [3]. The effect of rhizobial inoculation in legumes has been widely studied from an agronomic perspective, indicating that biofertilization with rhizobia can improve yields [4]. The root-nodulating bacterium, Rhizobium meliloti, isolated from the medicinal plant Mucuna pruriens, produced siderophores, which improved plant growth [5]. Numerous field and experimental studies reported an increase in the shoot height and root biomass of various medicinal plants in response to mycorrhizal colonization [6,7,8,9,10]. Rhizobium inoculation has been reported to increase growth and yield parameters, including nodule number, nodule weight, shoot weight, root weight, total biomass, and grain yield [10]. Lessertia frutescens is an economically important legume of medicinal value, used to treat many ailments due to its phytochemical properties [11,12]. It belongs to the family Leguminosae and is widely distributed in Southern Africa (Namibia, Botswana, and South Africa). In South Africa, the plant is commonly found in the Western, Eastern, and Northern Cape Provinces [12,13]. According to Van Wyk and Gericke [12] and Makunga et al. [13], the plant could be used to treat cancer, diabetes, and HIV/AIDS. The species has been used traditionally in Southern Africa by different races for medicinal uses [14,15]. Phytochemical profiling revealed the presence of gamma-aminobutyric acid (GABA), L-canavanine, pinitol, flavanol glycosides, and triterpenoid saponins, which are crucial in human health [16,17]. The isolation and identification of flavonoids, triterpenoids, and antioxidant activities from the leaf extracts of L. frutescens showed the potential to treat ailments [17].
Legumes are characterized by a significant number of bioactive compounds, fiber, proteins, minerals, and vitamins with the potential to human health. They are beneficial for sustainable agriculture through symbiotic nitrogen fixation as well [18]. Bioactive compounds of legumes include isoflavones and phenolic acids, which constitute the major phenolic compounds present in the seeds [19,20,21]. The influence of rhizobial inoculation on legume bioactive compounds have been reported. The inoculation of Glycine max with endosymbiont Bradyrhizobium japonicum increased the content of phenolic compounds and organic acids in leaves soybean [20]. Compounds such as phenolics play a significant role in modern therapeutic medicine based on indigenous therapies, ethnopharmacological uses and are included in the nutraceutical products of food [13,14,15,22]. Most of the natural compounds currently available as pharmaceutical products have been isolated from plant extracts have proven to treat several ailments, including anti-cancer properties [22].
Agriculture is challenged to develop sustainability strategies to conserve natural resources for good agricultural produce and soil health maintenance [23,24,25]. A soil′s capacity to function as a vital living system within an ecosystem and land-use boundaries to sustain plant productivity and promote plant health is critical [26]. A wide range of microorganisms plays a significant role in the maintenance of soil health and quality. There is a need for reliable and accurate mechanisms to understand the soil microbial diversities of L. frutescens responsible for the availability of Nitrogen (N), Phosphorus (P), and Carbon (C). The critical factor responsible for soil microbial diversity is associated with the complexity of the microbial interactions in soil, microorganisms, and plants.
Previous reports have indicated PGPR and AM fungi′ potential to improve soil structure significantly, medicinal value, nutrient uptake by plants, plant growth, productivity, and biodiversity [27,28]. Research on legume components and contribution to human health have gained interest. In addition, the characterization of rhizobacteria and soil–plant-microbe interactions of legume crops has been extensively studied. However, the information on the effect of rhizobium inoculation on rhizosphere soil microbes and phytochemicals content and biomass of L. frutescens is limited. The study evaluated growth, N2 fixation, the interaction of soil microbes, and phytochemical profiles of L. frutescens inoculated with rhizobium under field conditions.

2. Materials and Methods

2.1. Study Site and Soils

The study was conducted at the Agricultural Research Council—Vegetable and Ornamental Plant (ARC-VOP, Roodeplaat), Pretoria, South Africa (25°59′ S; 28°35′ E). The site was previously cropped with Amaranthus cruentus and managed using limited chemical fertilizers. Climate data for the experiment were collected from the Agricultural Research Council regional weather station (Campbell Scientific, Logan, UT, USA). The mean maximum temperature measured during the 2014/2015 and 2015/2016 cropping season ranged from 21.26 °C to 33.88 °C. The highest minimum temperature was recorded at 18.09 °C. The area has a unimodal rainy season that starts in October each year and ends in April the following year. During the cropping season, the site received the highest rainfall of 680 mm. Soil samples were collected at depths (0–30 cm and 30–60 cm) and analyzed (Table 1). Soil chemical properties were highly variable between the two depths, including phosphorus (up to 54.43 mg/kg), potassium (up to 287.67 mg/kg), and pH (7.30).

2.2. Rhizobium Strain and Inoculum Preparation

The seeds of L. frutescens were obtained from the Agricultural Research Council Genebank. The inoculant Groundnut and Cowpea Group Inoculant (Registration No. L 5798 Act 36 of 1947) was purchased from Stimuplant, Zwavelpoort, Pretoria, South Africa. In summary, the rhizobium strain was grown in yeast mannitol (YM) as liquid cultures for five days at 28 °C. The finely ground peat soil was used as the rhizobium carrier material. The peat soil received appropriate nutrients to support optimum growth and establishment of the rhizobia on the carrier. The final rhizobium cell density was adjusted to 0.7 g/mL, with a pH of 6.5–7.0 and a moisture content of 50–60%.

2.3. Experimental Design

A Latin square design with four levels of commercial rhizobium inoculant was used in the study. The experimental design consisted of four treatments (T0–T4). Treatment T0 represented 0 g of rhizobium inoculation; T1 = 100 g, T2 = 200 g, and T4 = 400 g per 100 kg of seeds L. frutescens. The experiment was laid with four replicate plots per treatment. Each plot measured 2.1 m × 4 m. Row-to-row and intra-row spacings were 70 and 10 cm, respectively. The seedlings were raised under the glasshouse before cultivated under the field conditions. The glasshouse temperature was monitored using a data logger (Tinytag View 2, TV-1500, Chichester, UK). The seedlings were transplanted to the field at 60 days after planting and maintaining traditional practices, including weeding and managed equally across treatments. Supplemental irrigation was applied through sprinkler irrigation when necessary to obtain optimum growth.

2.4. Plant Sampling and Preparation

Plants from the middle row of each plot were carefully dug up at 150 days after planting (d.a.p.), 240 (d.a.p.), and 330 (d.a.p.) for the cropping season. Plants were separated into shoots according to treatments and oven-dried at 50 °C. Shoots were weighed and milled using a 0.045 mm sieve for total phenolic, flavonoid, and antioxidant activity analysis. Shoots used to determine soluble sugars were freeze-dried, ground and stored at −20 °C until further analysis.

2.5. Determination of Functional Diversity

The rhizosphere samples were destructively obtained from all the treatment plots of L. frutescens. The bulk soil samples were collected outside the experimental area and used as reference soils. Whole-community substrate utilization profiles (CSUP) were assessed when carbon sources are utilized. Soil samples were diluted in sterile distilled water and inoculated into Biolog EcoPlates (Biolog® Inc., Hayward, NJ, USA) containing 31 different carbon sources in each well (and one control well containing no carbon source), in triplicate. The utilization of carbon sources by microbial populations reduced the tetrazolium dye inside the EcoPlate wells, causing a color change measured to determine average well color development (AWCD). The soil microbial populations′ functional diversity was determined using the amount and abundance of carbon substrates metabolized as indicators of richness (Shannon-Weaver index) and evenness (Evenness index), respectively.

2.6. Determination of Soil Microbial Enzymatic Activity

The soil microbial population′s ability to obtain carbon, phosphorus, and nitrogen was assayed by measuring the ß-glucosidase, alkaline phosphatase, acid phosphatase, and urease activities. ß-Glucosidase and phosphatase activities were calculated by determining the release of p-nitrophenyl after the incubation of soil with p-nitrophenyl glucoside and p-nitrophenyl phosphate, respectively. Urease activity was determined where free ammonia was measured after the incubation of soil samples with a urea solution, where results were then calculated according to the calibration curve. The overall enzyme activity is calculated as the sum of all enzyme activities, divided by four (expressed as the µg/g/h).

2.7. Determination of Total Phenolics and Flavonoids

Extraction and quantification of total phenolics and flavonoids contents followed methods described by Li et al. [29] and Ibrahim et al. [30]. A fixed amount of ground shoot samples (0.2 g) was extracted with 50% methanol (10 mL) and vortexed using Ultra-Turrax (Model T25D, IKA, and Germany) for one minute. The mixture was shaken overnight at room temperature using an orbital shaker (Model 361, Germany), and extracts were subsequently filtered (Whatman No.1) to quantify total phenolics and total flavonoids. Folin–Ciocalteu phenol reagent (1:1 ratio) was used to determine the samples′ total phenolics content. One mL of the sample extract was mixed with 1 mL of Folin–Ciocalteu reagent and allowed to stand for 5 min before adding 2 mL of sodium carbonate (7.5%). The final mixture was kept in the dark for 2 h to complete the reaction, and absorbance was measured in triplicates at 765 nm. The results were expressed as milligrams gallic acid equivalents per gram of dry weight (mg GAE/g dry sample). For total flavonoids determination, sample extract (0.1 mL) was mixed with 0.3 mL of deionized water, followed by 0.03 mL of 5% sodium nitrite (NaNO2) and left for 5 min. Then 10% AlCl3 (0.03 mL) was added followed by addition of 1 mM NaOH (0.2 mL). The absorbance was measured at 510 nm in triplicates using a spectrophotometer with quercetin as a standard (results expressed as mg/g QE dry sample).

2.8. Determination of Ferric Reducing Antioxidant Power (FRAP) Assay

The ability to reduce ferric ions was measured using Benzie and Strain [31]. A fixed amount of ground shoot samples (0.2 g) was mixed with 10 mL of 1N Perchloric acid and standardized using an Ultra-Turrax (Model T25D, IKA, Staufen, Germany) for one minute. The mixture was centrifuged at 5000 g for 10 minutes at 4 °C using a Sorvall RC 5C centrifuge (Sorvall, Newtown, CT, USA). The stock solution contained 300 mM acetate buffer (pH 3.6), 10 mM TPTZ (2, 4, 6-tripyridyl-triazine) in 40 mM HCl and 20 mM FeCl3·6H2O solution in distilled water. The freshly prepared FRAP reagent contained acetate buffer (25 mL) and TPTZ (2.5 mL), which were mixed with FeCl3·6H2O (2.5 mL). An aliquot (30 µL) of the extract was mixed with 900 µL of FRAP reagent and allowed to react under dimmed light for 30 min. The increase in absorbance at 593 nm was measured using a UV-1800 UV-VIS spectrophotometer after 30 min. The antioxidant capacity based on the ability to reduce the extract′s ferric ions was expressed as µM Fe (II)/g dry mass.

2.9. Determination of Soluble Sugar Concentration

A fixed amount of freeze-dried shoot samples (0.10 g) was extracted with 10 mL of 80% (v/v) ethanol and homogenized using an Ultra-Turrax (Model T25D, IKA, Germany) for 60 s. The mixture was then placed in a water bath at 80 °C for 1 h before it was kept overnight at 4 °C. The mixture was centrifuged at 12,000 g for 15 min at 4 °C, and the supernatant was filtered using a ball of glass wool and dried in a Savant Vacuum Concentrator (SpeedVac, Savant, New York, NY, USA). Dried samples were resuspended with 2 mL of ultra-pure water and filtered through 0.45 μm nylon filters and analyzed using an HPLC-RID (high-performance liquid chromatography–refractive index detector) system (liquid chromatography (LC-20AT), Shimadzu Corporation, Kyoto, Japan) equipped with a refractive index detector (refractive index detector [RID-10A], Shimadzu Corporation, Kyoto, Japan) and a Rezex Monosaccharide column (300 × 7.8 mm) (8-micron pore size; Phenomenex®, Torrance, CA, USA). The total soluble sugar content in the shoots was compared with authentic sugar standards and expressed as mg/g dry sample.

2.10. Estimation of Nitrogen Fixation

Four plants were carefully dug up from each plot in all four replicate plots at 150; 240, and 330 days after planting (d.a.p.). The shoots were oven-dried (50 °C), weighed, and finely ground (0.045 mm sieve) for 15N analyses. Non-legume species growing as weeds were sampled as reference plants for determining L. frutescens uptake from the soil. The reference plants (e.g., Moringa oleifera, Artemisia afra, Zingiber officinale, and Ipomoea batatas) were similarly processed as described for L. frutescens.

2.11. Measuring 15N/14N Ratios, %Ndfa, and N-fixed

Aliquots of approximately 1.0 to 1.1 milligrams were weighed into tin capsules that were washed with toluene. Treatment samples and reference plants were run in duplicate, and their means were calculated. The isotopic analysis was done on a Flash EA 1112 Series coupled to a Delta V Plus stable light isotope ratio mass spectrometer via a ConFlo IV system (all equipment supplied by Thermo Fischer, Bremen, Germany), housed at the Stable Isotope Laboratory, Mammal Research Institute, University of Pretoria (South Africa). A laboratory running standard (Merck Gel: δ15N = 6.8‰, C% = 43.83, N% = 14.64) and blank samples were run after every 12 samples of L. frutescens. All results are referenced to Vienna Pee-Dee Belemnite for carbon isotope values and air for nitrogen isotope values. Results are expressed in delta notation using a per mille scale using the standard equation:
δ 15 N ( o o o ) = [ 15 N / 14 N ] sample [ 15 N / 14 N ] atm [ 15 N / 14 N ] atm × 1000

2.11.1. Nitrogen Content

The N content of the plant samples was determined as the product of %N and sample weight.

2.11.2. Percent N Derived from Atmospheric Fixation (%Ndfa)

The proportion of N derived from N2 fixation was calculated as described by the formula [32].
0 0 Ndfa = δ 15 N ref δ 15 N leg δ 15 N ref B × 100
δ15Nref is the 15N natural abundance of reference plants, δ15Nleg is the 15N natural abundance of legume, and B represents the δ15N of legume plants relying entirely on symbiotic N2 fixation for their N nutrition. The B value incorporates the isotopic fractionation associated with nitrogenase activity during N2 fixation and replaces the value of atmospheric N2 [32]. The amount of N-fixed was calculated as the product of %Ndfa and legume organ N.
According to Shearer and Kohl [33], the amount of N-fixed was calculated as
N-fixed = %Ndfa × legume biomass N,
where legume biomass N was the N content of L. frutescens.

2.12. Statistical Analysis

Although the study was conducted in two cropping seasons (2014/2015 and 2015/2016), the interaction between the two seasons for all parameters (including at different days after planting) were not significantly different at (p < 0.05). The data was, therefore, pooled and subjected to statistical analysis. Data on carbon source utilization were subjected to non-parametric statistical analyses using GenStat software 17.1 editions (VSN International, Hemel Hempstead, UK). Soil microbial diversity and activities were statistically analyzed using Principal Component Analysis (PCA) and cluster analyses (vertical hierarchical tree plots). Dry matter yield and symbiotic parameters such as δ15N, %Ndfa, and N-fixed were analyzed using One-Way ANOVA to compare treatment performance. Means separation between treatments was performed using Fisher Least Significant Difference (LSD) at p ≤ 0.05.

3. Results

3.1. Total Phenolics and Flavonoids

Total phenolics and flavonoids were influenced by rhizobium inoculation and harvesting period (p ≤ 0.05). The application of rhizobium inoculation increased the production of total phenolics and flavonoids contents in the shoots of L. frutescens (Table 2). The phenolics content ranged from 31.08 ± 0.54 to 88.77 ± 5.40 mg GAE/g for 0 and 200 g of rhizobium per 100 kg of seeds, respectively, representing two-fold variation (Table 2).

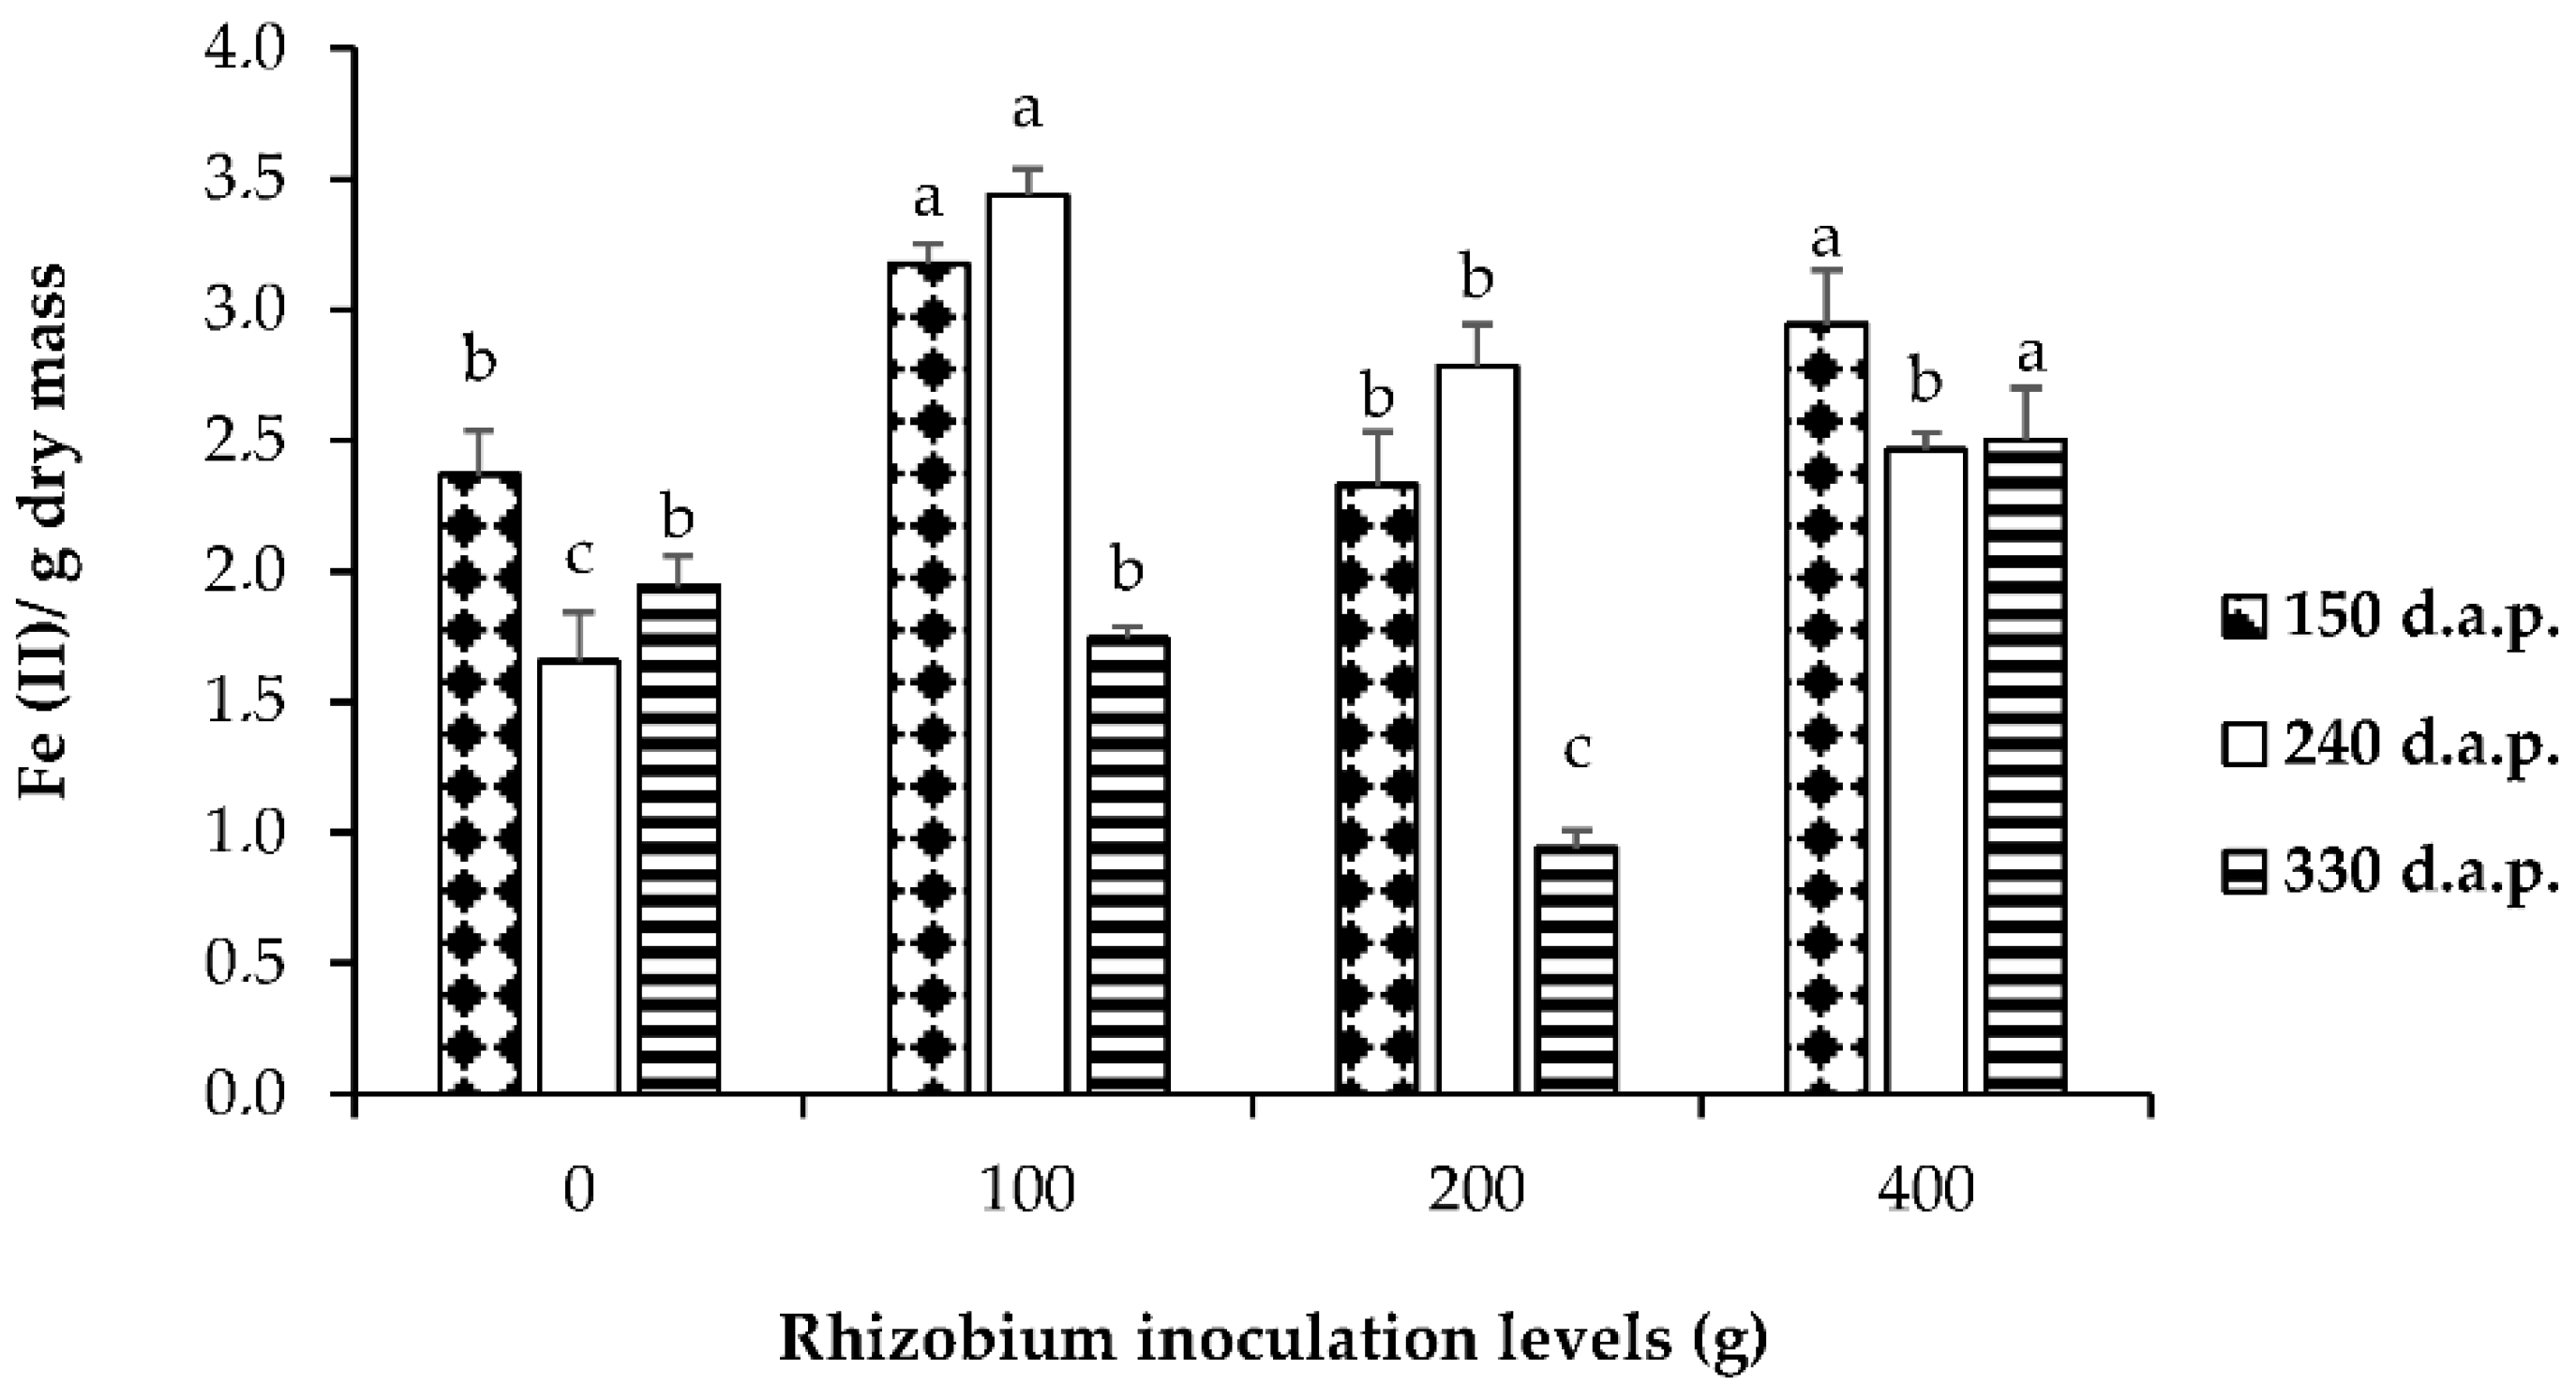
3.2. Ferric Reducing Antioxidant Power (FRAP) Assay
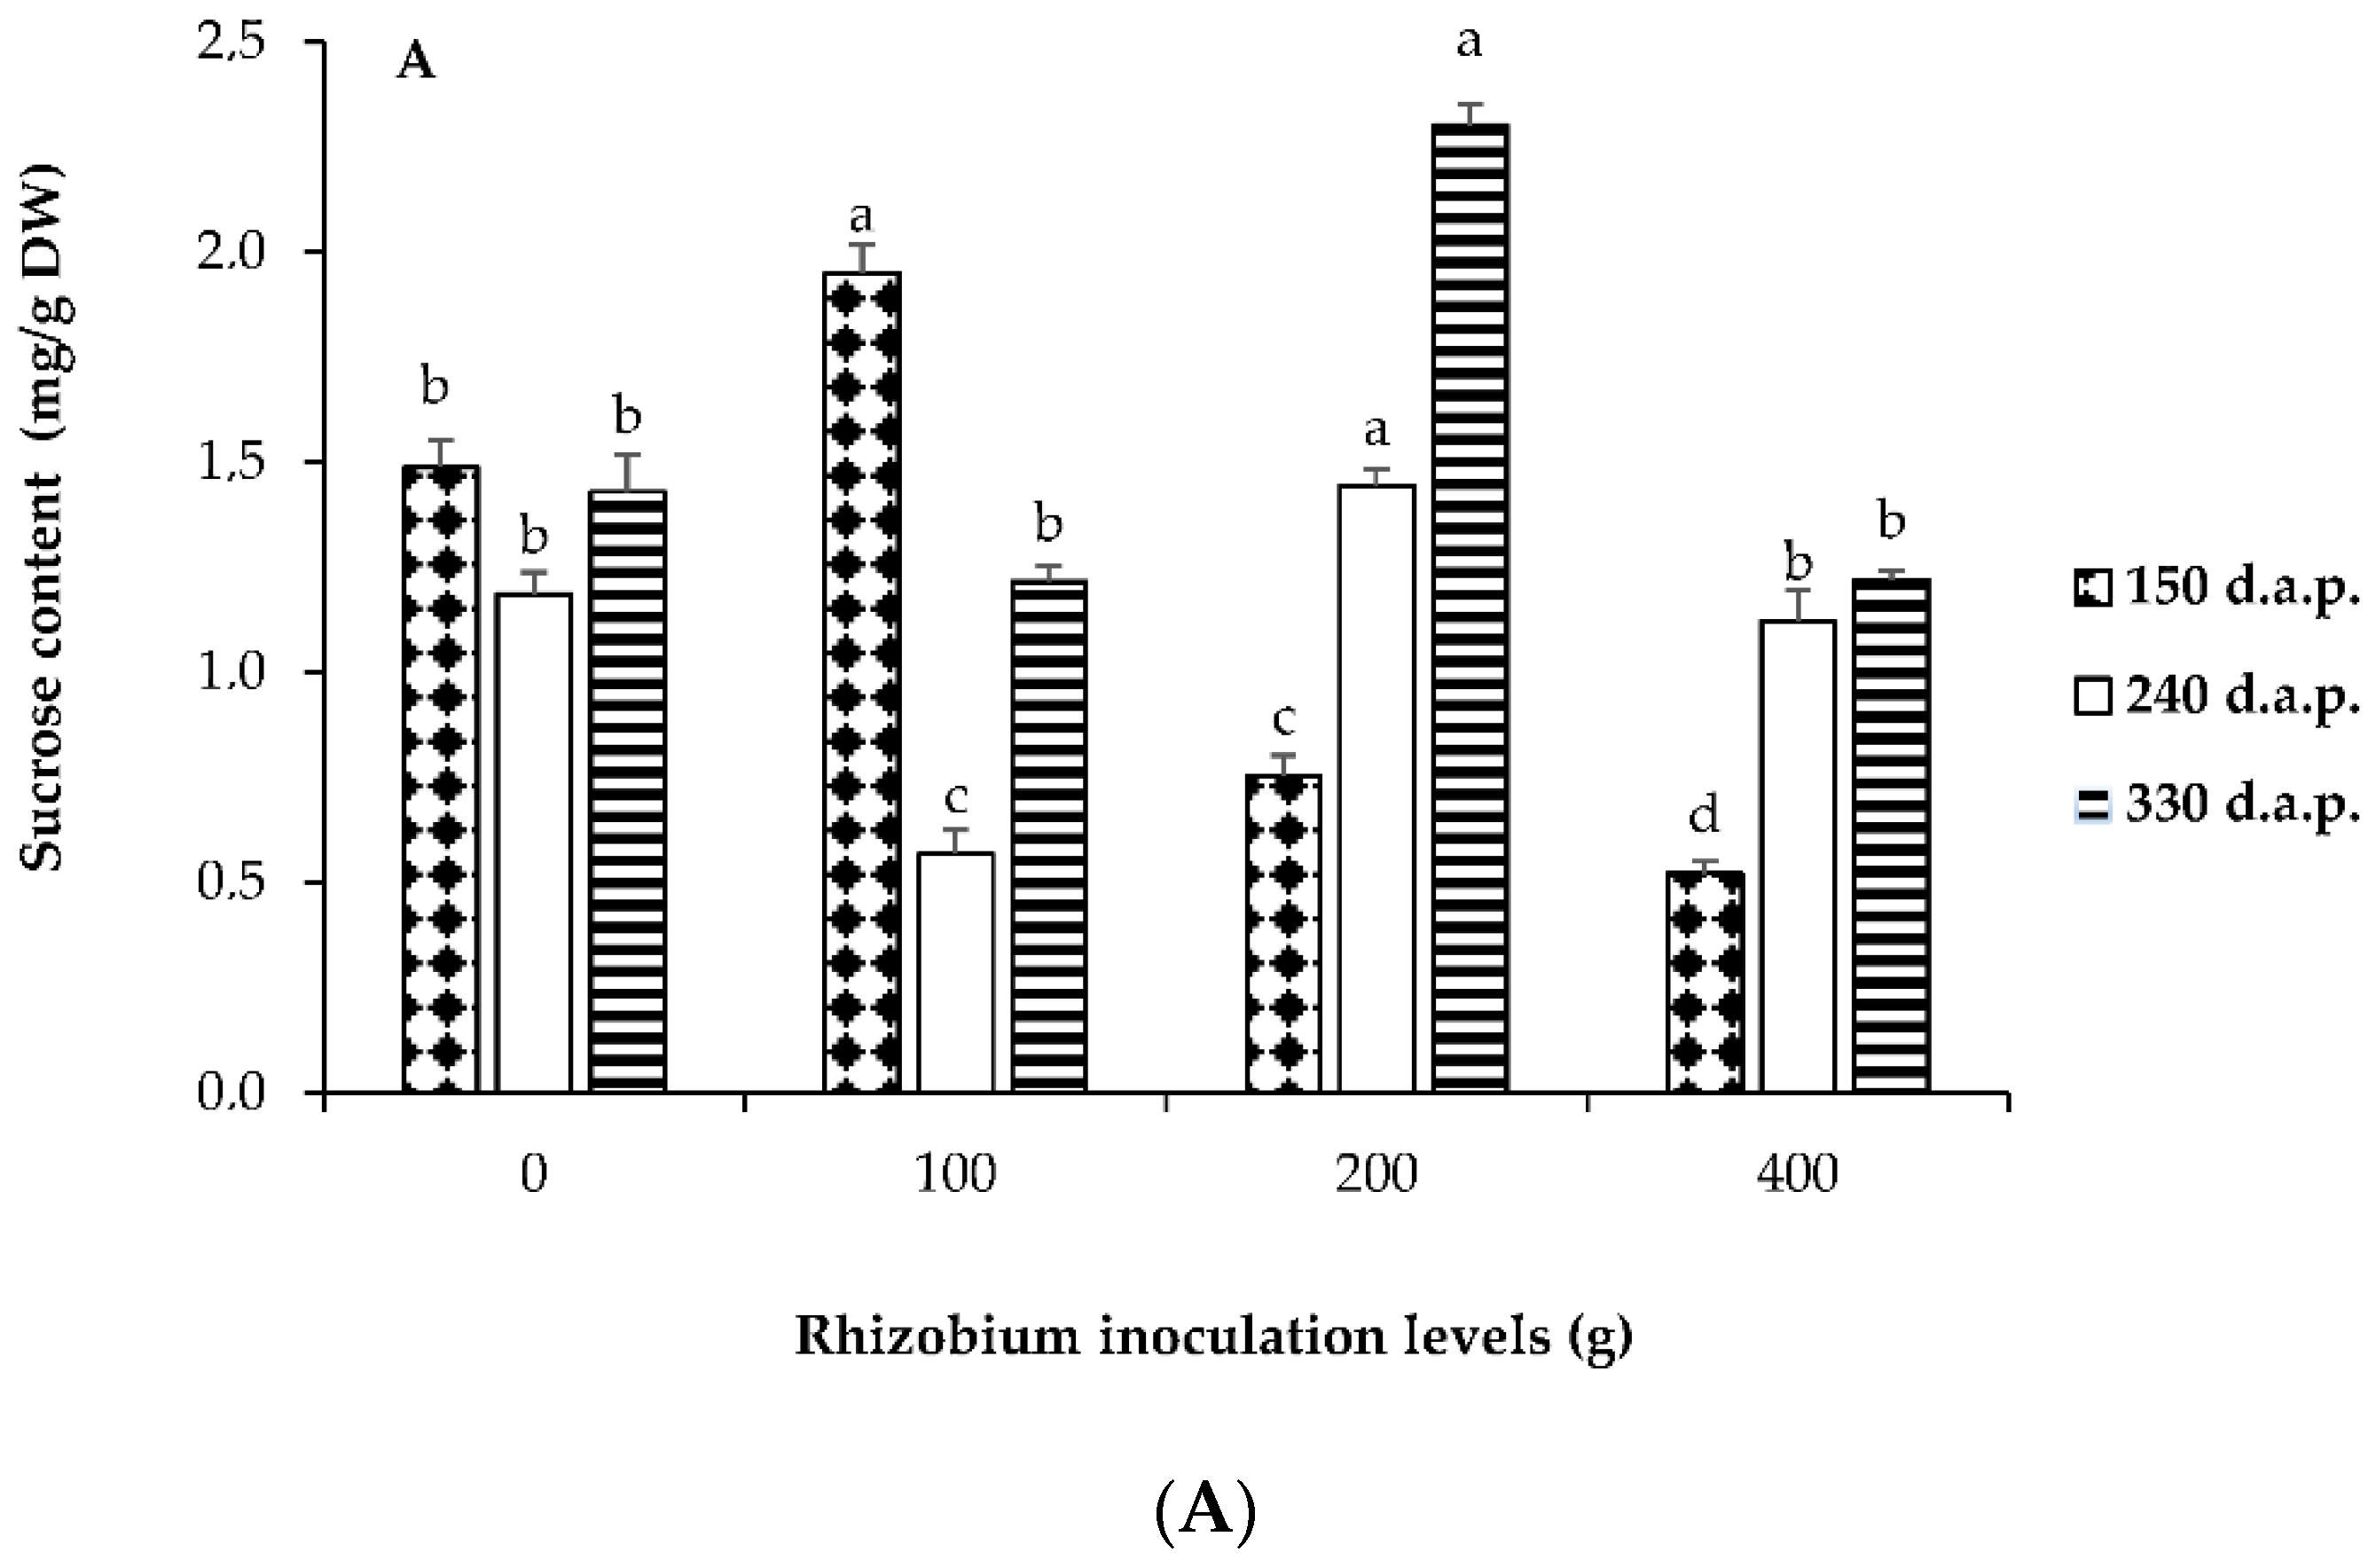
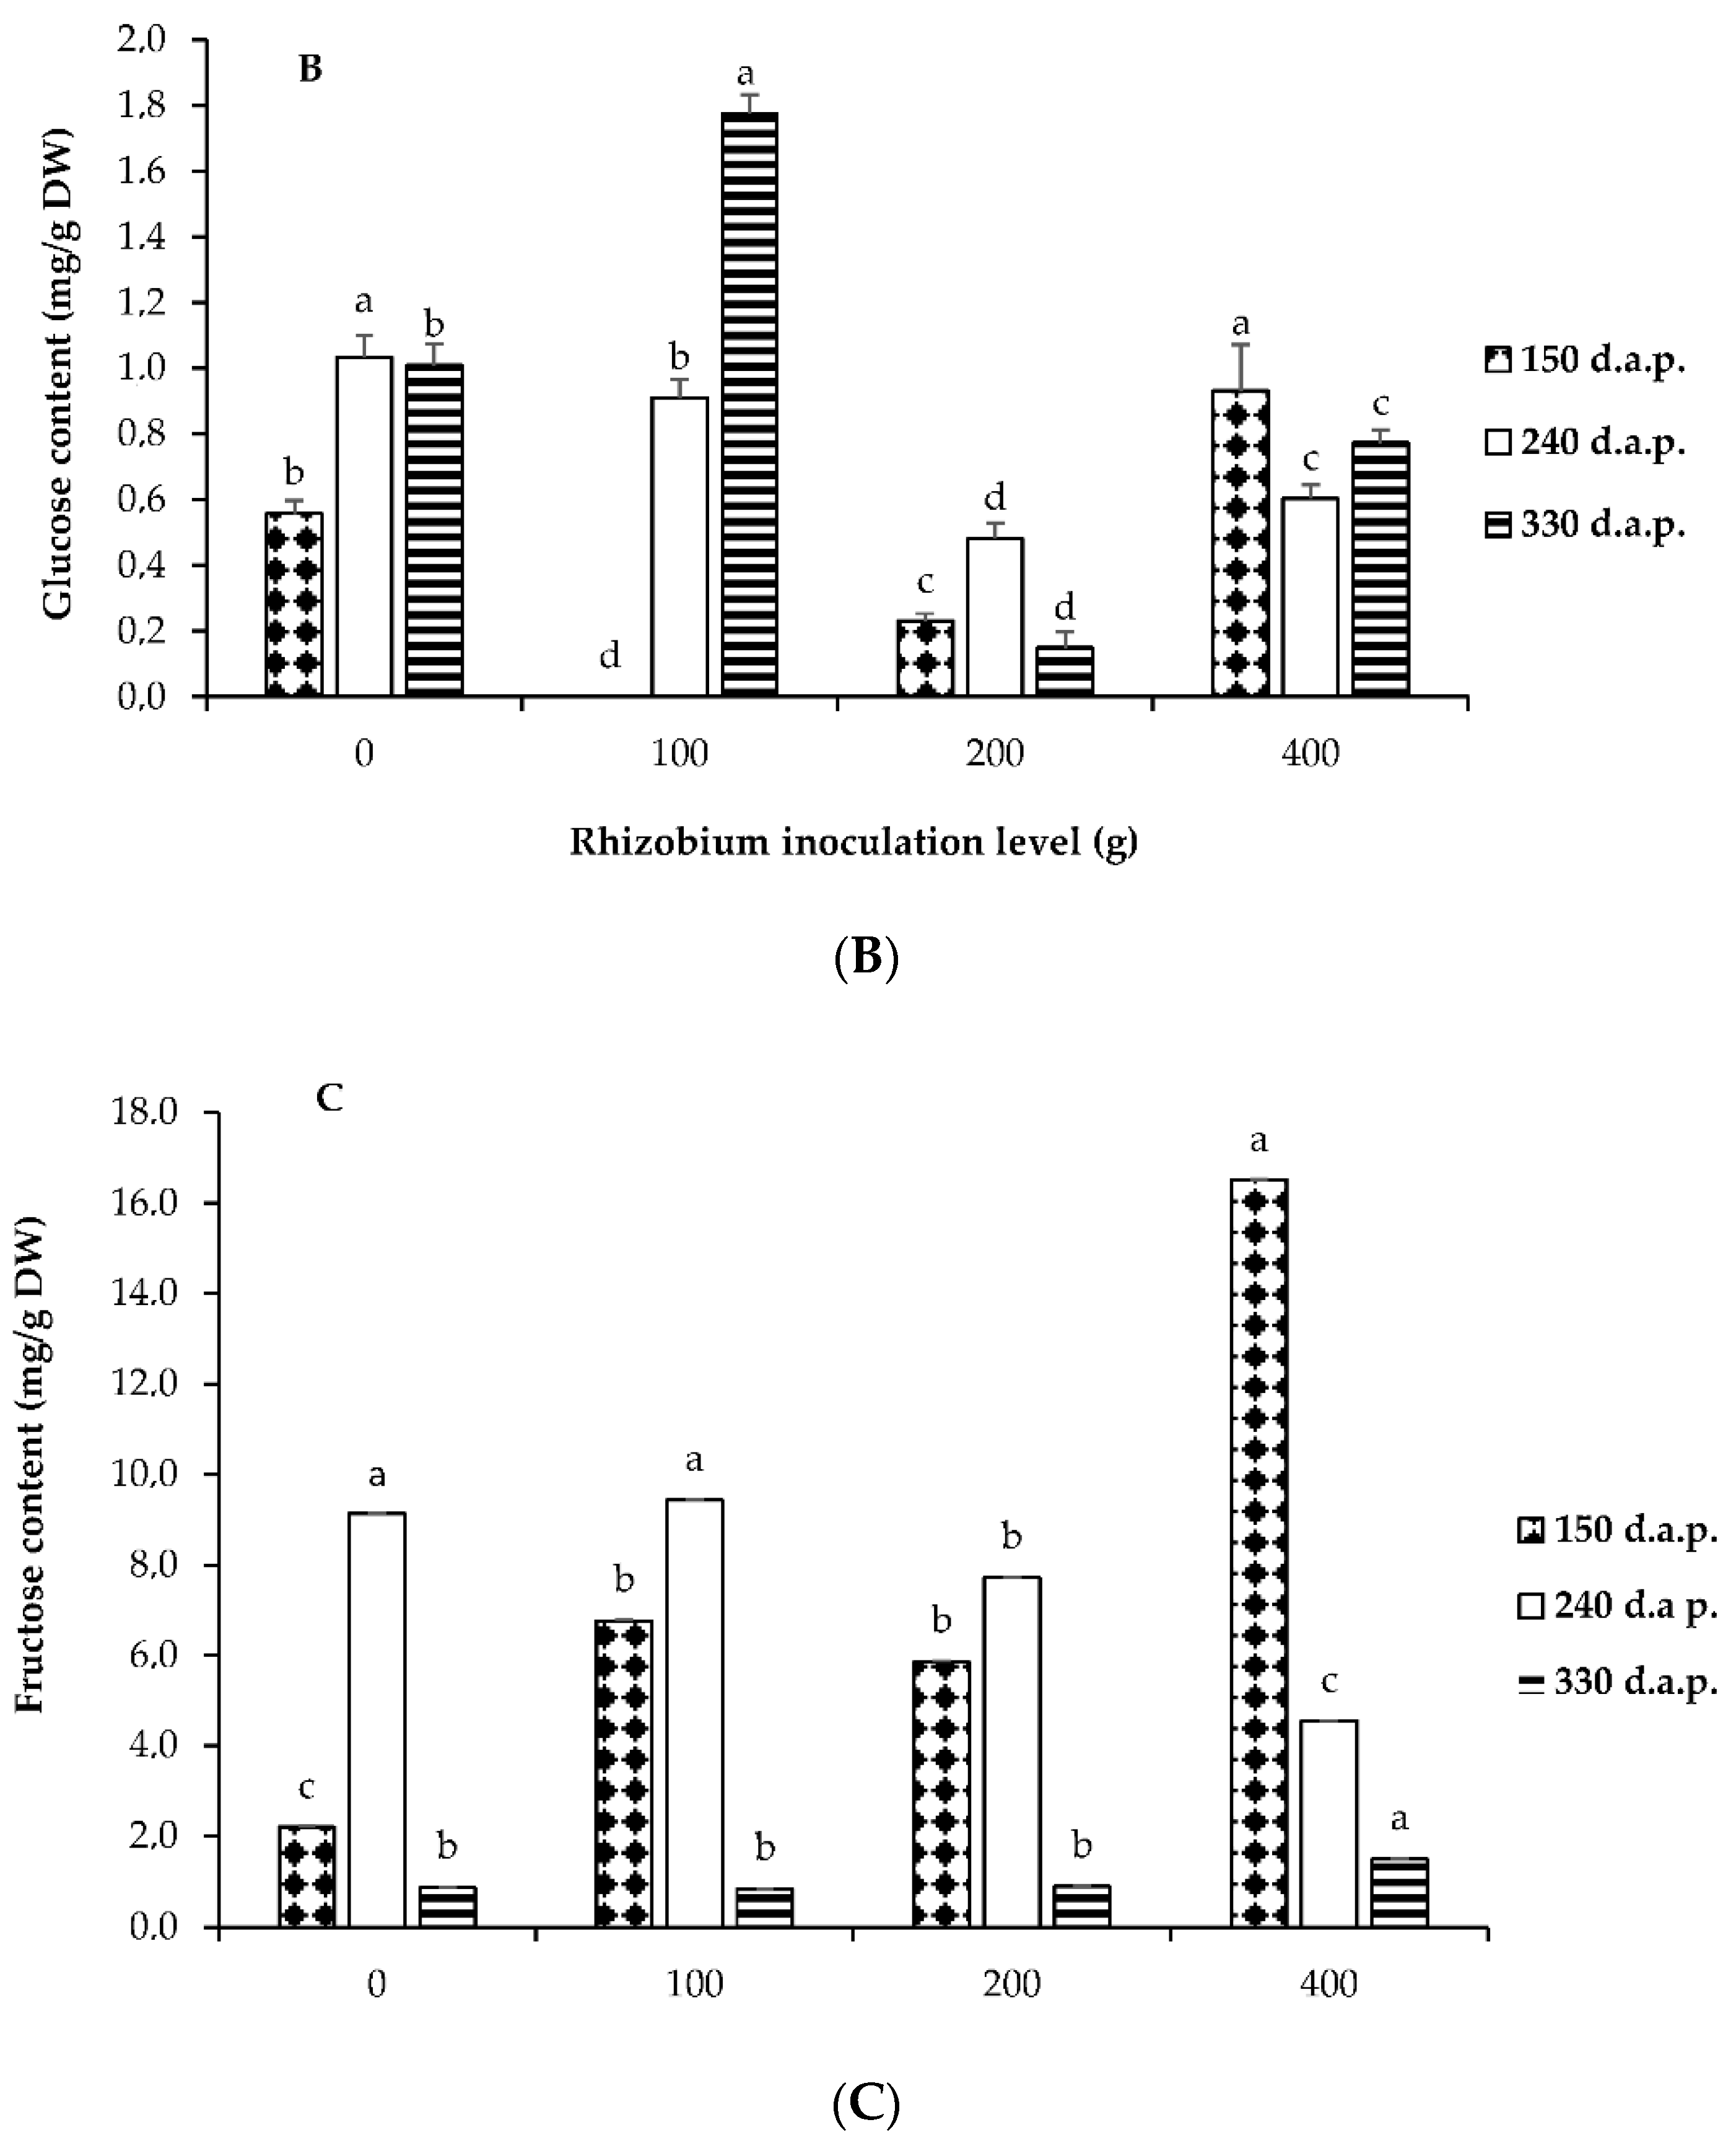
Antioxidant capacity of extracts was determined using ferric, reducing antioxidant power assay (FRAP). The results for shoots of L. frutescens showed a significant difference (p ≤ 0.05) among four levels of rhizobium inoculation and different days after planting (Figure 1). The FRAP values for the investigated shoots of L. frutescens were highest with 100 g rhizobium inoculation at 240 d.a.p. (Figure 1). Increased antioxidant activity in shoots of L. frutescens can be associated with the defense mechanism in response to higher levels of rhizobium inoculation.

3.3. Soluble Sugars

Levels of rhizobium inoculation and days influenced the accumulations of soluble sugars after planting (p ≤ 0.05). Water-soluble carbohydrates (WSC) such as glucose, sucrose, and fructose are essential active substances in plant physiological metabolism. In this study, as the rhizobium inoculation level increased, the concentration of fructose at 150 d.a.p. increased (Figure 2C).

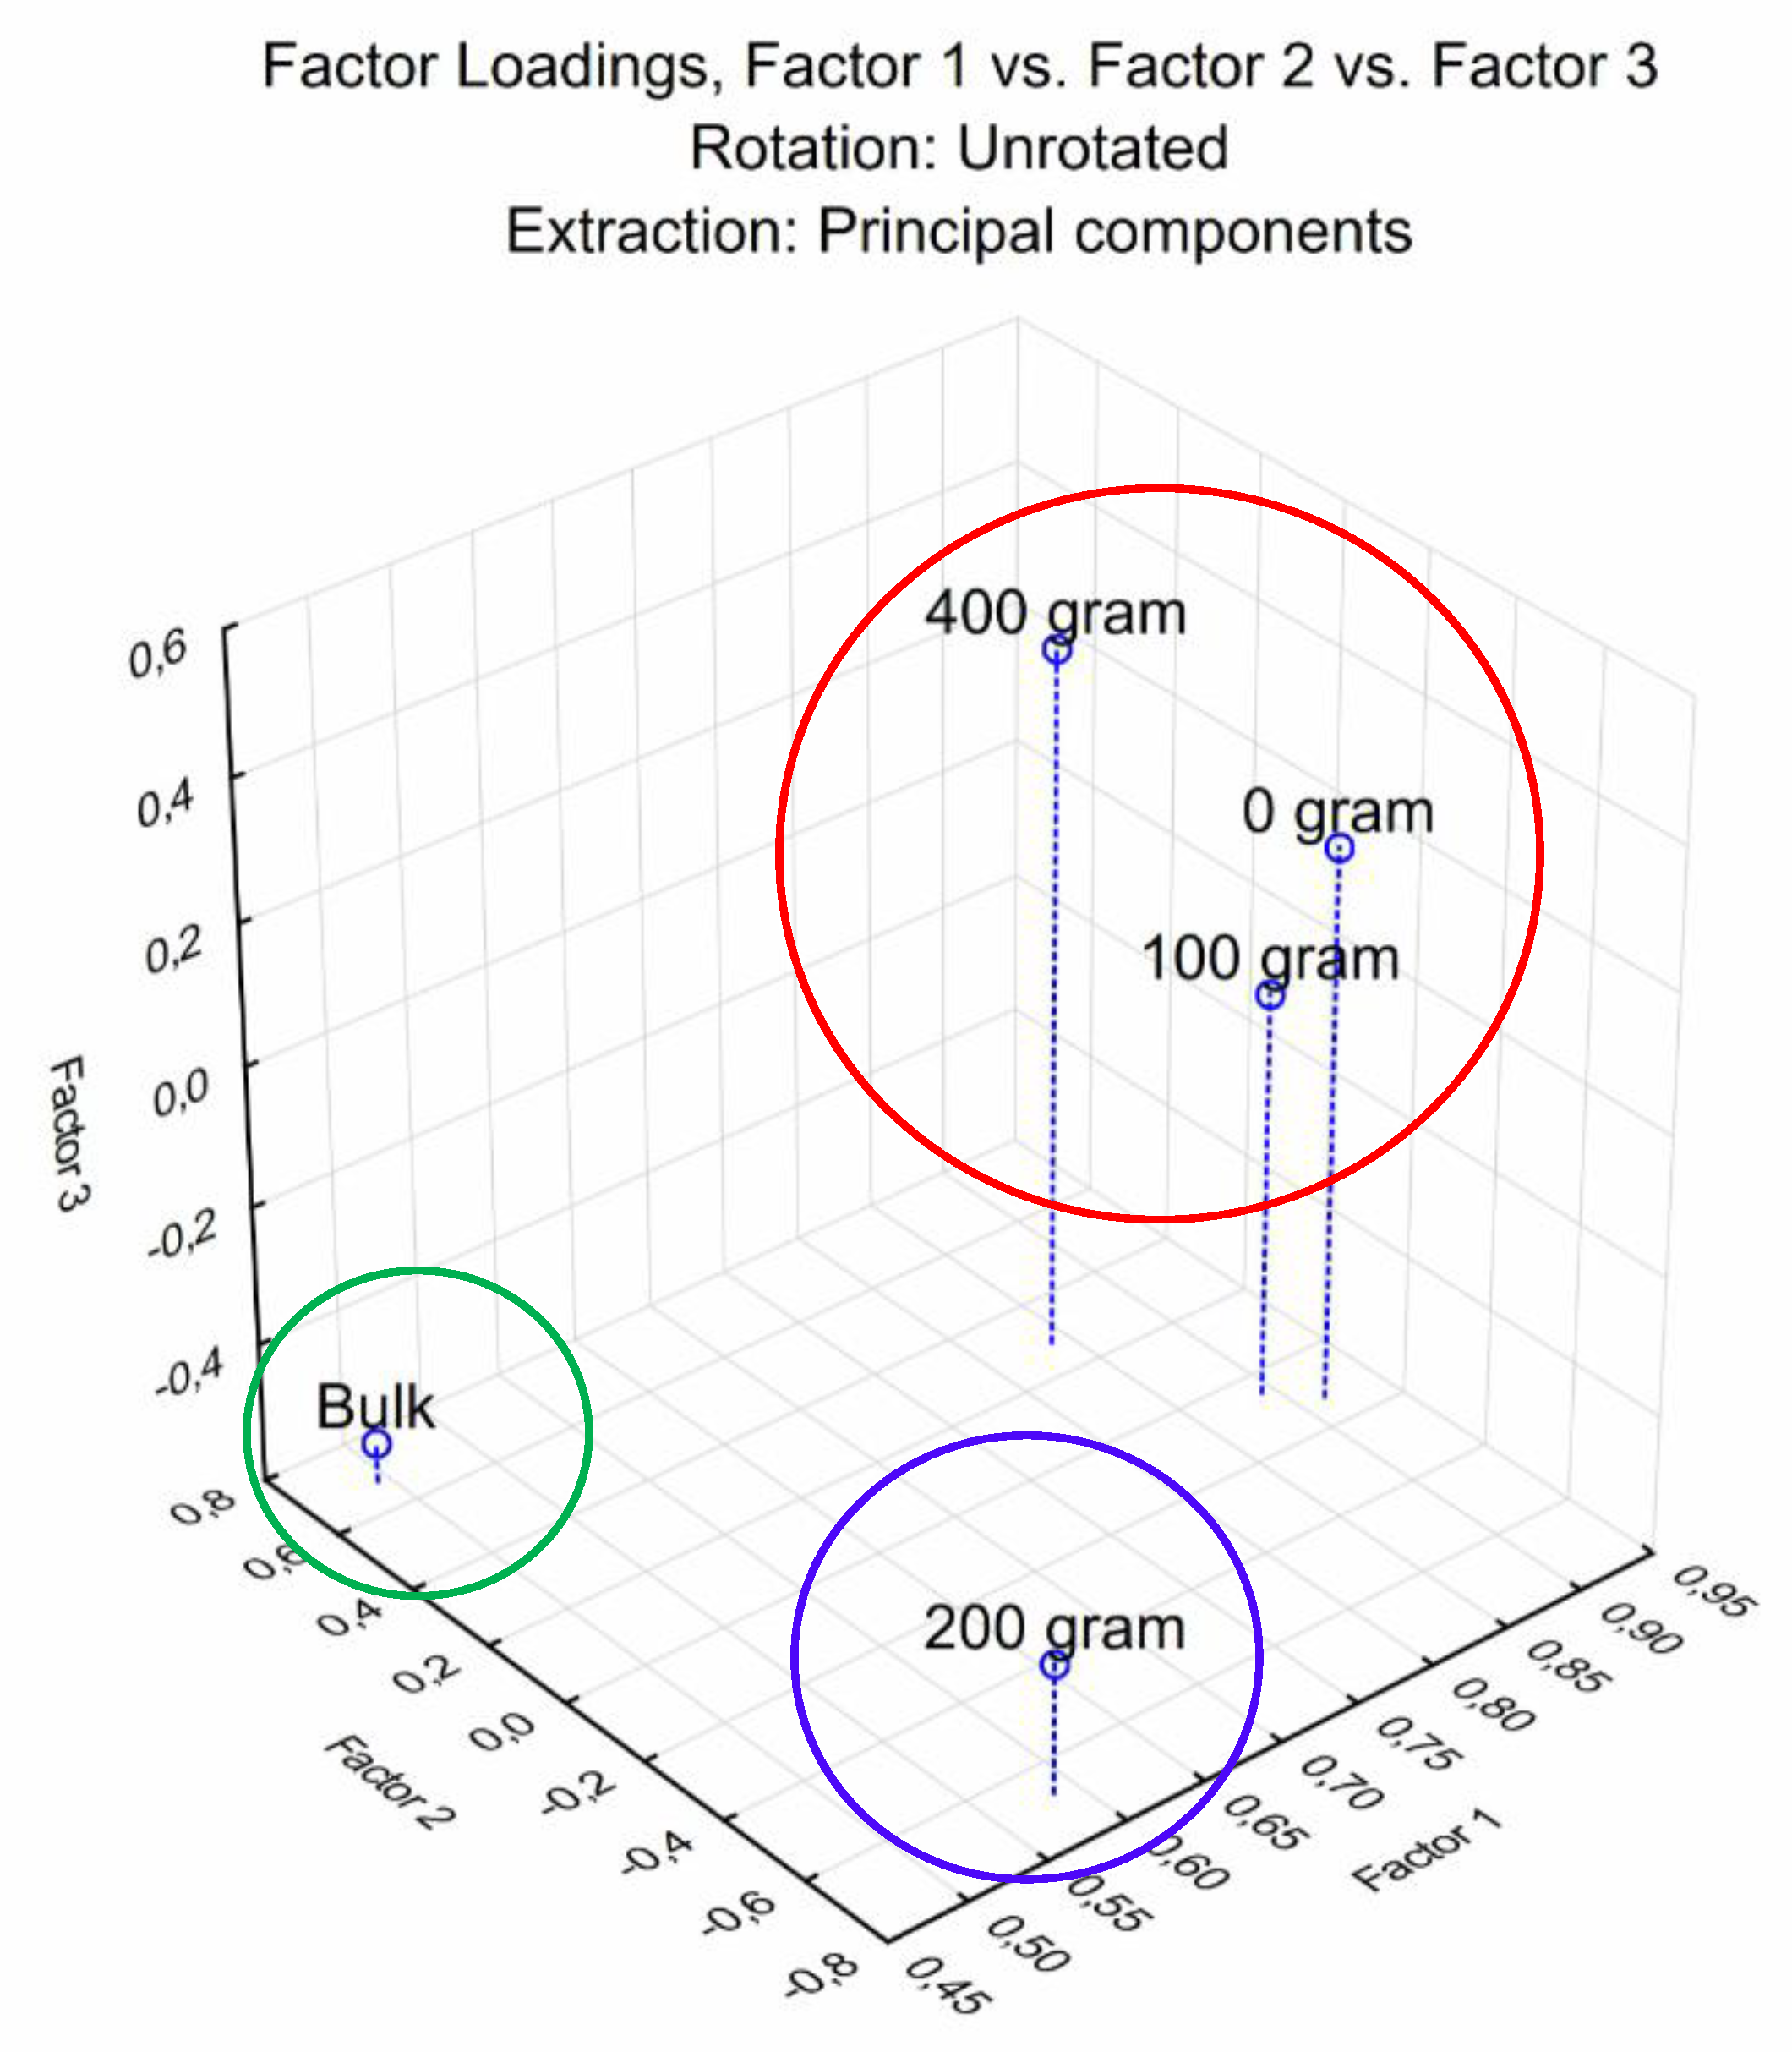
3.4. Carbon Substrate Utilization Profiles (CSUP)

The mechanism of color development in Biolog EcoPlates is associated with variations in carbon source utilization (CSU) is related to the number of viable microorganisms that can utilize the substrates inside the wells of the EcoPlate as a single carbon source. Differences in active bacterial functional diversity are illustrated using principal component analysis (PCA) in Figure 3, representing the average CSUP of the soil microbial populations present in treatment plots.
Cluster analysis was performed as an alternative measure to visualize the groups illustrated in Figure 4. The dendrogram was constructed to assign treatments into groups. Treatments in the same cluster are similar to each other than treatments in other clusters, as illustrated by the dendrogram in Figure 4.

3.5. Diversity Indices of Sampled Soil of L. frutescens and Bulk Soil

The Shannon–Weaver diversity index was used to quantify the functional diversity of soil microbial populations and is based on the number of different carbon sources utilized by soil microbial populations in Biolog EcoPlatesTM, i.e., comparable to species richness in the soil. The values of the index typically range between 1.5 and 3.5 but rarely increase above 4.5. Depending on the plots sampled, varying percentages of carbon sources were utilized, with values ranging from 1.88 to 2.33, as seen in Table 3.
Conversely, the evenness index is used as an indicator of how abundant species are within a soil microbial community, i.e., how close in “numbers” each microbial species is in a soil microbial community. If abundances of different species in a community are measured, it will invariably be found that some species are scarce, whereas others are more abundant. Substrate evenness assumes a value between 0 and 1, with 1 representing a situation in which all species are equally abundant within a microbial population present in the samples. This means less variation in microbial communities between species, thus, less dominance and higher diversity. Substrate evenness indices obtained in this analysis ranged between 0.67 and 0.79, as seen in Table 4.

3.6. Soil Microbial Enzymatic Activity, viz. Microbial Activity

Three soil microbial enzymes′ activities were analyzed in this study for ß-glucosidase, alkaline phosphatase, acid phosphatase, and urease (Table 5). Results are presented to determine the potential of a soil to degrade or convert substrates from an organic form into plant-available nutrients. The higher the microbial activity, the faster the nutrients released from organic substrates will be made available to be taken up by the plant.

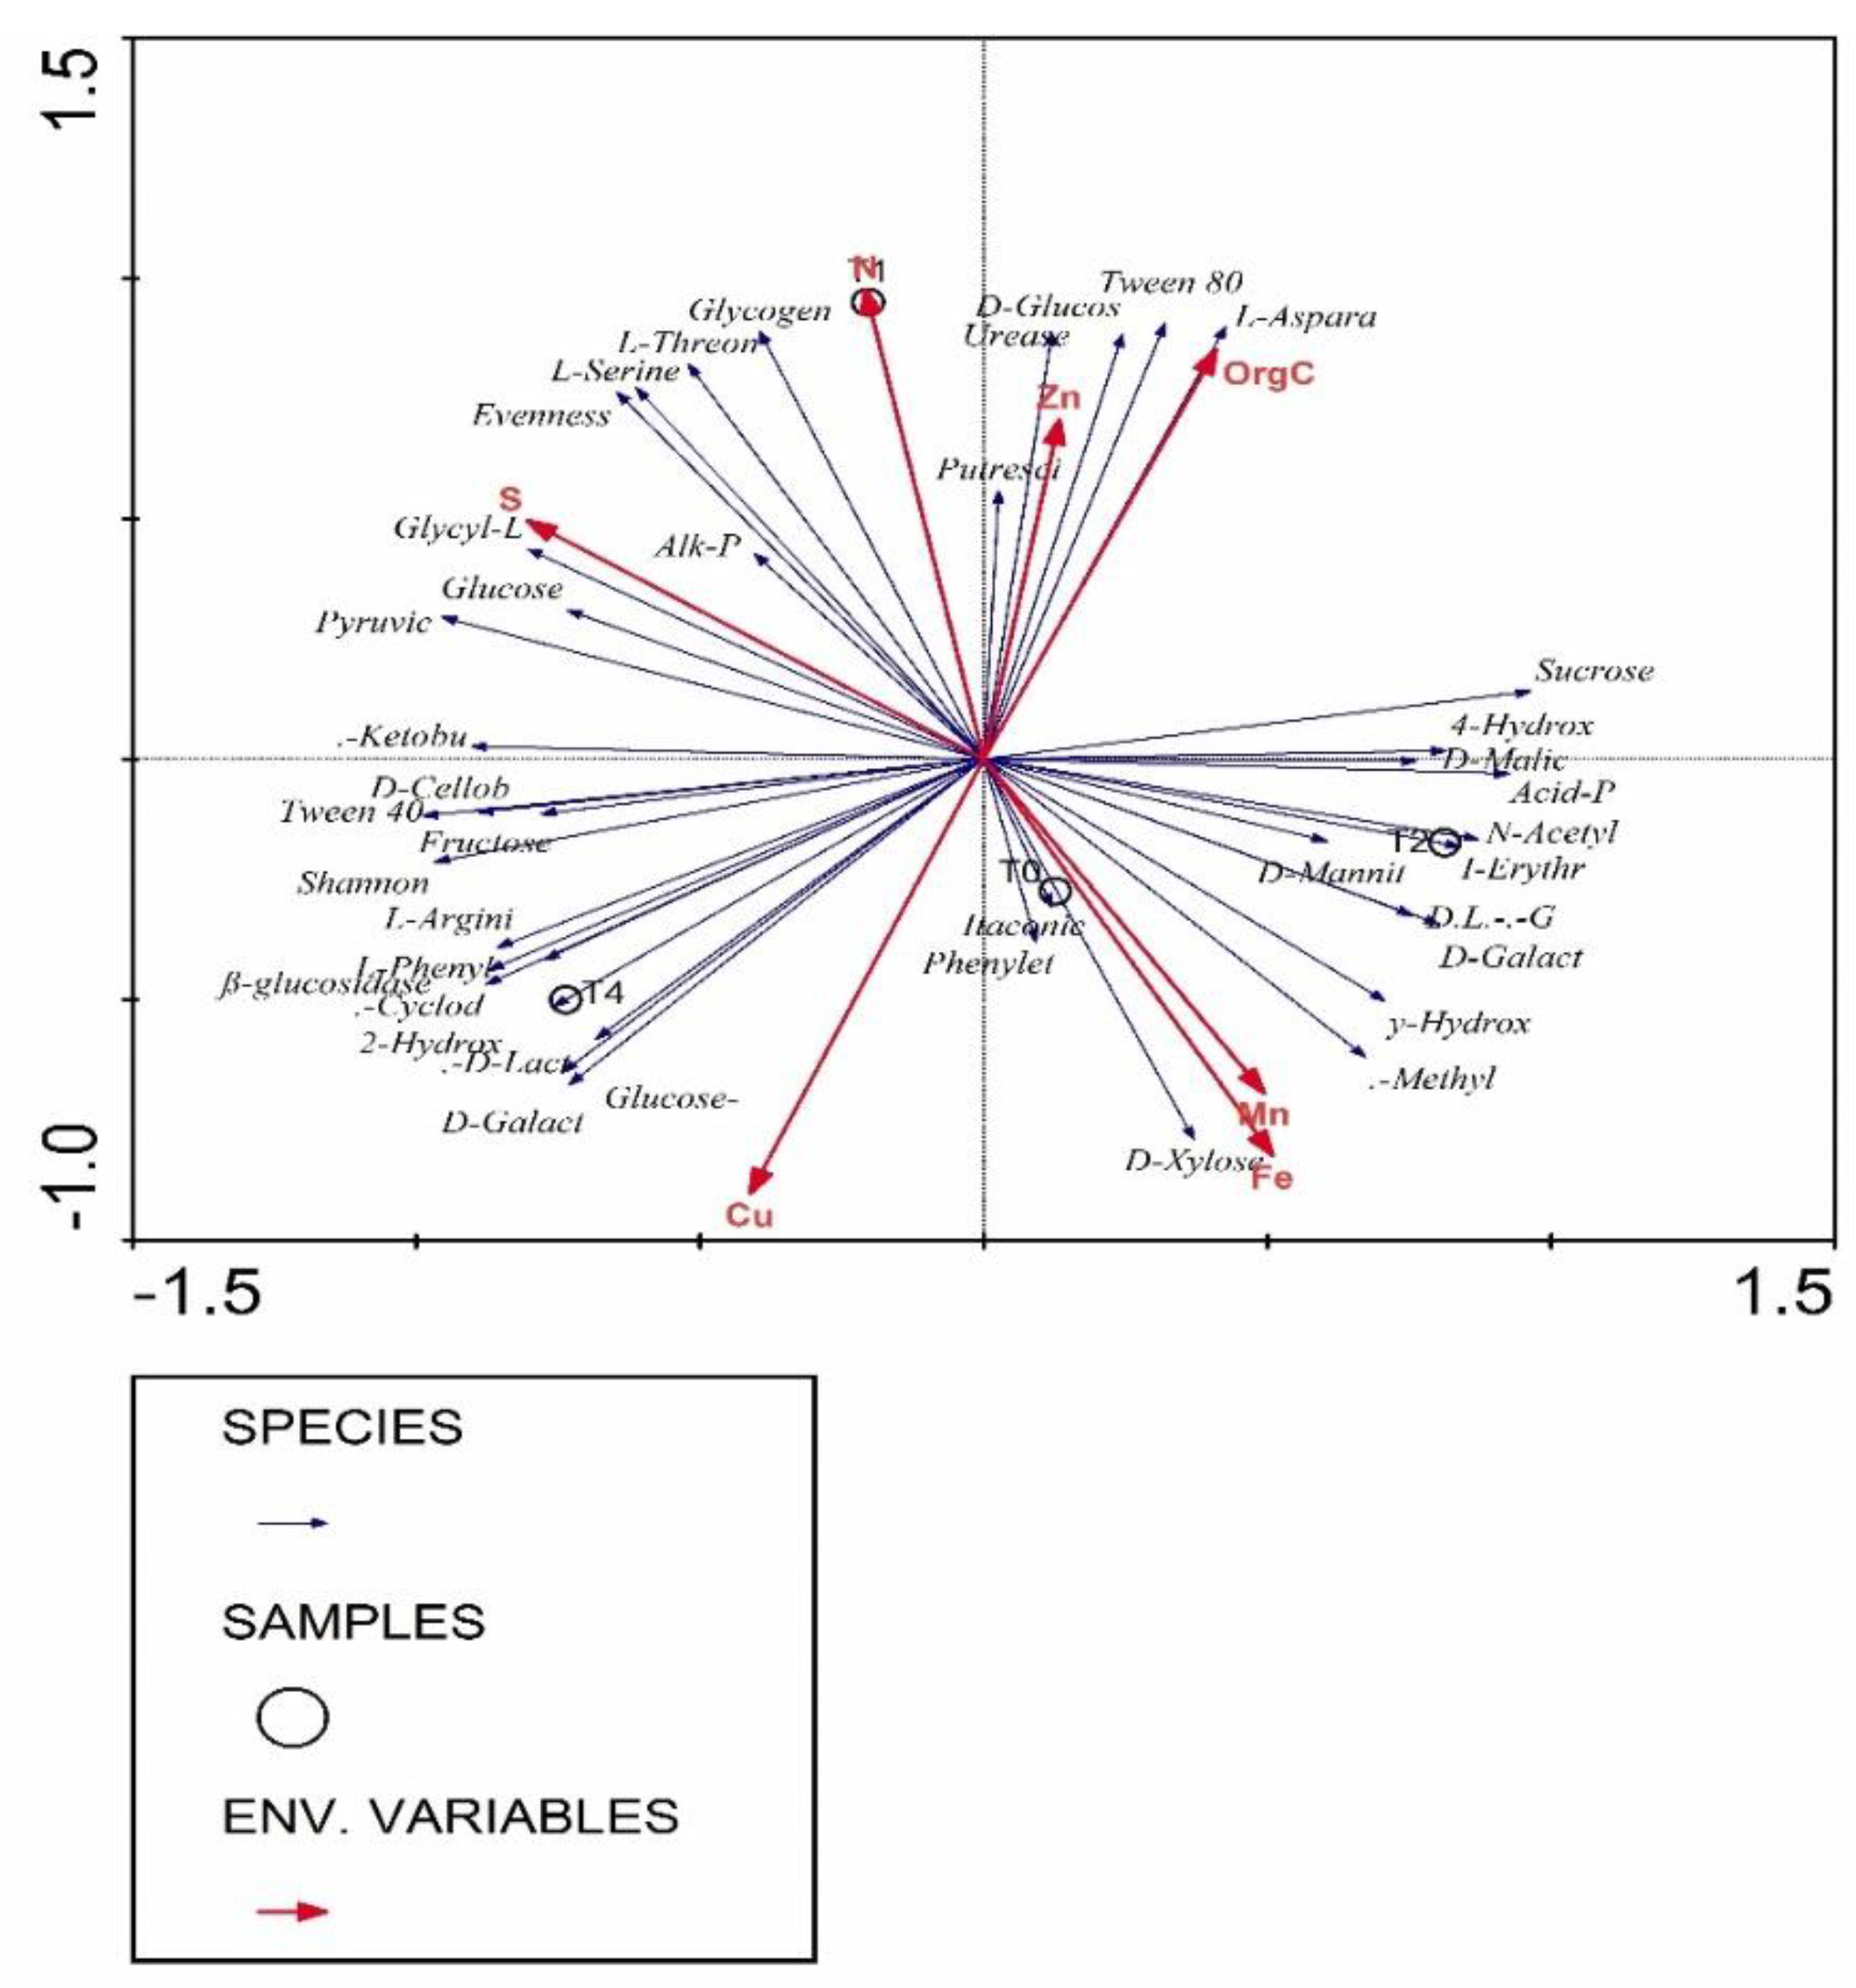
3.7. Correlation Analysis of Parameters Using Redundancy Analysis (RDA)

There are indications that plant species influence soil microbial communities with which L. frutescens was the case in this regard and has shown the influence in soil microbial communities. This agrees with the suggestion by Mitchell et al. [34] that plant community composition should be a good predictor of below-ground community composition due to its integration with environmental variables and influences soil organisms through the production of litter and exudates. Redundancy analysis (RDA) was applied to elucidate the relationships among total amino sugar, rhizobium inoculation treatments, and environmental variables such as soil chemical properties including organic C, N, Zn, S, Cu, Fe, and Mn (Figure 5). The ordination biplot from RDA was clearly distinguished among the four rhizobium inoculation treatments. The RDA ordinations revealed that variations in soil amino sugars were firmly related to rhizobium inoculation treatments and environmental variables.

3.8. Comparing Plant Growth and Symbiotic N Fixation in Response to Rhizobium Inoculation

One-way ANOVA analysis involving the four levels of rhizobium inoculation (T0 = control (no rhizobium), T1 = 100, T2 = 200 and T4 = 400 g of rhizobium per 100 kg of seeds) and days after planting revealed differences in plant growth, N content, %N and symbiotic performance (Table 6). The highest level of rhizobium inoculation (400 g per 100 kg of seeds) showed the highest plant growth, N content %N and 15N at 150 d.a.p. (Table 6). The δ15N values of L. frutescens showed the highest δ15N for some rhizobium inoculation treatments, indicating the lowest %Ndfa values, which translates to low N-fixation. The highest N fixer was observed under 240 d.a.p. with the application of 200 g of rhizobium per 100 kg of seeds (Table 6). Only two treatments (100 and 200 g of rhizobium per 100 kg of seeds) under 240 d.a.p. obtained over 50% of their N nutrition from symbiotic fixation compared to other treatments (Table 6). The treatments (100 and 200 g of rhizobium per 100 kg of seeds) that fixed the most N produced much greater biomass, while treatments which fixed the lowest N had the least biomass (Table 6). Amongst all the treatments, only 200 g of rhizobium per 100 kg of seeds fixed more than 100 kg/ha and showed the greatest dry matter yield.

4. Discussion

Total phenolic content ranged from 31.08 ± 0.54 mg GAE/g with no inoculation to 88.77 ± 5.40 mg GAE/g with the application of 200 g rhizobium for 150 and 240 days after planting (d.a.p), respectively (Table 2). The results did not show any significant variations between four rhizobium inoculation levels applied at 150 d.a.p. (Table 2). Although earlier findings had indicated that phenolic compounds and antioxidants are more responsive to environmental factors such as light, quality, moisture content, and temperature [35], in this study, however, the total phenolic content varied depending on the growth period and rhizobium inoculation applied (Table 2). The increase in total phenolic content observed in this study in response to inoculation has been reported in other studies. Tagetes minuta inoculated with P. fluorescens WCS417r and Azospirillum brasilense was 2-fold higher than the control treatments [36]. The inoculation of Eucalyptus with Streptomyces increased total phenolic content in leaves [37]. Increased application of rhizobium inoculant greater than 200 g resulted in a decrease of total phenolics contents (Table 2). An increase in total phenolics in response to different inoculants was also reported in varying legume species [38,39]. The increased levels of total phenols among plants with inoculant application could be associated with the plant′s interaction and the inoculum. Also, phenolic compounds are good agents that fight against microorganisms by aligning plants′ plant cells [40].
On the contrary, Vurukonda et al. [41] recommend that plants form associations with varying microbes for identification and characterization of biofertilizer and biocontrol tools. Previous studies on L. pumila in response to varying nitrogen fertilization have shown that high nitrogen can reduce the production of secondary metabolites [42]. The inoculation of soybean (Glycine max) with Bradyrhizobium japonicum sv glycinearum increased the phenolic compounds and the organic acids in leaves [20]. Following previous analyses for different plant species, phenolics levels varied in response to various plant growth-promoting bacteria (PGPB) [43,44,45]. Total phenolic content in leaves and flower heads of Cynara cardunculus increased significantly with the inoculation of Glomus intraradices and G. mosseae [44].
The flavonoid content of L. frutescens samples harvested at three different growth periods and inoculated with four levels of rhizobium inoculum is presented in Table 2. The flavonoid content ranged from a low 0.19 ± 0.04 mg QE/g with the application of 400 g rhizobium inoculation to 1.74 ± 0.12 mg QE/g with 200 g rhizobium inoculation at 150 and 240 d.a.p. respectively. The highest flavonoid content observed at 240 and 330 d.a.p. suggests harvesting L. frutescens shoots for flavonoid content later during growth (Table 2). The arbuscular mycorrhiza (AM) fungi colonization induced flavonoid content in white clover, Bupleurum chinense, and Trifolium repens [44]. Similarly, [45] reported the highest flavonoids in V. tricolor shoots in response to inoculation. It has also been demonstrated that plant flavonoids act as growth regulators of rhizobia [46,47]. Phillips and Tsai [48] suggest that the high levels of flavonoids could be associated with their widespread and involvement in plant-microbe interactions. In other studies, the highest amounts of flavonoids are released near the root tips and emerging root hair zone, which is the site for rhizobium inoculation [49]. This indicates that the flavonoid content may vary from one plant part to another when exposed to various factors [50]. Inoculation with 100 g rhizobium suggests its ability to enhance the flavonoid content profile of L. frutescens, and such variations require the interaction to be compatible.
The results showed variations in FRAP values in response to days after planting with 200 g of rhizobium inoculation at 330 d.a.p. showing the lowest FRAP values (Figure 1). Invariably, higher FRAP values indicating the potential of antioxidant activity were recorded for all levels of rhizobium inoculation at 150 d.a.p. The higher FRAP values for shoots of L. frutescens following correspond well with the report of increased production of phytochemicals due to exposure to varying sources [51]. The extracts displayed the highest antioxidant capacity, following 100 and 400 grams of rhizobium inoculum compared to different levels. Antioxidant activity in extracts L. frutescens was also reported to have potential in reducing free radicals and preventing the onset and progression of many human diseases [52]. A report by Veeru et al. [50] suggested that higher antioxidant activity of medicinal plant extracts can account for the higher content of phenolics, which are known to exhibit a positive relationship with antioxidant activity. The antioxidant properties of phenolic compounds play a significant role in the defense mechanism of biological systems [40].
The fructose concentration registered the lowest values at 330 d.a.p. irrespective of the inoculation level (Figure 2C). Although sucrose content was not observed in the highest amounts comparable to fructose (Figure 2A,C), the concentration improved across all inoculation levels and days after planting. The enhanced sucrose content at 330 d.a.p. in response to all inoculation levels compared to fructose can be associated with sucrose′s maturity and full functionality in plant organs and its signaling roles [53]. The sucrose concentration recorded the highest values at 330 d.a.p. with 100 g rhizobium inoculation (Figure 2A). At 150 d.a.p. with 100 g rhizobium inoculation, no glucose content was detected. This finding contradicts earlier reports which associated glucose with early organ growth and osmotic contribution [53,54]. Glucose content showed the lowest values with the application of 200 g rhizobium inoculation irrespective of the number of days after planting (Figure 2B). Our findings suggest that different rhizobium inoculation levels in response to the harvesting period can induce and enhance the biosynthesis of soluble sugars. This could indicate the improvement in the development of metabolic processes of soluble sugars under varying conditions.
The distribution throughout the graph (Figure 3) indicates the difference in carbon source utilization profiles between treatments. Figure 3 suggests the high CSU for treatment T0 (control = no rhizobium inoculation) compared to other treatments. The results revealed several groups: Group 1 (green circle) enclosing the bulk soil sample; Group 2 (blue circle) encompasses treatment T = 2 (200 g rhizobium inoculation) and Group 3 (red circle) enclosing treatments T = 0; T = 1 and T = 4. The dendrogram shown in Figure 4 indicated that the CSUP of soil microbial populations found in Group 1 (green block) clustered to the left, Group 2 (blue block) clustered in the middle, and Group 3 (red block) clustered to the right. Analysis of variance was performed on the soil microbial CSUP data to determine if statistically significant differences existed between the sampled treatments (Table 3). As demonstrated in Table 3, significant statistical differences exist between the CSUP of soil microbial populations present within treatments T = 2 and T = 4. Carbon source utilization profiles in T = 1 differed significantly between R1 and R2, R3, and R4, whereas CSUP in T = 2 differed substantially between R2, R4, and R1, R3.
To minimize variation, the averages of the replicates of the different treatments are represented in Table 3b. It is clear that CSUP in T = 0 and T = 4 differ significantly from T = 2, but not from T = 1 and the bulk soil sample. The (CSU) of T = 2 was similar to the bulk soil, which could be attributed to soil environmental factors. In the study, treatments were replicated four times, and for under the treatment T = 2, the soil pH was found to be strongly acidic (5.5) in two replications by the end of the experimental period, which resulted in 0.043 and 0.049 CSU in the two replications. This was similar to the undisturbed (bulk) soil where the soil pH was 5.8, and CSU was 0.294. The inoculum used in the study was legume rhizobia that prefer from neutral to alkaline soils pH (6.0–7.5). The finding is of significant agricultural and economic importance as much of legume crops are grown on low pH soils. Despite this, the precise mechanism by which low pH conditions inhibit nodule development remains poorly characterized [55]. In addition, the plants substantially determine nutrients released by decomposing plant material, and the composition of plant root exudates much determined by the plants [55,56]. The composition of the nutrients released through decomposition or the plant root exudates attracts microbial populations that are exceptionally well adapted to rapidly utilize the specific compounds, contributing to the difference in CSUP of soil microbial populations. This is proven in the dye grouping of particular plots in the dendrogram (Figure 4). Since most of the soil microbial activity is found around plant roots, it is not surprising that the “bulk” soil sample clustered separately from the other treatments. The dendrogram also indicates that carbon sources utilized by soil microbial populations present in treatments T = 0, T = 1, and T = 4 are more similar to each other than to carbon sources used by microbial communities present in treatment T = 2.
In the Shannon-Weaver index (Table 4), no statistically significant differences were detected between the numbers of active microbial species present in the different treatments. The numbers of dynamic soil microbial species were lowest in the bulk soil sample, whereas the highest numbers were found in T = 4. Soil microbial diversity is usually much higher in the region surrounding the plant roots due to different carbon sources secreted through the roots. The evenness index showed solid indications of the uneven abundance of certain soil microbial species within the microbial population, i.e., the high dominance of individual species in the various treatments. The microbial diversity (abundance) present in T = 2 was significantly lower than the microbial abundance found in T = 1. No significant difference could be observed regarding microbial abundance between the bulk soil sample and the rest of the treatments. The lowest microbial diversity was found under T = 2 and the bulk soil sample, indicating a higher presence of dominant species than the other treatments.
The investigation for soil microbial communities and functional diversities of cultivated L. frutescens was carried out during the growing season. The results were not significantly different in terms of enzymatic activities of L. frutescens under cultivation. Soil microbial populations differed among treatments. Biolog EcoPlatesTM showed significant differences between the treated samples. Soils generally showed a considerable difference with treatment variations in substrate utilization ability. Soils can utilize a wide range of substrates to differentiate profiles treatments associated with the agricultural system, given the differences in soil chemical properties [56]. Previous studies by Gomez et al. [57] showed differences in soil Biolog EcoPlate that involved variable land-use using similar analyses. Soil microbial biomass carbon is one of the vital microbial parameters used to evaluate ecosystem restoration programs′ success. The accumulation of nutrients, mainly carbon and soil organic matter, directly affect soil microbial communities [58,59]. The soil treatments displayed very similar substrate richness. This suggested that there could be differences between substrates, and those differences are in the level that they were used (i.e., the colour intensity in Biolog EcoPlatesTM). The EcoPlates do not probably represent a final and most optimal selection of the substrates for sensitive microbial communities [34,60].
The sampled plot′s soil population in the sampled plot′s soil population differed, although not statistically significant in their abilities and potential to convert Carbon, Phosphorus, and Nitrogen (Table 5). The ß-glucosidase activity was demonstrated with 200 grams of rhizobium inoculum applied and in the bulk soil. The lowest ß-glucosidase activity was shown in treatment two and the bulk soil sample, while treatment T = 2 and treatment T = 4 showed the smallest alkaline phosphatase activities. The results showed the lowest acid phosphatase for treatments T = 0, T = 1, and T = 4. Treatments T = 0 and T = 4 showed the lowest urease activities (Table 5).
On the other hand, treatments T = 0 and T = 4 demonstrated the highest ß-glucosidase activity and alkaline for bulk soil samples. The results also reported the most increased acid phosphatase and urease activities. There was little/no disturbance of soil in our study when the (bulk) was sampled, no disturbance throughout the planting seasons; hence, higher activities were observed for bulk soil than in other treatments. During the planting of L. frutescens, there was land preparation (conventional tillage). The topsoil (organic matter) was disturbed; even though inoculation was applied to enhance the soil microbial activity, the natural balance was disturbed as the organic matter is usually removed.
Soil microbial populations present in treatments T = 2 and T = 4 demonstrated the lowest overall enzyme activities, whereas the bulk soil′s highest activities were found. The previous report by Mitchell et al. [34] showed that plant community composition should be a good predictor of below-ground community composition due to its integration with environmental variables and influences soil organisms through exudates′ production. Also indicating the potential to decompose organic carbon and mineralize phosphorus and nitrogen into plant-available P and N, respectively. The high number of soil microbial species characterizes healthy soils with a high abundance, combined with high microbial activities, which implies that all the present microbial species interact.
The 15N natural abundance technique was used to evaluate N contribution by L. frutescens depending on four rhizobium inoculation levels at different harvesting periods. The relationship between fixed N and the dry matter performed relatively consistent at 150 d.a.p. and 240 d.a.p., but not at 330 d.a.p. (Table 6). Nitrogen fixation per plant reaches its maximal rate at about the time of flowering and declines at physiological maturity [61], hence the decreased N at 330 d.a.p. The δ15N values for all the treatments were very high, mostly indicating the reduced dependency on symbiotic N nutrition and much lower amounts of N-fixed per treatment (Table 6). The decrease in plant growth and symbiotic functioning in L. frutescens could be attributed to N inhibition of N2 fixation, as soil N concentration was 0.04% (Table 1). The reports by Gelfand and Robertson [61] and Unkovich et al. [32] indicated that the rate of biological nitrogen fixation is strongly influenced by the initial soil N content and declines with the increase in the availability of mineral N. The results showed that N2 fixation for most of the treatments was low attributed to the low nodule number and weight observed during the study. Hence the plant-derived more N from the soil than from symbiosis for some of the treatments. Although the findings reported low nitrogen fixation for different inoculation treatment and different days after planting, to our knowledge, the current findings are the first to report on the rhizobium inoculation of L. frutescens. The findings of the study indicate the need for further research to investigate the symbiotic partner associated with L. frutescens.

5. Conclusions

This study demonstrated that supplementing L. frutescens with 100–200 g rhizobium inoculation per 100 kg seeds can enhance secondary plant metabolites′ production, particularly the total phenolics and total flavonoids. However, increased rhizobium inoculation can reduce secondary plant metabolites′ production if the plant is harvested at the later stage (330 days after planting). The application of rhizobium inoculation increased ferric, reducing antioxidant power assay and accumulation of soluble sugars, mainly fructose and sucrose at different days after planting. This study provides the potential for screening the effects of phytochemicals on anti-oxidative responses to rhizobium inoculation. Inoculating with various sources is a sustainable technology to enhance the quality of the medicinal plant compounds. However, selecting and inoculating specific and active bacteria for a particular plant is essential for sustainable cultivation. A closer inspection within L. frutescens samples revealed high soil microbial diversity with increased soil microbial activity for treated samples than the bulk treatment. The L. frutescens samples represent healthy soil profiles, promoting healthy plants, and higher yield due to increased microbial activity. Carbon source utilization profiles and soil enzymatic activities can be used as indicators of soil quality. The N2 fixation in response to rhizobium inoculation treatments was low, and the considerable contribution of symbiotic N from atmospheric fixation was not achieved in this study.
Further research is recommended to understand the diversity and symbiotic functioning in response to various inoculants for increased secondary metabolites production. Our findings highlight the trajectory of L. frutescens meeting its N demand depending upon the rhizobium inoculation and growth stage. However, further research to investigate the symbiotic partner associated with the medicinal plant is desired.

Author Contributions

Conceptualization, M.J.M. and H.T.A.; data curation, M.J.M. and S.N.M.; formal analysis, M.J.M. and S.N.M.; funding acquisition, F.N.M.; investigation, M.J.M. and S.N.M.; methodology, M.J.M. and S.N.M.; resources, C.P.d.P., H.T.A. and F.N.M.; supervision, H.T.A. and F.N.M.; writing—original draft, M.J.M., writing—review and editing. All authors have read and agreed to the published version of the manuscript.

Funding

This research was funded by the Agricultural Research Council, Department of Science and Innovation, and the University of South Africa, Agriculture, and Animal Health Department.

Acknowledgments

The authors would like to thank the Agricultural Research Council-VOP for their technical support and facilities.

Conflicts of Interest

The authors declare no conflict of interest.

References

  1. Solaiman, Z.M.; Anawar, H.M. Rhizosphere microbes interactions in medicinal plants. In Plant-Growth Promoting Rhizobacteria (PGPR) and Medicinal Plants; Egamberdieva, D., Shrivastava, S., Varma, A., Eds.; Springer: Cham, Switzerland, 2015; pp. 19–41. [Google Scholar]
  2. Hayat, R.; Ali, S.; Amara, U.; Khalid, R.; Ahmed, I. Soil beneficial bacteria and their role in plant growth promotion: A review. Ann. Microbiol. 2010, 60, 1–20. [Google Scholar] [CrossRef]
  3. Thilakarathna, M.S.; Chapagain, T.; Ghimire, B.; Pudasaini, R.; Tamang, B.B.; Gurung, K.; Choi, K.; Rai, L.; Magar, S.; BK, B.; et al. Evaluating the effectiveness of rhizobium inoculants and micronutrients as technologies for Nepalese Common bean smallholder farmers in the Real-World Context of highly variable hillside environments and indigenous farming practices. Agriculture 2019, 9, 20. [Google Scholar] [CrossRef] [Green Version]
  4. Sarr, P.S.; Okon, J.W.; Begoude, D.A.; Araki, S.; Ambang, Z.; Shibata, M.; Funakawa, S. Symbiotic N2-fixation estimated by the 15N tracer technique and growth of Pueraria phaseoloides (Roxb.) Benth. Inoculated with Bradyrhizobium strain in field conditions. Scientifica 2016, 7026859. [Google Scholar]
  5. Arora, N.K.; Kang, S.C.; Maheshwari, D.K. Isolation of siderophore-producing strains of Rhizobium meliloti and their biocontrol potential against Macrophomina phaseolina that causes charcoal rot of groundnut. Curr. Sci. 2001, 81, 673–677. [Google Scholar]
  6. Rajeshkumar, S.; Nisha, M.C.; Selvaraj, T. Variability in growth, nutrition, and phytochemical constituents of Plectranthus amboinicus (Lour) Spreng. As influenced by indigenous arbuscular mycorrhizal fungi. Maejo Int. J. Sci. Technol. 2008, 2, 431–439. [Google Scholar]
  7. Geneva, M.P.; Stancheva, I.V.; Boychinova, M.B.; Mincheva, N.H.; Yonova, P.A. Effects of foliar fertilization and arbuscular mycorrhizal colonization on Salvia officinalis L. growth, antioxidant capacity, and essential oil composition. J. Sci. Food Agric. 2010, 90, 696–702. [Google Scholar] [CrossRef]
  8. Wang, Y.; Wang, M.; Li, Y.; Wu, A.; Huang, J. Effects of arbuscular mycorrhizal fungi on growth and nitrogen uptake of Chrysanthemum morifolium under salt stress. PLoS ONE 2018, 13, e0196408. [Google Scholar]
  9. Gogoi, P.; Singh, R.K. Differential effect of some arbuscular mycorrhizal fungi on growth of Piper longum L. (Piperaceae). Indian J. Sci. Technol. 2011, 4, 119–125. [Google Scholar] [CrossRef]
  10. Tariq, M.; Hameed, S.; Yasmeen, T.; Ali, A. Non-rhizobial bacteria for improved nodulation and grain yield of Mung bean [Vigna radiata (L.) Wilczek]. Afr. J. Biotechnol. 2012, 11, 15012–15019. [Google Scholar]
  11. Street, R.A.; Prinsloo, G. Commercially important medicinal plants of South Africa: A Review. J. Chem. 2012, 2013, 205048. [Google Scholar] [CrossRef]
  12. Van Wyk, B.E.; Gericke, N. People’s Plants: A Guide to Useful Plants of Southern Africa; Briza Publications: Pretoria, South Africa, 2000. [Google Scholar]
  13. Makunga, P.; Colling, J.; Stander, M.A.; Nokwanda, P. Nitrogen supply, and abiotic stress influence canavanine synthesis and the productivity of in vitro regenerated Sutherlandia frutescens micro shoots. J. Plant Physiol. 2010, 167, 1521–1524. [Google Scholar]
  14. Gibson, D. Ambiguities in the making of an African medicine: Clinical trials of Sutherlandia frutescens (L.) R. Br (Lessertia frutescens). Afr. Sociol Rev. 2011, 15, 1–7. [Google Scholar]
  15. Moteetee, A.N.; Van Wyk, B.E. The concept of Musa-pelo and medicinal use of shrubby legumes (Fabaceae) in Lesotho. Bothalia 2007, 37, 75–77. [Google Scholar] [CrossRef]
  16. Van Wyk, B.E.; Albrecht, C. A Review of taxonomy, ethnobotany, chemistry, and pharmacology of Sutherlandia frutescens (Fabaceae). J. Ethnopharmacol. 2008, 119, 620–629. [Google Scholar] [CrossRef]
  17. Tobwala, S.; Fan, W.; Hines, C.J.; Folk, W.R.; Ercal, N. Antioxidant potential of Sutherlandia frutescens and its protective effects against oxidative stress in various cell cultures. BMC Complement. Altern. Med. 2014, 14, 1–11. [Google Scholar] [CrossRef] [Green Version]
  18. Silva, L.R.; Bento, C.; Gonçalves, A.C.; Flores-Félix, J.D.; Ramírez-Bahena, M.H.; Peix, A.; Velázquez, E. Legume bioactive compounds: Influence of rhizobial inoculation. AIMS Microbiol. 2017, 3, 267–278. [Google Scholar] [CrossRef] [Green Version]
  19. Silva, L.R.; Peix, Á.; Albuquerque, C. Bioactive compounds of legumes as health promoters. In Natural Bioactive Compounds from Fruits and Vegetables as Health Promoters. Part 2. Sharjah; Silva, L.R., Silva, B.M., Eds.; Bentham Science Publishers: Sharjah, UAE, 2016; pp. 3–27. [Google Scholar]
  20. Couto, C.; Silva, L.R.; Valentão, P.; Velázquez, E.; Peix, A.; Andrade, P.B. Effects induced by the nodulation with Bradyrhizobium japonicum on Glycine max (Soybean) metabolism and antioxidant potential. Food Chem. 2011, 127, 1487–1495. [Google Scholar] [CrossRef]
  21. Shaik, S.; Singh, N.; Nicholas, A. Comparison of the selected secondary metabolite content present in the Cancer-bush Lessertia (Sutherlandia) frutescens L. extracts. Afr. J. Tradit. Complement. 2011, 8, 429–434. [Google Scholar]
  22. Bhat, A.A.; Prabhu, K.S.; Kuttikrishnan, S.; Krishnankutty, R.; Ramzi, J.B.; Mohammad, M.; Uddin, S. Potential therapeutic targets of Guggulsterone in cancer. Nutr. Metab. 2017, 14, 23. [Google Scholar] [CrossRef] [Green Version]
  23. Mendes, R.; Garbeva, P.; Raaijmakers, J.M. The rhizosphere microbiome: Significance of plant beneficial plant pathogenic and human pathogenic microorganisms. FEMS Microbiol. Rev. 2013, 37, 634–663. [Google Scholar] [CrossRef]
  24. Doran, J.W.; Safley, M. Defining and assessing soil health and sustainable productivity. In Biological Indicators of Soil Health; Pankhurst, C., Doube, B.M., Gupta, V.V.S.R., Eds.; CAB International: Willingford, UK, 1997. [Google Scholar]
  25. Habig, J.; Swanepoel, C. Effects of conservation agriculture and fertilization on soil microbial diversity and activity. Environment 2015, 2, 358–384. [Google Scholar] [CrossRef]
  26. Doran, J.W.; Zeiss, M.R. Soil health and sustainability: Managing the biotic component of soil quality. Appl. Soil Ecol. 2000, 15, 3–11. [Google Scholar] [CrossRef] [Green Version]
  27. Jorquera, M.A.; Shaharoona, B.; Nadeem, S.M.; de la Luz Mora, M.; Crowley, D.E. Plant growth-promoting rhizobacteria associated with ancient clones of creosote bush (Larrea tridentata). Microb. Ecol. 2012, 64, 1008–1017. [Google Scholar] [CrossRef] [PubMed]
  28. Karthikeyan, B.; Joe, M.M.; Jaleel, C.A. Response of some medicinal plants to vesicular-arbuscular inoculations. J. Sci. Res. 2009, 1, 381–386. [Google Scholar] [CrossRef]
  29. Li, H.B.; Wong, C.C.; Cheng, K.W.; Chen, F.F. Antioxidant properties in vitro and total phenolic contents in methanol extracts from medicinal plants. Food Sci. Technol. 2008, 41, 385–390. [Google Scholar] [CrossRef]
  30. Ibrahim, M.H.; Jaafar, H.Z.E.; Rahmat, A.; Rahman, Z.A. Involvement of nitrogen on flavonoids, glutathione, anthocyanin, ascorbic acid and antioxidant activities of Malaysian medicinal plant Labisia pumila Blume (Kacip). Int. J. Mol. Sci. 2012, 13, 393–408. [Google Scholar] [CrossRef] [Green Version]
  31. Benzie, I.F.F.; Strain, J.J. The ferric reducing ability of plasma (FRAP) as a measure of “antioxidant power”: The FRAP Assay. Anal. Biochem. 1996, 239, 70–76. [Google Scholar] [CrossRef] [Green Version]
  32. Unkovich, M.J.; Herridge, D.F.; Peoples, M.B.; Cadisch, G.; Boddey, R.M.; Giller, K.E. Measuring Plant-Associated Nitrogen Fixation in Agricultural Systems; ACIAR: Canberra, Australia, 2008.
  33. Shearer, G.; Kohl, D.H. N2-fixation in field settings, estimations based on natural 15N abundance. Aust. J. Plant Physiol. 1986, 13, 699–756. [Google Scholar]
  34. Mitchell, R.J.; Hester, A.J.; Campbell, C.D.; Chapman, S.J.; Cameron, C.M.; Hewison, R.J.; Potts, J.M. Is vegetation composition or soil chemistry the best predictor of the soil microbial community? Plant Soil 2010, 333, 417–430. [Google Scholar] [CrossRef]
  35. Mathiventhan, U.; Sivakanesan, R. Total phenolic content and total antioxidant activity of sixteen commonly consumed green leafy vegetables stored under different conditions. Eur. Int. J. Sci. Technol. 2013, 2, 123–132. [Google Scholar]
  36. Cappellari, L.; Santoro, M.V.; Nievas, F.; Giordano, W.E.; Banchio, F. Increase of secondary metabolite content in marigold by inoculation with plant growth-promoting rhizobacteria. Appl. Soil Ecol. 2013, 70, 16–22. [Google Scholar] [CrossRef]
  37. Salla, T.D.; Ramos da Silva, T.; Astarita, L.V.; Santarém, E.R. Streptomyces rhizobacteria modulate the secondary metabolism of Eucalyptus plants. Plant Physiol. Biochem. 2014, 85, 14–20. [Google Scholar] [CrossRef] [PubMed]
  38. Larose, G.; Cheˆnevert, R.; Moutoglis, P.; Gagne´, S.; Piche´, Y.; Vierheilig, H. Flavonoid levels in roots of Medicago sativa are modulated by the developmental stage of the symbiosis and the root-colonizing arbuscular mycorrhizal fungus. J. Plant Physiol. 2002, 159, 1329–1339. [Google Scholar] [CrossRef] [Green Version]
  39. Pedone-Bonfim, M.V.L.; Lins, M.A.; Coelho, I.R.; Santana, A.S.; Silva, F.S.B.; Maia, L.C. Mycorrhizal technology and phosphorus in the production of primary and secondary metabolites in cebil (Anadenanthera colubrina (Vell.) Brenan) seedlings. J. Sci. Food Agric. 2013, 93, 1479–1484. [Google Scholar] [CrossRef] [PubMed]
  40. Tungmunnithum, D.; Thongboonyou, A.; Pholboon, A.; Yangsabai, A. Flavonoids and other phenolic compounds from medicinal plants for pharmaceutical and medical aspects: An overview. Medicines 2018, 5, 93. [Google Scholar] [CrossRef] [PubMed]
  41. Vurukonda, S.; Giovanardi, D.; Stefani, E. Plant growth-promoting and biocontrol activity of Streptomyces spp. as Endophytes. Int. J. Mol. Sci. 2018, 19, 952. [Google Scholar] [CrossRef] [Green Version]
  42. Ibrahim, M.H.; Jaafar, H.Z.; Karimi, E.; Ghasemzadeh, A. Impact of organic and inorganic fertilizer application on the phytochemical and antioxidant activity of Kacip Fatimah (Labisia pumila Benth). Molecules 2013, 18, 10973–10988. [Google Scholar] [CrossRef] [Green Version]
  43. Ceccarelli, N.; Curadi, M.; Martelloni, L.; Sbrana, C.; Picciarelli, P.; Giovannetti, M. Mycorrhizal colonization impacts on phenolic content and antioxidant properties of artichoke leaves and flower head two years after field transplant. Plant Soil 2010, 335, 311–323. [Google Scholar] [CrossRef]
  44. Ponce, M.A.; Scervino, J.M.; Erra, B.R.; Ocampo, J.A.; Godeas, A. Flavonoids from shoots and roots of Trifolium repens (white clover) grown in presence or absence of the arbuscular mycorrhizal fungus Glomus intraradices. Phytochemistry 2004, 65, 1925–1930. [Google Scholar] [CrossRef]
  45. Zubek, S.; Rola, K.; Szewczyk, A. Enhanced concentrations of elements and secondary metabolites in Viola tricolor L. induced by arbuscular mycorrhizal fungi. Plant Soil 2015, 390, 129. [Google Scholar] [CrossRef] [Green Version]
  46. Singh, R.; Soni, S.K.; Kalra, A. Synergy between Glomus fasciculatum and a beneficial pseudomonas in reducing root diseases and improving yield and forskolin content Coleus forskohlii Briq. Under organic field conditions. Mycorrhiza 2013, 23, 35–44. [Google Scholar] [CrossRef]
  47. Abdel-Lateif, K.; Bogusz, D.; Hocher, V. The role of flavonoids in the establishment of plant roots endosymbioses with arbuscular mycorrhiza fungi, rhizobia, and Frankia bacteria. Plant Signal. Behav. 2012, 7, 636–641. [Google Scholar] [CrossRef] [PubMed] [Green Version]
  48. Phillips, D.A.; Tsai, S.M. Flavonoids as plant signals to rhizosphere microbes. Mycorrhiza 1992, 1, 55–58. [Google Scholar] [CrossRef]
  49. Morandi, D. Occurrence of phytoalexins and phenolic compounds in endomycorrhizal interactions, and their potential role in biological control. Plant Soil 1996, 185, 241–251. [Google Scholar] [CrossRef]
  50. Veeru, P.; Kishor, M.P.; Meenakshi, M. Screening of medicinal plant extracts for antioxidant activity. J. Med. Plant Res. 2009, 3, 608–612. [Google Scholar]
  51. Fernandes, A.C.; Cromarty, A.D.; Albrecht, C.; Rensburg, C.E.J. The antioxidant potential of Sutherlandia frutescens. J. Ethnopharmacol. 2004, 95, 1–5. [Google Scholar] [CrossRef] [PubMed]
  52. Wingler, A.; Masclaux-Daubresse, C.; Fischer, A.M. Sugars, senescence, and aging in plants and heterotrophic organisms. J. Exp. Bot. 2009, 60, 1063–1066. [Google Scholar] [CrossRef] [Green Version]
  53. Koch, K. Sucrose metabolism: Regulatory mechanisms and pivotal roles in sugar sensing and plant development. Curr. Opin. Plant Biol. 2004, 7, 235–246. [Google Scholar] [CrossRef]
  54. Ferguson, B.J.; Lin, M.H.; Gresshoff, P.M. Regulation of legume nodulation by acidic growth conditions. Plant Signa.l Behav. 2013, 8. [Google Scholar] [CrossRef] [Green Version]
  55. Canarini, A.; Kaiser, C.; Merchant, A.; Richter, A.; Wanek, W. Root exudation of primary metabolites: Mechanisms and their roles in plant responses to environmental stimuli. Front Plant Sci. 2019, 10, 157. [Google Scholar] [CrossRef] [Green Version]
  56. Girvan, M.S.; Bullimore, J.; Pretty, J.N.; Osborn, A.M.; Ball, A.S. Soil type is the primary determinant of the composition of the total and active bacterial communities in arable soils. Appl. Environ. Microbiol. 2003, 69, 1800–1809. [Google Scholar] [CrossRef] [Green Version]
  57. Gomez, E.; Ferreras, L.; Toresani, S. Soil bacterial functional diversity as influenced by organic amendment application. Bioresour. Technol. 2006, 97, 1484–1489. [Google Scholar] [CrossRef]
  58. Hofman, J.; Švihálek, J.; Holoubek, I. Evaluation of functional diversity of soil microbial communities—A case study. Plant Soil Environ. 2004, 50, 141–148. [Google Scholar] [CrossRef] [Green Version]
  59. Brockett, B.F.T.; Prescott, C.E.; Grayston, S.J. Soil moisture is the major factor influencing microbial community structure and enzyme activities across seven biogeoclimatic zones in Western Canada. Soil Biol. Biochem. 2012, 44, 9–20. [Google Scholar] [CrossRef]
  60. Pitumpe Arachchige, P.S.; Rosso, L.H.M.; Hansel, F.D.; Ramundo, B.; Torres, A.R.; Ciampitti, I.A.; Jagadish, S.V.K. Temporal biological nitrogen fixation pattern in soybean inoculated with Bradyrhizobium. Agrosyst. Geosci. Environ. 2020, 3, e20079. [Google Scholar] [CrossRef]
  61. Gelfand, I.; Robertson, G.P. A reassessment of the contribution of soybean biological nitrogen fixation to reactive N in the environment. Biogeochemistry 2015, 123, 175–184. [Google Scholar] [CrossRef] [Green Version]
Figure 1. Ferric reduces antioxidant power assay (FRAP) of L. frutescens extracts in response to four rhizobium inoculation levels and different harvesting periods. Bars followed by different letters are significantly different at p ≤ 0.05.
Agronomy 10 01675 g001
Figure 2. Accumulation of sucrose (A), glucose (B), and fructose (C) in response to four rhizobium inoculation levels and different days after planting of L. frutescens. Rhizobium inoculation treatments 0 = control (no rhizobium); 100; 200 and 400 g of rhizobium per 100 kg of seeds of L. frutescens at 150; 240 and 330 d.a.p. Bars followed by different letters are significantly different at p ≤ 0.05.
Agronomy 10 01675 g002aAgronomy 10 01675 g002b
Figure 3. Principal Component Analysis (PCA) ordination plot illustrating the differences in the average carbon source utilization profiles. Treatments 0 = Control (no rhizobium), 1 = 100, 2 = 200 and 4 = 400 grams of rhizobium per 100 kg of seeds.
Agronomy 10 01675 g003
Figure 4. Dendrogram illustrating the differences in the average carbon source utilization profiles between treatments. Treatments 0 = control (no rhizobium), 1 = 100, 2 = 200 and 4 = 400 grams of rhizobium per 100 kg of seeds.
Agronomy 10 01675 g004
Figure 5. Correlations of soil amino sugar data, rhizobium inoculation treatments (T0 = control (no rhizobium), T1 = 100, T2 = 200 and T4 = 400 grams of rhizobium per 100 kg of seeds) and soil environmental variables including organic C, nitrogen (N), Zinc (Zn), Sulphur (S), Copper (Cu), Iron (Fe) and Manganese (Mn) determined by redundancy analysis (RDA).
Agronomy 10 01675 g005
Table 1. Chemical characteristics of soils collected from the experimental site.
Depth (cm)PNKMgFeCapH
mg/kgH2O
0–3054.430.04287.67275.3312.36919.337.06
30–6050.100.03265.33329.339.851005.007.30
Table 2. Accumulation of total phenolics and total flavonoid contents responds to four rhizobium inoculation levels and different harvesting periods of L. frutescens.
Total Phenolic Content (mg GAE/g)Total Flavonoid Content (mg QE/g)
Harvesting Period (d.a.p.) Harvesting Period (d.a.p.)
Inoculation Level (g)150 240 330 150240330
031.08 ± 0.54 b64.69 ± 1.09 ab46.02 ± 3.42 b0.46 ± 0.15 ab1.36 ± 0.34 ab1.62 ± 0.42 a
10039.02 ± 2.20 a62.89 ± 2.41 ab60.17 ± 1.89 a0.64 ± 0.03 a1.74 ± 0.34 a1.17 ± 0.09 b
20036.83 ± 0.92 a88.77 ± 5.40 a64.64 ± 0.28 a0.48 ± 0.06 ab1.45 ± 0.03 ab1.66 ± 0.06 a
40037.26 ± 8.45 a48.33 ± 1.12 c58.07 ± 1.53 a0.19 ± 0.04 c1.42 ± 0.16 ab1.60 ± 0.18 a
F-statistics0.6 ns30.0 ***14.3 ***4.6 **0.70 ns0.36 ns
Note: Values (Mean ± SE) with different letters in a column are significantly different at p ≤ 0.01 (**), p ≤ 0.001 (***), or ns: not significant. Days after planting (d.a.p.).
Table 3. Carbon source utilization profiles of the average of treatments sampled and variation within different inoculation levels.
TreatmentsCSU
T00.653 a
T10.497 b
T20.239 c
T40.597 ab
BULK0.294 c
Means followed by similar letters do not differ significantly (p > 0.05). T0 = control (no rhizobium or inoculum), T1 = 100, T2 = 200 and T4 = 400 grams of rhizobium inoculum per 100 kg of seeds.
Table 4. The Shannon–Weaver diversity index and the Evenness Index between treatments sampled.
TreatmentsShannon-WeaverEvenness
T02.22 a0.73 ab
T12.18 a0.79 b
T22.06 a0.67 a
T42.32 a0.76 ab
BULK1.88 a0.66 ab
Means followed by similar letters do not differ significantly (p > 0.05). T0 = control (no rhizobium). T1 = 100, T2 = 200 and T4 = 400 grams of rhizobium per 100 kg of seeds.
Table 5. Soil microbial enzymatic activities between cover crop treatments.
Treatmentß-Glucosidase Activity
(p-Nitrophenol µg/g/h)
Alkaline Phosphatase Activity
(p-Nitrophenol µg/g/h)
Acid Phosphatase Activity
(p-Nitrophenol µg/g/h)
Urease Activity
(NH4-N µg/g/h)
Overall Enzyme Activity
(µg/g/h)
T01104.585 a1646.923 a1502.064 a73.157 a1081.682
T11084.815 a1634.502 a1503.120 a78.427 a1075.216
T21069.766 a1497.299 a1599.061 a76.059 a1060.546
T41108.302 a1559.537 a1476.979 a74.168 a1054.747
Bulk1055.473 a1712.644 a1641.505 a88.063 a1124.421
Means in columns followed by the same letters do not differ significantly (p > 0.05). Treatments 0 = control (no rhizobium), 1 = 100, 2 = 200 and 4 = 400 grams of rhizobium per 100 kg of seeds.
Table 6. Comparison of plant growth, symbiotic performance, and soil N uptake of L. frutescens in response to rhizobium inoculation.
TreatmentDry MatterN ContentN15NNdfaN FixedSoil N Uptake
gg%%(kg/ha)(kg/ha)
150 d.a.p.
T059.54 ± 2.75 c1.29 ± 0.10 b2.15 ± 0.08 b3.81 ± 0.18 a10.23 ± 2.71 c2.81 ± 0.79 b23.43 ± 1.54 b
T168.02 ± 8.11 b1.45 ± 0.23 b2.12 ± 0.14 b3.42 ± 0.31 ab16.27 ± 4.87 b4.92 ± 1.60 ab24.76 ± 4.16 b
T260.89 ± 5.81 b1.28 ± 0.08 b2.14 ± 0.08 ab2.25 ± 0.24 b34.26 ± 3.73 a8.95 ± 1.03 a17.24 ± 1.50 c
T489.83 ± 8.07 a2.12 ± 0.29 a2.36 ± 0.26 a3.71 ± 0.30 a11.72 ± 4.70 c5.13 ± 2.51 ab38.21 ± 5.73 a
240 d.a.p.
T053.75 ± 7.49 b11.12 ± 4.62 b2.15 ± 0.08 ab3.81 ± 0.18 a10.28 ± 2.71 c21.24 ± 5.08 d25.78 ± 4.87 ab
T175.75 ± 3.32 a15.47 ± 2.37 a2.12 ± 0.14 ab3.42 ± 0.31 ab16.27 ± 4.87 b56.66 ± 25.79 ab29.08 ± 2.43 a
T274.25 ± 9.83 a15.98 ± 1.93 a2.14 ± 0.08 ab2.25 ± 0.24 b34.26 ± 3.73 a110.86 ± 17.18 a25.31 ± 2.12 ab
T477.50 ± 9.56 a17.41 ± 1.40 a2.36 ± 0.26 a3.71 ± 0.30 a11.72 ± 4.71 c43.45 ± 19.67 c31.81 ± 2.67 a
330 d.a.p.
T054.22 ± 2.11 b12.81 ± 1.36 b2.17 ± 0.08 a3.10 ± 0.11 a11.22 ± 2.10 ab27.50 ± 8.64 ab23.88 ± 2.94 a
T142.08 ± 1.11 c10.62 ± 1.80 b2.21 ± 0.07 a3.00 ± 0.25 a15.38 ± 1.11 a37.89 ± 7.42 a17.89 ± 9.37 b
T240.89 ± 2.51 c18.26 ± 2.17 a2.14 ± 0.08 a2.00 ± 0.11 b14.27 ± 2.11 a13.22 ± 7.65 b24.49 ± 7.72 a
T486.00 ± 11.07 a10.37 ± 1.49 b2.07 ± 0.16 a3.26 ± 0.11 a8.23 ± 0.11 b16.11 ± 6.04 b19.51 ± 11.27 b
Means in columns followed by the same letters do not differ significantly (p > 0.05). Rhizobium inoculation levels: T0 = control (no rhizobium); T1 = 100; T2 = 200 and T4 = 400 grams of rhizobium per 100 kg of seeds.
Publisher’s Note: MDPI stays neutral with regard to jurisdictional claims in published maps and institutional affiliations.

