Abstract
The aim of the study was to evaluate the influence of mycorrhizal fungi (MF) and irrigation on biological properties of sweet pepper rhizosphere in organic field cultivation. For this purpose, MF were applied to plants in the form of commercial mycorrhizal inoculum (Rhizophagus aggregatus, R. intraradices, Claroideoglomus etunicatum, Endogone mosseae, Funneliformis caledonium, and Gigaspora margarita) and irrigation according to the combinations: mycorrhized plants (PM), mycorrhized and irrigated plants (PMI), and irrigated plants (PI). Plants without MF and irrigation served as the absolute control (P). The study used classic and molecular techniques, assessing catalase activity, biodiversity of soil microorganisms (soil DNA analysis), and the Community-Level Physiological Profiles (CLPP) analysis using Biolog EcoPlates. The highest catalase activity was recorded in the control and mycorrhized soil sample. The highest total number of bacteria was noted in the rhizosphere of control plants (P) and irrigated plants, while the lowest number in the rhizosphere of mycorrhized and irrigated plants. Plant irrigation contributed to the increase in the total number of fungi in the rhizosphere. The rhizospheric soil of PM and PMI were characterized by the highest utilization of amines, amides, and amino acids, whereas the lowest level of utilization was detected in the P and PI rhizospheres. The highest biodiversity and metabolic activity were observed in the rhizospheres from the PMI and PM samples, whereas lower catabolic activity were recorded in the P and PI rhizospheres. The mycorrhization of crops improved the biological properties of the rhizosphere, especially under conditions of drought stress.
1. Introduction
The rhizosphere is a zone of intense microbial activity and shows a close relationship between plant, soil, and microorganisms. It is characterized by biological activity, which, in turn, is one of the factors determining the growth of plants and their resistance to pathogens [1,2].
Soil biological activity is reflected by the intensification of life processes of soil organisms, whose measure may be, among others, the degree of multiplication of the soil microorganisms, as well as the activity of enzymes present in the soil [3,4]. Enzymatic activity is one of the reliable indicators of soil biological activity [5,6,7]. The activity of dehydrogenases, phosphatases, and catalases are most often assessed in the soil [8,9]. It seems interesting to determine the activity of catalase, as it is an intracellular enzyme involved in the metabolism of microorganisms that reduces the effects of oxidative stress [10,11,12]. The activity of catalase in soil depends, inter alia, on the content of organic matter, heavy metals, mineral and organic fertilization, and soil depth but, also, on the activity of dehydrogenases [9,13].
The rhizosphere of plants is a place where the abundance of primary substrates secreted by plants is significantly higher than in the non-rhizospheric soil. These primary substrates are the nutrients for soil microorganisms. Their compositions depend on the plant and environmental conditions. The rhizodeposites released by plants are easily available substrates, the presence of which enhances the activity of microorganisms inhabiting the rhizosphere [1]. The modification of root exudates, affecting soil microorganisms, is often the result of changing abiotic and biotic factors. The use of chemical products (pesticides) may change the concentration and type of secondary metabolites synthesized in plants and unfavorably affect plant interactions with antagonistic soil microorganisms [14]. Microorganisms present in the rhizosphere have a positive and negative effect on plants. This consists in both releasing and transforming nutritive substrates, as well as in excreting their own, in addition to the detoxification of secondary plant metabolites frequently harmful to plants [15,16]. Plant root exudates, especially phenolic compounds (flavonoids), play a significant role in the signaling functions between symbionts [17].
Classical techniques based on microorganism cultures allow for a detailed study of isolated microorganisms, and molecular techniques (metagenomics/metatranscriptomics) enable the identification of microbial populations, including those defined as noncultivable. Moreover, the results of the DNA analyses are used not only for determining the structure of the microbial community but, also, the functions of these microorganisms [16,18,19].
Sweet pepper is one of the most important vegetable crops cultivated in the world (Food and Agriculture Organization data from 2017—34 million tons per year). Its field cultivation is possible even in countries with a harsher climates (Poland), thanks to the breeding of native varieties that give a satisfactory yield. This plant cultivation requires continuous improvement due to new problems related to healthy food production without the use of pesticides [20]. One of the elements of integrated plant protection is the use of nonchemical methods, including mycorrhiza. Mycorrhizal fungi (MF) influence the development and activity of soil microorganisms, especially increasing the biodiversity of rhizosphere microorganisms—particularly the number of saprotrophs, which protects plants against soil pathogens [21,22]. Root colonization by endomycorrhizal fungi causes changes in the quantity and quality of exudates produced by the roots; carbon distribution in the leaves, stems, and roots; and the level of nutrient supply to the plants [21,23]
The purpose of this study was to evaluate and discuss the influence of mycorrhizal inoculation and plant irrigation on biological properties of sweet pepper rhizosphere soil in organic field cultivation.
2. Materials and Methods
2.1. Study Site
The study was carried out at an organic farm located in Lublin Province (Grądy), Poland (51°05′ N, 22°12′ E) in the years 2016–2018. The sweet pepper (Capsicum annuum L.) hybrid plant Roberta F1′, a Polish cultivar important for commercial production, was used in this study. The experiment used a mycorrhizal inoculum (Mycoflor, Końskowola, Poland) containing spores and the mycelium of mycorrhizal fungi mixed with peat (Rhizophagus aggregatus, R. intraradices, Claroideoglomus etunicatum, Endogone mosseae, Funneliformis caledonium, and Gigaspora margarita).
Beans were the forecrops for peppers. Depending on the years, mineral contents in the soil were as follows: N-NO3—25–40, P—68–90, K—128–160, Ca—1280–1540, Mg—95–110 mg∙dm−3, and pHH2O—6.4–6.7. Plant seedlings were fertilized with Fertikal organic fertilizer (10 kg∙100 m−2) (FERTIKAL, Beveren, Belgium) two weeks before planting. Pepper was sprayed three times at different stages of plant development (BBCH 22, 51, and 62) using Bio-Algeen S90 0.5% preparation (marine algae extract) (Schulze & Hermsen GmbH, Dahlenburg, Germany). Pepper seedlings were prepared in the production greenhouse of the University of Life Sciences in Lublin, Poland, according to generally accepted rules for this vegetable [24]. The seedlings were planted in the field in the second half of May at a distance of 0.67 × 0.35 m. Mycorrhizal fungi and irrigation were the factors studied in the experiment. Mycorrhizal inoculation in an amount of 3 mL was applied under the plant to the dug hole before planting the plants in a permanent location. The plants were drip-irrigated using irrigation hoses distributed in the plant inter-rows. The total amount of water doses in irrigated objects were, in 2016, 2017, and 2018: 140 mm, 120 mm, and 110 mm, respectively. In each year of the study, the two-factorial field experiment was established in a random block design in 4 replications, planting 5 plants in each block. For each experimental combination, a total of 20 plants were planted, and the area of one plot was 4.69 m2. The following experimental treatments were used in the study: (1) plants without mycorrhizal inoculation and irrigation as the absolute control (P), (2) mycorrhized plants (PM), (3) irrigated plants (PI), and (4) mycorrhized and irrigated plants (PMI). No pesticides were used during the vegetation.
2.2. Determination of Soil Catalase Activity
In 2016–2018, during the growing season, peppers were collected twice (BBCH 22—development of lateral shoots and BBCH 72 and 73—fruit development and maturation) from each plot, plus 10 soil samples from a depth of 5–20 cm (rhizosphere zone) and 10 samples from the level of 20–40 cm from the soil not overgrown with roots (non-rhizosphere zone). Soil samples from each layer were averaged for each plot. Catalase activity was tested in fresh soil material sieved through a 1-mm mesh. The Johnson and Temple [25] method, which consists of incubating the soil with added hydrogen peroxide (natural enzyme substrate), was used to determine the catalase activity in the analyzed soil. H2O2 remaining in the soil, not degraded by catalase, was titrated with potassium permanganate in an acidic environment. The results were given in catalase activity units, equal to mg H2O2∙g−1 dm∙min−1.
2.3. Analysis of Microbial Community in the Rhizosphere
In 2016–2018, in the period of fruit development and maturation (BBCH 72 and 73), rhizosphere soils were collected from the individual experimental treatments, and microbiological analyses were conducted according to the appropriate method [26,27,28,29]. In each year of the study, four entire plants were dug out from each plot of individual treatments (i.e., 16 plants from each treatment). The rhizospheric soil (adhering to the roots) was shaken off into sterile Petri dishes. Under laboratory conditions, soil samples from the same experimental treatments were mixed, then divided into 10-g weighed amounts and prepared for further analyses (4 replicates for each experimental treatment).
Analysis of Rhizosphere Microorganism Abundance
Soil solutions were prepared from 10 g of soil with a dilution range from 10−1 to 10−7 in laboratory conditions from individual soil samples. The total number of bacteria was determined in nutrient agar (Difco) using 10−5, 10−6, and 10−7 solutions. In the case of Bacillus spp., tryptic soy agar (Difco) and 10−4, 10−5, and 10−6 dilutions were used, while Pseudomonas agar F (Difco) and 10−2, 10−3, and 10−4 dilutions were used for Pseudomonas spp. For Bacillus spp. isolation, soil dilutions were heated for 20 min at 80 °C [26]. The total number of fungi in each soil sample was determined on Martin′s medium using 10−2, 10−3, and 10−4 dilutions [30]. Petri dishes were stored at 24 °C in the dark for 2–7 days. After incubation, the number of microorganisms was converted into CFU·g−1 soil DW (colony-forming units/g soil dry weight). Fungal colonies grown from the rhizospheric soil were measured and then transferred to potato dextrose agar (Difco) slants. The obtained fungi were transferred onto specialized fungal culture media (Potato Dextrose Agar, Selective Nutrient Agar, Czapex-Dox, and Malt medium) and determined to the species using available keys and monographs described in the study by Patkowska and Krawiec [30].
2.4. Extraction of Total DNA, PCR Reaction, and Next-Generation Sequencing
The 350 mg of fresh soil was collected into 1.5-mL tubes. The FastDNATM SPIN Kit for Soil (MP Biomedical, Santa Ana, CA, USA) was used for extraction of the DNA. The reaction was carried out according to the manufacturer’s instructions. A detailed description of the procedure was given in the paper by Gałązka et al., 2020. The concentration and purity of the DNA were measured with a NanoDrop 1000 Spectrophotometer (Thermo Scientific, Waltham, MA, USA). DNA was sequenced at Genomed S.A. (Warsaw, Poland) with 2 × 250 base pair (bp) paired-end technology using the Illumina MiSeq System (Illumina, Inc., San Diego, CA, USA) [31].
2.5. Analysis of Biodiversity of Soil Using Biolog EcoPlates Methods
The functional biodiversity of the soil was analyzed using Biolog Eco PlatesTM (Biolog, Inc., Hayward, CA, USA). One gram of each soil sample was suspended in 99 mL of sterile water and vortexed for 20 min at room temperature. The suspension was left to settle for 30 min at 4 °C [32]. Each well was inoculated with 120 μL of suspension and incubated at 25 °C for 7 days in an OmniLog® ID System multiplate reader (Biolog, Inc., Hayward, CA, USA). The plates were prepared in triplicates. The very intensive metabolic activity of 31 caron sources was observed after 96 h of incubation plates. The results of this analysis were confirmed every 24 h using the MicroStation ID system (λ = 590 nm) (Biolog, Inc., Hayward, CA, USA). The activity of the microorganisms in all five groups of compounds were confirmed: the amines and amides, amino acids, carbohydrate, carboxylic acid, and polymers.
2.6. Statistical Analysis
The phylogenetic tree and heatmap were constructed using Euclidean clustering with a Heatmap Plugins [33] in the R environment [34]. Fungal abundance metrics were converted into a standard score (z-score). Standardization was computed by subtracting the mean and dividing it by the standard deviation. Z-scores are computed after the clustering, so that it only affects the graphical aesthetics. All basic statistical analyses were performed using the Statistica.pl package (10) (Stat. Soft. Inc., Tulsa, OK, USA). The analysis of variance (ANOVA) with significant differences was calculated using Tukey’s post-hoc least significance difference (LSD) test at a significance level of p ≤ 0.05. Additionally, the principal component analysis (PCA) was performed to determine the basic relationship between the biodiversity indices and rhizospheric soils. For the results obtained from the analysis of the Biolog EcoPlates a percentage of individual compound utilizations divided into these groups was also done. The heatmap of carbon utilization patterns of 31 different substrates located on Biolog EcoPlates incubated for 96 h with rhizospheric soil samples was presented. Internal transcribed spacer-1 (ITS-1) regions were subtracted using the ITSxpress software [35] on demultiplexed fastq files, then processed using the DADA2 (1.12) package [36] implemented in the R software (3.6.0) [34]. Primers were removed from all reads. Filtering parameters were as follows: maxN = 0, maxEE for both reads = 2, and truncQ = 2. Fungal taxonomy was determined based on the latest version of the modified UNITE database from July 2019 [37] using IDTAXA [38] on the sequence table, resulting from the DADA2 workflow described above. The results were converted and imported into the phyloseq (1.22.3) package [39]. The basic sequences belonging to the mitochondrial or chloroplast were removed. Subsequently, for further analysis, the total number of reads for individual taxa was converted into a percentage value, assuming the sum of all taxa in individual samples as 100%. Diversity indices were calculated using the PAST 3.18 software [40] based on the genus level.
3. Results
3.1. Soil Catalase Activity
The analysis showed that catalase activity in the soil under the cultivation of peppers in the organic production was determined to a varying degree by the studied factors: years of research, mycorrhizal inoculation and irrigation, soil sampling zones (rhizosphere and non-rhizosphere), and plant developmental stages (Table 1). In the current study, the activity of catalase depended most on the collection zone of the soil samples (Table 1). The rhizospheric soil (0.0439 mg H2O2∙g−1 dm∙min−1) showed significantly higher catalase activity than non-rhizospheric soil (0.0175 mg H2O2∙g−1 dm∙min−1). Stress related to the lack of irrigation of peppers also significantly increased the catalase activity in the soil. The highest activity of this enzyme was noted for the control (P—0.0389 mg H2O2∙g−1 dm∙min−1) and PM (0.0301 mg H2O2∙g−1 dm∙min−1) samples, while the lowest activity was recorded for the PMI (0.0226 mg H2O2∙g−1 d.m.∙min−1) and PI (0.0271 mg H2O2∙g−1 d.m.∙min−1) samples. Soil from the PI and PMI, plots, did not differ significantly in terms of catalase activity (Table 1).

Table 1.
Catalase (CAT) activity (mg H2O2∙g−1 dm∙min−1).
A significant influence of the soil moisture in 2016–2018 on the catalase activity in the soil under pepper cultivation was also demonstrated (Table 1). Significantly, the highest catalase activity (0.0366 mg H2O2∙g−1 dm∙min−1) was observed in the soil in the first year of the study compared to the subsequent ones, which did not differ from each other (Table 1). The developmental stage of pepper also influenced the catalase activity. The soil under pepper cultivation at the BBCH 72 and 73 stages (0.0328 mg H2O2∙g−1 dm∙min−1) was characterized by a significantly higher activity of this enzyme than at BBCH 22 (0.0265 mg H2O2∙g−1 dm∙min−1) (Table 1). Irrigated soil with a lower oxygen state was characterized by a lower catalase activity than the soil without irrigation.
3.2. Communities of Rhizosphere Microorganisms
The microbiological analysis of the rhizosphere showed that the total population of bacteria in the individual years of the study ranged, on average, from 14.76∙106 to 22.43∙106 CFU∙g−1 soil DW (Table 2). The average population of Pseudomonas spp. ranged from 2.29∙106 to 10.74∙106 CFU∙g−1, while the average population of Bacillus spp. ranged from 1.70∙106 to 7.46∙106 CFU−1. The largest populations of these bacteria were found in the P and PI samples. The populations of Bacillus spp. and Pseudomonas spp. were smaller in the PM sample (3.13∙106 and 4.63∙106 CFU∙g−1 of soil DW, respectively). The smallest populations of these bacteria were observed in the PMI (1.70∙106 and 2.29∙106 CFU∙g−1 of soil DW, respectively), and they were significantly different from the populations in the other experimental treatments (Table 2). Both mycorrhiza and irrigation inhibited the growth of bacteria in the pepper rhizosphere.
Table 2.
Number of bacteria and fungi isolated from the soil in the individual experimental treatments.
The total population of fungi ranged, on average, from 7.92∙103 to 20.96∙103 CFU∙g−1 (Table 2). The smallest fungal population was observed in the PM sample, and it significantly differed from the populations in the other treatments. The irrigation of sweet peppers caused an increase in the population of fungi in the rhizosphere. Their mean numbers were 15.61∙103 CFU∙g−1 for the PMI and 20.96∙103 CFU∙g−1 soil DW for the PI samples. The microbial population sizes differed significantly between the different experimental treatments in each study year. The mycorrhization itself decreased the fungal population, but in combination with irrigation, it caused a significant increase of these rhizosphere microorganisms.
3.3. Biodiversity of Fungi Colonizing the Rhizosphere
During the three-year mycological analysis of sweet peppers, 1184 fungal colonies containing 22 species were isolated. The genera Alternaria, Fusarium, Trichoderma, and Penicillium were found to be the most numerous (Figure 1). The three-year study showed that more fungal colonies were isolated from the rhizosphere of nonirrigated plants (P—318 and PM—335 colonies) than irrigated plants (PI—227 and PMI—304 colonies) (Figure 1). The highest number of fungal colonies was observed in the rhizosphere of mycorrhized pepper (PM), higher than in other experimental treatments.
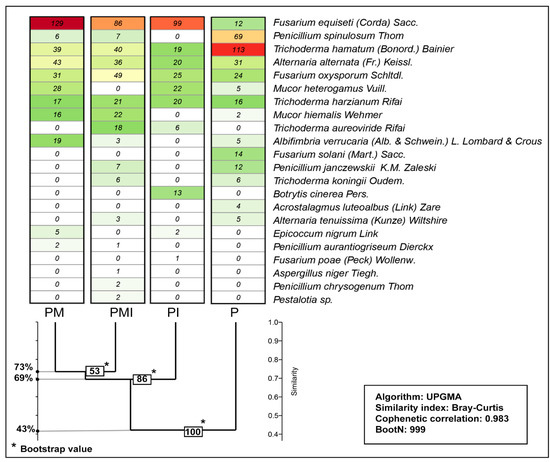
Figure 1.
Similarity index of the fungal communities colonizing the rhizosphere of plants as a response to pepper mycorrhization and irrigation in the years 2016–2018. P—plants without mycorrhizal inoculation and irrigation (absolute control), PM—mycorrhized plants, PI—irrigated plants, and PMI—mycorrhized and irrigated plants; red color—higher number of fungi in the community and green color—lower number of fungi in the community.
Among the phytopathogenic fungi, the Fusarium genus deserves special attention. More colonies of Fusarium spp. were isolated from the rhizosphere of mycorrhized plants (PM—160 and PMI—135) than from the rhizosphere non-mycorrhized plants (P—50 and PI—135) (Figure 1). F. oxysporum was most frequently isolated from the rhizosphere of mycorrhized and irrigated peppers (PMI—49) than from mycorrhized peppers (PM—31). F. equiseti occurred more frequently in the rhizospere of mycorrhized plants (PM) than in the other experimental combinations (Figure 1). Among saprotrophs, the most abundant were Trichoderma ssp., Mucor spp., Penicillium spp., Mucor spp., and Alternaria spp. (Figure 1). The colonies of Trichoderma spp. and Penicillium spp. (P. janczewski and P. nigricans) were most frequently isolated from the P samples (Trichoderma spp.—135 and Penicillium spp.—81). The lowest number of Trichoderma spp. colonies inhabited the rhizosphere of irrigated plants (PI—45). Among the saprotrophs, an important group were the fungi of the genus Mucor spp., isolated in high numbers from the rhizosphere of mycorrhized plants (PM—44), and the least numerous from the soil of control plants (P—7) (Figure 1). The greatest similarity between the studied fungal communities was demonstrated for the communities of fungi with mycorrhiza (PM and PMI similarity coefficient 73%). The lowest similarity was recorded between the rhizosphere of the control plants (P) and the other studied communities (similarity coefficient—43%) (Figure 1). These results indicate that the irrigation of plants during the growing season limited the development of fungal colonies, and the application of MF contributed to the increase in their numbers and biodiversity.
3.4. Soil DNA Analysis
Biodiversity indices were calculated on the base of next generation sequencing (NGS) of the internal transcribed spacer (ITS) fragment (Table 3). The highest value of the Shannon index (H’) was found in combinations with the applied plant mycorrhization (PM and PMI), regardless of the applied irrigation or its absence. Moreover, the highest value of the Fisher index was also found in the PMI sample with mycorrhization and irrigation.
Table 3.
Biodiversity indices evaluated by ITS NGS (internal transcribed spacer, next generation sequencing).
The results of NGS of the ITS fragment also showed significant differences in the sequence proportions of individual orders of fungi applying individual experimental factors. A significant effect of irrigation on the biodiversity of fungi was shown at the genus level. Comparing the P and PI samples, a significant percentage increase in the sequence contents of the following orders was found for irrigation: Solicoccozymas, Ascobolus, Mortierella, Exophiala, Peziza, and Verticillum. On the other hand, in the absence of irrigation (P), a significant percentage increase in the number of sequences of the following orders was recorded: Sordalia, Podospora, and Gibberella (Figure 2a). When comparing the samples without irrigation and with irrigation with the applied mycorrhization (PM and PMI), significant differences were also found in the number of sequences obtained from the NGS analysis for individual orders of fungi. The use of irrigation with simultaneous plant mycorrhization (PMI) resulted in a significant increase in the presence of such orders as Mortierella, Ascobolus, Pseudogymnoascus, Acremonium, and Verticillium (Figure 2b). However, we could find significant differences in individual fungal orders when comparing the presence of individual orders of fungi between the combination of samples P (absolute control) and the use of mycorrhization (PM). Plant mycorrhization, compared to the control, resulted in a significant increase of the following genera in the plant rhizosphere: Mortierella, Pseudogymnoascus, Mucor, Trichoderma, Conocybe, Pseudaleuria, and Acremonium (Figure 2c).
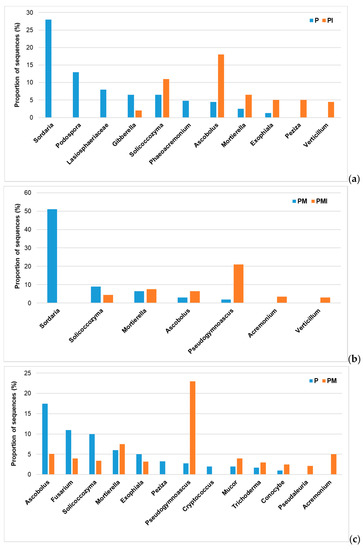
Figure 2.
Proportion of sequences (%) of the main fungal genera. (a) Comparison of fungal genera between the rhizospheres of plants without mycorrhizal inoculation and irrigation (absolute control—P) and irrigated plants (PI). (b) Comparison of fungal genera between the rhizospheres of mycorrhized plants (PM) and mycorrhized and irrigated plants (PMI). (c) Comparison of fungal genera between the rhizospheres of control plants (P) and mycorrhized plants (PM).
3.5. Biolog EcoPlates Analysis
Since the highest activity in the utilization of different carbon compounds in all analyzed soils was found after 96 h of incubation, we focused on the presentation of data from this time point. The value of the average well color development (AWCD) indicator remained at the same level after 96 h (Figure 3). This meant that most of the substrates were already used up by that time.
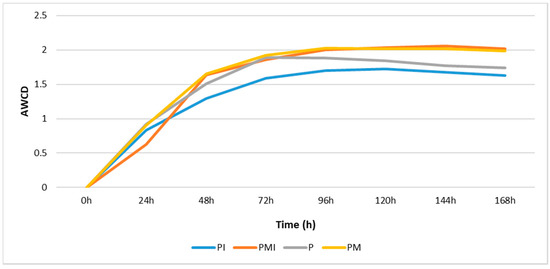
Figure 3.
Average well color development (AWCD) estimated by substrate utilization over the period from 24 to 168 h in Biolog EcoPlates calculated based on the data from all 31 carbon sources.
The functional biodiversity of the soil microorganisms is presented in Figure 4. The highest utilization of amines and amides was obtained in samples PM and PMI (Figure 4a). Similar results were obtained for the P and PI samples. The significant percent of utilization of amino acid was confirmed in the rhizosphere soil of PM and PMI (Figure 4b), and the lowest percent of utilization of amines and amides was obtained in the P and PI samples. A similar result was obtained for the case percentage of the utilization of carboxylic acid (Figure 4c); the significant percentage of the use of carbohydrates was obtained in the P sample (Figure 4d). The lowest percentage of polymer utilization was found in the P sample (Figure 4e,f).
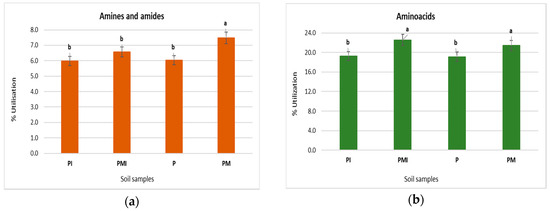
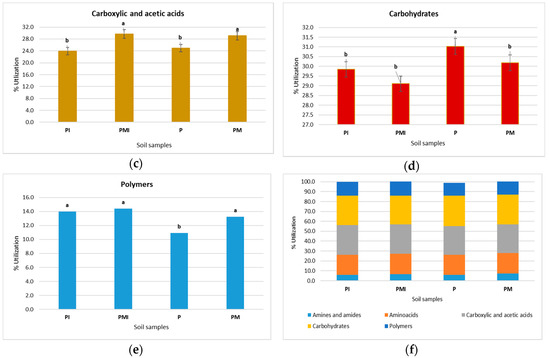
Figure 4.
The percent of utilization of amines and amides, amino acids, carbohydrate, carboxylic acid, and polymers after 96-h incubation of Biolog EcoPlates. (a) Amines and amides, (b) amino acids, (c) carboxylic and acetic acids, (d) carbohydrates, (e) polymers, and (f) the percentage of total carbon source utilization in the soil. Treatment means separated by different letters are significantly different (Tukey’s mean separation test, p ≤ 0.05, n = 3).
A heatmap of carbon utilization patterns of 31 substrates from Biolog EcoPlates was obtained based on the results after 96 h of the study (Figure 5). The highest functional biodiversity and metabolic activity of the microorganisms were observed in soils from the PMI and PM samples. The lower functional activity were presented in the P and PI samples (Figure 5).
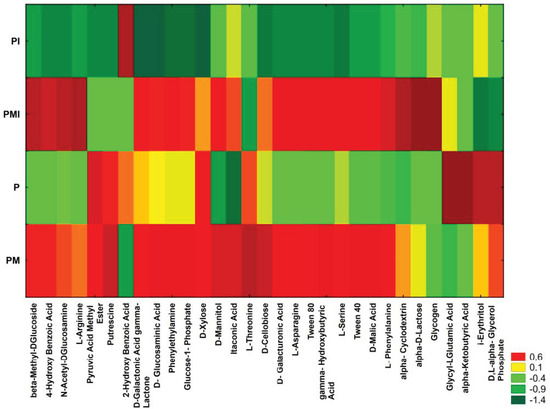
Figure 5.
The carbon utilization patterns (31 substrates) in the soil samples. The results are shown as the standardized data of the absorbance measurements at a wavelength of 590 nm after a 96-h incubation of EcoPlates (red—higher functional activity and green—lower functional activity).
Soil functional diversity indices were calculated based on the use of 31 carbon sources in the Biolog EcoPlates method after 96 h of incubation (Table 4). The soils originating from the PMI (AWCD = 2.006) and PM samples (AWCD = 2.028) were characterized by the highest values of the average well color development functional diversity indicator, in contrast to the PI sample, where the lowest functional diversity index (AWCD = 1.702) was recorded. As regards the Shannon-Wiener, Evenness, and Richness indices, there were no statistically significant differences between the cultivars.
Table 4.
Functional diversity indices evaluated based on substrate utilization after 96 h in Biolog EcoPlates calculated for the data from all 31 carbon sources (±SD). Different letters indicate significant differences between the cultivars (p ≤ 0.05, n = 3).
The PCA analysis of the selected indices of the functional community of soil microorganisms is presented in Figure 6. The PCA analysis confirmed strong positive correlations between the amino acids, amines and amides, AWCD, Shannon-Wiener index, and Richness indices basics obtained from the Biolog EcoPlates analysis (PCA analysis confirmed that the soils collected from the PM and PMI samples were characterized by a higher functional and metabolic activity. The samples collected from P and PI showed a lower functional activity of the microorganisms.
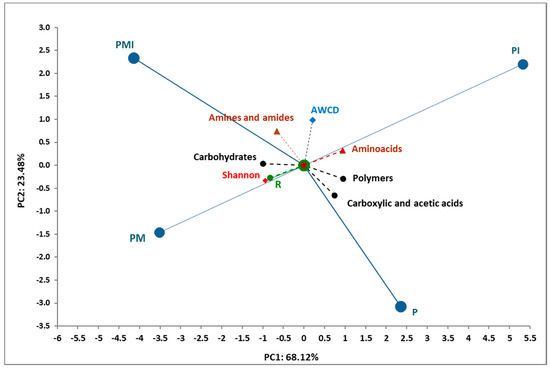
Figure 6.
Principal component analysis of the microbial parameters, biodiversity indices, and Biolog EcoPlates data from soil samples incubated for 120 h.
4. Discussion
The biotic component of the soil is important for maintaining its good condition [41]. The microbial component of the soil is responsible for countless functions, especially reactions mediated by microbes, humus formation, nutrient cycling, xenobiotic degradation, soil structure improvement, and effects on plant health [42]. Certain soil microorganisms are biocontrol factors for phytopathogens and frequently show synergism of the protective effect on plants with MF. Hyphae of mycorrhizal fungi participate in shaping the soil structure. These beneficial microorganisms, by changing the composition and quantity of root exudates, affect the development and activity of soil microorganisms [21]. Mycorrhiza causes changes in the quantity and quality of root exudates [23,43]. Soil enzyme activity was shown to directly affect the available nutrient content in the rhizospheric soil [44], which, in turn, provided soil microbes to increase the enzyme activities of the soil [15]. Based on the activity parameters of various soil enzymes, including catalase, it is possible to reliably assess the biological quality of the soil, the occurrence of stress factors, or the level of the agricultural quality of the producer. Research has shown that the enzymatic activity of anthropogenically transformed soil is influenced by agrotechnical factors (type and level of fertilization, cultivation system, and soil and climate conditions) [6]. The rhizosphere is an environment of mutual interactions of microorganisms and plants. The interdependence of higher plants and rhizospheric microorganisms largely consists in the exchange of specific chemical substances [45,46,47]. Therefore, the enzymatic activity of the rhizosphere is significantly higher than that of the non-rhizosphere zone [13,48], which was also confirmed by our study. Plant mycorrhization has a significant impact on the activity of catalase in the soil. Symbiotic plants produce more enzymes as a result of excess carbon production in direct carbohydrate photosynthesis [49]. Our research demonstrated that stress caused by drought contributes to the increase of catalase activity, and mycorrhizal inoculation is a factor that significantly reduces it. This means that plant mycorrhization can alleviate stress, e.g., related to drought. Therefore, mycorrhizal fungi have a beneficial effect on the absorption of water and nutrients by plants, and they also enhance plant defense mechanisms to alleviate oxidative stress [50]. Plant ages also affect the soil catalase activity, which is most likely dictated by energy reasons [50]. The assessment of this enzyme activity in various plant developmental stages is a good marker of physiological stresses occurring in the plant [51].
Root exudates and plant residues are the main source of carbon for heterotrophic microorganisms, determines the rhizosphere function, and activates rhizosphere microorganisms and their metabolites [52,53,54]. Additionally, mycorrhiza can induce qualitative and quantitative changes in root exudates in rhizospheric soil in a different manner, thereby exerting an indirect effect on rhizospheric microorganisms [15]. Our research showed that mycorrhizal fungi and irrigation change the composition of rhizosphere microorganisms. A much higher total number of fungi in the rhizosphere was observed after irrigation. Mycorrhizal inoculation, on the other hand, contributed to the reduction of the number of fungi colonizing the roots of pepper plants. A similar relationship was also found for the total number of bacteria, including the population of Bacillus spp. and Pseudomonas spp. in the pepper rhizosphere. Information present in the literature has indicated that root border cells (RBC) could be, among others, the factor shaping the microorganism populations inhabiting the root zone and participating in interactions between plants and soil microorganisms [55]. These are living cells that are released during root growth from the outermost layer of the cap into the soil, formerly known as dead, exfoliated cap cells. According to researchers [56,57,58], metabolites secreted by RBC into the environment stimulate or inhibit the growth of rhizosphere microorganisms. Metabolites synthesized by RBC and secreted outside the cells include polysaccharides that facilitate root apex penetration into the soil; proteins with enzymatic activity; biocides; regulators of cell division; and attractants for bacteria, fungi, and nematodes [55]. MF affect the development and activity of soil microorganisms, among others, by changing the composition of plant root exudates [59]. In our study, mycorrhizal inoculation and applicated irrigation had beneficial effects on the growth of fungi in the soil communities. Jamiołkowska et al. [22] showed that the application of Claroideoglomus etunicatum on tomato roots contributed to an increase in the number of soil fungi, particularly regarding the number of saprotrophs in the rhizosphere. The present study also showed that irrigation (PI) increased the number of fungi in the community, but no such correlation was observed in the case of bacteria. Contacts between MF and the plant can also be supported by metabolites of soil microorganisms, especially certain saprotrophic bacteria and fungi (Mycorrhizal helper bacteria) [60]. Our research showed that the mycorrhizal inoculation caused a significant decrease in the total count of bacteria in the rhizosphere, including the antagonistic bacteria of the genera Bacillus and Pseudomonas. These bacteria and fungi (especially Trichoderma spp.) have a considerable influence on plant health [61,62,63]. They inhibit the growth and development of phytopathogens in the soil through antibiosis, competition, and parasitism [64,65,66]. Those microorganisms produce antibiotics that decompose cell walls and lysis of the mycelium [64,67,68]. In addition, the effectiveness of bacteria in reducing the population of rhizospheric fungi is related to the action of secondary metabolites such as iron-complexing compounds (siderophores), substances inducing plant resistance (salicylic and anthranilic acids), enzymes degrading fungal cell wall components (glucanases and endochitinases), and hormonal substances [69,70,71]. The analysis of soil DNA allowed to obtain fungal genera that are difficult to cultivate on artificial substrates and to more precisely determine the fungal profiles in the tested soil. The results were similar to the classical mycological analysis and confirmed the increase in soil environment biodiversity after plant mycorrhization (a higher number of saprotrophic fungi with antagonistic abilities).
Measurements of the physiological profiles at the level of soil microbial communities can be used as an indication of biological activity and natural biochemical processes in soil [72]. Biolog EcoPlates is a sensitive and reliable indicator of the number of living microorganisms and present bacterial and fungal community compositions. The number of different groups of microorganisms is a marker of changes occurring in the soil [73,74]. In the presented study, high activity in the metabolic profile was noted in soil samples for the plants with MF and irrigation (PMI) and plants with MF (PM). These results indicate a higher activity and biodiversity in the plant rhizosphere after MF application. Many studies focused on a higher fungal diversity in mycorrhizal soils compared to control soils without mycorrhiza. In the study, we showed that the PM and PMI rhizospheric soils had significantly higher biodiversity. However, a higher percentage of fungi was found in the PM and PMI soils. Therefore, it should be concluded that mycorrhization is largely responsible for the increase in biodiversity and microbial activity [75].
This research is essential for the development of new strategies for the sustainable agriculture, understood as reducing the use of chemical products and an increase in soil health and fertility.
5. Conclusions
The results of the present study showed various effects of mycorrhizal inoculation and irrigation on the biological properties of the rhizosphere of sweet peppers cultivated in the organic system. The application of mycorrhiza in the presence of drought stress significantly increased the catalase activity in the pepper rhizosphere, i.e., an enzyme that reduces the effects of oxidative stress in plants. Our study showed the significant impact of mycorrhiza on the reduction of the total number of bacteria in the plant rhizosphere, while irrigation increased the total number of rhizosphere fungi, regardless of plant mycorrhization. Promising results were obtained in the metagenomic studies, which showed an increase in the biodiversity of rhizosphere fungi after mycorrhiza application (especially Trichoderma spp., Mucor spp., Acremonium spp., and Mortierella spp.), despite the stress caused by the lack of irrigation (drought stress). The conducted research indicated the highest utilization of amines, amides, and amino acids in the rhizosphere of mycorrhized plants, whereas the lowest level of utilization was recorded in the soil without mycorrhiza. An increase in metabolic activity was also observed in the rhizospheric soils of mycorrhized plants and a slightly lower catabolic activity of the rhizosphere in non-mycorrhized plants. Plant mycorrhization improves the biological properties of the rhizosphere, especially under drought stress conditions, which occur increasingly often due to climate warming. It also affects the quality of the vegetables produced without the pesticides, which is required in organic farming.
Author Contributions
Conceptualization, A.J., B.S.-B., and H.B.; methodology, A.J., E.P., A.G., and H.B.; software, A.G., J.G., M.K., and B.S.-B.; validation, A.J.; formal analysis, A.J., E.P., B.S.-B., M.K., A.G., and J.G.; investigation, A.J.; resources, A.J., A.G., E.P., and B.S.-B.; data curation, A.G. and A.J.; writing—original draft preparation, A.J. and B.S.-B.; writing—review and editing, A.J.; visualization, A.J.; supervision, A.J.; project administration, A.J.; and funding acquisition, A.J., A.G., and H.B. All authors have read and agreed to the published version of the manuscript.
Funding
This research was funded by the University of Life Sciences in Lublin, Poland (project OKK/DS/1 in 2016–2018).
Conflicts of Interest
The authors declare no conflict of interest.
References
- Anderson, T.A.; Guthrie, E.A.; Walton, B.T. Bioremediation in the rhizosphere. Environ. Sci. Technol. 1993, 27, 2630–2636. [Google Scholar] [CrossRef]
- Leśniak, A. Zmiany aktywności mikrobiologicznej i enzymatycznej w glebie skażonej węglowodorami aromatycznymi pod wpływem szczepienia kostrzewy łąkowej Pseudomonas stutzeri i Azospirillum spp. Zeszyty Naukowe Akademii Rolniczej im. Hugona Kołłątaja Krakowie 2007, 93, 463–472. [Google Scholar]
- Wallenstein, M.D.; Weintraub, M.N. Emerging tools for measuring and modeling thein situ activity of soil extracellular enzymes. Soil Biol. Biochem. 2008, 40, 2098–2106. [Google Scholar] [CrossRef]
- Woźniak, M.; Gałązka, A. The rhizosphere microbiome and its beneficial effects on plants—Current knowledge and perspectives. Adv. Microbiol. 2019, 58, 59–69. [Google Scholar] [CrossRef]
- Brzezińska, M.; Włodarczyk, T. Enzymy wewnątrzkomórkowych przemian redoks (oksydoreduktazy). Acta Agrophysica 2005, 120, 11–22. [Google Scholar]
- Martyn, W.; Skwaryło-Bednarz, B. Właściwości biologiczne gleb lekkich występujących w rejonie Roztoczańskiego Parku Narodowego. Acta Agrophysica 2005, 5, 695–704. [Google Scholar]
- Turski, M.; Wyczółkowski, A. Wpływ zróżnicowanego użytkowania gleb wytworzonych z lessu na aktywność respiracyjną i dehydrogenaz. Acta Agrophysica 2008, 12, 801–811. [Google Scholar]
- Skwaryło-Bednarz, B. Influence of contamination of soil with copper on the activity of dehydrogenases in areas where amaranthus is cultivated. Ecol. Chem. Eng. A 2012, 19, 155–160. [Google Scholar]
- Lemanowicz, J.; Koper, J. Aktywność fosfatazy i zawartość fosforu w glebie spod wybranych roślin uprawnych nawożonych gnojowicą. Proc. ECOpole 2012, 6, 239–243. [Google Scholar] [CrossRef]
- Bartkowiak, A.; Lemanowicz, J. Właściwości chemiczne wybranych profili glebowych Basenu Unisławskiego na tle aktywności enzymatycznej. Nauka Przyr. Technol. 2012, 6, 43–54. [Google Scholar]
- Garcıa-Gil, J.C.; Plaza, C.; Soler-Rovira, P.; Polo, A. Long-term effects of municipal solid waste compost application on soil enzyme activities and microbial biomass. Soil Biol. Biochem. 2000, 32, 1907–1913. [Google Scholar] [CrossRef]
- Oudah, H.K.; Jawad, M.M.; Abed, E.H. Role of enzymes catalase, peroxidase and amino acid (proline) in Raphanus sativus and Lepidium sativus in exposure levels different water pollution of ion lead. Iraqi J. Sci. 2017, 58, 592–599. [Google Scholar]
- Skwaryło-Bednarz, B.; Krzepiłko, A. Effect of different fertilization on enzyme activity in rhizosphere and non-rhizosphere of amaranth. Int. Agrophys. 2009, 23, 409–412. [Google Scholar]
- Epangesti, N.; Pineda, A.; Pieterse, C.M.J.; Dicke, M.; Van Loon, J. Two-way plant mediated interactions between root-associated microbes and insects: From ecology to mechanisms. Front. Plant Sci. 2013, 4, 414. [Google Scholar] [CrossRef]
- Vázquez, M.M.; César, S.; Azcón, R.; Barea, J.M. Interactions between arbuscular mycorrhizal fungi and other microbial inoculants (Azospirillum, Pseudomonas, Trichoderma) and their effects on microbial population and enzyme activities in the rhizosphere of maize plants. Appl. Soil Ecol. 2000, 15, 261–272. [Google Scholar] [CrossRef]
- Woźniak, M.; Gałązka, A.; Grządziel, J.; Głodowska, M. The identification and genetic diversity of endophytic bacteria isolated from selected crops. J. Agric. Sci. 2018, 156, 547–556. [Google Scholar] [CrossRef]
- Monther, M.T.; Kamaruzaman, S.; Tahat, M.M.; Sijam, K. Arbuscular mycorrhizal fungi and plant root exudates bio-communications in the rhizosphere. Afr. J. Microbiol. Res. 2012, 6, 7295–7301. [Google Scholar] [CrossRef]
- Łyszcz, M.; Gałązka, A. Wybrane metody molekularne wykorzystywane w ocenie bioróżnorodności mikroorganizmów glebowych. Post. Mikrobiol. 2016, 55, 309–319. [Google Scholar]
- Łyszcz, M.; Gałązka, A. Genetyczne metody różnicowania mikroorganizmów w systemie gleba-roślina. Post. Mikrobiol. 2017, 56, 341–352. [Google Scholar] [CrossRef]
- Jamiołkowska, A.; Buczkowska, H.; Thanoon, A.H. Effect of biological preparations on health state of pepper fruits and content of saccharides. Acta Sci. Pol. Hortorum Cultus 2016, 15, 95–107. [Google Scholar]
- Jamiołkowska, A.; Księżniak, A.; Hetman, B.; Kopacki, M.; Skwaryło-Bednarz, B.; Gałązka, A.; Thanoon, A.H. Interactions of arbuscular mycorrhizal fungi with plants and soil microflora. Acta Sci. Pol. Hortorum Cultus 2017, 16, 89–95. [Google Scholar] [CrossRef]
- Jamiołkowska, A.; Thanoon, A.H.; Patkowska, E.; Grządziel, J. Impact of AMF Claroideoglomus etunicatum on the structure of fungal communities in the tomato rhizosphere. Acta Mycol. 2019, 54, 1–7. [Google Scholar] [CrossRef]
- Jakobsen, I.; Smith, S.E.; Smith, F.A. Function and diversity of arbuscular mycorrhizae in carbon and min-eral nutrition. In Mycorrhizal Ecology; Van der Heijden, M.G.A., Sanders, R., Eds.; Springer: Berlin/Heidelberg, Germany, 2003; pp. 75–92. [Google Scholar]
- Buczkowska, H. Badania Nad Modyfikacją Mikroklimatu w Polowej Uprawie Papryki Słodkiej (Capsicum Annuum L.) Ser; Wyd.—Rozp. Nauk; Wydawnictwa Akademii Rolniczej: Lublin, Poland, 1996; p. 73. [Google Scholar]
- Johnson, J.L.; Temple, K.L. Some Variables Affecting the Measurement of “Catalase Activity” in Soil. Soil Sci. Soc. Am. J. 1964, 28, 207–209. [Google Scholar] [CrossRef]
- Patkowska, E.; Błażewicz-Woźniak, M. The microorganisms communities in the soil under the cultivation of carrot (Daucus carota L.). Acta Sci. Pol. Hortorum Cultus 2014, 13, 103–115. [Google Scholar]
- Patkowska, E.; Konopiński, M. Antagonistic bacteria in the soil after cover crops cultivation. Plant Soil Environ. 2014, 60, 69–73. [Google Scholar] [CrossRef]
- Martyniuk, S.; Masiak, D.; Stachyra, A.; Myśków, W. Populations of the root zone microorganisms of various grasses and their antagonism towards Gaeumannomyces graminis var. tritici. Pamiętnik Puławski 1991, 98, 139–144. [Google Scholar]
- Czaban, J.; Gajda, A.; Wróblewska, B. The mobility of bacteria from rhizosphere and different zones of winter wheat roots. Pol. J. Environ. Stud. 2007, 16, 301–308. [Google Scholar]
- Patkowska, E.; Krawiec, M. Yielding and healthiness of pea cv. ‘Sześciotygodniowy TOR’ after applying biotechnical preparations. Acta Sci. Pol. Hortorum Cultus 2016, 15, 143–156. [Google Scholar]
- Schmidt, P.-A.; Bálint, M.; Greshake, B.; Bandow, C.; Römbke, J.; Schmitt, I. Illumina metabarcoding of a soil fungal community. Soil Biol. Biochem. 2013, 65, 128–132. [Google Scholar] [CrossRef]
- Weber, K.P.; Legge, R.L. One-dimensional metric for tracking bacterial communitydivergence using sole carbon source utilization patterns. J. Microbiol. Methods 2009, 79, 55–61. [Google Scholar] [CrossRef]
- Kolde, R. Pheatmap: Pretty Heatmaps. R Package Version 1.0.12. 2019. Available online: https://CRAN.R-project.org/package=pheatmap (accessed on 28 September 2020).
- R Core Team. R: A Language and Environment for Statistical Computing. 2018. Available online: https://www.r-project.org/ (accessed on 13 February 2012).
- Rivers, A.; Weber, K.C.; Gardner, T.G.; Liu, S.; Armstrong, S.D. ITSxpress: Software to rapidly trim internally transcribed spacer sequences with quality scores for marker gene analysis. F1000Research 2018, 7, 1418. [Google Scholar] [CrossRef] [PubMed]
- Callahan, B.J.; McMurdie, P.J.; Rosen, M.J.; Han, A.W.; A Johnson, A.J.; Holmes, S.P. DADA2: High-resolution sample inference from Illumina amplicon data. Nat. Methods 2016, 13, 581–583. [Google Scholar] [CrossRef]
- Nilsson, R.H.; Larsson, K.-H.; Taylor, A.F.S.; Bengtsson-Palme, J.; Jeppesen, T.S.; Schigel, D.; Kennedy, P.; Picard, K.; Glöckner, F.O.; Tedersoo, L.; et al. The UNITE database for molecular identification of fungi: Handling dark taxa and parallel taxonomic classifications. Nucleic Acids Res. 2018, 47, D259–D264. [Google Scholar] [CrossRef] [PubMed]
- Murali, A.; Bhargava, A.; Wright, E.S. IDTAXA: A novel approach for accurate taxonomic classification of microbiome sequences. Microbiome 2018, 6, 1–14. [Google Scholar] [CrossRef]
- McMurdie, P.J.; Holmes, S. phyloseq: An R Package for Reproducible Interactive Analysis and Graphics of Microbiome Census Data. PLoS ONE 2013, 8, e61217. [Google Scholar] [CrossRef]
- Hammer, O.; Harper, D.A.T.; Ryan, P.D. PAST: Paleontological statistics software package for education and data analysis. Palaeontol. Electron. 2001, 4, 1–9. [Google Scholar]
- Doran, J.W.; Zeiss, M.R. Soil health and sustainability: Managing the biotic component of soil quality. Appl. Soil Ecol. 2000, 15, 3–11. [Google Scholar] [CrossRef]
- Nannipieri, P.; Ascher, J.; Ceccherini, M.T.; Landi, L.; Pietramellara, G.; Renella, G. Microbial diversity and soil functions. Eur. J. Soil Sci. 2003, 54, 655–670. [Google Scholar] [CrossRef]
- Qiu, L.; Bi, Y.; Jiang, B.; Wang, Z.; Zhang, Y.; Zhakypbek, Y. Arbuscular mycorrhizal fungi ameliorate the chemical properties and enzyme activities of rhizosphere soil in reclaimed mining subsidence in northwestern China. J. Arid. Land 2018, 11, 135–147. [Google Scholar] [CrossRef]
- He, X.; Li, Y.; Zhao, L. Dynamics of arbuscular mycorrhizal fungi and glomalin in the rhizosphere of Artemisia ordosica Krasch. in Mu Us sandland, China. Soil Biol. Biochem. 2010, 42, 1313–1319. [Google Scholar] [CrossRef]
- Wielgosz, E.; Szember, A. Wpływ wybranych roślin na liczebność i aktywność drobnoustrojów glebowych. Ann. UMCS Sec. E 2006, 61, 107–119. [Google Scholar]
- Lamb, C.J.; Dixon, R.A. Molecular communication in interactions between plants and microbial pathogens. Plant Physiol. Plant Mol. Biol. 1990, 41, 339–367. [Google Scholar]
- Bielińska, E.J. Aktywność enzymów glebowych w ryzosferze mniszka lekarskiego jako wskaźnik stanu ekochemicznego gleb miejskich. J. Res. Appl. Agric. Eng. 2007, 52, 10–14. [Google Scholar]
- Romanowicz, A.; Krzepiłko, A. Porównanie aktywności katalazy w różnych organach maliny powtarzającej Rubus idaeus L. odmiany Polana oraz w glebie pod jej uprawą, oznaczanej metodą wolumetryczną. Pol. J. Agron. 2013, 15, 49–53. [Google Scholar]
- Orwin, K.H.; Kirschbaum, M.U.F.; John, M.G.S.; Dickie, I.A. Organic nutrient uptake by mycorrhizal fungi enhances ecosystem carbon storage: A model-based assessment. Ecol. Lett. 2011, 14, 493–502. [Google Scholar] [CrossRef]
- Mayer, Z. Impact of arbuscular mycorrhizal fungi on some defense enzyme activities at an early stage of maize (zea mays. L.) under different abiotic stresses. Appl. Ecol. Environ. Res. 2019, 17, 6241–6253. [Google Scholar] [CrossRef]
- Szymczak, J.; Kłódka, D.; Smolik, B.; Pawlica, M. Wpływ soli kadm u na aktywność enzymów stresu oksydacyjnego w glebie i kukurydzy (Zea mays var. Saccharata). Ochr. Środ. Zasob. Natur. 2011, 48, 210–215. [Google Scholar]
- Barea, J.; Pozo, M.J.; Azcón, R.; Azcón-Aguilar, C. Microbial co-operation in the rhizosphere. J. Exp. Bot. 2005, 56, 1761–1778. [Google Scholar] [CrossRef]
- Nihorimbere, V.; Ongena, M.; Smargiassi, M.; Thonart, P. Bene-ficial effect of the rhizosphere microbial community for plant growth and health. Biotechnol. Agron. Société et Environ. 2011, 15, 327–337. [Google Scholar]
- Mitter, B.; Pfaffenbichler, N.; Sessitsch, A. Plant–microbe partnerships in 2020. Microb. Biotechnol. 2016, 9, 635–640. [Google Scholar] [CrossRef]
- Jaroszuk-Ściseł, J.; Kurek, E.; Rodzik, B.; Winiarczyk, K. Interactions between rye (Secale cereale) root border cells (RBCs) and pathogenic and nonpathogenic rhizosphere strains of Fusarium culmorum. Mycol. Res. 2009, 113, 1053–1061. [Google Scholar] [CrossRef] [PubMed]
- Hirsch, A.M.; Bauer, W.D.; Bird, D.M.; Cullimore, J.; Tyler, B.; Yoder, J.I. Molecular signals and receptors: Controlling rhizosphere interactions between plants and other organisms. Ecology 2003, 84, 858–868. [Google Scholar] [CrossRef]
- Bais, H.P.; Park, S.-W.; Weir, T.L.; Callaway, R.M.; Vivanco, J.M. How plants communicate using the underground information superhighway. Trends Plant Sci. 2004, 9, 26–32. [Google Scholar] [CrossRef]
- Tamas, L.; Šimonovičová, M.; Huttová, J. Mistríki Changes in the composition of cell wall proteins in barley roots during germination and growth in aluminium presence. Plant Soil Environ. 2011, 49, 327–331. [Google Scholar] [CrossRef]
- Bücking, H.; Abubaker, J.; Govindarajulu, M.; Tala, M.; Pfeffer, P.E.; Nagahashi, G.; Lammers, P.; Shachar-Hill, Y. Root exudates stimulate the uptake and metabolism of organic carbon in germinating spores ofGlomus intraradices. New Phytol. 2008, 180, 684–695. [Google Scholar] [CrossRef]
- Joseph, P.J.; Sivaprasad, P. The Potential of Arbuscular Mycorrhizal Associations for Biocontrol of Soil-Born Diseases; Springer Science and Business Media LLC: New York, NY, USA, 2000; pp. 139–153. [Google Scholar]
- Leelavathi, M.S.; Vani, L.; Reena, P. Antimicrobial activity of Trichoderma harzianum against bacteria and fungi. Int. J. Curr. Microbiol. Appl. Sci. 2014, 3, 96–103. [Google Scholar]
- Reddy, B.N.; Saritha, K.V.; Hindumathi, A. In vitro screening for antagonistic potential of seven species of Trichoderma against different plant pathogenic fungi. Res. J. Biol. 2014, 2, 29–36. [Google Scholar]
- Elżbieta, P.; Agnieszka, J.; Marzena, B.-W. Antagonistic activity of selected fungi of the soil environment of carrot. Plant, Soil Environ. 2018, 64, 58–63. [Google Scholar] [CrossRef]
- Adhikari, A.; Dutta, S.; Nandi, S.; Bhattacharya, I.; De Roy, M.; Sarkar, G.; Mandal, T. Antagonistic potentiality of native rhizobacterial isolates against root rot disease of okra, incited by Rhizoctonia solani. Afr. J. Agric. Res. 2013, 8, 405–412. [Google Scholar] [CrossRef]
- Ritika, B.; Utpal, D. An overview of fungal and bacterial biopesticides to control plant pathogens/diseases. Afr. J. Microbiol. Res. 2014, 8, 1749–1762. [Google Scholar] [CrossRef]
- Kumar, M.M.; Singh, R.; Tomer, A. In vitro evaluation of antagonistic activity of Pseudomonas fluorescens against fungal pathogen. J. Biopestic. 2014, 7, 43–46. [Google Scholar]
- Sarma, B.K.; Yadav, S.K.; Patel, J.S.; Singh, H.B. Molecular Mechanisms of Interactions of Trichoderma with other Fungal Species. Open Mycol. J. 2014, 8, 140–147. [Google Scholar] [CrossRef]
- Smitha, C.; Finosh, G.T.; Rajesh, R.; Abraham, P.K. Induction of hydrolytic enzymes of phytopathogenic fungi in response to Trichoderma viride influence biocontrol activity. Int. J. Curr. Microbiol. Appl. Sci. 2014, 3, 1207–1217. [Google Scholar]
- Manwar, A.V.; Vaiganker, P.D.; Bhonge, L.S.; Chincholkar, S.B. In vitro suppression of plant pathogens by siderophores of fluorescent Pseudomonas. Ind. J. Microbiol. 2000, 40, 109–112. [Google Scholar]
- Dehestani, A.; Kazemitabar, K.; Ahmadian, G.; Jelodar, N.B.; Salmanian, A.H.; Seyedi, M.; Rahimian, H.; Ghasemi, S. Chitinolytic and antifungal activity of a Bacillus pumilus chitinase expressed in Arabidopsis. Biotechnol. Lett. 2009, 32, 539–546. [Google Scholar] [CrossRef] [PubMed]
- Pedersen, A.L.; Ekelund, F.; Johansen, A.; Winding, A. Interaction of bacteria-feeding soil flagellates and Pseudomonas spp. Biol. Fertil. Soils 2009, 46, 151–158. [Google Scholar] [CrossRef]
- Frąc, M.; Hannula, S.E.; Bełka, M.; Jędryczka, M. Fungal Biodiversity and Their Role in Soil Health. Front. Microbiol. 2018, 9, 1–9. [Google Scholar] [CrossRef]
- Anna, G.; Karolina, G.; Jarosław, G.; Jerzy, K. Effect of different agricultural management practices on soil biological parameters including glomalin fraction. Plant Soil Environ. 2017, 63, 300–306. [Google Scholar] [CrossRef]
- Gałązka, A.; Grządziel, J.; Gałązka, R.; Gawryjołek, K.; Ukalska-Jaruga, A.; Smreczak, B. Fungal Community, Metabolic Diversity, and Glomalin-Related Soil Proteins (GRSP) Content in Soil Contaminated With Crude Oil After Long-Term Natural Bioremediation. Front. Microbiol. 2020, 11, 572314. [Google Scholar] [CrossRef]
- Zhang, X.; Ye, L.; Kang, Z.; Zou, J.; Li, X. Mycorrhization of Quercus acutissima with Chinese black truffle significantly altered the host physiology and root-associated microbiomes. PeerJ 2019, 7, e6421. [Google Scholar] [CrossRef]


Publisher’s Note: MDPI stays neutral with regard to jurisdictional claims in published maps and institutional affiliations. |
© 2020 by the authors. Licensee MDPI, Basel, Switzerland. This article is an open access article distributed under the terms and conditions of the Creative Commons Attribution (CC BY) license (http://creativecommons.org/licenses/by/4.0/).