Abstract
Agriculture needs solutions for adapting crops to increasing salinity globally. Research on physiological and molecular responses activated by salinity is needed to elucidate mechanisms of salinity tolerance. Transcriptome profiling (RNA-Seq) is a powerful tool to study the transcriptomic profile of genotypes under stress conditions. Persimmon species have different levels of tolerance to salinity, this variability may provide knowledge on persimmon species and development of salt--tolerant rootstocks. In this study, we conducted a physiological and transcriptomic profiling of roots and leaves in tolerant and sensitive plants of persimmon rootstock grown under saline and control conditions. Characterization of physiological responses along with gene expression changes in roots and leaves allowed the identification of several salt tolerance mechanisms related to ion transport and thermospermine synthesis. Differences were observed in putative H+/ATPases that allow transmembrane ionic transport and chloride channel protein-like genes. Furthermore, an overexpression of thermospermine synthase found in the roots of tolerant plants may indicate that alterations in root architecture could act as an additional mechanism of response to salt stress. These results indicate that Diospyros lotus L. exhibits genetically-controlled variability for salt tolerance traits which opens potential opportunities for breeding salt-tolerant persimmon rootstocks in a Mediterranean environment challenged by drought and salinity.
1. Introduction
Drought and salinity are two of the main challenges in agriculture. Reduction of water availability and increase of salinity in soils and water reservoirs can limit crop production due to severe inhibition of plant growth and development via osmotic and ionic stresses [1,2]. The negative effect of salinity in photosynthesis is caused either by a reduction in available water, by the toxic accumulation of ions in the cell, or both. Furthermore an attenuated photosynthesis leads to an increase in reactive oxygen species (ROS) and a consequent oxidative damage of the cells [3]. The cultivated surface affected by either stress increases year after year as a consequence of more frequent drought episodes associated to climate change. Among the affected areas, the Mediterranean basin registered a significant increase in salinity in soils and water reservoirs in the last 10 years [4]. Therefore, there is a pressing need to find solutions to alleviate the negative impact on plant production in an area dominated by fruit tree crops. Controlled crosses and selection (plant breeding) have proved effective to develop new cultivars with improved characteristics such as salinity tolerance in several species [5,6,7,8]. In the case of temperate fruit trees, salinity stress can also be overcome by means of tree grafting on tolerant rootstocks [9]. This method provides a solution for dealing with the two components of salinity stress: the osmotic effect, or water balance loss, through decreasing the area of stomatal aperture via phytohormonal root signaling [10,11] and ionic toxicity, by maintaining the ion homeostasis in the cell of the aerial parts [12]. Furthermore, grafting of existing varieties on rootstocks contributes to avoid losing the current genetic diversity.
Previous studies have contributed knowledge about the molecular mechanisms that regulate plant’s physiological responses to salinity in both model and economically important crops [13,14,15]. Those mechanisms involve changes in gene expression associated with several biological processes such as ionic transport and exchange mechanisms [16], photosynthesis [17], flavonoid biosynthesis [18], ROS scavenging and detoxification [19], ethylene production [20], signaling networks related to abscisic acid (ABA) [21], and protein refolding [22]. Expression of different functional genes related to osmoregulation and cell protection as dehydrins and aquaporins are involved as well in salinity response [22,23,24].
One of the most prompt physiological responses following exposure to saline environments is the differential regulation of growth water balance and uptake, and the activation of different cascades of molecular networks that result in the expression changes of specific stress-related genes, and their encoded metabolites [25,26]. Studies focused on model plants revealed the involvement of several transduction pathways in salt stress response, including saline overly sensitive (SOS) [27], ABA [11], and ethylene signaling pathways [28]. Additional cell wall changes result in differential growth responses required to adapt to saline environments [29]. A significant amount of data concerns the role of plant mitogen-activated protein kinases (MAPKs) in osmoregulation. MAPK cascades are now recognized as major signal transduction mechanisms to regulate gene expression, multiple cell activities and protein functions in various developmental and adaptive processes [30], including salt stress [31]. Ion toxicity caused by Na+ and Cl− accumulation also affects plant photosynthesis, which can lead to leaf and stem necrosis. Mechanisms to limit Na+ uptake and translocation are therefore linked to salinity tolerance. Several genes have been identified in Arabidopsis, such as the Na+/H+ antiporter responsible for the exclusion of sodium from the cytosol [32] in the SOS response pathway. In Arabidopsis thaliana L., the serine/threonine type protein kinase CBL-interacting serine/threonine-protein kinase 24 (SOS2) interacts with the calcium sensor Calcineurin B-like protein 4 (SOS3) to regulate the Na+/H+ antiporter SOS1, thereby conferring salt tolerance [33,34]. Na+/K+ homeostasis in poplar is regulated by CBL-interacting serine/threonine-protein kinase (CIPK) genes which interact with Calcineurin B-like protein 1 (CBL1) [35]. The CIPK genes from wild barley and maize are also known to be implicated in salt tolerance responses [36,37]. Furthermore, in tolerant persimmon species such as Diospyros virginiana L., salt stress tolerance is believed to be caused by a high affinity potassium transporter HKT-1-like gene in roots [38], which was previously described in other species as a key factor in salinity tolerance [39,40,41,42]. Although Na+ ion translocation and regulation mechanisms have previously been reported in several species, little is known about Cl− transport and regulation. It has been suggested that Cl− uptake occurs mainly through passive water intake [2], although chloride channels are also suggested to be able to sequestrate Cl− ions [43]. Chloride accumulation is also especially important in persimmon where it causes a decrease in fruit quality and a shorter post-harvest life [44].
In this study, the main objective is aimed at unravelling the mechanism of salinity tolerance in persimmon rootstock. Persimmon species have different levels of tolerance to salinity, making them an appropriate model to study the mechanisms of salinity tolerance, and to provide potential knowledge of salt-tolerant persimmon species potential for rootstock. Transcriptome profiling (RNA-Seq) using next-generation sequencing technologies has proven a powerful tool to detect changes in gene expression associated to physiological responses to salt stress [45,46,47,48,49]. In this study, we conducted physiological and RNA-Seq analyses of roots and leaves in persimmon rootstocks (Diospyros lotus L.) grown under saline and control conditions.
2. Materials and Methods
2.1. Plant Material and RNA Extraction
A full-sibling family of Diospyros lotus L. (DL) obtained from a cross between two D. lotus trees located at the Instituto Valenciano de Investigaciones Agrarias (IVIA) persimmon germplasm bank was used in this study. Seeds were stratified in plastic bags filled with perlite in a cold chamber at 4 °C at the end of March. After 30 days of stratification, seeds were transferred to peat-moss and perlite (4:1 ratio) and transferred to a greenhouse at 18–24 °C for two months (from 24 April to 26 June 2017).
One hundred and fifty seedlings were transplanted into 1L pots filled with coarse sand. Plants were acclimatized in the greenhouse until apical meristem growth was observed. During this period, the plants were watered with a nutrient solution (3% Cristaljisa 18-18-18, soluble fertilizer with micronutrients). The plants were distributed randomly in the greenhouse to avoid possible biases. The plants were acclimated before exposition to salinity treatment. After acclimation, plants were exposed to saline stress treatment for 60 days. The saline stress consisted of adding 40 mM NaCl to the nutrient solution. A total of 25 control plants remained watered with only nutrient solution.
2.2. Plant Phenotyping
Plant phenotyping was carried out using the same measurement methods from a previous work [38]. The morphological parameters total height (cm), leaves (no.), nodes (no.), internodes (cm), and defoliation (1-no. leaves/no. nodes) were measured at days 0, 30, 45, and 60. Relative growth rate (RGR) was calculated as shown in the Equation (1)
Treated plants were divided into tolerant, intermediate, and sensitive phenotypes according to the strong differences shown in the phenotype after the saline stress. Further analyses were carried out in the tolerant, sensitive, and control plant groups. The salt stress tolerance of tolerant and sensitive plants was further confirmed by analysis of physiological parameters and principal component clustering.
Stem water potential (ψH, MPa) was measured in fully expanded leaves using a Model 600 Schölander Pressure Chamber (PMS Instrument Company, Albany, OR, USA). Measured leaves were kept in reflective plastic bags for 30 min (Levin, 2019). Measurements of leaf net CO2 assimilation rate (ACO2), substomatal CO2 concentration (Ci), and stomatal conductance (gs) were measured on three single leaves of each plant. Determinations were performed in fully expanded leaves from the mid-stem zone. The measurements were made using a CIRAS-2 Portable Photosynthesis System (PP Systems, Amesbury, MA, USA) using a PLC 6 (U) universal leaf autocuvette in a closed-circuit model and kept at 25 ± 0.5 °C, with a leaf-to-air vapor deficit of about 1.7 kPa. The photosynthetically active radiation (PAR) was adjusted to 1000 µmol m−2 s−1 photon flux density and the air flow rate through the cuvette was 0.5–1.5 L min−1. The measurements were made on a sunny day between 9:30 a.m. and 12:30 p.m. at the end of the salt treatment (day 60).
After saline treatment, three leaves from each plant were collected. Sample pre-treatments were performed as described previously [38]. Na+, Ca2+, K+, Mg2+, P, and S content was determined using a multiple-collector inductively coupled plasma mass spectrometry (MC-ICP MS, Thermo Finnigan Neptune). Chloride concentration was quantified by silver ion-titration [50] with a Corning 926 automatic chloridometer (Corning Ltd., Halstead Essex, UK).
Statistical differences calculation was done using RStudio v1.1.447 (2018) with packages from the Comprehensive R Archive Network (CRAN). Due to the small number of samples within groups (<20), normality cannot be assumed, therefore non-parametric tests were used for average comparison. Parameters were statistically tested by Kruskal–Wallis test (p ≤ 0.05) averages between the three groups were compared with the Pairwise Wilcoxon–Mann–Whitney test at 95% confidence level (p ≤ 0.05). Principal component analyses were calculated using Statgraphics Centurion, 16.1 version (Statistical Graphics, Englewood Cliffs, NJ, USA) with centering and standardization.
2.3. RNA Extraction
After 60 days of salt treatment, young fully expanded leaves and root tip tissue were collected and immediately frozen and powdered using liquid nitrogen. Control samples from all populations were also collected and processed. Roots and leaves from three of the plants from control treatment, and six treated plants (three tolerant, three sensitive) seedlings were collected for RNA extraction.
The samples of each of the three individuals were mixed. The three biological replicates were made resampling and mixing new tissue samples. RNA was isolated according to Gambino et al. [51]. DNA was removed with the RNase-Free DNase Set (Qiagen, Valencia, CA, USA), using the RNeasy Plant Mini Kit (Qiagen). After extraction, RNA quantity and integrity were checked with electrophoresis and Qubit fluorometer (Invitrogen, Carlsbad, CA, USA) quantification. Purified RNA (500 ng) was reverse transcribed with PrimeScript RT Reagent Kit (Takara Bio, Otsu, Japan) in a total volume of 10 μL.
2.4. RNA Sequencing
RNA samples were sequenced by Novogene® using the following procedure: mRNA was enriched using oligo (dT) beads and fragmented randomly using a fragmentation buffer. cDNA was synthetized using random hexamers and reverse transcriptase. A second strand was generated using nick-translation with RNAse H and Escherichia coli Polymerase I with Illumina second strand synthesis buffer and dNTPs. AMPure XP beads were used to purify the cDNA and the first strand was degraded with USER enzyme. Then, the resulting cDNA was purified, terminal repaired, A-tailed, ligated to the sequencing adapters, size-selected, and enriched with PCR. The resulting library was sequenced using Illumina.
2.5. Pre-Processing of RNA-Seq Data
The data pre-processing was performed as described here: http://www.epigenesys.eu/en/protocols/bio-informatics/1283-guidelines-for-rna-seq-data-analysis. Briefly, the quality of the raw sequence data was assessed using FastQC (http://www.bioinformatics.babraham.ac.uk/projects/fastqc/). Residual ribosomal RNA (rRNA) contamination was assessed and filtered using SortMeRNA (v2.1; settings–log–paired_in–fastx–sam–num_alignments 1) [52] using the rRNA sequences provided with SortMeRNA. Data was subsequently trimmed for adapters and quality using Trimmomatic (v0.36; settings TruSeq3-PE-2.fa:2:30:10 LEADING:3 SLIDINGWINDOW:5:20 MINLEN:50) [53]. After both filtering steps, FastQC was run again to ensure that no technical artefacts were introduced.
2.6. Transcriptome de Novo Assembly and Annotation
As there was no transcriptome assembly for any Diospyros species, a de novo transcriptome was built using the sequences from the RNA-Seq data. For transcriptome assembly, Trinity (v2.8.3.1) [54] was used inside a singularity (v2.5.2) [55] container for ensuring reproducibility. Protein sequences were also putatively predicted. Assembled transcriptome was then annotated using Blast2GO [56], Blast+ (v2.6.0; using blastp) [57] against UniRef90 database (10 October 2018) [58], HMMER (v3.1) (http://hmmer.org/), Trinotate [59], PFAM (v3.1;) [60], and signalP (Trinity package v.2.8.3.1) [54].
2.7. Differential Expression Analyses
Filtered reads were pseudo-aligned to the obtained transcriptome using kallisto (v0.44, non-default settings: –b 100 –rf-stranded –t 8) [61]. Statistical analysis of single-gene differential expression between conditions was performed in R (v3.6.0; R Core Team 2019) using the Bioconductor (v3.9) [62] DESeq2 package (v1.24.1) [63]. FDR (False Detection Ratio) adjusted p-values (Benjamini–Hochberg method applied to the linear model for each gene) were used to assess significance; a common threshold of 1% was used throughout. For the data quality assessment (QA) and visualization, the read counts were normalized using a variance stabilizing transformation as implemented in DESeq2. The biological relevance of the data—e.g., biological replicates similarity—was assessed by principal component analysis (PCA) and other visualizations (e.g., heatmaps), using custom R scripts, available from https://github.com/fragimuo/Dateplum-salinity-tolerance-RNAseq/. The RAW data have been deposited at the European Nucleotide Archive (ENA, https://ebi.ac.uk/ena) under the accession number PRJEB39098.
3. Results
3.1. Plant Physiological Responses Associated to Salt Stress Tolerance
Plants exposed to saline treatment showed significant reduction in growth, increased leaf damage and defoliation. The saline effect was very critical in these variables comparing to the control treatment, as shown by the PCA analysis performed to the morphological phenotyping at 0, 30, and 45 days (Figure 1). The first two components of the analysis explained more than 60% of the variability and a total of 5 principal components were identified with eigenvalue >1 (Supplementary Figure S1). Among the treated plants, those that showed severe symptoms of salinity were categorized as sensitive, whereas the plants that showed less severity to the salt stress were categorized as tolerant (Supplementary Figure S2). The morphological PCA showed a separation between tolerant and sensitive groups, mainly in the Component 1. This component presents a great influence of growth and relative height parameters (Figure 1). These differences in morphological parameters were statistically confirmed between groups (Table 1). In addition, the tolerant plants showed higher relative growth rate (RGR) than the sensitive ones.
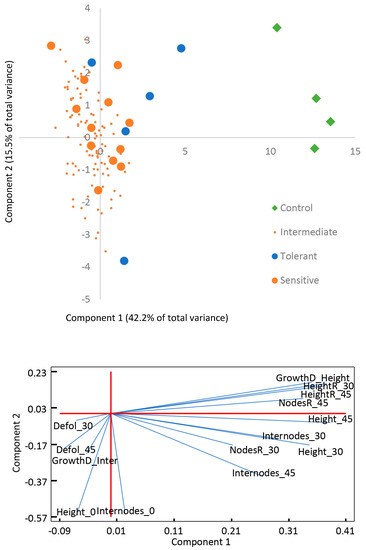
Figure 1.
Principal component analysis of the morphological variables measured. A representation of the contribution the variables to each component is included.

Table 1.
Morphological phenotype of the plants between groups after 0, 30, 45, and 60 days. Different letters represent significant differences (p < 0.05) between groups.
Furthermore, differences between tolerant and sensitive plants were significant for the relative growth rate (RGR) (Figure 2). The sensitive plants showed less RGR than the tolerant ones at the end of the saline treatment (day 60).
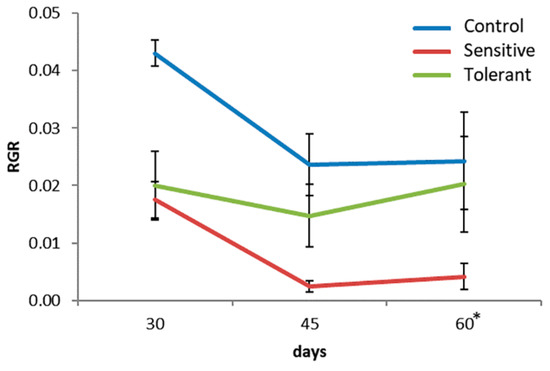
Figure 2.
Relative growth rate (RGR) of the plants during the saline stress. Asterisk (*) indicates significant differences between tolerant and sensitive groups (Kruskal–Wallis test, p < 0.05).
Physiological responses and morphological phenotype between the groups showed greater differences compared to the morphological traits measured, showing a clear separation between the tolerant and sensitive plants as shown in the PCA analysis (Figure 3). The first two components of the analysis explained more than 70% of the variability and a total of 4 principal components were identified with eigenvalue >1 (Supplementary Figure S3). The main differences between groups were both found in the first and second components of the analysis.
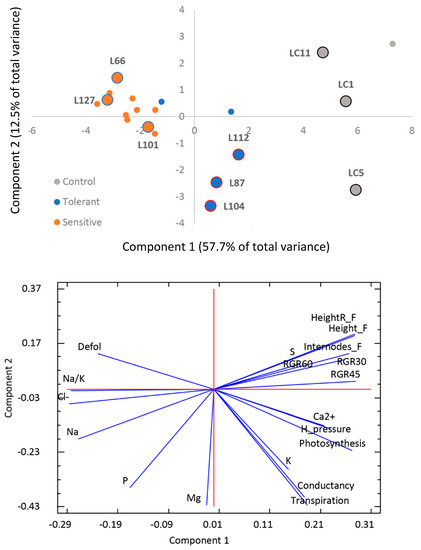
Figure 3.
Principal component analysis of the physiological and morphological variables measured. A representation of the variables contributing to each component is included.
Differences have been observed related to plants hydric potential. Sensitive plants showed significant higher water potential compared to the control and tolerant plants. In the case of gas exchange parameters, sensitive plants showed less photosynthesis than both control and tolerants, altogether with higher substomatal CO2 concentration. In addition, sensitive plants showed reduced transpiration compared to the control. Regarding to ion contents, as compared to tolerant plants, the sensitive ones showed a significantly higher Cl− concentration. Interestingly, no significant differences were observed for Na+ accumulation, neither were differences significant for Na+/K+ and Na+/Ca2+ ratios. Moreover, P accumulation was more pronounced in tolerant plants. The overall reduction in carbon fixation capacity and water potential due to salinity were significantly more pronounced in the sensitive plants. (Table 2)
Table 2.
Physiological and nutritional phenotype of the plants between groups after 0, 30, 45, and 60 days. Different letters represent significant differences (p < 0.05) between groups.
3.2. Gene Expression Changes in Response to Salinity
The plants chosen for transcriptomic sequencing were selected with the confirmation of the tolerance by the physiological responses after the saline stress (Figure 3). To visualize the gene expression profiling results, a principal component analysis (PCA) was conducted using the transcriptomic data for all samples. In this analysis, a clear separation was observed between roots and leaves. Leaves showed little variability between the three categories (Figure 4). However, the percentage of variability explained between control and treated roots was of the same order of magnitude as that between leaves and roots. Furthermore, the separation between tolerant and sensitive plants was also significant based on root transcriptomic data as shown in Figure 4. This separation was consistent with the phenotypic data presented above.
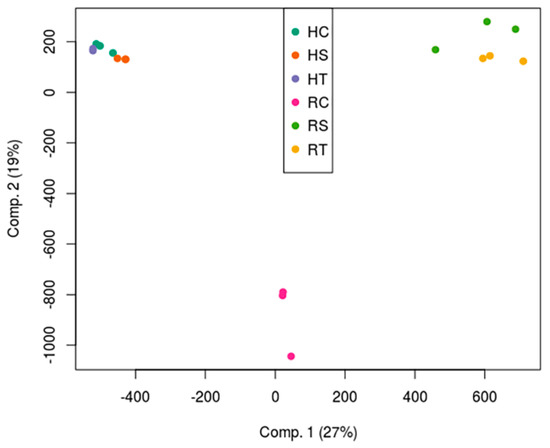
Figure 4.
Principal component analysis of the transcriptomes of the samples. HC, HS, and HT refer to control leaves, sensitive leaves, and tolerant leaves, respectively. RC, RS, and RT refer to control roots, sensitive roots, and tolerant roots, respectively.
The comparison between expression in tolerant vs. sensitive plants revealed 2901 differentially expressed genes. These genes were further filtered using the BLAST results and annotations to look for putative genes related to salinity tolerance. Additionally, an orthogonal design analysis was conducted to be able to differentiate gene expression differences specific to roots or to leaves. The orthogonal analysis identified 1277 genes differentially expressed between tolerant and sensitive leaves (Supplementary Figure S4). In addition, 1395 genes were differentially expressed between tolerant vs. sensitive roots (Supplementary Figure S5).
Differentially expressed genes were divided according to several salt tolerance mechanisms: ion transport, photosynthesis and respiration systems, and ROS detoxification. No water transport related genes were found differentially expressed. Ion transport related genes were divided according to each ion type (Table 3). Among Ca2+ transport related genes, a calcium ATPase-like gene was down-regulated in the leaves of sensitive plants as compared to those in tolerant plants, whereas the opposite was true for the roots. Furthermore, a calcium uniporter protein-like gene was found to be upregulated in the leaves of sensitive plants. Potassium channels SKOR and KAT3-like genes were downregulated in the leaves of sensitive plants, whereas a probable potassium transporter was upregulated in the leaves of sensitive plants. With regard to ionic channels, vacuolar cation/proton exchangers were upregulated in the leaves of sensitive plants. Other cation/proton antiporters did not show a clear response to salinity stress, as some isoforms had different expression patterns. On the other hand, chloride channel protein-like genes were upregulated in both leaves and roots of sensitive plants and downregulated in tolerant leaves. Comparing between samples showed that CLC-1-like gene showed higher expression in both tissues of sensitive plants. In the case of the CLC-2-like gene, the difference in expression was much marked in roots (Figure 5). Phosphate, magnesium and boron transport-related genes were upregulated in tolerant roots. Phosphate, zinc, and ammonium transport-related genes were also upregulated in tolerant leaves. Regarding ATPases, plasma membrane ATPase-like genes were strongly upregulated in the roots of tolerant plants and downregulated in sensitive leaves. Furthermore, a V-type proton ATPase subunit G-like gene was strongly upregulated in leaves of tolerant plants as compared to the sensitive ones. Comparing the reads between samples, tolerant plants showed in both tissues higher expression of these genes compared to both control and sensitive groups in both tissues (Figure 6).
Table 3.
Differentially expressed genes related to ion uptake and accumulation in tolerant vs. sensitive plants. Tissue column indicates tissue specificity of the tolerant vs. sensitive expression.
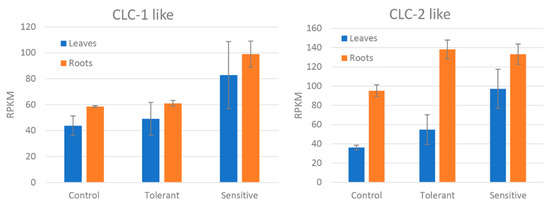
Figure 5.
Reads per kilobase of transcript, per million mapped reads (RPKM) values of the differentially expressed CLC-1 and CLC-2-like genes between control, tolerant, and sensitive groups in leaves and roots. Bars represent standard deviation.
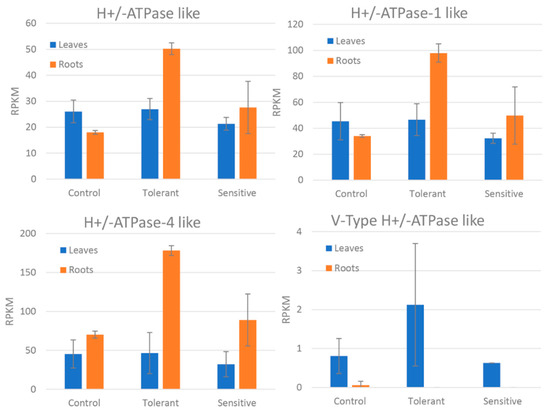
Figure 6.
Reads per kilobase of transcript, per million mapped reads (RPKM) values of the differentially expressed H+/ATPase-like genes between control, tolerant, and sensitive groups in leaves and roots. Bars represent standard deviation.
Regarding photosynthesis and respiration differentially expressed genes, in leaves they were all upregulated in the tolerant plants as compared to the sensitive ones (Table 4), similarly to the differences in photosynthesis values previously measured (Table 2).
Table 4.
Differentially expressed genes related to photosynthesis and respiration in tolerant vs. sensitive plants. Tissue column indicates tissue specificity of the tolerant vs. sensitive expression.
Concerning the ROS detoxification related genes (Table 5), all except Thermospermine synthase ACAULIS5-like presented a higher expression in the leaves. Peroxiredoxin-like and peroxidase-like genes were upregulated in the tolerant plants except for one peroxidase-like that was upregulated in sensitive plants. Thermospermine synthase ACAULIS5-like was strongly upregulated in the roots of the tolerant plants as shown in the sample comparison (Figure 7).
Table 5.
Differentially expressed genes related to ROS detoxification in tolerant vs. sensitive plants Tissue column indicates tissue specificity of the tolerant vs. sensitive expression.
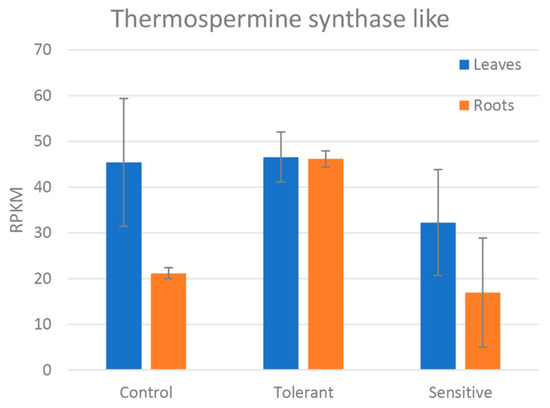
Figure 7.
Reads per kilobase of transcript, per million mapped reads (RPKM) values of the differentially expressed thermospermine synthase-like gene between control, tolerant, and sensitive groups in leaves and roots. Bars represent standard deviation.
4. Discussion
4.1. Ion Transport
Following salt treatment, no significant differences between salt-tolerant and sensitive plants were observed for Na+, Ca2+, or K+ accumulation in leaves. However, a higher K+ and Ca2+ accumulation in the leaves of tolerant plants coincides with a higher leaf expression of several potassium channels and calcium transporting ATPases in the tolerant plants.
In our study, the total content of Na+ and Cl− was analyzed and therefore a possible vacuolar compartmentalization could not be detected. However, we observed higher expression of all the analyzed H+-ATPases in tolerant plants. This suggest the involvement of these genes in the compartmentalization mechanism of cell protection from Na+ toxicity. In spite of that the responsible proteins of the removal of sodium ions from the cytoplasm into the apoplast or vacuole are the specific plasma membrane Na+/H+ antiporters, the activity of this protein depends on the electrochemical proton gradient between membranes. The H+/ATPases are the only proteins that are able to generate the adequate electrochemical proton gradient that allows these antiporters to perform the Na+ extrusion [64]. Furthermore, the upregulation of this protein under salt conditions has been previously reported [65,66,67,68] and its critical role on the Na+ extrusion has been confirmed using transgenic plants [69,70].
Another ion directly involved in damage caused by toxicity is Cl−, especially in the case of persimmon as previously shown by other works [44,71]. In a previous work, we detected differential chloride accumulation in a D. lotus population, however we could not link any previously measured parameters to these phenotypes [72]. In our study, we have observed a direct relationship between expression of chloride channel proteins and chlorine accumulation in leaf. Recently, chloride channels were proposed as key transporters of Cl− into the higher parts of the plant [43]. In persimmon, our results suggest that these channels might be playing a key role in avoiding high Cl− leaf accumulation in tolerant plants.
4.2. Photosynthesis, Respiration Systems, and ROS Signaling
A decreased metabolism in sensitive plants is supported both by the downregulation of photosynthetic and respiratory genes, and by a significant reduction in carbon fixation. Sensitive plants showed a reduction in photosynthesis (Table 2) not limited to the stomatal aperture, as shown by the water use efficiency (ratio between ACO2 and gs). Sensitive and tolerant plants showed statistically similar WUE (Water Use Efficiency) after saline stress (Figure 8). Therefore, the reduction of photosynthesis in sensitive plants compared to the tolerants is probably caused by photosystem damage due to the accumulation of toxic ions causing leaf necrosis and defoliation [2]. This hypothesis is also supported by the strong downregulation in photosystem genes in sensitive plants compared to the tolerant plants. ROS inactivation is also higher in both control and tolerant leaves an effect that probably leads to higher leaf ROS content in the sensitive plants. Although ROS can cause toxic effect in the leaves, it is a part of a signaling mechanism that may not be key to explaining the salinity tolerance, as an efficient ROS detoxification is essential for plant survival under natural conditions [2]. ROS are known to trigger programmed cell death [73] and tissue necrosis and defoliation, which are believed to be a mechanism for protecting the most photosynthetically active cells [74].
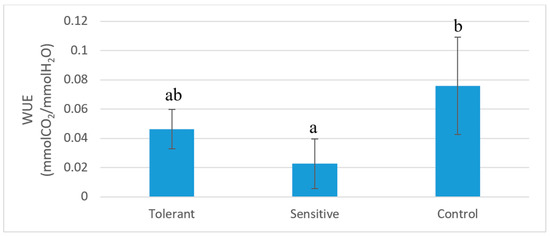
Figure 8.
Water use efficiency of tolerant, sensitive, and control plants after 60 days of saline stress. Bars represent standard deviation. Different letters represent significative differences (p < 0.05).
4.3. Root Architecture Involvement
Under stress conditions, thermospermine synthesis and K+ uptake are linked to the inhibition of lateral root formation [75,76]. Although root architecture was not characterized in this study, transcriptomic data revealed thermospermine synthesis and K+ transport activation by salinity in roots of tolerant plants, which suggests that root architecture may also play a role in the mechanism of tolerance to salt stress. Furthermore, the observed differences in sensitive plants regarding water potential (Table 2) cannot be linked to the transpiration as shown by the ratio between ψH and gs, as no significative differences were found between groups (Figure 9). We have neither found significative differences between expression of aquaporin genes related to water transport, as previously reported in a previous work [72]; therefore, observed water potential differences might be linked to water absorption through roots. Although previous reports have pointed out the association between reduced lateral root growth and sensitivity to saline stress trough better maintenance of Na+/K+ ratio by accumulating Na+ in the secondary root stele [77], other studies have pointed that in some cases, such as in seedlings, accumulation of Na+ in the stele can cause lateral root quiescence or even lateral root primordia damage [78] and therefore reduced root development. In this line, D. virginiana, which is considered a salt-tolerant persimmon rootstock, the root system is characterized by a well-developed taproot [79]. D. lotus, a salt-sensitive rootstock, is characterized by a fibrous root system as compared to D. virginiana that presents a well-developed taproot [80], this morphological differences are believed to play an important role in the salinity tolerance in Diospyros rootstocks [81]. Our expression results indicate a possible association between root architecture and tolerance to salinity warrants further studies.
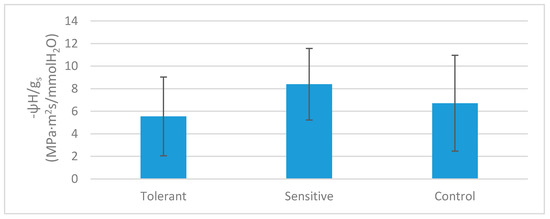
Figure 9.
Ratio between water potential and gs in tolerant, sensitive, and control plants. Bars represent standard deviation.
5. Conclusions
In Diospyros lotus L., several mechanisms are present to overcome the saline stress. In this paper, we could elucidate the ones that present variability within these species and therefore could be exploited for breeding new salt-tolerant rootstocks. We have observed reduced water potential in sensitive plants and we have observed differential expression in the thermospermine synthase gene that might have a role in root architecture. The role of root architecture in salt tolerance among Diospyros species has been previously pointed out by other authors [67]. On the other hand, chloride channel expression could facilitate Cl− transport inside the plant, and therefore cause higher Cl− accumulation in the higher parts of the plant. Finally, in the leaves, H+-ATPases can contribute to salt stress tolerance by generating the electrochemical membrane gradient required for Na+ extrusion outside the cytoplasm.
Supplementary Materials
The following are available online at https://www.mdpi.com/2073-4395/10/11/1703/s1, Figure S1: Acummulated explained variance of each principal component and eigenvalues for the principal component analysis of morphological variables. Figure S2: Example of Control, Tolerant and Sensitive phenotype of D. lotus L. plants after 60 days of salt stress. Figure S3: Acummulated explained variance of each principal component and eigenvalues for the principal component analysis of physiological and morphological variables. Figure S4: Venn diagram of the orthogonal analysis for identification of leaf-specific differential expressed genes between tolerant and sensitive plants. Figure S5: Venn diagram of the orthogonal analysis for identification of root specific differential expressed genes between tolerant and sensitive plants.
Author Contributions
Conceptualization, M.L.B. and M.d.M.N.; methodology, F.G.-M., A.Q., and M.d.M.N.; software, N.D.; validation, A.Q. and N.D.; formal analysis, N.D. and F.G.-M.; investigation, A.Q., N.D., and M.R.G.-G.; resources, M.L.B.; data curation, N.D., A.Q., and F.G.-M.; writing—original draft preparation, F.G.-M. and M.L.B.; writing—review and editing, M.L.B., N.D., and M.R.G.-G.; supervision, M.L.B., N.D., and M.R.G.-G., project administration, M.L.B.; funding acquisition, M.L.B. All authors have read and agreed to the published version of the manuscript.
Funding
This research was funded by the IVIA grant 51914. Francisco Gil-Muñoz was funded by a PhD fellowship co-financed by the European Social Fund and the Generalitat Valenciana, grant ACIF/2016/115 and BEFPI/2018/056). RGG was funded by a grant from OECD, Cooperative Research Programme.
Conflicts of Interest
The authors declare no conflict of interest. The funders had no role in the design of the study; in the collection, analyses, or interpretation of data; in the writing of the manuscript, or in the decision to publish the results.
References
- Flowers, T.J.; Colmer, T.D. Salinity tolerance in halophytes. New Phytol. 2008, 179, 945–963. [Google Scholar] [CrossRef]
- Munns, R.; Tester, M. Mechanisms of Salinity Tolerance. Annu. Rev. Plant Biol. 2008, 59, 651–681. [Google Scholar] [CrossRef]
- Bose, J.; Rodrigo-Moreno, A.; Shabala, S. ROS homeostasis in halophytes in the context of salinity stress tolerance. J. Exp. Bot. 2014, 65, 1241–1257. [Google Scholar] [CrossRef]
- Libutti, A.; Cammerino, A.R.B.; Monteleone, M. Risk assessment of soil salinization due to tomato cultivation in mediterranean climate conditions. Water 2018, 10, 1503. [Google Scholar] [CrossRef]
- Ashrai, M.; McNelly, T. Improvement of Salt Tolerance in Maize by Selection and Breeding. Plant Breed. 1990, 104, 101–107. [Google Scholar] [CrossRef]
- Saranga, Y.; Cahaner, A.; Zamir, D.; Marani, A.; Rudich, J. Breeding tomatoes for salt tolerance: Inheritance of salt tolerance and related traits in interspecific populations. Appl. Genet. 1992, 84, 390–396. [Google Scholar] [CrossRef] [PubMed]
- Cuartero, J.; Bolarín, M.C.; Asíns, M.J.; Moreno, V. Increasing salt tolerance in the tomato. J. Exp. Bot. 2006, 57, 1045–1058. [Google Scholar] [CrossRef]
- Forner-Giner, M.A.; Ancillo, G. Breeding salinity tolerance in citrus using rootstocks. In Salt Stress in Plants: Signalling, Omics and Adaptations; Springer: New York, NY, USA, 2013; Volume 9781461461, pp. 355–376. ISBN 9781461461081. [Google Scholar]
- Shahid, M.A.; Balal, R.M.; Khan, N.; Simón-Grao, S.; Alfosea-Simón, M.; Cámara-Zapata, J.M.; Mattson, N.S.; Garcia-Sanchez, F. Rootstocks influence the salt tolerance of Kinnow mandarin trees by altering the antioxidant defense system, osmolyte concentration, and toxic ion accumulation. Sci. Hortic. 2019, 250, 1–11. [Google Scholar] [CrossRef]
- Daszkowska-Golec, A.; Szarejko, I. Open or close the gate–Stomata action under the control of phytohormones in drought stress conditions. Front. Plant Sci. 2013, 4, 138. [Google Scholar] [CrossRef]
- Lim, C.W.; Baek, W.; Jung, J.; Kim, J.H.; Lee, S.C. Function of ABA in stomatal defense against biotic and drought stresses. Int. J. Mol. Sci. 2015, 16, 15251–15270. [Google Scholar] [CrossRef]
- Tester, M.; Davenport, R. Na+tolerance and Na+transport in higher plants. Ann. Bot. 2003, 91, 503–527. [Google Scholar] [CrossRef] [PubMed]
- Gong, D.; Guo, Y.; Jagendorf, A.T.; Zhu, J.K. Biochemical characterization of the Arabidopsis protein kinase SOS2 that functions in salt tolerance. Plant Physiol. 2002, 130, 256–264. [Google Scholar] [CrossRef] [PubMed]
- Hsu, J.L.; Wang, L.Y.; Wang, S.Y.; Lin, C.H.; Ho, K.C.; Shi, F.K.; Chang, I.F. Functional phosphoproteomic profiling of phosphorylation sites in membrane fractions of salt-stressed Arabidopsis thaliana. Proteome Sci. 2009, 7, 42. [Google Scholar] [CrossRef]
- Martínez-Atienza, J.; Jiang, X.; Garciadeblas, B.; Mendoza, I.; Zhu, J.K.; Pardo, J.M.; Quintero, F.J. Conservation of the salt overly sensitive pathway in rice. Plant Physiol. 2007, 143, 1001–1012. [Google Scholar] [CrossRef]
- Volkov, V. Salinity tolerance in plants. Quantitative approach to ion transport starting from halophytes and stepping to genetic and protein engineering for manipulating ion fluxes. Front. Plant Sci. 2015, 6, 873. [Google Scholar] [CrossRef]
- Yang, Z.; Li, J.L.; Liu, L.N.; Xie, Q.; Sui, N. Photosynthetic Regulation Under Salt Stress and Salt-Tolerance Mechanism of Sweet Sorghum. Front. Plant Sci. 2020, 10, 1722. [Google Scholar] [CrossRef]
- Chen, S.; Wu, F.; Li, Y.; Qian, Y.; Pan, X.; Li, F.; Wang, Y.; Wu, Z.; Fu, C.; Lin, H.; et al. NTMYB4 and NTCHS1 are critical factors in the regulation of flavonoid biosynthesis and are involved in salinity responsiveness. Front. Plant Sci. 2019, 10, 178. [Google Scholar] [CrossRef]
- Nguyen, H.M.; Sako, K.; Matsui, A.; Suzuki, Y.; Mostofa, M.G.; Van Ha, C.; Tanaka, M.; Tran, L.S.P.; Habu, Y.; Seki, M. Ethanol enhances high-salinity stress tolerance by detoxifying reactive oxygen species in arabidopsis thaliana and rice. Front. Plant Sci. 2017, 8, 1001. [Google Scholar] [CrossRef] [PubMed]
- Tao, J.J.; Chen, H.W.; Ma, B.; Zhang, W.K.; Chen, S.Y.; Zhang, J.S. The role of ethylene in plants under salinity stress. Front. Plant Sci. 2015, 6, 1059. [Google Scholar] [CrossRef]
- Suzuki, N.; Bassil, E.; Hamilton, J.S.; Inupakutika, M.A.; Zandalinas, S.I.; Tripathy, D.; Luo, Y.; Dion, E.; Fukui, G.; Kumazaki, A.; et al. ABA is required for plant acclimation to a combination of salt and heat stress. PLoS ONE 2016, 11, e0147625. [Google Scholar] [CrossRef]
- Yu, Z.; Wang, X.; Zhang, L. Structural and functional dynamics of dehydrins: A plant protector protein under abiotic stress. Int. J. Mol. Sci. 2018, 19, 3420. [Google Scholar] [CrossRef]
- Hanin, M.; Brini, F.; Ebel, C.; Toda, Y.; Takeda, S.; Masmoudi, K. Plant dehydrins and stress tolerance: Versatile proteins for complex mechanisms. Plant Signal. Behav. 2011, 6, 1503–1509. [Google Scholar] [CrossRef]
- Kapilan, R.; Vaziri, M.; Zwiazek, J.J. Regulation of aquaporins in plants under stress. Biol. Res. 2018, 51. [Google Scholar] [CrossRef]
- Boudsocq, M.; Laurière, C. Osmotic signaling in plants. Multiple pathways mediated by emerging kinase families. Plant Physiol. 2005, 138, 1185–1194. [Google Scholar] [CrossRef]
- Isah, T. Stress and defense responses in plant secondary metabolites production. Biol. Res. 2019, 52, 39. [Google Scholar] [CrossRef] [PubMed]
- Quan, R.; Lin, H.; Mendoza, I.; Zhang, Y.; Cao, W.; Yang, Y.; Shang, M.; Chen, S.; Pardo, J.M.; Guo, Y. SCABP8/CBL10, a putative calcium sensor, interacts with the protein kinase SOS2 to protect Arabidopsis shoots from salt stress. Plant Cell 2007, 19, 1415–1431. [Google Scholar] [CrossRef]
- Luo, Y.; Reid, R.; Freese, D.; Li, C.; Watkins, J.; Shi, H.; Zhang, H.; Loraine, A.; Song, B.H. Salt tolerance response revealed by RNA-Seq in a diploid halophytic wild relative of sweet potato. Sci. Rep. 2017, 7, 9624. [Google Scholar] [CrossRef]
- Shafi, A.; Zahoor, I. Plant Survival and Tolerance Under High Salinity: Primary and Secondary Cell Wall-Sensing Mechanism. In Salt Stress, Microbes, and Plant Interactions: Causes and Solution; Springer: Singapore, 2019; pp. 129–146. [Google Scholar]
- Moustafa, K.; AbuQamar, S.; Jarrar, M.; Al-Rajab, A.J.; Trémouillaux-Guiller, J. MAPK cascades and major abiotic stresses. Plant Cell Rep. 2014, 33, 1217–1225. [Google Scholar] [CrossRef]
- Sinha, A.K.; Jaggi, M.; Raghuram, B.; Tuteja, N. Mitogen-activated protein kinase signaling in plants under abiotic stress. Plant Signal. Behav. 2011, 6, 196–203. [Google Scholar] [CrossRef]
- Shi, H.; Ishitani, M.; Kim, C.; Zhu, J.K. The Arabidopsis thaliana salt tolerance gene SOS1 encodes a putative Na+/H+ antiporter. Proc. Natl. Acad. Sci. USA 2000, 97, 6896–6901. [Google Scholar] [CrossRef] [PubMed]
- Liu, J. The Arabidopsis thaliana SOS2 gene encodes a protein kinase that is required for salt tolerance. Proc. Natl. Acad. Sci. USA 2000, 97, 3730–3734. [Google Scholar] [CrossRef]
- Mahajan, S.; Pandey, G.K.; Tuteja, N. Calcium- and salt-stress signaling in plants: Shedding light on SOS pathway. Arch. Biochem. Biophys. 2008, 471, 146–158. [Google Scholar] [CrossRef]
- Zhang, H.; Lv, F.; Han, X.; Xia, X.; Yin, W. The calcium sensor PeCBL1, interacting with PeCIPK24/25 and PeCIPK26, regulates Na+/K+ homeostasis in Populus euphratica. Plant Cell Rep. 2013, 32, 611–621. [Google Scholar] [CrossRef] [PubMed]
- Chen, X.; Huang, Q.; Zhang, F.; Wang, B.; Wang, J.; Zheng, J. ZmCIPK21, a Maize CBL-Interacting Kinase, Enhances Salt Stress Tolerance in Arabidopsis Thaliana. Int. J. Mol. Sci. 2014, 15, 14819–14834. [Google Scholar] [CrossRef]
- Li, R.; Zhang, J.; Wu, G.; Wang, H.; Chen, Y.; Wei, J. HbCIPK2, a novel CBL-interacting protein kinase from halophyte Hordeum brevisubulatum, confers salt and osmotic stress tolerance. Plant Cell Environ. 2012. [Google Scholar] [CrossRef]
- Gil-Muñoz, F.; Pérez-Pérez, J.G.; Quiñones, A.; Primo-Capella, A.; Cebolla, J.; Ángeles Forner-Giner, M.; Badenes, M.L.; del Mar Naval, M. A cross population between D. Kaki and D. Virginiana shows high variability for saline tolerance and improved salt stress tolerance. PLoS ONE 2020, 15, e0229023. [Google Scholar] [CrossRef]
- Garciadeblás, B.; Senn, M.E.; Bañuelos, M.A.; Rodríguez-Navarro, A. Sodium transport and HKT transporters: The rice model. Plant J. 2003, 34, 788–801. [Google Scholar] [CrossRef] [PubMed]
- Huang, S.; Spielmeyer, W.; Lagudah, E.S.; James, R.A.; Platten, J.D.; Dennis, E.S.; Munns, R. A sodium transporter (HKT7) is a candidate for Nax1, a gene for salt tolerance in durum wheat. Plant Physiol. 2006, 142, 1718–1727. [Google Scholar] [CrossRef]
- Horie, T.; Costa, A.; Kim, T.H.; Han, M.J.; Horie, R.; Leung, H.Y.; Miyao, A.; Hirochika, H.; An, G.; Schroeder, J.I. Rice OsHKT2;1 transporter mediates large Na+ influx component into K+-starved roots for growth. EMBO J. 2007, 26, 3003–3014. [Google Scholar] [CrossRef]
- Almeida, P.; Katschnig, D.; de Boer, A.H. HKT transporters-state of the art. Int. J. Mol. Sci. 2013, 14, 20359–20385. [Google Scholar] [CrossRef]
- Isayenkov, S.V.; Maathuis, F.J.M. Plant salinity stress: Many unanswered questions remain. Front. Plant Sci. 2019, 10, 80. [Google Scholar] [CrossRef]
- Besada, C.; Gil, R.; Bonet, L.; Quiñones, A.; Intrigliolo, D.; Salvador, A. Chloride stress triggers maturation and negatively affects the postharvest quality of persimmon fruit. Involvement of calyx ethylene production. Plant Physiol. Biochem. 2016, 100, 105–112. [Google Scholar] [CrossRef]
- Formentin, E.; Sudiro, C.; Perin, G.; Riccadonna, S.; Barizza, E.; Baldoni, E.; Lavezzo, E.; Stevanato, P.; Sacchi, G.A.; Fontana, P.; et al. Transcriptome and cell physiological analyses in different rice cultivars provide new insights into adaptive and salinity stress responses. Front. Plant Sci. 2018, 9, 204. [Google Scholar] [CrossRef]
- Tian, X.; Wang, Z.; Zhang, Q.; Ci, H.; Wang, P.; Yu, L.; Jia, G. Genome-wide transcriptome analysis of the salt stress tolerance mechanism in Rosa chinensis. PLoS ONE 2018, 13, e0200938. [Google Scholar] [CrossRef] [PubMed]
- Wang, J.; Zhu, J.; Zhang, Y.; Fan, F.; Li, W.; Wang, F.; Zhong, W.; Wang, C.; Yang, J. Comparative transcriptome analysis reveals molecular response to salinity stress of salt-tolerant and sensitive genotypes of indica rice at seedling stage. Sci. Rep. 2018, 8, 2085. [Google Scholar] [CrossRef] [PubMed]
- Zeng, A.; Chen, P.; Korth, K.L.; Ping, J.; Thomas, J.; Wu, C.; Srivastava, S.; Pereira, A.; Hancock, F.; Brye, K.; et al. RNA sequencing analysis of salt tolerance in soybean (Glycine max). Genomics 2019, 111, 629–635. [Google Scholar] [CrossRef]
- Amirbakhtiar, N.; Ismaili, A.; Ghaffari, M.R.; Firouzabadi, F.N.; Shobbar, Z.S. Transcriptome response of roots to salt stress in a salinity-tolerant bread wheat cultivar. PLoS ONE 2019, 14, e0213305. [Google Scholar] [CrossRef]
- Gilliam, J.W. Rapid Measurement of Chlorine in Plant Materials1. Soil Sci. Soc. Am. J. 1971, 35, 512. [Google Scholar] [CrossRef]
- Gambino, G.; Perrone, I.; Gribaudo, I. A rapid and effective method for RNA extraction from different tissues of grapevine and other woody plants. Phytochem. Anal. 2008, 19, 520–525. [Google Scholar] [CrossRef]
- Kopylova, E.; Noé, L.; Touzet, H. SortMeRNA: Fast and accurate filtering of ribosomal RNAs in metatranscriptomic data. Bioinformatics 2012. [Google Scholar] [CrossRef]
- Bolger, A.M.; Lohse, M.; Usadel, B. Trimmomatic: A flexible trimmer for Illumina sequence data. Bioinformatics 2014. [Google Scholar] [CrossRef] [PubMed]
- Haas, B.J.; Papanicolaou, A.; Yassour, M.; Grabherr, M.; Blood, P.D.; Bowden, J.; Couger, M.B.; Eccles, D.; Li, B.; Lieber, M.; et al. De novo transcript sequence reconstruction from RNA-seq using the Trinity platform for reference generation and analysis. Nat. Protoc. 2013. [Google Scholar] [CrossRef]
- Kurtzer, G.M.; Sochat, V.; Bauer, M.W. Singularity: Scientific containers for mobility of compute. PLoS ONE 2017. [Google Scholar] [CrossRef]
- Conesa, A.; Götz, S.; García-Gómez, J.M.; Terol, J.; Talón, M.; Robles, M. Blast2GO: A universal tool for annotation, visualization and analysis in functional genomics research. Bioinformatics 2005. [Google Scholar] [CrossRef]
- Camacho, C.; Coulouris, G.; Avagyan, V.; Ma, N.; Papadopoulos, J.; Bealer, K.; Madden, T.L. BLAST+: Architecture and applications. BMC Bioinform. 2009. [Google Scholar] [CrossRef]
- Suzek, B.E.; Wang, Y.; Huang, H.; McGarvey, P.B.; Wu, C.H. UniRef clusters: A comprehensive and scalable alternative for improving sequence similarity searches. Bioinformatics 2015. [Google Scholar] [CrossRef]
- Bryant, D.M.; Johnson, K.; DiTommaso, T.; Tickle, T.; Couger, M.B.; Payzin-Dogru, D.; Lee, T.J.; Leigh, N.D.; Kuo, T.H.; Davis, F.G.; et al. A Tissue-Mapped Axolotl De Novo Transcriptome Enables Identification of Limb Regeneration Factors. Cell Rep. 2017. [Google Scholar] [CrossRef]
- El-Gebali, S.; Mistry, J.; Bateman, A.; Eddy, S.R.; Luciani, A.; Potter, S.C.; Qureshi, M.; Richardson, L.J.; Salazar, G.A.; Smart, A.; et al. The Pfam protein families database in 2019. Nucleic Acids Res. 2019. [Google Scholar] [CrossRef]
- Bray, N.L.; Pimentel, H.; Melsted, P.; Pachter, L. Near-optimal probabilistic RNA-seq quantification. Nat. Biotechnol. 2016. [Google Scholar] [CrossRef]
- Gentleman, R.C.; Carey, V.J.; Bates, D.M.; Bolstad, B.; Dettling, M.; Dudoit, S.; Ellis, B.; Gautier, L.; Ge, Y.; Gentry, J.; et al. Bioconductor: Open software development for computational biology and bioinformatics. Genome Biol. 2004. [Google Scholar] [CrossRef] [PubMed]
- Love, M.I.; Anders, S.; Huber, W. Moderated estimation offold change and dispersion for RNA-seq data with DESeq2. Genome Biol. 2014, 15, 550. [Google Scholar] [CrossRef]
- Palmgren, M.G. Plant Plasma Membrane H+/-ATPases: Powerhouses for Nutrient Uptake. Annu. Rev. Plant Physiol. Plant Mol. Biol. 2001, 52, 817–845. [Google Scholar] [CrossRef]
- Niu, X.; Narasimhan, M.L.; Salzman, R.A.; Bressan, R.A.; Hasegawa, P.M. NaCl regulation of plasma membrane H+-ATPase gene expression in a glycophyte and a halophyte. Plant Physiol. 1993. [Google Scholar] [CrossRef] [PubMed]
- Vera-Estrella, R.; Barkla, B.J.; Higgins, V.J.; Blumwald, E. Plant defense response to fungal pathogens. Activation of host-plasma membrane H+-ATPase by elicitor-induced enzyme dephosphorylation. Plant Physiol. 1994. [Google Scholar] [CrossRef]
- Chen, Z.; Pottosin, I.I.; Cuin, T.A.; Fuglsang, A.T.; Tester, M.; Jha, D.; Zepeda-Jazo, I.; Zhou, M.; Palmgren, M.G.; Newman, I.A.; et al. Root plasma membrane transporters controlling K+/Na+ homeostasis in salt-stressed barley. Plant Physiol. 2007, 145, 1714–1725. [Google Scholar] [CrossRef]
- Sahu, B.B.; Shaw, B.P. Salt-inducible isoform of plasma membrane H+ATPase gene in rice remains constitutively expressed in natural halophyte, Suaeda maritima. J. Plant Physiol. 2009. [Google Scholar] [CrossRef] [PubMed]
- Gévaudant, F.; Duby, G.; Von Stedingk, E.; Zhao, R.; Morsomme, P.; Boutry, M. Expression of a constitutively activated plasma membrane H +-ATPase alters plant development and increases salt tolerance. Plant Physiol. 2007. [Google Scholar] [CrossRef] [PubMed]
- Shen, P.; Wang, R.; Jing, W.; Zhang, W. Rice Phospholipase Dα is Involved in Salt Tolerance by the Mediation of H+-ATPase Activity and Transcription. J. Integr. Plant Biol. 2011. [Google Scholar] [CrossRef]
- de Paz, J.M.; Visconti, F.; Chiaravalle, M.; Quiñones, A. Determination of persimmon leaf chloride contents using near-infrared spectroscopy (NIRS). Anal. Bioanal. Chem. 2016, 408, 3537–3545. [Google Scholar] [CrossRef]
- Gil-Muñoz, F.; Pérez-Pérez, J.G.; Quiñones, A.; Naval, M.d.M.; Badenes, M.L. Intra and Inter-specific Variability of Salt Tolerance Mechanisms in Diospyros Genus. Front. Plant Sci. 2020, 11, 1132. [Google Scholar] [CrossRef]
- Petrov, V.; Hille, J.; Mueller-Roeber, B.; Gechev, T.S. ROS-mediated abiotic stress-induced programmed cell death in plants. Front. Plant Sci. 2015, 6, 69. [Google Scholar] [CrossRef]
- Baetz, U.; Eisenach, C.; Tohge, T.; Martinoia, E.; De Angeli, A. Vacuolar chloride fluxes impact ion content and distribution during early salinity stress. Plant Physiol. 2016, 172, 1167–1181. [Google Scholar] [CrossRef] [PubMed]
- Tong, W.; Yoshimoto, K.; Kakehi, J.-I.; Motose, H.; Niitsu, M.; Takahashi, T. Thermospermine modulates expression of auxin-related genes in Arabidopsis. Front. Plant Sci. 2014, 5, 94. [Google Scholar] [CrossRef]
- Osakabe, Y.; Arinaga, N.; Umezawa, T.; Katsura, S.; Nagamachi, K.; Tanaka, H.; Ohiraki, H.; Yamada, K.; Seo, S.U.; Abo, M.; et al. Osmotic stress responses and plant growth controlled by potassium transporters in Arabidopsis. Plant Cell 2013, 25, 609–624. [Google Scholar] [CrossRef] [PubMed]
- Julkowska, M.M.; Hoefsloot, H.C.J.; Mol, S.; Feron, R.; De Boer, G.J.; Haring, M.A.; Testerink, C. Capturing arabidopsis root architecture dynamics with root-fit reveals diversity in responses to salinity. Plant Physiol. 2014, 166, 1387–1402. [Google Scholar] [CrossRef]
- Julkowska, M.M.; Koevoets, I.T.; Mol, S.; Hoefsloot, H.; Feron, R.; Tester, M.A.; Keurentjes, J.J.B.; Korte, A.; Haring, M.A.; De Boer, G.J.; et al. Genetic components of root architecture remodeling in response to salt stress. Plant Cell 2017, 29, 3198–3213. [Google Scholar] [CrossRef]
- Incesu, M.; Cimen, B.; Yesiloglu, T.; Yilmaz, B. Growth and photosynthetic response of two persimmon rootstocks (Diospyros kaki and D. virginiana) under different salinity levels. Not. Bot. Horti Agrobot. Cluj-Napoca 2014, 42, 386–391. [Google Scholar] [CrossRef][Green Version]
- Intrigliolo, D.S.; Visconti, F.; Bonet, L.; Parra, M.; Besada, C.; Abrisqueta, I.; Rubio, J.S.; De Paz, J.M. Persimmon (Diospyros kaki) trees responses to restrictions in water amount and quality. In Water Scarcity and Sustainable Agriculture in Semiarid Environment: Tools, Strategies, and Challenges for Woody Crops; Elsevier: Amsterdam, The Netherlands, 2018; pp. 149–177. ISBN 9780128131640. [Google Scholar]
- Visconti, F.; Intrigliolo, D.S.; Quiñones, A.; Tudela, L.; Bonet, L.; de Paz, J.M. Differences in specific chloride toxicity to Diospyros kaki cv. “Rojo Brillante” grafted on D. lotus and D. virginiana. Sci. Hortic. 2017, 214, 83–90. [Google Scholar] [CrossRef]


Publisher’s Note: MDPI stays neutral with regard to jurisdictional claims in published maps and institutional affiliations. |
© 2020 by the authors. Licensee MDPI, Basel, Switzerland. This article is an open access article distributed under the terms and conditions of the Creative Commons Attribution (CC BY) license (http://creativecommons.org/licenses/by/4.0/).