Article

Kinetics of C Mineralization of Biochars in Three Excessive Compost-Fertilized Soils: Effects of Feedstocks and Soil Properties

Department of Forestry and Natural Resources, National Ilan University, Ilan 26047, Taiwan
*
Author to whom correspondence should be addressed.
Agronomy 2020, 10(11), 1749; https://doi.org/10.3390/agronomy10111749
Submission received: 7 October 2020 / Revised: 4 November 2020 / Accepted: 9 November 2020 / Published: 10 November 2020
(This article belongs to the Special Issue Management of Soil Organic Carbon for Soil Health in Agroecosystems)

Abstract

:
The aim of this work was to compare the carbon (C) mineralization kinetics of three biochars (Formosan ash (Fraxinus formosana Hayata), ash biochar; Makino bamboo (Phyllostachys makino Hayata), bamboo biochar; and lead tree (Leucaena leucocephala (Lam.) de. Wit), lead tree biochar) applied with two addition rates (2 and 5 wt %) in three excessive compost-fertilized (5 wt %) soils (one Oxisols and two Inceptisols), and to ascertain the increasing or decreasing effect of biochar and soil type in the presence of excessive compost. The study results of 400 days incubation indicated that, in general, the potential of the three biochars for C sequestration is similar in the three studied soils. The presence of excessive compost stimulated the co-mineralization of the more labile components of biochar over the short term (first two months). The potential of biochar addition for neutralizing soil pH and regulating the release of Al from soil for preserving soil organic carbon (SOC) might be the important mechanisms in biochar-compost interactions, especially in the presence of excessive compost. Overall, 5% application rate of three high temperature-pyrolysis biochars showed the less detriments to studied soils. In these incubations of biochar, excessive compost, and soil, it is a decreasing effect overall, that is, the enhanced storage of both biochar-C and SOC, which is expected as a long-term carbon sequestration in soil. The recorded direction and magnitude of effect, both are strongly influenced by biochar and soil type. When co-applied with excessive compost, the negative (reducing CO2 release) effect with increasing biochar application rates was eliminated.

1. Introduction

Many practices, such as inorganic N fertilization, zero-tillage, and the addition of large amounts of manure and compost to soil, have been used to increase organic C, but these practices do not sequester significant quantities of C into the soil because most of the organic matter is not stable and is mineralized quickly [1], unlike the pyrogenic biomass (biochar). The application of carbon-rich pyrolysis biomass (biochar) can be used as an important carbon sink, taking an important step towards sustainability and soil organic matter (SOM) protection for tropical agriculture [2]. Therefore, applying biochar to soil may have the potential to stabilize SOM and sequester C. Qayyum et al. [1] pointed out that charcoal or organic materials produced at high temperature are the most suitable choice for long-term carbon sequestration; on the contrary, low-temperature biochar may be a suitable choice for increasing soil fertility, because compared with high-temperature biochar, the decomposition rate of compounds in low-temperature biochar is faster, and these compounds are easily mineralized and released into the soil. Keith et al. [3] employed novel 13C-depleted biochar to unambiguously identify source of C (biochar or added LOM (labile organic matter) (sugar cane residue)/native SOM) mineralized in the soil. The incubation study of Keith et al. [3] showed the potential benefits of biochar application in the stabilization of LOM in the soil; this benefit is slightly offset by the increased mineralization of labile components of biochar in the presence of LOM. Additionally, application of biochar produced at the higher temperature (550 °C) would be desirable for increased soil C-sequestration than at the lower (450 °C) temperature, particularly combined with its high chemical recalcitrance. In an eight-month field experiment, Plaza et al. [4] indicated that 20 t ha–1 biochar derived from holm oak (Quercus ilex L.) chips through a slow pyrolysis process at 600 °C and organic fertilizer (i.e., municipal solid waste compost and sewage sludge) application significantly increased SOM content. The results suggested that a promoting action of biochar on C stabilization in organically-fertilized soils through the formation of organo-mineral complexes by intimate interactions between mineral particles and organic inputs. In addition, biochar stabilization can be influenced by soil type. The addition of peanut-shell-derived biochar increased the cumulative CO2 emissions and the cumulative soil organic carbon mineralization in coastal saline soil (pH 8.09), and could be attributed to labile C released from biochar and enhanced microorganism proliferation [5]; however, the increased mineralized C only accounted for less than 2% in the 0.1–3% biochar treatments, indicating that biochar may enhance C sequestration in saline soil. On the contrary, biochar additions sometimes increase soil respiration and CO2 emissions, which could partially offset C credits associated with soil biochar applications, and many uncertainties are related to estimation of mineralization rates of biochar in soils [6]. Including the biochar and soil type, and the period over which measurements are made can strongly influence the direction and magnitude of effect recorded [7], and in some cases, biochar has a positive effect (greater than expected) and in others has a negative (less than expected) one. However, over the long term, biochar–soil interaction will enhance soil C storage via the processes of organic matter sorption to biochar and physical protection.
The application of biochar as soil amendments may enable removal of C from the atmosphere, resulting in long-term storage of C, with potential co-benefits such as soil improvement and increased plant growth [8]. However, the variation in biochar characteristics can lead to variation in the effects on soil processes and plant growth upon addition of biochar to soil [9]. Today, various biomass residues and waste materials are being converted into biochar via controlled pyrolysis (incomplete combustion under limited or no oxygen), like the ash and bamboo biochar described above. Thus, investigating the properties of biochars produced from different biomass residues using a uniform pyrolysis process is essential, furthering our understanding of how feedstocks affect biochar characteristics, their potential effects on soils, and the potential of biochars to sequester C [9]. Clearly, a great deal of confusion exists as to the short and long-term effects that biochar amendment will have on soil C cycling and sequestration [7]. Ippolito et al. [10] proposed that it is plausible that various rates of biochar can cause either a positive or negative effect of added labile organic C sources. As indicated in a previous study [11], the doses of manure compost in Taiwan are recommended as 1% to 2%; however, some farmers apply more than 2% to 5% in intensive cultivation periods for short-term leafy crops, in an effort to add more N. In addition, under intensive and highly frequent tillage, the excessive-applied composts have obvious decrease during one year. Based on our previous observations where only one biochar was applied [11], we hypothesized that relatively low biochar application rates (e.g., 2% by wt.) of three studied biochars would cause no effect, while an excessive biochar application (e.g., 5% by wt.) would cause a negative effect even in the presence of excessive compost. Thus, a 400-day laboratory incubation study was conducted with three well-characterized biochars mixed with three soil types under constant laboratory incubation conditions. The objective was intended to compare the C respiration rate to study the interaction between soil and biochar under the condition of co-application of excessive compost, which may lead to changes in increasing or decreasing effects and natural changes in C mineralization.

2. Materials and Methods

2.1. Characterization of Soils and Compost

The characterizations of the three studied soils (15 cm depth) and poultry-livestock manure compost were analyzed and described in previous studies [11] (Table S1). The three studied soils, including Pingchen (Pc) soil, Erhlin (Eh) soil, and Annei (An) soil, are amongst the top 10 rural soils of the occupied area in rural land of Taiwan. The Pingchen (Pc) soil series is a relict tertiary Oxisols (slightly acidic Oxisols, SAO) in northern Taiwan. The Erhlin (Eh) soil series is an Inceptisols (mildly alkaline Inceptisols, MAI) developed from calcareous slate old alluvial parent material in central Taiwan. The Annei (An) soil series is also an Inceptisols (slightly acid Inceptisols, SAI) developed from calcareous sandstone-shale new alluvial parent material in southern Taiwan. The term “slightly acidic” indicates a soil pH ranging from 6.1 to 6.5, and “mildly alkaline” indicates the soil pH ranging from 7.4 to 7.8 [12]. Composite bulk soil samples of three study rural soil were collected in spring 2011 from the upper layers of three fields in Taiwan. The Pc soil was collected from Taoyuan county, Eh soil from Changhua county, and An soil from Tainan county, respectively. Soil samples were collected from the cultivated layers (0–15 cm). Eight to ten soil cores (30 × 30 cm) were taken randomly and mixed homogenously at each site. The soil was air-dried at room temperature and then ground to pass through a 2-mm sieve before its use in the incubation.
The poultry-livestock manure compost used in this study was a commercial product (organic fertilizer; Tianluo Composting Plant, Changhua, Taiwan) certified by the government and often used by farmers. The main raw materials (>50 wt %) of the studied compost were poultry manure (mostly chicken) and livestock manure (mostly swine). The dry matter content was higher than 65%. The particle size distribution of the studied compost was as follows: >1 mm, 21%; 1–0.5 mm, 28%; <0.5–0.25 mm, 20%; <0.25–0.105 mm, 18%; and <0.105 mm, 13%. The characteristics of studied compost are shown in Table S1.

2.2. Preparation and Characterization of Biochar

Biochar produced from the stems and branches of formosan ash (Fraxinus formosana Hayata) (ash biochar, A), makino bamboo (Phyllostachys makino Hayata) (bamboo biochar, B), and lead tree (Leucaena leucocephala (Lam.) de. Wit) (lead tree biochar, L) in an earth kiln was produced by the Forest Utilization Division, Taiwan Forestry Research Institute, Taipei, Taiwan [13,14,15,16,17]. The native species, Formosan ash (Fraxinus formosana Hayata), has been used in plantations since the 1960s [18]. The lead tree, or white popinac (Leucaena leucocephala (Lam.) de. Wit), is an exotic plant; however, because its economic value has decreased over time, this plant has been left to proliferate by itself and has a strong ability to compete with other plants, and many lead trees were cut down by local governments [19]. Bamboo grows quickly, especially Makino bamboo in Taiwan, has a high strength-to-weight ratio, and as a kind of wood, is mainly composed of hemicelluloses, cellulose, and lignin, which can produce higher value-added products via pyrolysis processes [20].
The charring for earth kilns typically requires several days and reaches temperatures up to 500–700 °C. The highest temperature in the kiln at the end of carbonization was above 750 °C. The biochars were homogenized and ground into a mesh of <2 mm for analysis. The particle size distribution of the studied biochar was as follows: >1 mm, 2%; 1–0.5 mm, 12%; <0.5–0.25 mm, 13%; <0.25–0.105 mm, 54%; and <0.105 mm, 19% for ash biochar; >1 mm, 17%; 1–0.5 mm, 34%; <0.5–0.25 mm, 16%; <0.25–0.105 mm, 20%; and <0.105 mm, 12% for bamboo biochar; >1 mm, 8%; 1–0.5 mm, 37%; <0.5–0.25 mm, 22%; <0.25–0.105 mm, 18%; and <0.105 mm, 15% for lead tree biochar.
For the elemental analyses, the biochar samples were ground to <0.2 mm. Two replicates were used for each analysis, and in some analyses, 3 replicates were used. The characterizations of biochar, including pH, EC, CEC, exchangeable bases, BS%, total, and plant-available nutrients, were determined and the analysis methods were described in a previous study [11]. In addition, elemental analysis, including C, H, N, and O contents of biochars, was conducted using an Elementar vario EL cube (Elementar Analysensysteme GmbH, Langenselbold, Germany). Additionally, chemical functional groups by Fourier transform infrared spectra (FTIR; PerkinElmer Pyris Diamond, PerkinElmer, Waltham, MA, USA), X-ray diffraction (XRD) patterns (BRUKER AXS D8A, Bruker Corporation, Billerica, MA, USA), and scanning electron microscopy (SEM) observations (FEI Inspect S, Thermo Fisher Scientific Inc., Waltham, MA, USA) were also determined (Supplementary Materials).

2.3. Extracting Water-Soluble Biochar C and Analyses

Three biochars samples, A, B, and L, were each separately and gently shaken with deionized water (water/biochar ratio 10:1) for 30 min [21]. Water extracts were filtered through 0.45 mm pore-size nylon membrane filters (Whatman®, Maidstone, UK) and collected. This extraction process was repeated 5 times for each biochar sample with three replicates. The pH and EC of the extraction and water-extractable organic C (WEOC) concentrations were determined. The WEOC concentrations were determined on an Aurora 1030C TOC analyzer (OI Corporation/Xylem, Inc., College Station, TX, USA).

2.4. Soil–Biochar Incubation Experiment

A 400-day incubation experiment was conducted for the investigation of C mineralization investigation using 21 treatments of three soils and different feedstocks and rates of biochar. Similar to previous studies [11,19,22], compost was then added to all soils at a rate of 5 wt % to test excessive application. The economic viability of 5% manure compost is highly unlikely for most farmers, but that was not the objective of the present work. Each soil was either incubated without biochar or with biochar at 2% and 5% of soil mass (~0, 40, and 100 Mg ha−1; wt:wt). The 5% application rate was chosen to help identify an upper level of soil detriments by biochar application, that is, decreasing (absorbing) soil nutrients and increasing soil heavy metal contents. The following treatments for each soil were established with five replicates (n = 105): (1) natural soil + 5% compost (Control); (2) soil + 5% compost + 2% ash biochar (A-2); (3) soil + 5% compost + 5% ash biochar (A-5); (4) soil + 5% compost + 2% bamboo biochar (B-2); (5) soil + 5% compost + 5% bamboo biochar (B-5); (6) soil + 5% compost + 2% lead tree biochar (L-2); and (7) soil + 5% compost + 5% leads tree biochar (L-5). Soil, biochar, and compost were added to each jar and a spoon was used to thoroughly mix the samples. Control soil samples were identically mixed.
We placed 25 g of mixed soil sample in 30 mL plastic containers, which were subsequently put into 500 mL plastic jars. For the C mineralization test, a small plastic measuring vessel containing 10 mL of distilled water and a vessel with 10 mL of 1 M NaOH solution were put into each 500 mL plastic jar to avoid soil desiccation and to trap released CO2. The jars were sealed and incubated in the laboratory (25–27 °C; 50–60% humidity). Soil moisture content was adjusted to 60% of field capacity before the incubation and was maintained throughout the experiment using repeated weighting. The incubation experiment was run for 400 days with 10 samplings after 1, 3, 7, 28, 56, 84, 140, 196, 294, and 400 days. During each sampling, the vessel with 10 mL of 1 M NaOH solution was removed, resealed, and stored until analysis for CO2 and replaced with fresh NaOH. The titrimetric determination method was used to quantify the released CO2 [23]. Soil respiration data are reported as mg of CO2–C respired per kilogram of soil. At the end of incubation, a soil sample of each treatment was collected for analysis of plant available nutrients (P, K, Ca, Mg, Fe, Al, Mn, Cu, Pb, and Zn) using Mehlich-3 extraction. To compare the changes and quantify the impacts of soil biochar amendments on nutrients, soil total C (TC), total N (TN), and total P (TP) for each treatment were measured. The analysis methods were described in previous studies [11].

2.5. Data Analysis and Statistics

The cumulative CO2 released and C mineralization kinetics were calculated based on the amount of CO2–C released during different intervals of time in each treatment. The potential of different feedstocks and addition rates of biochar for stabilizing and preventing the rapid mineralization of excessive compost were examined using the total mineralization coefficient (TMC), which was calculated according to Díez et al. [24] and Méndez et al. [25], as follows:
TMC (mg CO2–C/g C) = CO2–C released/initial TOC,
where CO2–C released is expressed as mg CO2–C g−1 soil and initial total organic carbon (TOC) is expressed as g C g−1 soil.
The percentage of CO2–C release, TMC, TC, TN, TP, and available nutrients that declined or increased due to biochar addition were calculated by the difference between biochar-amended treatments and un-amended control treatment [26].
A double exponential model (Equation (2)) was used for the mathematical description of biochar-amended soil C degradation assuming there were two C pools: a rapidly degrading C-pool and a slowly degrading or recalcitrant C-pool [1,27]:
Ct = Cl × (e−klt) + Cr × (e−krt)
The half-life of C in biochar-amended soil is:
t1/2 = ln(2)/k
where Cl and Cr indicate the amounts of potentially mineralizable C in the labile and resistant fractions (%), respectively; kl and kr are the respective mineralization rate constants (d−1); and t is time (d). A nonlinear regression using a double-exponential model (Sigma plot 14.0, tolerance 1 × e–10, step size 100, and 1200 iterations) was performed to mathematically define the size and turnover rate of C1, which corresponds to a small and easily mineralizable C pool with a high turnover rate (kl), and Cr, which corresponds to a large stable pool with a low turnover rate (kr) consisting of stable C. The low turnover rate value (kr) was used to calculate the half-life (t1/2) of the most stable C fraction using Equation (3).
Statistical analyses (calculation of means and standard deviations, differences of means) were performed using Statistical Analysis System (SAS) 9.4 package (SAS Institute Inc., SAS Campus Drive, Cary, NC, USA). Arithmetic means of the released CO2–C, pH, TC, TN, TP, and available nutrients were calculated from each consecutive measurement date. A repeated measure multivariate analysis of variance (MANOVA) was used to test soils, biochars, rates, and their interaction on CO2–C release from three soils for each incubation period (10 sampling times is the repeated measure). The feedstocks, addition rates, and soils served as between-subject factors, and incubation time (repeated-measure factor) served as the within-subject factor. Then, a three-way analysis of variance (ANOVA) was applied to determine TC, TN, TP, available P, K, Ca, Mg, Fe, Al, Mn, Cu, Pb, and Zn affected by soils, biochars, rates, and their interactions. The repeated measure MANOVA was carried out using the general linear model (GLM) procedure. Results were analyzed by one-way ANOVA to test the effects of each treatment. Significantly different means were compared via least significant difference (LSD) based on a t-test at a 5% probability level. Values presented in graphs and text are means ± 1 standard deviation (SD). The Pearson correlation coefficient (r) was calculated and canonical discriminant analysis (CDA) using SAS 9.4 software (SAS Institute Inc., SAS Campus Drive, Cary, NC, USA). CDA is a multivariate statistical technique that can identify differences among groups of individuals (or treatments) and improve understanding the relationships among the variables measured within those groups; CDA determines how best to separate or discriminate two or more groups of individuals given quantitative measurements of several variables on these individuals [28]. The groups are defined a priori of the calculations, and the discriminant functions explain a maximum part of the variance and are calculated by linear combinations [29]. In addition, the standardized canonical correlation coefficients are used to determine the factor that has the highest influence on the discriminant function ignoring the sign before the value.

3. Results

3.1. Biochar Characterization

Table 1 shows the basic parameters of ash (hard wood), bamboo (grasses), and lead tree (shrub) biochar pyrolyzed at high temperature (500–700 °C). The pH and EC values of ash and bamboo biochar were close and both higher than those for lead tree biochar, with B > A > L. The value of CEC ranged from 5.20 to 15.5 coml kg−1 soil−1, with B > A > L. The higher pH and EC values could be explained by the relatively higher concentration of available nutrients, especially for K, Ca, and Mg. Additionally, the total element concentrations in the feedstock showed similar changes with available concentrations. The elemental analysis results indicated that the contents of C, H, N, and O of the three studied biochars were close. For three biochars, the C percentage was higher than 80%, H was <2%, N was <1%, and O was <15%. The atomic ratios of (O + N)/C, O/C, and H/C of the three biochars were lower than 0.15, 0.15, and 0.25, respectively. The FTIR spectra of the high-temperature-pyrolyzed (>700 °C) ash, bamboo, and lead tree biochar all displayed similarly various low-intensity bands (Figure S1). These FTIR spectra results agreed with the changes in elemental composition, indicating high-temperature-pyrolyzed biochar has a higher aromatic structure content and fewer polar functional groups. The X-ray diffraction (XRD) patterns of ash and lead tree biochars showed similar broad humps (Figure S1), indicating a poorly crystalline C-rich phase in the biochar sample. No obvious peak was observed in the XRD pattern of bamboo biochar, indicating no crystalline phase had formed. SEM showed that the cell structure of the three biochars was mostly maintained after pyrolysis (Figure S1); however, more structural collapse occurred in the bamboo biochar.

3.2. Water Soluble Extracts of Biochar

The results of five-time water extraction are shown in Figure 1. Between the first and second washing, the solution pH sharply declined, which then gradually declined between the second and fifth washing. After five washings, the pH of three biochars was close: pH 7.67, 7.73, and 7.62 for ash, bamboo, and lead tree biochar, respectively. The difference in solution pH between first and fifth washing was highest (1.33 pH units) in ash biochar, followed by bamboo biochar (0.86 pH units), and lead tree biochar (0.61 pH units). The changes in EC were similar to those of pH. The difference in the solution EC between the first and fifth washing was the highest (0.90 dS m−1) in bamboo biochar, followed by ash biochar (0.69 dS m−1) and lead tree biochar (0.27 dS m−1). Five washings extracted most of the water extractable organic C (WEOC) and the cumulative WEOCs were 138, 189, and 35 mg C kg−1 biochar for ash, bamboo, and lead tree, respectively (Figure 1). As biochar was added to soil at application rates equivalent to 2% and 5% of total soil organic C, 2.75 and 6.89, 3.79 and 9.47, 0.71 and 1.77 mg water extractable C kg−1 soil were determined for ash, bamboo, and lead tree biochar, respectively. In this study, bamboo biochar application produced more water extractable C.

3.3. Carbon Mineralization

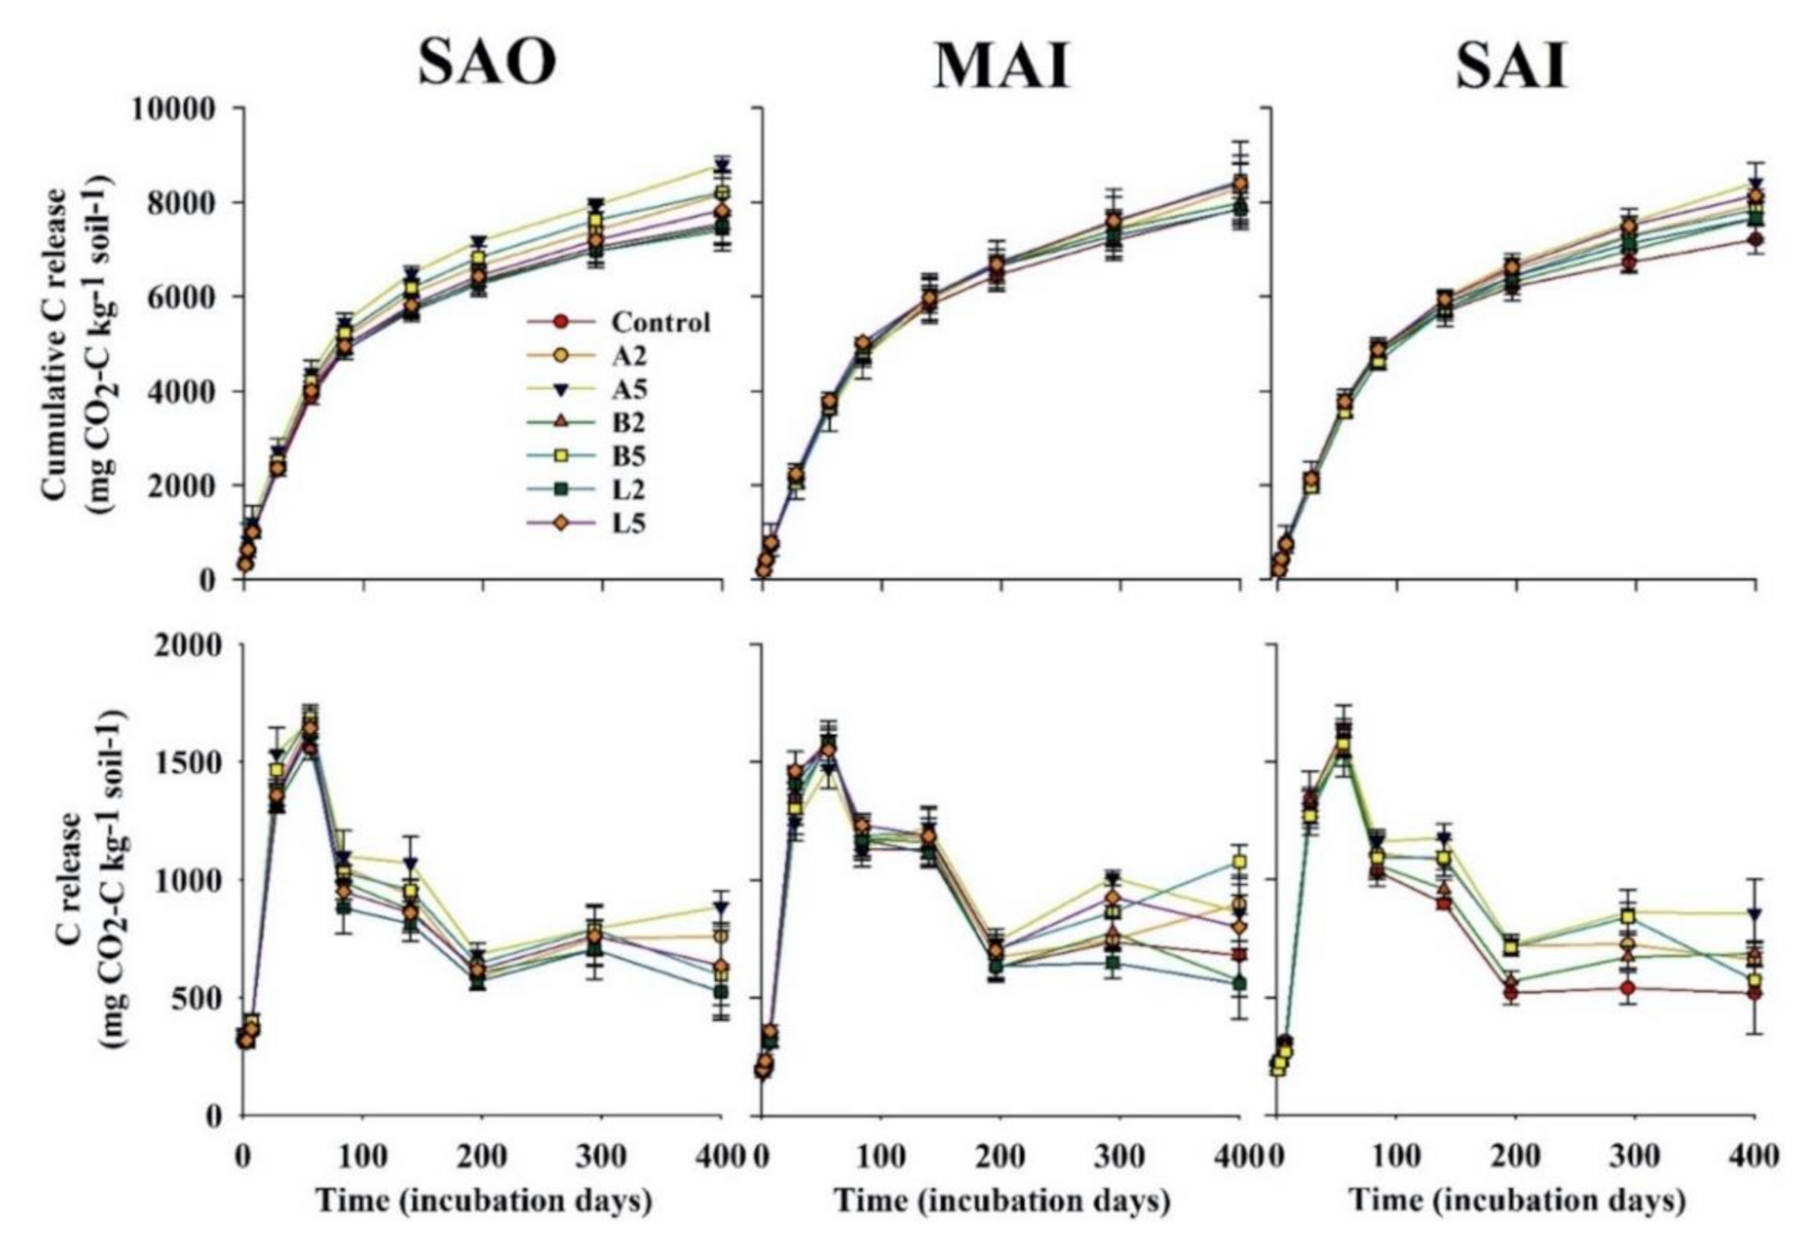
As shown in Figure 2, CO2 release significantly varied with the incubation time and showed a similar tendency for all treatments (ptime < 0.0001, Table S2), except for time × biochar × rate interaction. The rate of CO2–C release increased rapidly during the first 56 days, sharply declined from days 56 to 196, and gradually decreased thereafter to the end of incubation for all treatments (Figure 2). The between-subject effect, CO2–C releases were significantly affected by soil (p < 0.001), biochar (p < 0.01), and rate (p < 0.0001), but there were no significant interactions between these factors (p > 0.01) (Table S2). Except for the interaction between time, biochar, and rate, all possible interactions between soil, biochar, rate, and time were significant (p < 0.001–0.0001).
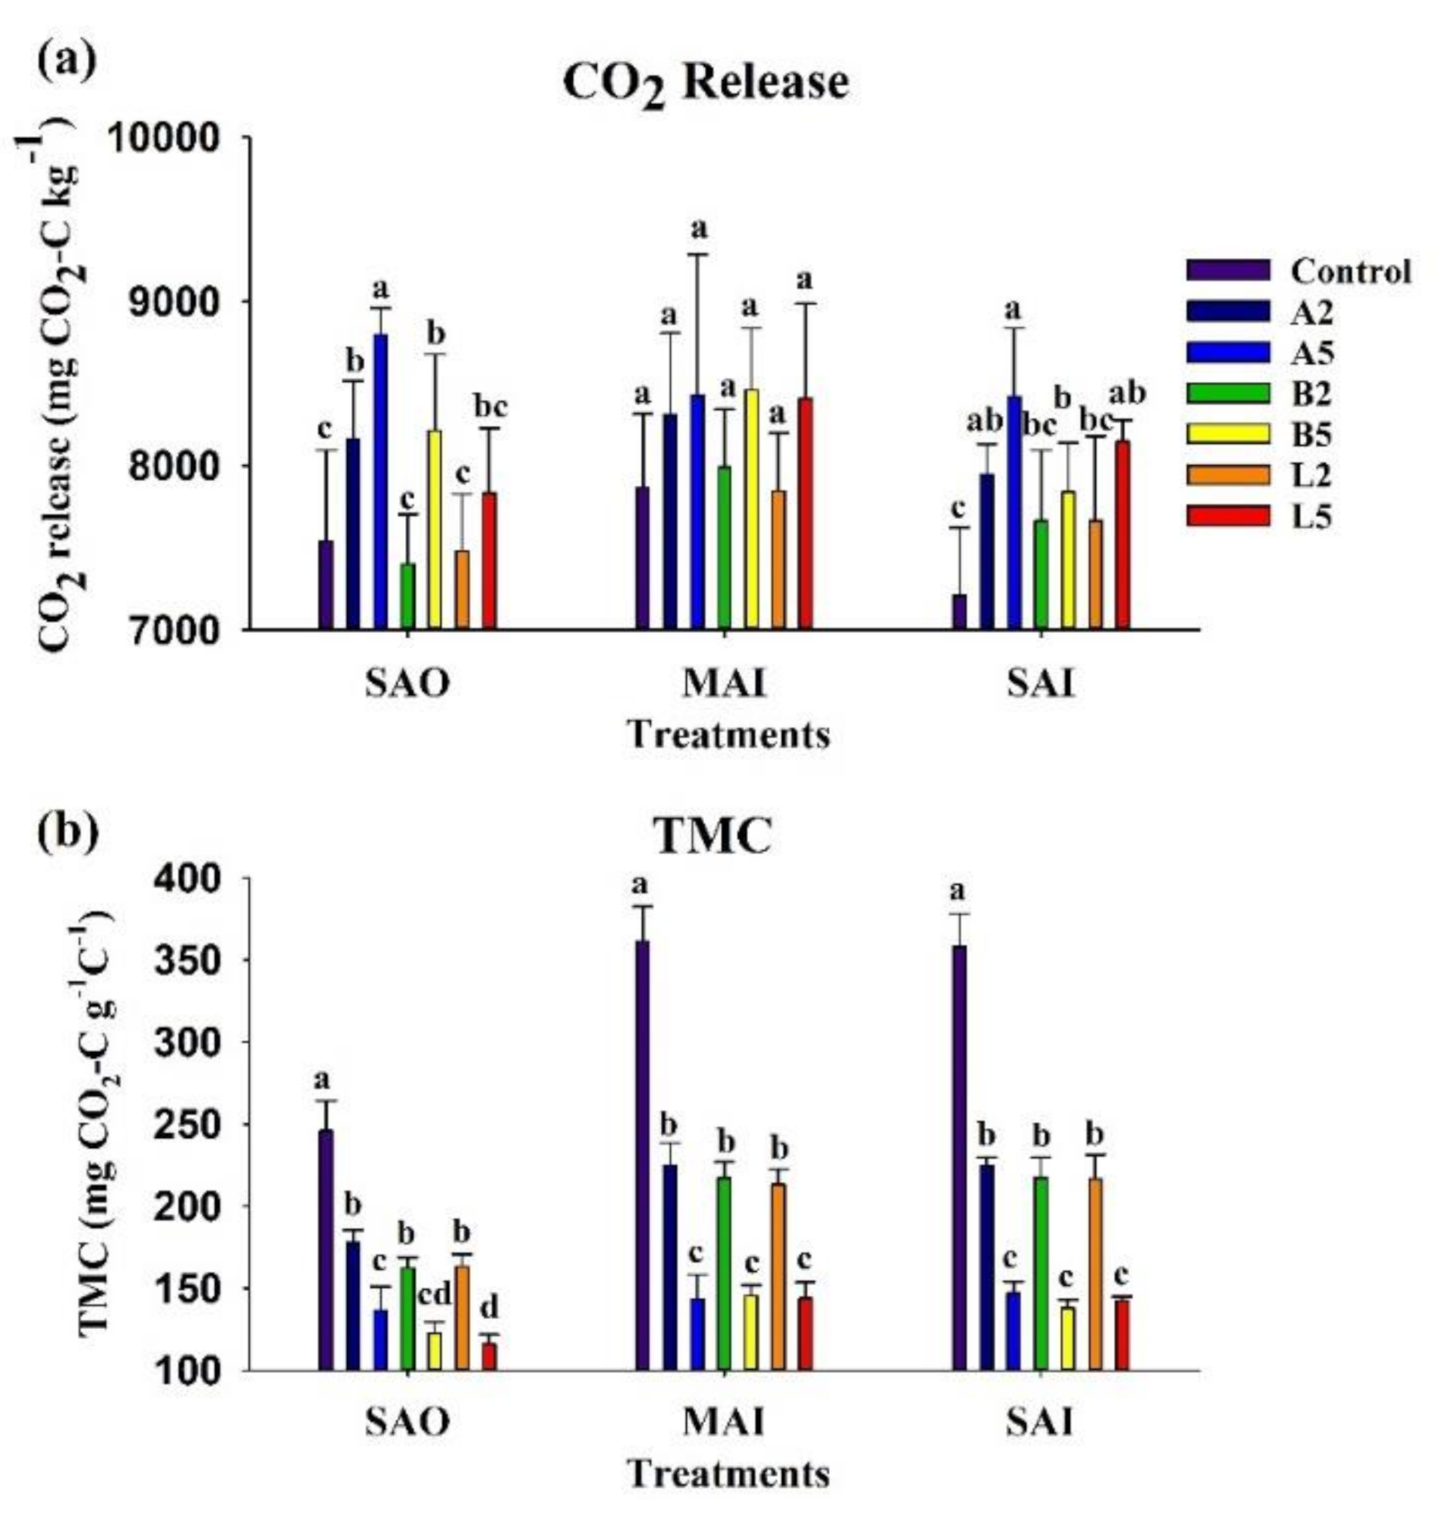
In SAO, application of 2% and 5% ash biochar (A2 and A5) and 5% bamboo biochar (B5) significantly increased cumulative CO2–C compared to the control, with A5 (+16.6%) > A2 (+8.2%) ≈ B5 (+8.5%), but applications of B2, L2, and L5 produced no significant effect (Figure 3a). No significant effect of biochar addition was found in MAI soil. A similar effect was observed in SAI and SAO soils, but the order of significant increase effect was A5 (+16.7%) ≈ A2 (+10.2%) ≈ L5 (+13.0%) > B5 (+8.7%). Respiration per unit of total organic C (TMC) significantly decreased with increased biochar addition for all studied soils (Figure 3b), with control > A2 ≈ B2 ≈ L2 >A5 ≈ B5 ≈ L5. However, the L5 treatment had the significantly lowest TMC value in SAI soil.
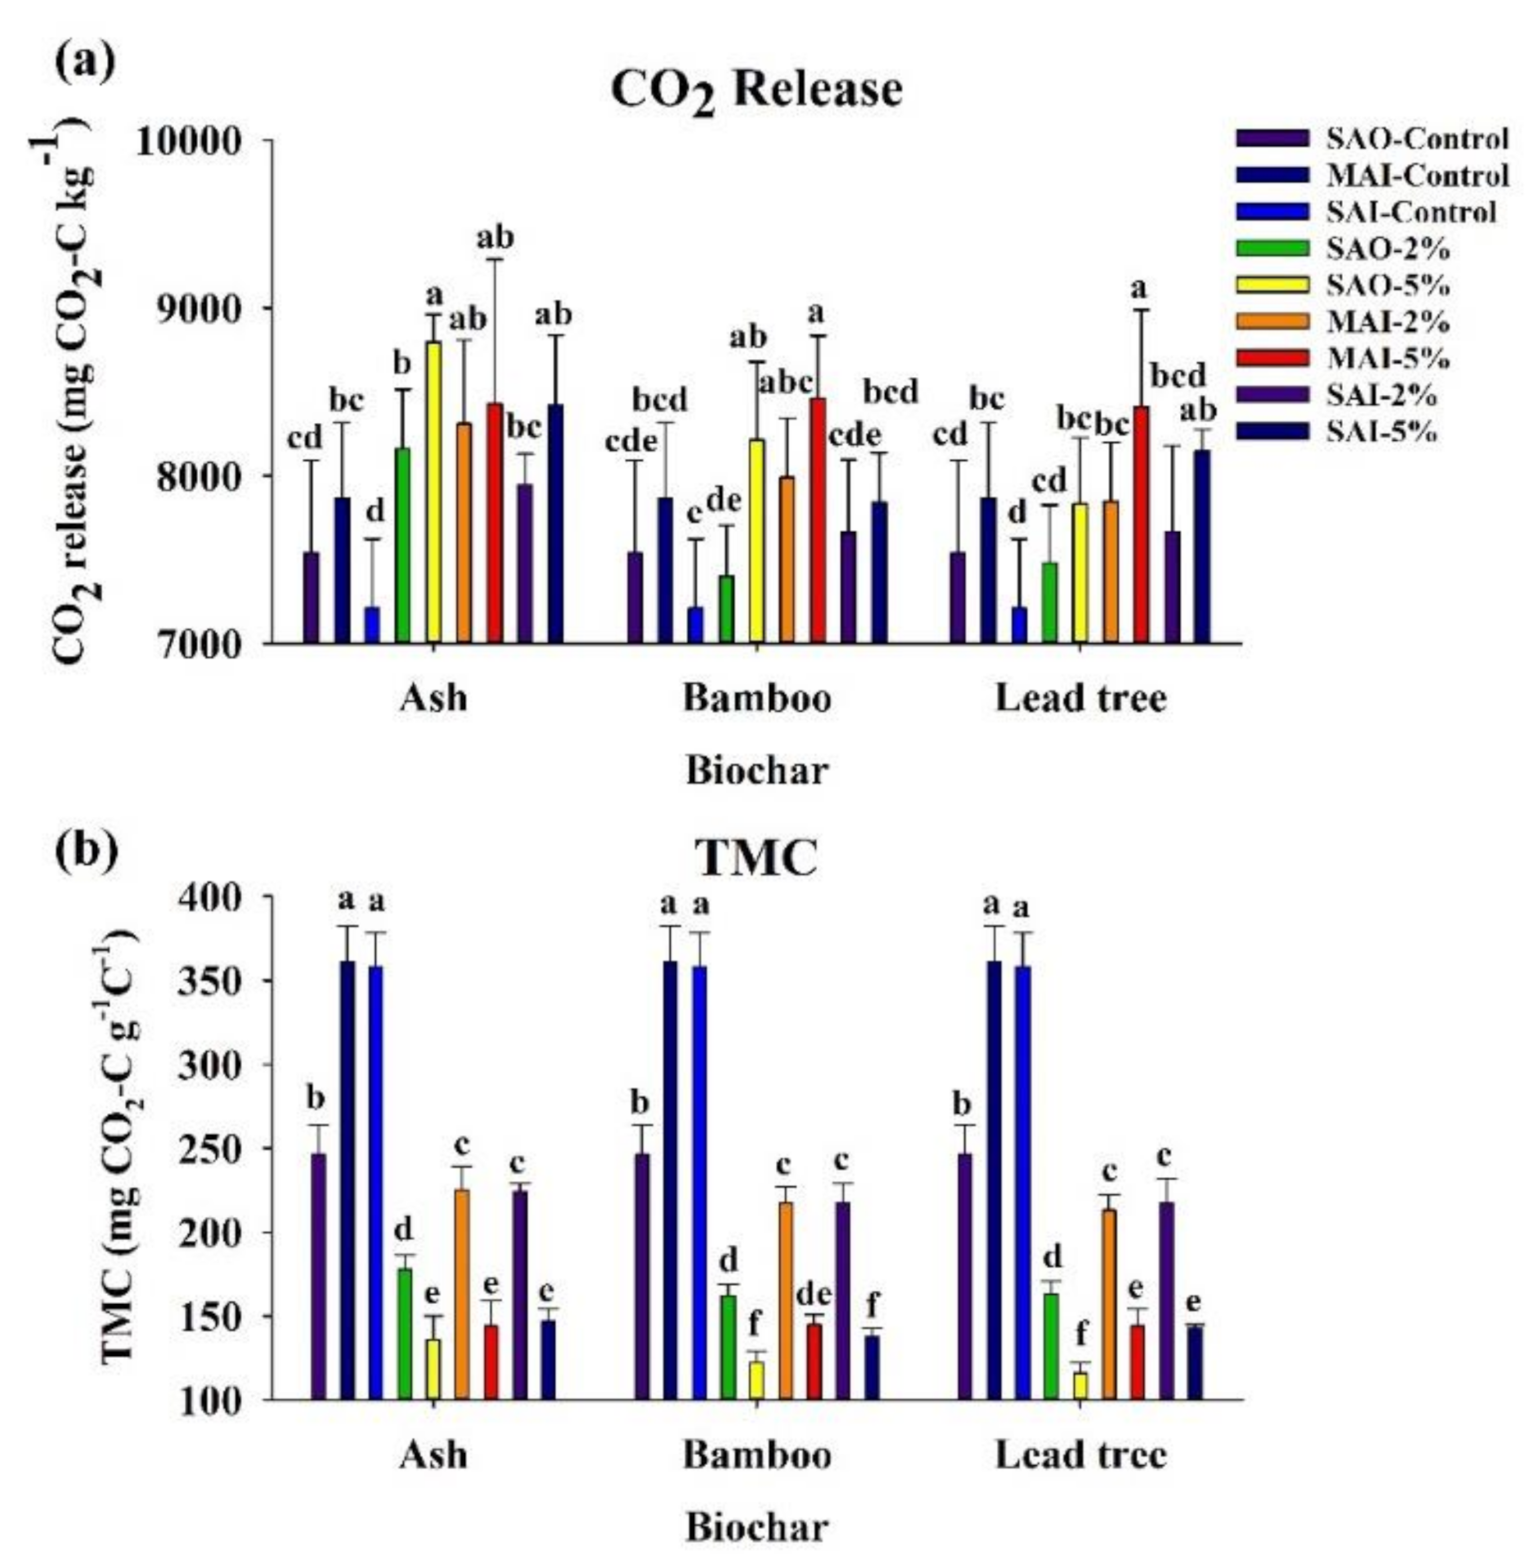
In addition, the values of CO2 release compared within a biochar, as presented in Figure 4a, indicated that soil type in relation to biochar addition showed insignificant difference after ash biochar addition. However, in bamboo biochar and lead tree biochar treatments, the SAO soil and SAI soil both with 2% biochar addition showed insignificantly but relatively lower cumulative CO2 release. The MAI soil in three biochar treatments all presented relatively higher cumulative CO2 release, and the amount of cumulative released CO2 was close to each other. The trend of TMC, presented in Figure 4b, indicated that the SAO soil with 2% addition of three biochars showed significantly lower value than the MAI and SAI soil, and with 5% addition of bamboo biochar and lead tree biochar both showed significantly lower value than the MAI and SAI soil.

3.4. Kinetics of Carbon Mineralization

With increasing addition rate, the labile C pool evidently decreased compared to the control (Table 2), but the three biochars were similar for the same addition rate. In the three soils, for the 5% addition of three biochars, the first phase was short (about 9–10% for all three biochars) due to the relatively less-mineralizable C pool (Cl) and the rate constants (kl) were high compared with other treatments. The control had the highest amounts of Cl: 23.1%, 23.1%, and 27.8% for SAO, MAI, and SAI soils, respectively, and the first phase was longer with lower rate constants. The 2% addition of the three biochars in three soils had smaller Cl pools than the control, in general, about 14% and 15–16% for SAO, and MAI and SAI soil, respectively.
The half-life (t1/2) and mean residence time (MRT) in the labile C pool were about 39–43 and 57–63 days, 39–48 and 56–70 days, and 39–50 and 56–71 days for SAO, MAI, and SAI soils, respectively. In addition, the half-life and MRT mostly slightly increased with increased addition rate. During the second phase of C mineralization, 2% and 5% addition treatments showed larger pools of relatively stable C (Cr) and the rate constants (kr) were lower in these treatments compared with the control. The half-life and MRT of C in the SAO and SAI soils calculated on the basis of the slow reaction rate constant (kr) followed the sequence A5 = B5 = L5 >A2 >B2 > L2 > control (Table 2). In the MAI soil, the sequence was A5 = B5 = L2 = L5 > A2 > B2 > control.

3.5. Nutrient Availability

In addition, at the end of incubation, all selected soil parameters were significantly affected by soil (p < 0.0001). Biochar had no significant interactions with TC and M3-Ca and -Mn, and the rate had no significant interactions with TN, TP, and M3-P, -Ca, -Mn, and -Zn (p < 0.01) (Table 3). The interactions of soil × biochar significantly affected (p < 0.0001) almost all soil variables, except for TC and M3-Ca. However, biochar × rate and soil × rate interactions just significantly (p < 0.01–0.0001) affected the concentrations of M3-K, -Ca, and -Cu; and M3-Ca, -Mn, -Cu, and -Pb, respectively. The concentrations of M3-P, -K, -Fe, -Cu, -Pb, and -Zn were significantly affected by interactions of soil × biochar × rate (p < 0.01–0.001).
The significant test of mean values between three soils, including seven treatments with three replicates for each soil, indicated that the contents of TC, TN, and M3-Cu, -Pb, and -Zn were in the order SAO > MAI > SAI (Table 3, Tables S3 and S4). The SAO soil also had the significantly highest content of TP and M3-Al. The contents of M3-K, -Ca, and -Mn were ordered as MAI > SAI > SAO. Significant differences between the three biochars were found for the contents of M3-K, -Pb, and -Cu, with bamboo > ash > lead tree. In general, the content of the selected soil variables was significantly highest in bamboo biochar, and were insignificant between ash and lead tree biochars. Of the three rates, the results showed that there were no significant effects on the contents of TN, TP, and M3-Ca, -Mn, and -Zn. The 2% addition rate also had no significant effects on the contents of M3-Mg, -Fe, -Cu, and -Pb, but in comparison, the 0% rate (control) showed significantly higher contents of TC and M3-K, and a significantly lower content of M3-Al. The contents of TC and M3-K were significantly the highest for the 5% addition rate, in contrast, M3-Al content was significantly the lowest (Table 3).

3.6. Canonical Discriminant Analysis

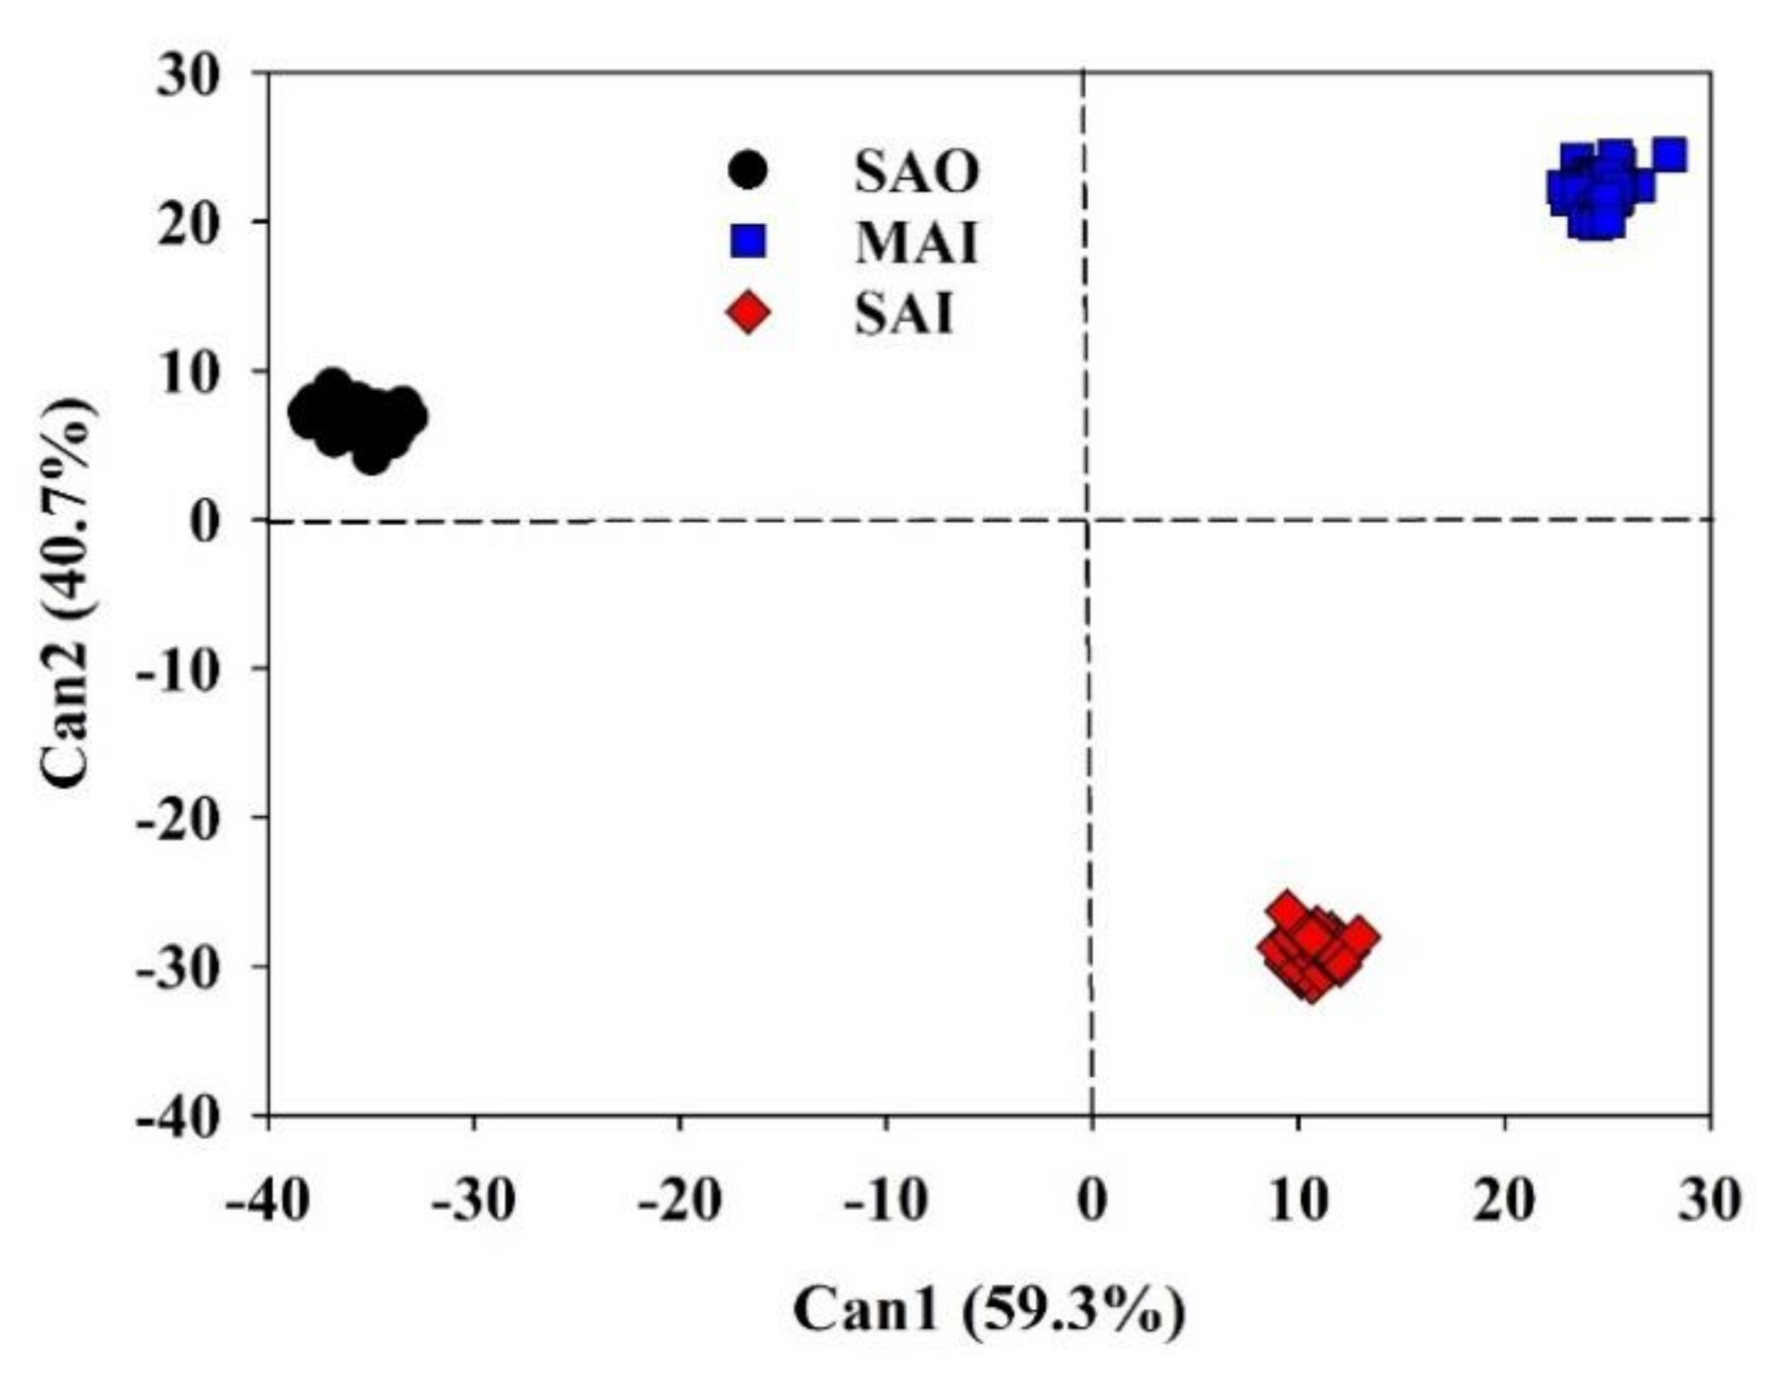
Figure 5 shows that the chemical behavior of the studied soils could be differentiated from each other. The underlying dataset of the entire C incubation experiment was used. Canonical discriminant function 1 (Can1) explained 59.3% of the variability of the chemical behavior of the seven treatments, Can2 explained 40.7%, and both functions together explained 100%. In general, the three soils were discriminated separately according to their chemical behavior. However, Can1 and Can2 both discriminated the soils to three groups, i.e., the SAO, MAI, SAI soils (Figure 5). Standardized canonical discrimination coefficient (SCC) and correlations (r) between CDFs and original variables revealed that the available M3-Al and -Mn were most important for the discrimination of the soils based on Can1, followed by TC, TN, and M3-P, -K, -Mg, and -Pb (Table S5). For the discrimination of the soils based on Can 2, the M3-Fe, -Pb, and -Zn were mainly responsible parameters, followed by M3-P and -K. The chemical behavior of the seven treatments for SAO, MAI, and SAI soils can be differentiated (Figure S2, Table S5).

4. Discussion

4.1. CO2 Emissions as Affected by Biochar

During the first 56-day incubation period (Figure 2), co-application of biochar and excessive compost stimulated CO2 emissions from three rural soils. As suggested in previous reports [30,31], co-metabolism contributes to accelerating biochar decomposition (or increased soil CO2 effluxes) in soils in the presence of easily metabolized organic C or additional labile organic C sources. We speculated that the addition of excessive labile organic C sources (compost) may increase on the C mineralization of the three soils; however, the inactive biochar could not diminish C mineralization by stabilizing the labile C pool from excessive compost at the beginning of co-application. In line with a previous study [11], the sharp decline in CO2 emissions after day 56 in SAO soil suggested that the half-life, or mean residence time (MRT), of such easily metabolized organic C was short, followed by SAI and MAI soils (Table 2). In addition, in this study, the net CO2 emissions were higher for the biochar and compost mixtures compared to control (with compost and without biochar) alone (Figure 3a). Under the condition of adding formosan ash biochar, soil type showed insignificant difference on the cumulative CO2 release (Figure 4a), but the MAI soil in three biochar treatments all presented relatively higher cumulative CO2 release. This could be attributed the carbonate content (0.81%) in the MAI soil [11], which released additional CO2 than acidic SAO and SAI soil. Biochar feedstock and pyrolysis temperature affect the emissions of CO2 from the interaction of biochar with compost organic matter (COM) [32]. In addition, the same authors [32] suggested that net CO2 emissions were lower for the biochar and compost mixtures (compared to compost alone), suggesting that biochar may stabilize COM and diminish C mineralization. However, our findings suggested that the potential of three biochars for stabilizing COM and diminishing C mineralization may be inadequate, probably due to the excessive compost. Carbon dioxide emissions increased significantly with application of 5% biochar in SAO and SAI soils with lower pH, especially for formosan ash biochar, but insignificant increase in MAI soil with a higher pH compared to the control (Figure 2 and Figure 3). Comparing within three soils, the cumulative CO2 evolution for almost all treatments, except the A5 treatment in SAO soil, was relative higher in MAI soil, followed by SAI and SAO soils. Our findings are in line with those in previous reports [11,21,33] which could be attributed to much smaller extractable Al and Mn concentrations (both highly toxic) in high-pH soil and therefore more microbial biomass than the low pH soil [34]. Besides, Watanabe [35] presented the effects of active Al and Fe (acid ammonium oxalate-extractable Al and Fe: Alo and Feo) on the preservation of organic carbon (OC) in tropical soils. The reports indicated that Alo and Feo are the most important components for OC preservation not only in the less weathered temperate soils but also in highly weathered tropical soils. In the more weathered soils, Alo may be more important than Feo probably because Al is more soluble at low pH and has greater opportunity to associate with OC, whereas Fe tends to crystallize and lose its reactivity compared with Al. Fe oxides and clay contents are less correlated with OC [35]. The contents of Feo and Alo) in g kg−1 were 3.13 and 2.53, 2.61 and 0.65, 7.53 and 0.98 for SAO, MAI, and SAI soils, respectively (unpublished data). The significantly higher active Al content in SAO soil has the potential to better preserve OC.
The excessive nitrogen fertilizer application could lead to serious soil acidification [36]. In this study, the excessive compost was an excessive nitrogen fertilizer, and may lead to soil acidification during nitrification. The high pH value of the three biochars suggested highly alkaline characteristics, which might be attributed to the hydrolysis of salts of alkali and alkaline elements like calcium (Ca), potassium (K), magnesium (Mg) [37], and sodium (Na) [38]. The high pH of biochar is advantageous when applied to acidic soil or substrates, where biochar acts as a liming material [39]. The higher pH value of ash and bamboo biochar has the potential to neutralize soil acidification during nitrification, and thus increase the CO2 release by facilitating soil microbiological activity, especially for acidic soil. In addition, the soil pH after 400 d N mineralization incubation (unpublished data) in SAO soil indicated that compared with control (pH 5.9) the pH changes were −0.13 (A2), −0.01 (A5), −0.02 (B2), −0.03 (B5), −0.02 (L2), and +0.14 (L5) pH unit, respectively. For MAI soil (control pH 6.5), the pH changes were −0.09 (A2), −0.09 (A5), −0.05 (B2), −0.10 (B5), −0.06 (L2), and −0.07 (L5) pH unit, respectively. For SAI soil (control pH 6.3), the pH changes were −0.10 (A2), +0.07 (A5), +0.02 (B2), 0.00 (B5), +0.13 (L2), and +0.10 (L5) pH unit, respectively. However, the soil pH at day 1 was pH 6.6, 7.4, and 7.3 for the control of SAO, MAI, and SAI soil, respectively. Thus, soil pH change in SAO and SAI soil was relatively lower than in MAI soil, suggesting the acidic soil neutralization by biochar additions, even in the presence of excessive compost.
Further, the study results of Méndez et al. [25] also showed that the soil respiration increases after biochar addition, and Smith et al. [40] suggested that the results have been attributed to biochar being not as inert as publicly believed but providing significant amounts of labile C used as soil as an energy source by soil micro-organisms. In addition, a labile biochar C fraction, such as 0.44% water-extractable C in Miscanthus giganteus biochar pyrolyzed at 350 °C [21] and 0.35% soluble C in switchgrass biochar [40], is presumably more microbially degradable than other biochar fractions and therefore easily available shortly after biochar addition to soil microorganisms. The relatively higher WEOC in ash and bamboo biochar, with much smaller scales of 0.01% and 0.02%, respectively, also suggested that relative higher available C could be applied after the addition of this two biochars and has the potential for enhancing C mineralization (increased soil CO2 effluxes). The enhancing effect of lead tree biochar was less pronounced because of the lower pH and much lower WEOC. In addition, the cumulative total inorganic N (TIN) (NH4+-N + NO3--N) 7.95 (5.65 + 2.30), 10.7 (5.04 + 5.69), and 9.59 (8.59 + 1.00) mg kg−1 biochar in ash, bamboo, and lead tree biochar, respectively (unpublished data). The enhancing effect was also in relevant with the release of ammonium. The 2% and 5% additions of the three biochar treatments generally reduced the M3-Al concentration compared to the control (Table S3), but bamboo biochar treatments in SAO soil, in contrast, showed increases. In general, the A5 treatment reduced more M3-Al concentration in three soils, and therefore increased microbial biomass, suggesting more C was mineralized.
The high value of TMC results in a more fragile humus (the amorphous fraction of soil organic matter) and thus in a lower quality of soil [24], and the lower TMC means that organic matter is conserved more efficiently and maintains the activity of the microorganisms responsible for soil organic matter biodegradation. In this study, the control (excessive compost only) presented the high value of TMC, and the value of TMC significant decreased with biochar addition increased. The results are in line with our previous study [11], suggesting that 2% ash biochar had significant lower TMC value than the 0.5% and 1.0% treatments. The TMC values of 2% and 5% additions showed insignificant differences between three biochars, which indicated similar potentials for conserving organic matter more efficiently. The kinetic parameters of C mineralization showed a very low rate constant and a longer half-life for the resistant C pool in the 5% treatment in the three soils relative to the control (Table 2), which, consistent with the lower TMC value, suggested the more efficient conservation of organic matter. Additionally, the relative lower TMC value in SAO soil with 2% and 5% biochar addition (Figure 4b) suggested that adding biochar, especially bamboo biochar and lead tree biochar, could efficiently conserve the organic matter in the SAO soil than in MAI and SAI soil. Soil type evidently influence the effect of biochar addition on conservation of organic matter, such as the excessive compost in current study.

4.2. C Sequestration and Nutrient Availability as Affected by Biochar

As indicated in Table 2, the half-life and MRT of resistant C of the three soils were similar: 6 and 9 years for the control, 9 and 14 years for the 2% rate, and 19 and 27 years for the 5% rate. The 2% and 5% biochar additions extended the half-life and MRT of C in three soils, which were increased about 50% and 200%, respectively. However, the effect of the three biochars on the three soils were insignificant in the condition of excessive compost co-application. The results of the current study showed that the TC contents with 2% and 5% biochar addition evidently increased, ranging from 45% (L2) to 61% (A2&B2) and from 119% (B5) to 162% (A5) SAO for the SAO soil; from 48% (B2) to 75% (A2&L2) and from 162% (B5) to 193% (L5) for the MAI soil; and from 72% (B2) to 91% (A2) and from 214% (L5) to 226% (B5) for the SAI soil, respectively. (Table S4). In general, the potential of the three biochars for C sequestration is similar in the three studied soils. Carbon (%w/w dry) is by far the most important component of biochar, where it occurs as a structure of six atoms bonded together [41], and this makes biochar the third purest form of C after diamond and graphite. Hydrogen and oxygen decrease at higher pyrolysis temperature due to the weak bonding of H and O within the biochar, gradually cleavage and cracking occur with increasing temperature [42]. The biochars used in the current study were high-temperature pyrolysis products with an accumulation of black C. This property makes it inert and resistant to microbial degradation [43]. A low O/C ratio indicates a relatively high degree of aromaticity and reduced hydrophilicity [44], essentially because the greater extent of carbonization causes the removal and loss of polar H- and O-containing functional groups from the original feedstock [45]. According to Pariyar et al. [38], the half-life of the three studied biochar is > 1000 years, as the O/C ratio is <0.2. The H/C ratio is < 0.3, suggesting that substances have a very highly condensed aromatic ring system [46]. Thus, the three studied biochars, having stable characteristics with H/C ≤ 0.6 and O/C ≤ 0.4 [47], could be used for soil application to sequester C.
The simultaneous application of biochar and compost resulted in enhanced soil fertility, in addition to enhance C sequestration [48]. A combination of biochar with compost showed the best plant growth and C sequestration, but had no effects on N and P retention [49]. In two highly weathered soils in Hawai’i (Oxisols and Ultisols), the combined application of 2% (w/w) wood biochar and 2% (w/w) compost (vermicompost or thermocompost) biochar blend significantly increased pH and EC; reduced exchangeable Al; reduced Mn and Fe in the Oxisols; increased P, K, and Ca content of the soils; and increased Ca, Mg, and Fe uptake [50]. In the current study, the K content obviously increased, especially in the B5 treatment, increasing 74%, 55%, and 66% for SAO, MAI, and SAI soils, respectively (Table S2). The changes in other soil variables occurred on a much smaller scale, ranging from −10% to +10%, and were variable in the three soils (Table 1). Pariyar et al. [38] indicated that biochar with high C content is profitable in terms of C sequestration and can be used as a resource to adsorb the pollutant from the soil. However, the changes in available Cu, Pb, and Zn contents in SAI soil were higher compared to the control, especially for Pb (15–34%; Table S2). The influence of the combined application of biochar and excessive compost on selected soil variables was much lower than reported by Berek et al. [50]. In the condition of excessive compost in the soil, the addition of 2% and 5% high-temperature-pyrolyzed biochar derived from ash, bamboo, and lead tree has obvious potential for C sequestration and increasing available K content.

5. Conclusions

The current study results presented that different biochars could have a positive effect (increasing CO2 release) in some soils and a negative (reducing CO2 release) one in other. The MRT data in our study supports the claim that even with excessive compost, biochar has the potential to be a suitable tool for soil carbon sequestration. In addition, our research results showed that biochar has potential advantages in stabilizing the excessive labile organic matter in the soil. When co-applied with excessive compost, a positive synergistic increase in soil extractable K content occurred, which could be beneficial in K-deficient highly weathered or leaching soils. However, the changes in other soil nutrient and heavy metal contents were insignificant in the three soils. Overall, 5% application rate of three high temperature-pyrolysis biochars did not have significant decrease in soil nutrients content or have obviously risk in increasing Cu, Pb, and Zn content, suggesting the less detriments to studied soils. Based on the above conclusions, we accepted our hypothesis that, in the presence of excessive compost, lower application rate (e.g., 2% by wt.) would not cause a negative effect, and we reject our hypothesis that greater biochar application rates (i.e., 5% by wt.) would cause a negative effect. The biochar and soil type can strongly influence the direction and magnitude of effect recorded.

Supplementary Materials

The following are available online at https://www.mdpi.com/2073-4395/10/11/1749/s1, Figure S1: Spectra of FT-IR and XRD, and SEM images of three studied biochars derived from ash (A), bamboo (B), and lead tree (L), Figure S2: Canonical scores of the first two canonical discriminant functions (Can) of seven treatments for SAO, MAI, and SAI soil. Table S1: Characteristics of studied compost and three soils, Table S2. Significance (p value) of repeated-measures MANOVA results on CO2-C release after 400 days of incubation, Table S3: Mean values of soil total C (TC), total nitrogen (TN), total phosphorus (TP), and Mehlich-3 extractable nutrients of biochar treatments of three soils after 400-day C mineralization incubation, Table S4: Percentage (%) of mean relative value of soil fertility after 400-day C mineralization incubation, Table S5: Standardized canonical coefficients (SCC) and correlation coefficients (r) between the first two canonical discriminant functions (Can) and variables on three soils and of seven treatments on each soil.

Author Contributions

Conceptualization, C.-C.T. and Y.-F.C.; methodology, C.-C.T. and Y.-F.C.; validation, C.-C.T. and Y.-F.C., formal analysis, Y.-F.C.; investigation, C.-C.T. and Y.-F.C.; data curation, C.-C.T. and Y.-F.C.; writing-original draft preparation, C.-C.T.; writing-review and editing, C.-C.T.; supervision, C.-C.T.; funding acquisition, C.-C.T. All authors have read and agreed to the published version of the manuscript.

Funding

This research was funded by National Science Council of the Republic of China, Contract No. NSC-102-2313-B-197-002.

Acknowledgments

The authors would like to thank the staffs of TC5 Bio-Image Tools, Technology Commons, College of Life Science, National Taiwan University, for help with scanning electron microscopy (SEM); Elemental Analysis, the Instrumentation Center, National Taiwan University, for help with C, H, N, and O contents. Special thanks to G.S. Hwang, Forest Utilization Division, Taiwan Forestry Research Institute for supplying the ash, bamboo, and lead tree biochar.

Conflicts of Interest

The authors declare no conflict of interest.

References

  1. Qayyum, M.F.; Steffens, D.; Reisenauer, H.P.; Schubert, S. Kinetics of carbon mineralization of biochars compared with wheat straw in three soils. J. Environ. Qual. 2012, 41, 1210–1220. [Google Scholar] [CrossRef] [PubMed]
  2. Glaser, B.; Lehmann, J.; Zech, W. Ameliorating physical and chemical properties of highly weathered soils in the tropics with charcoal—A review. Biol. Fertil. Soils 2002, 35, 219–230. [Google Scholar] [CrossRef]
  3. Keith, A.; Singh, B.; Singh, B.P. Interactive priming of biochar and labile organic matter mineralization in a smectite-rich soil. Environ. Sci. Technol. 2011, 45, 9611–9618. [Google Scholar] [CrossRef] [PubMed]
  4. Plaza, C.; Giannetta, B.; Fernández, J.M.; López-de-Sá, E.G.; Polo, A.; Gascó, G.; Méndez, A.; Zaccone, C. Response of different soil organic matter pools to biochar and organic fertilizers. Agric. Ecosyst. Environ. 2016, 225, 150–159. [Google Scholar] [CrossRef]
  5. Liang, B.; Lehmann, J.; Solomon, D.; Sohi, S.; Thies, J.E.; Skjemstad, J.O.; Luizão, F.J.; Engelhard, M.H.; Neves, E.G.; Wirick, S. Stability of biomass-derived black carbon in soils. Geochim. Cosmochim. Acta 2008, 72, 1598–1610. [Google Scholar] [CrossRef]
  6. Rogovska, N.; Laird, D.; Cruse, R.; Fleming, P.; Parkin, T.; Meek, D. Impact of biochar on manure carbon stabilization and greenhouse gas emissin. Soil Sci. Soc. Am. J. 2011, 75, 871–879. [Google Scholar] [CrossRef] [Green Version]
  7. Zimmerman, A.R.; Gao, B.; Ahn, M.-Y. Positive and negative carbon mineralization priming effects among a variety of biochar-amended soils. Soil Biol. Biochem. 2011, 43, 1169–1179. [Google Scholar] [CrossRef]
  8. Biederman, L.A.; Harpole, S. Biochar and its effects on plant productivity and nutrient cycling: A meta-analysis. Glob. Chang. Biol. 2013, 5, 202–214. [Google Scholar] [CrossRef]
  9. Windeatt, J.H.; Ross, A.B.; Williams, P.T.; Forster, P.M.; Nahil, M.A.; Singh, S. Characteristics of biochars from crop residues: Potential for carbon sequestration and soil amendment. J. Environ. Manag. 2014, 146, 189–197. [Google Scholar] [CrossRef]
  10. Ippolito, J.A.; Stromberger, M.E.; Lentz, R.D.; Dungan, R.S. Hardwood biochar and manure co-application to a calcareous soil. Chemosphere 2016, 142, 84–91. [Google Scholar] [CrossRef]
  11. Tsai, C.-C.; Chang, Y.-F. Carbon dynamics and fertility in biochar-amended soils with excessive compost application. Agronomy 2019, 9, 511. [Google Scholar] [CrossRef] [Green Version]
  12. Soil Survey Staff. Soil Survey Manual; United States Department of Agriculture Handbook No. 18; U.S. Government Printing Office: Washington, DC, USA, 2017.
  13. Hwang, G.S.; Yu, H.Y.; Toba, A. Effects of carbonization temperatures in an earthen kiln on the true density and electric resistivity of Makino bamboo charcoal. Taiwan J. For. Sci. 2004, 19, 237–245. [Google Scholar] [CrossRef]
  14. Hwang, G.S.; Ho, C.L.; Yu, H.Y.; Su, Y.C. Bamboo vinegar collected during charcoal making with an earthen kiln and its basic properties. Taiwan J. For. Sci. 2006, 21, 547–557, (In Chinese, with English abstract). [Google Scholar]
  15. Hwang, G.-S. Evaluation of the carbon retention benefits of charcoal derived from lead tree (Leucaena leucocephala (Lam.) de. Wit). For. Res. Prof. Newsl. 2009, 16, 33–35. (In Chinese) [Google Scholar] [CrossRef]
  16. Hwang, G.-S. Charcoal production and product development of lead tree (Leucaena leucocephala (Lam.) de. Wit). For. Res. Prof. Newsl. 2012, 19, 30–32. (In Chinese) [Google Scholar] [CrossRef]
  17. Hwang, G.S.; Lee, C.M.; Ho, C.L.; Yu, H.Y.; Wang, C.H.; Yu, H.M. Study on earthen kiln charcoal making with branches of Fraxinus Formosana pruned from plain afforestation. Q. J. Chin. For. 2013, 46, 63–72, (In Chinese, with English abstract). [Google Scholar]
  18. Tsai, C.C.; Hu, T.E.; Chen, Z.S. Estimation of soil organic carbon stocks in plantation forest soils of Northern Taiwan. Taiwan J. For. Sci. 2009, 24, 103–115. [Google Scholar] [CrossRef]
  19. Tsai, C.-C.; Chang, Y.-F. Effects of biochar to excessive compost-fertilized soils on the nutrient status. Agronomy 2020, 10, 683. [Google Scholar] [CrossRef]
  20. Hernandez-Mena, L.; Pécora, A.; Beraldo, A. Slow pyrolysis of bamboo biomass: Analysis of biochar properties. Chem. Eng. Trans. 2014, 37, 115–120. [Google Scholar] [CrossRef]
  21. Luo, Y.; Durenkamp, Y.; De Nobili, M.; Lin, Q.; Brookes, P.C. Short term soil priming effects and the mineralisation of biochar following its incorporation to soils of different pH. Soil Biol. Biochem. 2011, 43, 2304–2314. [Google Scholar] [CrossRef]
  22. Tsai, C.-C.; Chang, Y.-F. Nitrogen Availability in Biochar-Amended Soils with Excessive Compost Application. Agronomy 2020, 10, 444. [Google Scholar] [CrossRef] [Green Version]
  23. Zibilske, L.M. Carbon Mineralization. In Methods of Soil Analysis, Part 2, Microbiological and Biochemical Properties; Weaver, R.W., Angle, J.S., Bottomly, P., Eds.; Soil Science of America Inc.: Madison, WI, USA, 1994; pp. 835–863. [Google Scholar]
  24. Díez, J.A.; Polo, A.; Guerrero, F. Effect of sewage sludge on nitrogen availability in peat. Biol. Fertil. Soils 1992, 13, 248–251. [Google Scholar] [CrossRef] [Green Version]
  25. Méndez, A.; Gómez, A.; Paz-Ferreiro, J.; Gascó, G. Effects of sewage sludge biochar on plant metal availability after application to a Mediterranean soil. Chemosphere 2012, 89, 1354–1359. [Google Scholar] [CrossRef] [PubMed]
  26. Hailegnaw, N.S.; Mercl, F.; Pračke, K.; Száková, J.; Tlustoš, P. High temperature-produced biochar can be efficient in nitrate loss prevention and carbon sequestration. Geoderma 2019, 338, 48–55. [Google Scholar] [CrossRef]
  27. Bai, M.; Wilske, B.; Buegger, F.; Esperschütz, J.; Kammann, C.I.; Eckhardt, C.; Koestler, M.; Kraft, P.; Bach, M.; Frede, H.G.; et al. Degradation kinetics of biochar from pyrolysis and hydrothermal carbonization in temperate soils. Plant Soil 2013, 372, 375–387. [Google Scholar] [CrossRef]
  28. Cruz-Castillo, J.G.; Ganeshanandam, S.; MacKay, B.R.; Lawes, G.S.; Lawoko, C.R.O.; Woolley, D.J. Applications of canonical discriminant analysis in horticultural research. HortScience 1994, 29, 1115–1119. [Google Scholar] [CrossRef] [Green Version]
  29. Rinklebe, J.; Shaheen, S.M.; Yu, K. Release of As, Ba, Cd, Cu, Pb, and Sr under pre-definite redox conditions in different rice paddy soils originating from the USA and Asia. Geoderma 2016, 270, 21–32. [Google Scholar] [CrossRef]
  30. Liang, B.; Lehmann, J.; Sohi, S.P.; Thies, J.E.; O’Neill, B.; Trujillo, L.; Gaunt, J.; Solomon, D.; Grossman, J.; Neves, E.G.; et al. Black carbon affects the cycling of non-black carbon in soil. Org. Geochem. 2010, 41, 206–213. [Google Scholar] [CrossRef]
  31. Novak, J.M.; Busscher, W.J.; Watts, D.W.; Laird, D.A.; Ahmedna, M.A.; Niandou, M.A.S. Short-term CO2 mineralization after additions of biochar and switchgrass to a Typic Kandiudult. Geoderma 2010, 154, 281–288. [Google Scholar] [CrossRef]
  32. Mukome, F.N.D.; Six, J.; Parikh, S.J. The effects of walnut shell and wood feedstock biochar amendments on greenhouse gas emissions from a fertile soil. Geoderma 2013, 200–201, 90–98. [Google Scholar] [CrossRef]
  33. Cheng, C.H.; Lehmann, J.; Engelhard, M.H. Natural oxidation of black carbon in soils: Changes in molecular form and surface charge along a climosequence. Geochim. Cosmochim. Acta 2008, 72, 1598–1610. [Google Scholar] [CrossRef]
  34. Aciego Pietri, J.C.; Brookes, P.C. Relationships between soil pH and microbial properties in a UK arable soil. Soil Biol. Biochem. 2008, 40, 1856–1861. [Google Scholar] [CrossRef]
  35. Watanabe, T. Significance of active aluminum and iron on organic carbon preservation and phosphate sorption/release in tropical soils. In Soils, Ecosystem Processes, and Agricultural Development; Funakawa, S., Ed.; Springer: Tokyo, Japan, 2017; pp. 103–125. [Google Scholar] [CrossRef]
  36. Malhi, S.J.; Nyborg, M.; Harapiak, J.T. Effects of long-term N fertilizer-induced acidification and liming on micronutrients in soil and in bromegrass hay. Soil Tillage Res. 1998, 8, 91–100. [Google Scholar] [CrossRef]
  37. Gaskin, J.W.; Steiner, C.; Harris, K.; Das, K.C.; Bibens, B. Effect of low-temperature pyrolysis conditions on biochar for agricultural use. Trans ASABE 2008, 51, 2061–2069. [Google Scholar] [CrossRef]
  38. Pariyar, P.; Kumari, K.; Jain, M.K.; Jadhao, P.S. Evaluation of change in biochar properties derived from different feedstock and pyrolysis temperature for environmental and agricultural application. Sci. Total Environ. 2020, 713, 136433. [Google Scholar] [CrossRef]
  39. Prasad, M.; Tzortzakis, N.; McDaniel, N. Chemical characterization of biochar and assessment of the nutrient dynamics by means of preliminary plant growth tests. J. Environ. Manag. 2018, 216, 89–95. [Google Scholar] [CrossRef]
  40. Smith, J.L.; Collins, H.P.; Bailey, V.L. The effect of young biochar on soil respiration. Soil Biol. Biochem. 2010, 42, 2345–2347. [Google Scholar] [CrossRef]
  41. Aller, M.F. Biochar properties: Transport, fate, and impact. Crit. Rev. Environ. Sci. Technol. 2016, 46, 1183–1296. [Google Scholar] [CrossRef]
  42. Demirbas, A. Combustion characteristics of different biomass fuels. Prog. Energy Combust. Sci. 2004, 30, 219–230. [Google Scholar] [CrossRef]
  43. Spokas, K.A. Review of the stability of biochar in soils: Predictability of O:C molar ratios. Carbon Manag. 2010, 1, 289–303. [Google Scholar] [CrossRef] [Green Version]
  44. Zhao, S.X.; Ta, N.; Wang, X.D. Effect of temperature on the structural and physicochemical properties of biochar with apple tree branches as feedstock material. Energies 2017, 10, 1293. [Google Scholar] [CrossRef] [Green Version]
  45. Kim, W.K.; Shim, T.; Kim, Y.S.; Hyun, S.; Ryu, C.; Park, Y.K.; Jung, J. Characterization of cadmium removal from aqueous solution by biochar produced from a giant Miscanthus at different pyrolytic temperatures. Bioresour. Technol. 2013, 138, 266–270. [Google Scholar] [CrossRef] [PubMed]
  46. Hammes, K.; Smernik, R.J.; Skjemstad, J.O.; Herzog, A.; Vogt, U.F.; Schmidt, M.W.I. Synthesis and characterisation of laboratory charred grass straw (Oryza sativa) and chestnut wood (Castanea sativa) as reference materials for black carbon quantification. Org. Geochem. 2006, 37, 1629–1633. [Google Scholar] [CrossRef]
  47. Schimmelpfennig, S.; Glaser, B. One step forward toward characterization: Some important material properties to distinguish biochars. J. Environ. Qual. 2012, 41, 1001–1013. [Google Scholar] [CrossRef] [PubMed] [Green Version]
  48. Agegnehu, G.; Bass, A.M.; Nelson, P.N.; Bird, M.I. Benefits of biochar, compost and biochar–compost for soil quality, maize yield and greenhouse gas emissions in a tropical agricultural soil. Sci. Total Environ. 2016, 543, 295–306. [Google Scholar] [CrossRef]
  49. Schulz, H.; Glaser, B. Effects of biochar compared to organic and inorganic fertilizers on soil quality and plant growth in a greenhouse experiment. J. Plant Nutr. Soil Sci. 2012, 175, 410–422. [Google Scholar] [CrossRef]
  50. Berek, A.K.; Hue, N.V.; Radovich, T.J.K.; Ahmad, A.A. Biochars improve nutrient phyto-availability of Hawaii’s highly weathered soils. Agronomy 2018, 8, 203. [Google Scholar] [CrossRef] [Green Version]
Figure 1. The values of pH and electrical conductivity (EC), and concentrations of cumulative organic C extracted from ash, bamboo, and lead tree biochar by water 5 times. Error bars represent standard deviation of the mean (n = 3).
Agronomy 10 01749 g001
Figure 2. Cumulative CO2-C evolution and C release for all treatments from SAO, MAI, and SAI soil during the incubation period. A2 (2% ash biochar), A5 (5% ash biochar), B2 (2% bamboo biochar), B5 (5% bamboo biochar), L2 (2% lead tree biochar), L5 (5% lead tree biochar). Values represent means (n = 5) ± standard deviation (error bars). SAO: slightly acidic Oxisols; MAI: mildly alkaline Inceptisols; SAI: slightly acid Inceptisols.
Agronomy 10 01749 g002
Figure 3. (a) CO2-C released (mg C kg−1 dry weight) and (b) total mineralization coefficient (TMC) (mg CO2-C g−1 C−1) from excessive compost-fertilized SAO, MAI, and SAI soil treated with 2% (2) and 5% (5) of biochar derived from ash (A), bamboo (B), and lead tree (L) compared to the untreated soil (as the control) after the C incubation experiment. Each value is the average ± standard deviation from five independent experiments. Means compared within a soil, followed by a different lowercase letter, are significantly different at p < 0.05 using a one-way ANOVA (multiple comparisons vs. studied soil + 0% biochar as a control).
Agronomy 10 01749 g003
Figure 4. (a) CO2-C released (mg C kg−1 dry weight) and (b) total mineralization coefficient (TMC) (mg CO2-C g−1 C−1) from excessive compost-fertilized SAO, MAI, and SAI soil treated with 0% (control), 2% and 5% of biochar derived from ash, bamboo, and lead tree after the C incubation experiment. Each value is the average ± standard deviation from five independent experiments. Means compared within a biochar, followed by a different lowercase letter, are significantly different at p < 0.05 using a one-way ANOVA (multiple comparisons vs. studied soil).
Agronomy 10 01749 g004
Figure 5. Canonical scores of the first two canonical discriminant functions (Can) of SAO, MAI, and SAI soil. SAO: slightly acidic Oxisols; MAI: mildly alkaline Inceptisols; SAI: slightly acid Inceptisols.
Agronomy 10 01749 g005
Table 1. Chemical characteristics (mean value ± standard deviation) of studied ash, bamboo, and lead tree biochars.
CharacteristicsAsh BiocharBamboo BiocharLead Tree Biochar
pH 110.3 ± 0.0310.6 ± 0.049.9 ± 0.03
Electrical Conductivity (EC) (dS m−1)1.97 ± 0.03 1/2.63 ± 0.04 22.16 ± 0.08 1/3.06 ± 0.09 20.77 ± 0.03 1/1.36 ± 0.02 2
Cation exchangeable capacity (CEC) (cmol(+) kg−1 soil)8.46 ± 1.3515.5 ± 6.645.20 ± 0.53
Exchangeable K (cmol(+) kg−1 soil)7.22 ± 0.946.02 ± 1.721.91 ± 0.15
Exchangeable Na (cmol(+) kg−1 soil)1.40 ± 0.051.17 ± 0.021.26 ± 0.01
Exchangeable Ca (cmol(+) kg−1 soil)2.16 ± 0.270.30 ± 0.083.62 ± 0.32
Exchangeable Mg (cmol(+) kg−1 soil)0.68 ± 0.050.21 ± 0.070.40 ± 0.02
Base saturation (BS) (%)100 (119~155)54.0 ± 17.9100 (102~163)
Mehlich 3-P (mg kg−1)872 ± 12.7487 ± 29.196.6 ± 3.13
Mehlich 3-K (mg kg−1)2389 ± 4.922886 ± 259616 ± 41.8
Mchlich 3-Ca (mg kg−1)3650 ± 115465 ± 4.534093 ± 447
Mehlich 3-Mg (mg kg−1)422 ± 8.29218 ± 25.6278 ± 8.17
Mehlich 3-Fe (mg kg−1)88.4 ± 0.1440.6 ± 0.3565.5 ± 4.12
Mehlich 3-Mn (mg kg−1)42.9 ± 0.0544.4 ± 2.9320.9 ± 0.90
Mehlich 3-Cu (mg kg−1)7.92 ± 0.740.53 ± 0.010.02 ± 0.03
Mehclich 3-Pb (mg kg−1)ND 30.04ND 3
Mehlich 3-Zn (mg kg−1)6.24 ± 1.3219.9 ± 1.900.35 ± 0.06
Total P (g kg−1)1.81 ± 0.071.86 ± 0.040.55 ± 0.01
Total K (g kg−1)1.59 ± 0.052.18 ± 0.030.63 ± 0.02
Total Na (g kg−1)0.39 ± 0.010.34 ± 0.010.36 ± 0.01
Total Ca (g kg−1)4.96 ± 0.180.51 ± 0.0017.19 ± 0.40
Total Mg (g kg−1)0.48 ± 0.020.30 ± 0.0040.32 ± 0.02
Total Cu (mg kg−1)13.7 ± 0.702.80 ± 0.081.36 ± 0.04
Total Pb (mg kg−1)0.83 ± 0.360.83 ± 0.160.41 ± 0.02
Total Zn (mg kg−1)9.40 ± 1.7627.2 ± 0.501.73 ± 0.16
Elemental analysis
C%83.0 ± 0.4081.8 ± 0.3782.5 ± 0.91
H%1.49 ± 0.041.60 ± 0.121.50 ± 0.01
N%0.54 ± 0.010.64 ± 0.050.70 ± 0.01
O%12.6 ± 0.0413.3 ± 0.1312.0 ± 0.11
C/N ratio154128118
(O + N)/C atomic ratio0.1140.1290.116
O/C atomic ratio0.1080.1220.109
H/C atomic ratio0.2150.2340.219
1 The pH and EC of biochar were measured using 1:5 solid: solution ratio after shaking for 30 min in deionized water; 2 Biochar EC was measured after shaking biochar–water mixtures (1:5 solid: solution ratio) for 24 h; 3 ND = not detected.
Table 2. Kinetic parameters 1 of carbon mineralization.
SoilTreatmentLabile C PoolResistant C PoolRsqrAdj Rsqr
Cl (%)kl (% d−1)t1/2 (d)MRT (d)Cr (%)kr (% d−1)t1/2 (yr)MRT (yr)
SAOControl23.10.0174405776.90.0003690.93300.9260
A214.20.0163436185.80.00029140.97510.9725
A59.000.0170415991.00.000119270.99500.9944
B214.30.0168416085.70.00029140.96420.9605
B59.320.0158446390.70.000119270.99110.9902
L214.40.0169415985.60.00029140.96310.9593
L58.790.0176395791.20.000119270.98050.9785
MAIControl23.10.0174405776.90.0003690.93300.9260
A215.00.0156446485.00.00029140.99930.9989
A59.300.0150466790.70.000119270.99950.9992
B216.70.0143487083.30.00029140.99950.9992
B59.600.0151466690.40.000119270.99930.9989
L216.60.0149476783.40.000119270.99950.9993
L59.100.0178395690.90.000119270.99930.9990
SAIControl27.80.0168416072.20.0003690.99900.9986
A216.20.0149476783.80.00029140.99940.9991
A59.630.0153456590.40.000119270.99930.9991
B215.00.0178395685.00.00029140.99930.9991
B510.20.0140507189.80.000119270.99940.9992
L215.90.0168416084.10.00029140.99920.9989
L59.820.0158446390.20.000119270.99940.9991
1 Cr = 100-Cl; Parameters of the double-exponential equation were obtained by nonlinear regression using Sigma plot 14.0.; kl, rate constant for relatively easily mineralizable C pool (Cl); kr, rate constant for slowly mineralizable C pool (Cr); MRT, mean residence time; Rsqr, R square; Adj Rsqr, adjusted R square.
Table 3. Summary of three-way ANOVA results on soil total C (TC), total nitrogen (TN), total phosphorus (TP), and Mehlich-3 extractable nutrients (P, K, Ca, Mg, Fe, Al, Mn, Cu, Pb, and Zn) in three soils (Soil), three biochars (Biochar), and biochar application rates (Rate) after 400 days of C incubation.
Sourcedf 1TCTNTPPKCaMgFeAlMnCuPbZn
Soil2*** 2************************************
Biochar2ns**********ns*******ns*********
Rate2***nsnsns***ns*******ns*****ns
Soil × Biochar4ns************ns*********************
Biochar × Rate4nsnsnsns****nsnsnsns**nsns
Soil × Rate4nsnsnsnsns*nsnsns********ns
Soil × Biochar × Rate8nsnsns****nsns*nsns***
SourcenTCTNTPPKCaMgFeAlMnCuPbZn
Soil
SAO35A 3AABCCCBACAAA
MAI35BBBAAABCCABBB
SAI35CCBCBBAABBCCC
Biochar
Ash30ABBABBBABABBBB
Bamboo30BAAAAAAAAAAAA
Lead tree30ABABBCABABBBBCC
Rate
0%15CAABCAAAAAAAA
2%45BAAABAAABAAAA
5%45AAAABAABBCABBA
1: df = degree of freedom; 2 * p < 0.01; ** p < 0.001; *** p < 0.0001, ns = not significant (p >0.0001); 3 The different uppercase letter indicates significant difference (p < 0.05) within the means of column of soils, biochars, and addition rates.
Publisher’s Note: MDPI stays neutral with regard to jurisdictional claims in published maps and institutional affiliations.