Article

Effects of Elevated CO2 on Tomato (Lycopersicon esculentum Mill.) Growth and Rhizosphere Soil Microbial Community Structure and Functionality

1
Research Center for Environmental Ecology and Engineering, School of Environmental Ecology and Biological Engineering, Wuhan Institute of Technology, Wuhan 430073, China
2
Zhejiang Key Laboratory of Urban Environmental Processes and Pollution Control, Ningbo Urban Environment Observation and Research Station, Chinese Academy of Sciences, Ningbo 315800, China
3
Key Laboratory of Urban Environment and Health, Institute of Urban Environment, Chinese Academy of Sciences, Xiamen 361021, China
*
Author to whom correspondence should be addressed.
Agronomy 2020, 10(11), 1752; https://doi.org/10.3390/agronomy10111752
Submission received: 12 October 2020 / Revised: 4 November 2020 / Accepted: 6 November 2020 / Published: 11 November 2020

Abstract

:
Although elevated CO2 (eCO2) in the atmosphere is one of the main factors influencing climate and ecosystem stability, less research on eCO2 in greenhouse soil systems has been conducted, despite their prevalence. In this article, phospholipid fatty acid (PLFA) profiling, 16S rRNA and Internally Transcribed Spacer (ITS) gene sequencing and high-throughput quantity polymerase chain reactions (HT-qPCRs) for 72 biogeochemical cycling-related genes were used to reveal the comprehensive responses of microbes to 23 days eCO2 fumigation in the soil of a tomato greenhouse. Our results indicated that eCO2 significantly increased microbial biomass (p < 0.05). The fungal community was more susceptible to eCO2 than the bacterial community; the fungal alpha diversity indices decreased significantly under eCO2 (p < 0.05) and the abundance of Ascomycota and its lower level taxa also increased significantly (p < 0.01). The absolute abundance of numerous C, N, P, S and methane cycling related genes increased significantly (p < 0.05) under eCO2. Furthermore, the microbial community structure and function were correlated with certain measured plant characteristics. Hence, the microbial ecosystem of the tomato greenhouse soil system was stimulated under eCO2. These results contribute to a greater understanding of how eCO2 in the atmosphere affects terrestrial ecosystem stability.

Graphical Abstract

1. Introduction

The atmospheric CO2 concentration has increased rapidly in the past two hundred years due to industrial development [1]. The resultant increased temperatures and higher sea level will directly threaten life on earth, including human life and ecological stability. Plant photosynthesis is a highly efficient and low-cost method of CO2 absorption that might significantly affect soil ecosystems [2]. However, little research on the microbial community in the rhizosphere soils of greenhouse plants has been performed, even though greenhouses are widespread [3,4].
Elevated CO2 levels generally stimulate net primary production by increasing photosynthetic rates and water use efficiency, leading to higher shoot, root and total biomass and better-tasting fruits [5,6,7]. Root secretions are greatly increased under elevated CO2 conditions and are characterized by a higher C/N ratio, including sugars such as sucrose, glucose and fructose, soluble organic carbon, potassium ions, amino acids and carboxylic acids [7,8,9,10], resulting in changes in soil nutrient status [11] and soil physiochemical properties [12]. These root secretions can be decomposed rapidly by heterotrophic microorganisms, resulting in increased microbial biomass [13], increased microbial activity [14,15,16] or changed microbial community structure [17,18].
Studies on the influences of eCO2 on soil microbial ecology have been mainly carried out in forest and grassland systems [5,19,20,21], with few studies focusing on agricultural ecosystems (such as soybean, maize or rice soil) [4,22,23]. Both negative and positive changes in rhizosphere microbial community composition have occurred under eCO2 in terms of microbial activity [24,25,26], microbial biomass [22] and microbial community composition [27,28]. The microbial population and community structure in the rhizosphere soils of grassland or forest ecosystems were greatly influenced by eCO2. He et al. (2012) found that the richness of bacterial operational taxonomic units (OTUs) and the signal intensity of all taxonomic levels of the most abundant phyla (i.e., Proteobacteria, Firmicutes, Actinobacteria, Bacteroidetes and Acidobacteria) significantly decreased under eCO2 in a 10-year study of a grassland [28]. The abundance of heterotrophic microorganisms represented by Actinomycetes and Bacteroidetes increased and that of archaea decreased by 50% under eCO2 in a trembling aspen ecosystem [20]. The abundance of fungi increased [29] but the fungal diversity decreased [20] under eCO2. The various bacterial and fungal community structure responses to eCO2 are determined mainly by the physiological differences between bacteria and fungi. Fungi have a higher C/N ratio and a specific phenol oxidase that is beneficial for the decomposition of recalcitrant carbon under N-limited conditions, such as in the later stages of eCO2 fumigation and these factors eventually contribute to increasing fungal biomass [25,30]. In addition, the well-developed hyphae and widespread mycorrhizal fungi symbionts play important roles in organic matter degradation and nutrient cycling, ensuring sufficient nutrients for fungal growth [31]. Under short-term eCO2 fumigation, no significant changes were observed in the microbial community structure [22,32].
Elevated CO2 stimulates the C flow from plant roots to soils and promotes microbial activity. Greater utilization of additional C resources and root secretions [25,26], significantly higher abundance of genes associated with C and N cycling [4] and increased enzyme activity [33,34] indicate rapid nutrient cycling and the stimulation of microbial activity under eCO2. Greenhouse areas comprise an increasing proportion of the total plantation areas worldwide, reaching 14.6% of the total plantation area in China (National Bureau of Statistics of China, 2005). Greenhouses have many advantages over traditional field practices, such as higher yields, better quality and the ability to produce out-of-season products. A study demonstrated that the ideal concentration of CO2 for the production of vegetables in greenhouses is 800–1000 µmol mol−1 [35]. It has been shown that eCO2 can significantly improve crop photosynthesis, including that in tomatoes [36,37]. However, the responses of the microbial community structure and function to eCO2 in greenhouse plant-soil systems are largely unknown.
Based the findings of previous studies, we would like to obtain a comprehensive understanding of the changes in microbial community structure and function in the rhizosphere soils of greenhouse plants under eCO2. A tomato variety with a fast growth rate, well-developed fine roots and rapid material exchange with rhizosphere soils was selected as the object of our study. The phospholipid fatty acid (PLFA) profile was used to reflect the microbial community structure. 16S rRNA and ITS gene sequencing were applied to reveal the bacterial and fungal community composition. High-throughput quantity polymerase chain reactions (HT-qPCR) targeted the abundance of genes related to C, N, P, S and methane cycling. The aims of this study were (1) to investigate the effects of eCO2 on microbial community structure; (2) to evaluate the impact of eCO2 on microbial functions; and (3) to detect the effective environmental factors (soil or plant characteristics) that determine microbial community structure and function under eCO2. We hypothesized the following: (1) The microbial community structure would not be influenced by short-term eCO2 fumigation, as the microbial community is highly complex and interactive and usually resilient to minor environmental disturbances, as shown in previous studies. (2) The abundance of functional genes, especially those for C degradation, would be stimulated by increased primary production and might accelerate the cycling of other nutrients (N, P and S) under eCO2. (3) Plant or soil characteristics may exert some influence on microbial community structure and functioning.

2. Materials and Methods

2.1. Study Site and Soil Sampling

In May 2019, soils were sampled from a plastic tunnel greenhouse in Wuhan city (30°17′43 N, 114°16′34 E). Soils were collected randomly using a five-point sampling method and then mixed thoroughly for further use. The land has been used for greenhouse tomato planting for nine years. Manure and compound fertilizer were used as a basal fertilizer and a hole-applied fertilizer respectively. The soils were mechanically plowed and watered by a drip irrigation system. The soil characteristic parameters were as follows: the field holding capacity measured by ring cutter was 24.6%, the moisture content of fresh soil measured by dry heating was 16.5%, the moisture content of air-dried soil through a 0.84 mm sieve was 2.54% and soil bulk density measured by ring cutter was 0.90 g∙cm−3. The pH of the air-dried sampled soil was 4.2 at a 1:2.5 soil to water ratio. The total C was 8.6 g∙kg−1 dry soil, the total N was 1.47 g∙kg−1 dry soil, the C/N ratio was 5.73 measured by an elemental analyzer (Elementar Vario MACRO cube, Langenselbold, Germany); the total organic carbon (TOC) was 8.07 g∙kg−1 dry soil, the total organic matter was 13.91 g∙kg−1 dry soil by extracting with 0.5 M K2SO4 and analyzed with a Multi N/C 2100S TOC/TNb analyzer (Analytik Jena, Jena, Germany); the N-NH4+ was 23.65 mg kg−1 and the N-NO3 was 158.96 mg∙kg−1 by extracting with 2 M KCl and analyzed with a continuous flow analyzer (SKALAR, Delft, The Netherlands). The soil particle size was analyzed by laser particle size analyzer and the soil texture was loamy according to the International Soil Quality Classification Standard. The tomato (Solanum lycopersicum L.) variety used in this experiment was Jinguan 28 and the seeds were obtained from the Beijing Golden Land Agricultural Technology Research Institute (Haidian, Beijing).

2.2. Experimental Design

A pot experiment was conducted with two treatments: ambient CO2 (400 µmol mol−1, aCO2) and elevated CO2 (800 µmol mol−1, eCO2). In total, 8 pots (2 CO2 concentrations × 1 sampling time × 1 planting type × 4 replicates) were prepared. Soils sampled from the field were immediately transported to the laboratory and passed through a 5 mm sieve after removing plant roots and stones. Then, the soils were brought to 70% field capacity and amounts of 347 g fresh soil (equal to 300 g air-dried soil) were placed into pots (9 × 6 × 9.5 cm). Tomato seeds were soaked in 37 °C tap water for ten hours and then wrapped with wet gauze for germination at 25 °C for two days until small white buds sprouted. Five tomato seedlings were sown into each pot and 0.2 g NPK compound fertilizer was added to the soil. All pots were kept at room temperature until the seeds pushed through the soil and then all pots were placed in a growth chamber for further growth. The conditions of the growth chamber were set as follows: 22–26 °C for 12 h with artificial lighting and 15–19 °C for 12 h in darkness. All soils were watered every two days with a sprinkler to maintain a normal water status and the CO2 concentration was adjusted to 400 µmol mol−1 with a volumetric flowmeter and control panel. Fourteen days after sowing, the seedlings were thinned and only three seedlings were kept in every pot. Thirty-one days after sowing, when the tomato plants were approximately 15 cm in height with six leaves, all pots were separated into two groups and placed in two growth chambers in which 400 or 800 µmol mol−1 CO2 was provided for 23 days. During the incubation period, the pots were watered every day and randomly rearranged every three days within each growth chamber. After 23 days’ cultivation, the tomato root system fills the entire soil, so all soil is considered as rhizosphere soil. Destructive sampling was performed for each treatment at days 23. The samples were stored at 4 °C and −20 °C for further analyses.

2.3. Analyses of Plant and Soil Characteristics

Plant shoots and roots were harvested and subsequently flushed with deionized water and dried at 105 °C for 50 min and 60 °C for 48 h in a drying oven to a constant weight. After the shoots and roots were weighed, they were thoroughly pulverized in an agate mortar for further elemental analysis. Part of the sampled soils were air-dried and sieved with a 100 mesh sieve. The total C and total N of plants and soils were measured by an elemental analyzer (Elementar Vario MACRO cube, Langenselbold, Germany) according to the operating instructions. The inorganic nitrogen in the soil was extracted with 2 M KCl at a 1:5 fresh soil to KCl ratio and the extraction was analyzed with a continuous flow analyzer (SKALAR, Delft, The Netherlands). The total organic carbon and total organic nitrogen in the soil were extracted with 0.5 M K2SO4 at a 1:5 fresh soil to K2SO4 ratio and analyzed with a Multi N/C 2100S TOC/TNb analyzer (Analytik Jena, Jena, Germany).

2.4. PLFA Extraction and Analyses

PLFA extraction and analyses were undergone according to the modified Bligh and Dyer method [38,39,40]. Duplicate subsamples of 1.0 g freeze-dried soil from each sample were added to two separate 10.0 mL glass centrifuge tubes and dissolved in 7.6 mL liquid (chloroform:methanol:pH 4 0.15 M citric acid buffer = 2:4:1.6) and each treatment was performed in triplicate. Then, the tubes were shaken in reciprocating shakers (150 rpm, 2 h, room temperature). Subsequently, the lysed substrates were centrifuged (1500 rpm, 10 min) and the supernatants from the same sample soil were harvested into one 50 mL glass centrifuge tube. The residual soil was extracted with half the volume of the abovementioned dissolved liquids and centrifuged. The supernatants were combined with 4.8 mL citric acid buffer and 6 mL chloroform and stored at 4 °C overnight. The chloroform phase underwent subsequent adsorption and elution on a silicic acid column [41] to sequentially remove neutral lipids and glycolipids and the targeted phospholipids were methylated into methyl esters by adding methanol [42,43]. Fatty acid methyl esters (FAMEs) were combined with methyl nonadecanoate fatty acid (19:0), which functioned as an internal standard for the quantity analysis, before being measured by a gas chromatograph equipped with a flame ionization detector (MIDI Inc., Newark, DE, USA).

2.5. Soil DNA Extraction

Total DNA was extracted from 0.3 g of sample soil stored at −20 °C using the FastDNA®Spin Kit for Soil (MP Biomedicals, Irvine, CA, USA), according to the operating manual. DNA purity and density were tested with a NanoDrop ND-2000 spectrophotometer (NanoDrop Technologies, Wilmington, DE, USA). An A260/A280 ratio between 1.75 and 2.00 was considered good purity; otherwise, the DNA extract was re-extracted until reaching the standard. The extracts were stored at −20 °C until subsequent analysis.

2.6. Gene Sequencing and Analyses

DNA extracted from the aCO2 and eCO2 treatments was sent to Shanghai Majorbio Pharmaceutical Technology Company for 16S rRNA and ITS sequencing on an Illumina MiSeq platform. The primers used for bacterial sequencing were 515F 5′-GTGCCAGCMGCCGCGGTAA-3′ and 907R 5′-CCGTCAATTCMTTTRAGTTT-3′, which cover the variable V4–V5 region of the 16S rRNA gene. ITS1F 5′-CTTGGTCATTTAGAGGAAGTAA-3′ and ITS2 5′-GCTGCGTTCTTCATCGATGC-3′, covering the variable ITS1 region, were used as the primers for fungal sequencing. The detailed analysis process of raw reads was according to Zheng et al. (2019) [44].

2.7. HT–qPCR

The relative abundance of C, N, P, S and methane cycling-related genes was determined by the WaferGen SmartChip HT-qPCR system (WaferGen Inc., Fremont, CA, USA). Eighteen samples (6 samples × three repetitions) were tested and 72 genes were applied. Detailed gene information is provided in the Supplementary information (Table S1) [45]. The reaction system composition and processes were carried out according to the manufacturer’s instructions and a previously published study [46]. The results with a threshold cycle (CT) < 31 and genes amplified in two of three replicates were useful and kept for further analysis. The relative copy number of a gene was defined as the value of Equation (1) and the absolute abundance of a gene was described as Equation (2) [45,47,48].
Gene relative copy number GR = ( 31 C T ) / ( 10 / 3 )
Gene absolute copy number GA FUN = GA 16 S · GR FUN / GR 16 S .
GAFUN indicates the absolute copy number of a functional gene; GA16S indicates the absolute copy number of the 16S rRNA gene; GRFUN indicates the relative copy number of the functional gene; and GR16S indicates the relative copy number of the 16S rRNA gene.
Conventional qPCR for the 16S rRNA of the soils from the aCO2 and eCO2 treatments was performed to calculate the absolute gene abundances of the 72 genes. The 20 μL reaction system was composed of 10 μL 2 × GoTaq qPCR master mix (Promega, Madison, WI, USA), front/reverse primer 0.4 μL (5 μM) (515F/907R), 2 μL (40 ng) DNA template and 7.2 μL nuclease-free water. Every sample was replicated three times and three negative reactions were performed by replacing the DNA template with deionized water. The reaction conditions were as follows [49]: 5 min at 95 °C and 45 cycles under specific conditions [(10 s, 95 °C), (45 s, 53 °C), (45 s, 72 °C), (15 s, 84 °C)]. The standard curve was formed by measuring the reaction intensity of eight 16S rRNAs with known concentrations at an initial concentration of 8.32 × 10⁸ and successive 10-fold dilutions.

2.8. Data Analysis

The means and standard deviations were calculated with Microsoft Excel 2010. The significance of the effects of the treatments was assessed by two-tailed permutation T tests or Wilcox tests in R 3.6.3 [50] with the reshape2 package. Adonis analysis was used to test the significance of the effects of the CO2 concentration on microbial community structure (PLFA and OTUs) and function (gene abundance) with 999 permutations in R 3.6.3. LEfSe analyses were conducted online to identify significant bacterial and fungal biomarkers (p < 0.05) (http://huttenhower.sph.harvard.edu/galaxy/). Bray-Curtis distance-based redundancy analyses (dbRDA) were performed between the microbial community structure (OTUs/PLFA/function genes) and the soil or plant characteristics in R 3.6.3 with the vegan package based on type-I scaling. The stacked-bar and column charts were plotted by using Origin 2018.

3. Results

3.1. Soil Chemical Properties and Plant Biomass

In this experiment, root C and shoot C showed significant increases under eCO2 compared with those under aCO2 (p < 0.05), whereas root N and shoot N decreased non-significantly (Table 1). Specifically, root C increased from 34.93% to 38.26% under eCO2 and shoot C increased from 36.77% to 39.89%. Plant biomass (total, shoot and root) increased non-significantly under eCO2 (p > 0.05). In addition, no significant changes were observed in soil C, soil N, NO3, NH4+, TOC or total organic nitrogen (TON) at the two CO2 levels (p > 0.05) (Table 1).

3.2. Changes in PLFAs under eCO2

PLFAs have been used as biomarkers for various groups of microorganisms [51]. Biomarkers included under general, gram negative (G), gram positive (G+), fungi and actinomycetes were classified based on manuscript provide by MIDI Company and references [43,52]. Three parallel measurements are made for each soil sample. The absolute abundance of each PLFA was calculated based on the concentration of methyl nonadecanoate fatty acid (19:0) added in the final sample. The relative abundance of each PLFA was the proportion of individual PLFA in total PLFAs. In summary, 32 PLFAs, which was more than 0.1 nmol∙g−1 PLFAs and appeared in all the three parallels, were used for further analysis in this study. The identity of these 32 PLFAs is indicated in supplementary information Figure S1. The ratio of fungal to bacterial PLFA was calculated based on following biomarkers. Fungal PLFAs include 18:2ω6c, 18:1ω9c and 16:1ω5c. Bacterial PLFAs is the sum of gram negative, gram positive and actinomycetes related PLFAs. Gram negative PLFAs include 16:1ω9c, 16:1ω7c, 17:1ω8c, 18:1ω7c, 19:1ω8c, 19:0 cyclo ω7c, 18:1ω8c and 17:0 cyclo ω7c. Gram positive PLFAs include 15:0iso, 15:0anteiso, 16:0iso, 17:0iso, 17:0anteiso, 14:0anteiso, 16:0anteiso, 18:0iso and 17:1isoω9c. Actinomycetes PLFAs include 16:0 10-methyl, 17:0 10-methyl, 18:0 10-methyl, 17:1ω7c 10-methyl and 18:1 ω7c 10-methyl.
Compared with those in aCO2-treated soils, the total PLFAs, general FAMEs, G, fungi and the ratio of fungal to bacterial PLFAs increased significantly after eCO2 fumigation (p < 0.05) (Figure 1). Among the 32 main PLFAs, the relative abundance of 13 PLFAs changed significantly under eCO2 (p < 0.05) (Figure S1). 16:00 (general FAME), 18:1 ω8c (G) and 18:2 ω6c (fungi) increased significantly and 18:00 (general FAME), 10-Me-16:0 (Actinomycetes), 10-Me-17:0 (Actinomycetes), a17:0 (G+), 17:0 cyclo ω7c (G), 17:1 iso ω9c (G+), 17:1 ω8c (G), 18:1 ω7c (G), 19:0 cyclo ω7c (G) and 19:1 ω8c (G) decreased significantly under eCO2. The results also indicated that 17:1 iso ω9c, 18:1ω7c and 19:0 cycloω7c were the most abundant PLFA biomarkers under the aCO2 treatment, while 16:0, 18:1ω8c and 18:2ω6, 9c were the most abundant PLFA biomarkers under the eCO2 treatment. The Adonis analysis of PLFAs profiling was nonsignificant (p > 0.05). The dbRDA analysis based on PLFAs and plant properties showed that samples from the aCO2 and eCO2 treatments were separated along the dbRDA1 axis and the total variation explained by four plant variables (total dry weight (TDW), soil C (SC), root C (RC) and root N (RN)) was 85.04% (p < 0.05) (Figure 2). In addition, RN alone explained 7.2% of the total variance and the variation explained by each of the four variables was significant (p < 0.05). No soil characteristics were observed to be correlated with PLFA profiles in our study.

3.3. Bacterial Community Compositional Variations Following eCO2

In total, 314,806 bacterial 16S rRNA gene sequences (ranging from 47,301 to 55,240 sequences per sample) were obtained from six sampling soils. Analyses of bacterial alpha and beta diversity were carried out at a sequencing depth of 25,000. The alpha diversity indices of the soils from the aCO2 and eCO2 treatments showed no significant variations, including observed OTUs, Chao 1 and Shannon. Adonis analysis of bacterial OTU richness suggested nonsignificant (p > 0.05) variations between aCO2 and eCO2. The dbRDA analysis showed no significant variation in the bacterial community composition between soils with aCO2 and eCO2 fumigation. Only the permutation test value of the dbRDA1 axis was significant (p = 0.0389) and the four plant variables (TDW, RN, RC and SC) explained 11.62% of the variation in the bacterial community (the total permutation test value of the model was 0.0486) (Figure 3a).
Of the 22 phyla discovered, Proteobacteria (~36%), Actinobacteria (~22%), Acidobacteria (~9.7%), Chloroflexi (~9.5%), Bacteroidetes (~7.5%), Firmicutes (~4.9%), Planctomycetes (~3%), Gemmatimonadetes (~1.6%) and Cyanobacteria (~1.2%) were dominant. Linear discriminant analysis Effect Size (LEfSe) analysis was performed to identify the bacterial abundance biomarkers in the aCO2 and eCO2 soil samples (Figure 3b). Significant changes in the relative abundance were detected at the class, order, family and genus levels (p < 0.05). For example, the relative abundance of DA052 (a class of Acidobacteria) decreased from 0.284% to 0.183% under eCO2. The abundance of Stramenopiles, an order of Cyanobacteria, increased from 0.108% to 0.228% under eCO2. At the family level, Thermogemmatisporaceae was less abundant in eCO2 soil (0.093%) than in aCO2 soil (0.181%); however, Burkholderiaceae was twice as abundant in eCO2 soil (1.42%) than in aCO2 soil (0.75%). In addition, the relative abundance of Devosia (a genus of Proteobacteria) also decreased significantly under eCO2.

3.4. Variations in Fungal Community Composition under eCO2

A total of 395,029 fungal ITS gene sequences (ranging from 60,164 to 71,254 sequences per sample) were obtained across the six soil samples. The alpha diversity analysis was carried out at a sequencing depth of 34,000. The observed fungal OTU richness decreased from 1134 ± 224 to 451 ± 110 and the Shannon diversity index decreased from 4.35 ± 0.39 to 2.97 ± 0.3 significantly (p < 0.05) under eCO2 and the Chao1 index decreased insignificantly. Adonis analysis the of fungal OTU richness suggested insignificant (p > 0.05) changes between aCO2 and eCO2. The dbRDA results showed that the fungal community composition of soils under aCO2 and eCO2 fumigation diverged significantly (Figure 3c). Only the permutation test value of the dbRDA1 axis was significant (p = 0.0167) and the four plant variables (TDW, RN, RC and SC) explained 53.82% of the variation in the fungal community (the total permutation test value of the model was 0.0153). The variation explained by each of the four variables was significant (p < 0.05) and RC alone explained 17.5% of the total variance.
Of the 9 fungal phyla discovered, Ascomycota was dominant, accounting for ~93% of the fungal community on average across the aCO2 and eCO2 soil treatments, followed by Mortierellomycota (~3.7%). LEfSe analysis was performed to identify the biomarkers of fungal abundance in the aCO2 and eCO2 soil samples (Figure 3d). Significant differences from those under aCO2 were observed in the relative abundance of dominant phyla and their lower classification levels, including class, order, family and genus, under eCO2 (p < 0.05). Specifically, at the phylum level, Basidiomycota was less abundant in eCO2 soils (0.3%) than in aCO2 soils (1.7%). However, the relative abundance of Ascomycota increased significantly, from 91.8% to 96.7%, under eCO2, as did that of its lower classification levels, such as Sordariomycetes (a class of Ascomycota) and Sordariales (an order of Sordariomycetes). In addition, eCO2 reduced the relative abundance of Eurotiales (an order of Eurotiomycetes) significantly, from 12.1% to 2.6%.

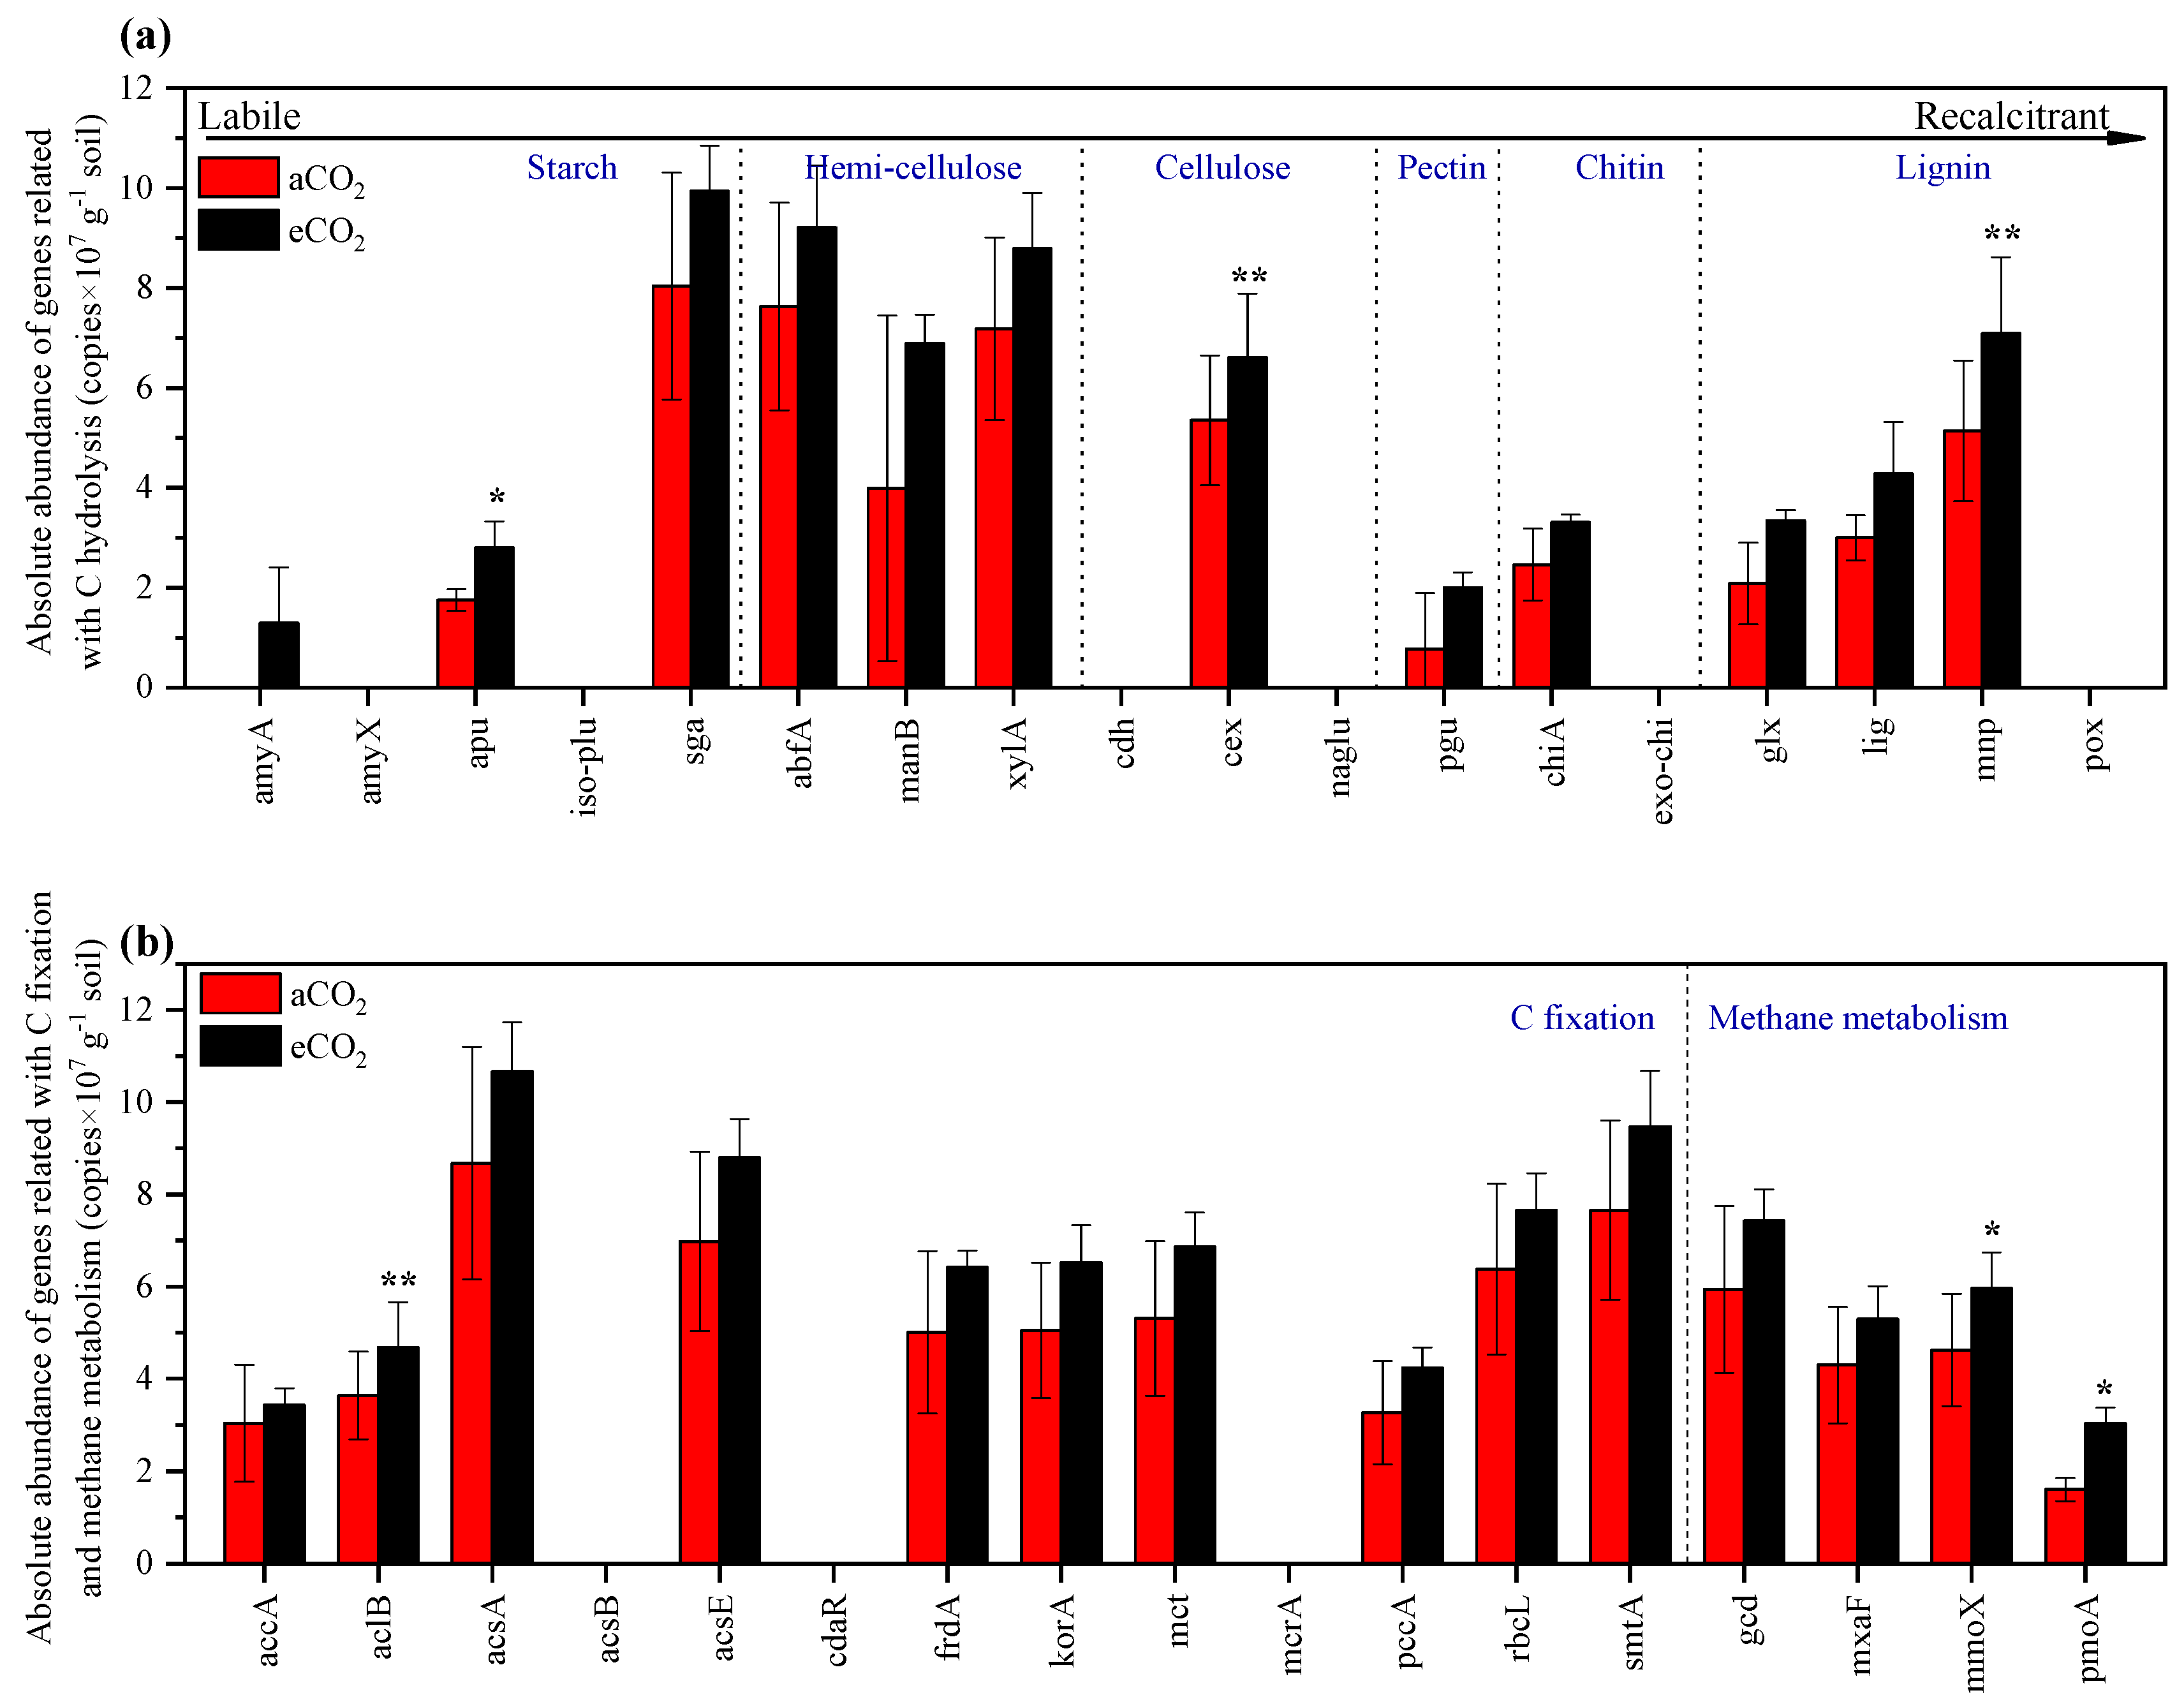
3.5. Microbial Community Functional Gene Changes Under eCO2

To obtain more information about how eCO2 affects microbial functional processes, microarrays including 64 microbial functional genes related to C, N, P, S and methane cycling were employed (Table S2). Significant (p < 0.05) increases in abundance were observed in biogeochemically important functional genes under eCO2, although no significant variations (p > 0.05) were detected in the overall microbial functions measured by Adonis analysis. Specifically, the absolute abundance of the ATP-citrate lyase β subunit (aclB) in the reductive tricarboxylic acid cycle (r-TCA) was significantly (p < 0.01) stimulated by eCO2 (Figure 4b); apu, cex and mnp, which are involved in the degradation of starch, cellulose and lignin, ranging from labile C to recalcitrant C, respectively, were all significantly (p < 0.05) increased under eCO2 (Figure 4a). In addition, the abundances of mmoX and pmoA, which are involved in methane oxidation, were also significantly (p < 0.05) stimulated under eCO2 (Figure 4b).
In general, eCO2 stimulated the abundance of genes involved in N cycling to different degrees (Figure 5a). Under eCO2, the abundances of nifH (involved in N fixation), nosZ2 (involved in nitrous oxide reduction to nitrogen) and hzsB (involved in anaerobic ammonium oxidation) all increased significantly (p < 0.05), which indicated enhanced N cycling between the atmosphere and soil (Figure 5b). Among the 9 genes involved in P cycling, phoD for P mineralization, ppx for P hydrolysis, pqqC and pqq-mdh for P solubilization all increased significantly (p < 0.05) under eCO2 (Figure 6a). In addition, dsrA (involved in S reduction) and YedZ (involved in S oxidation) were both stimulated significantly (p < 0.05) under eCO2 (Figure 6b).
The dbRDA analysis based on functional genes and four plant variables is shown in Figure 7. Only the permutation test value of the dbRDA1 axis was significant (p = 0.0361) and the four plant variables (TDW, RN, RC and SC) explained 87.96% of the variation in the functional genes (the total permutation test value of the model was 0.0361). The variation explained by each of the four variables was insignificant (p > 0.1). No soil characteristics were observed to be correlated with functional genes in our study.

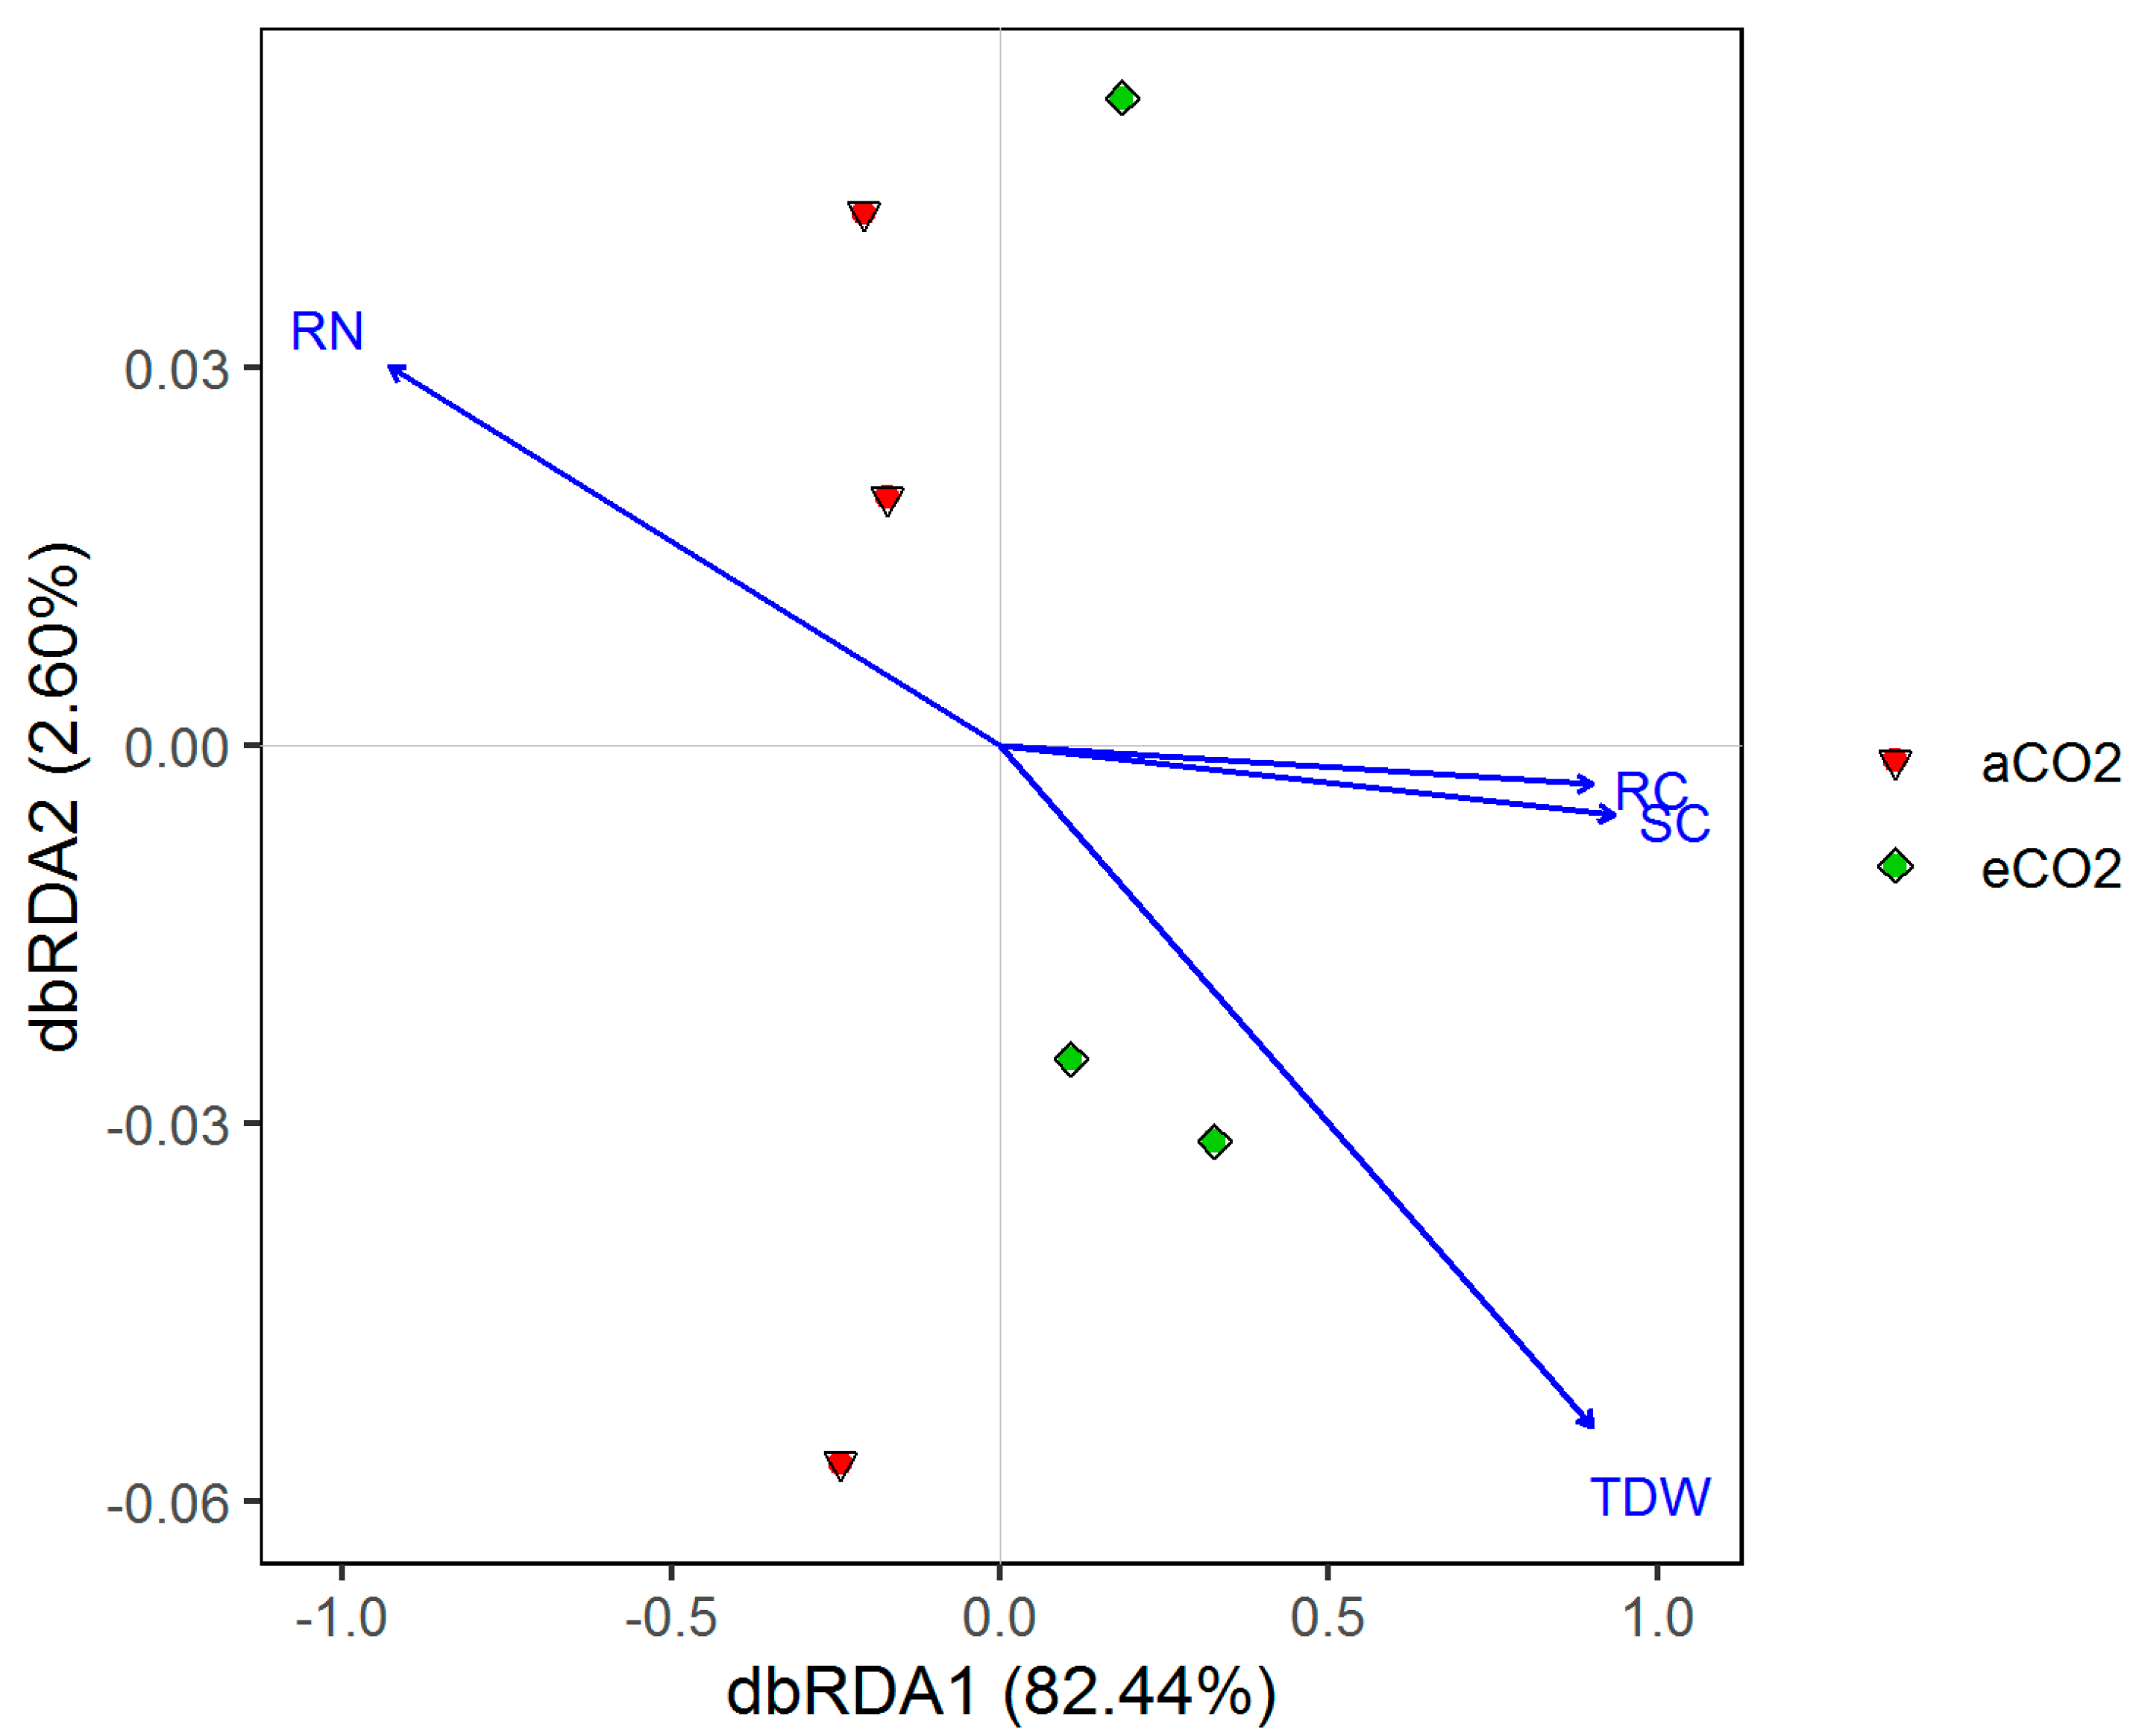
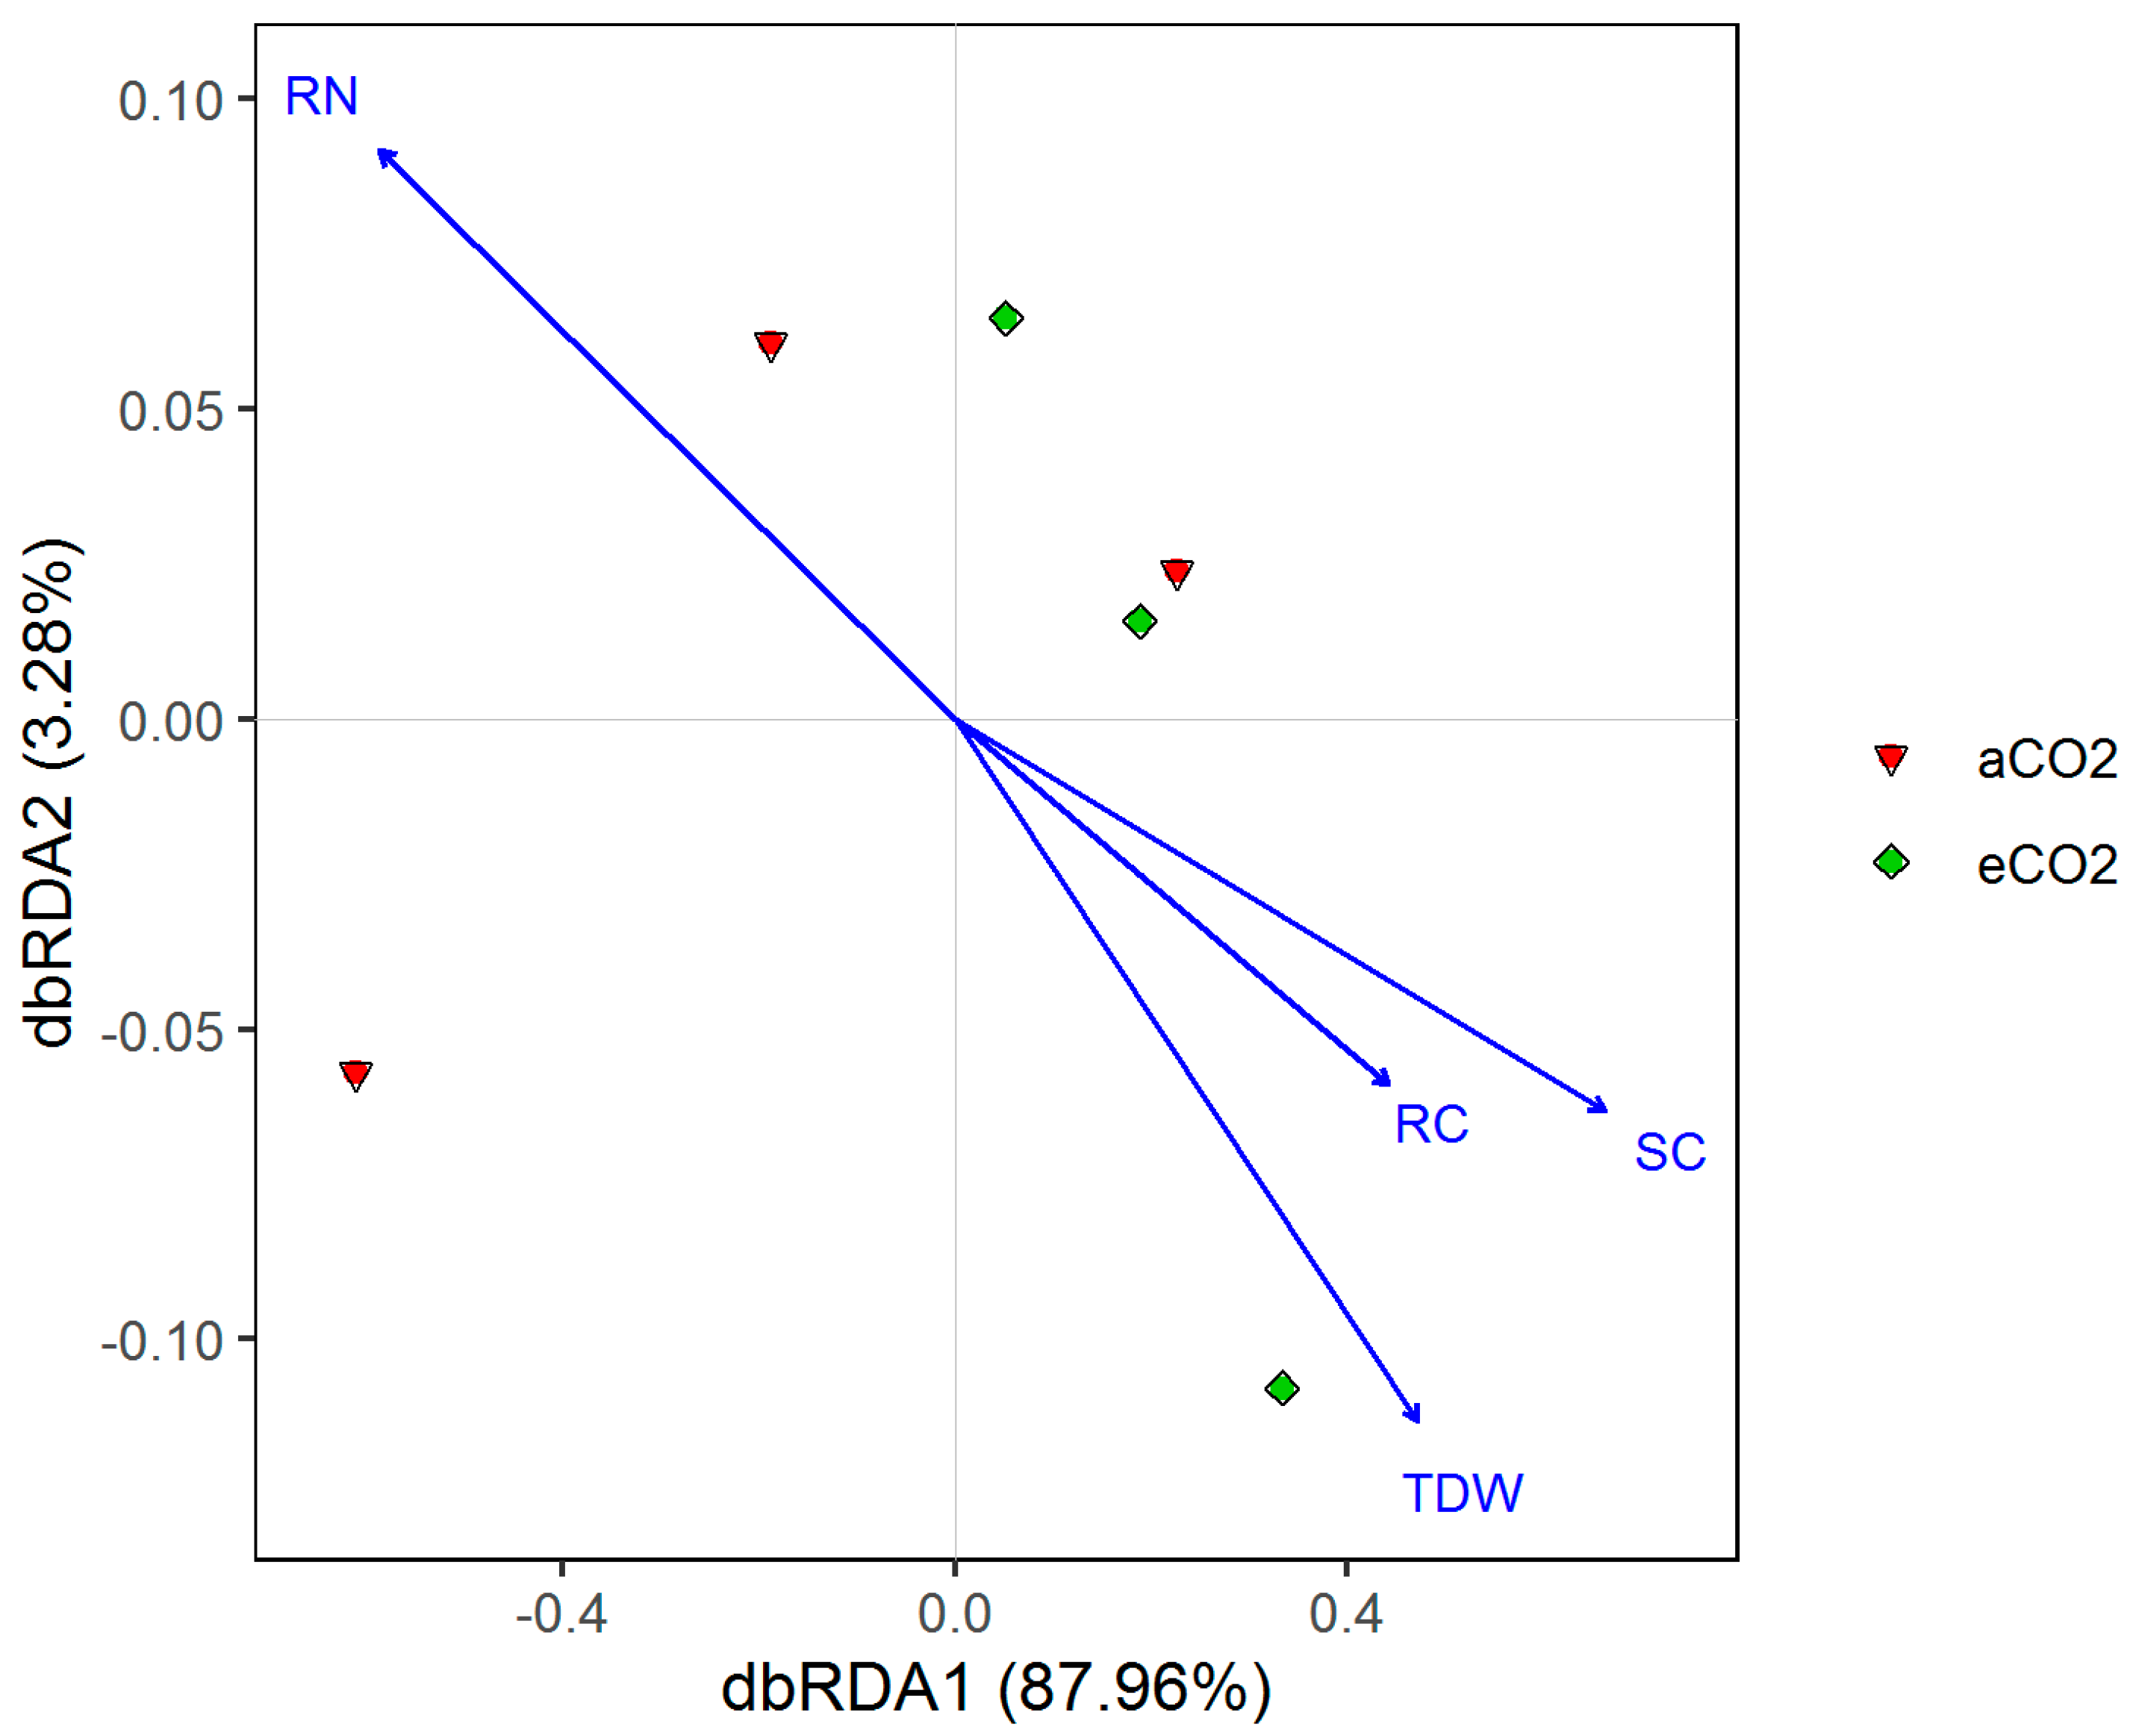
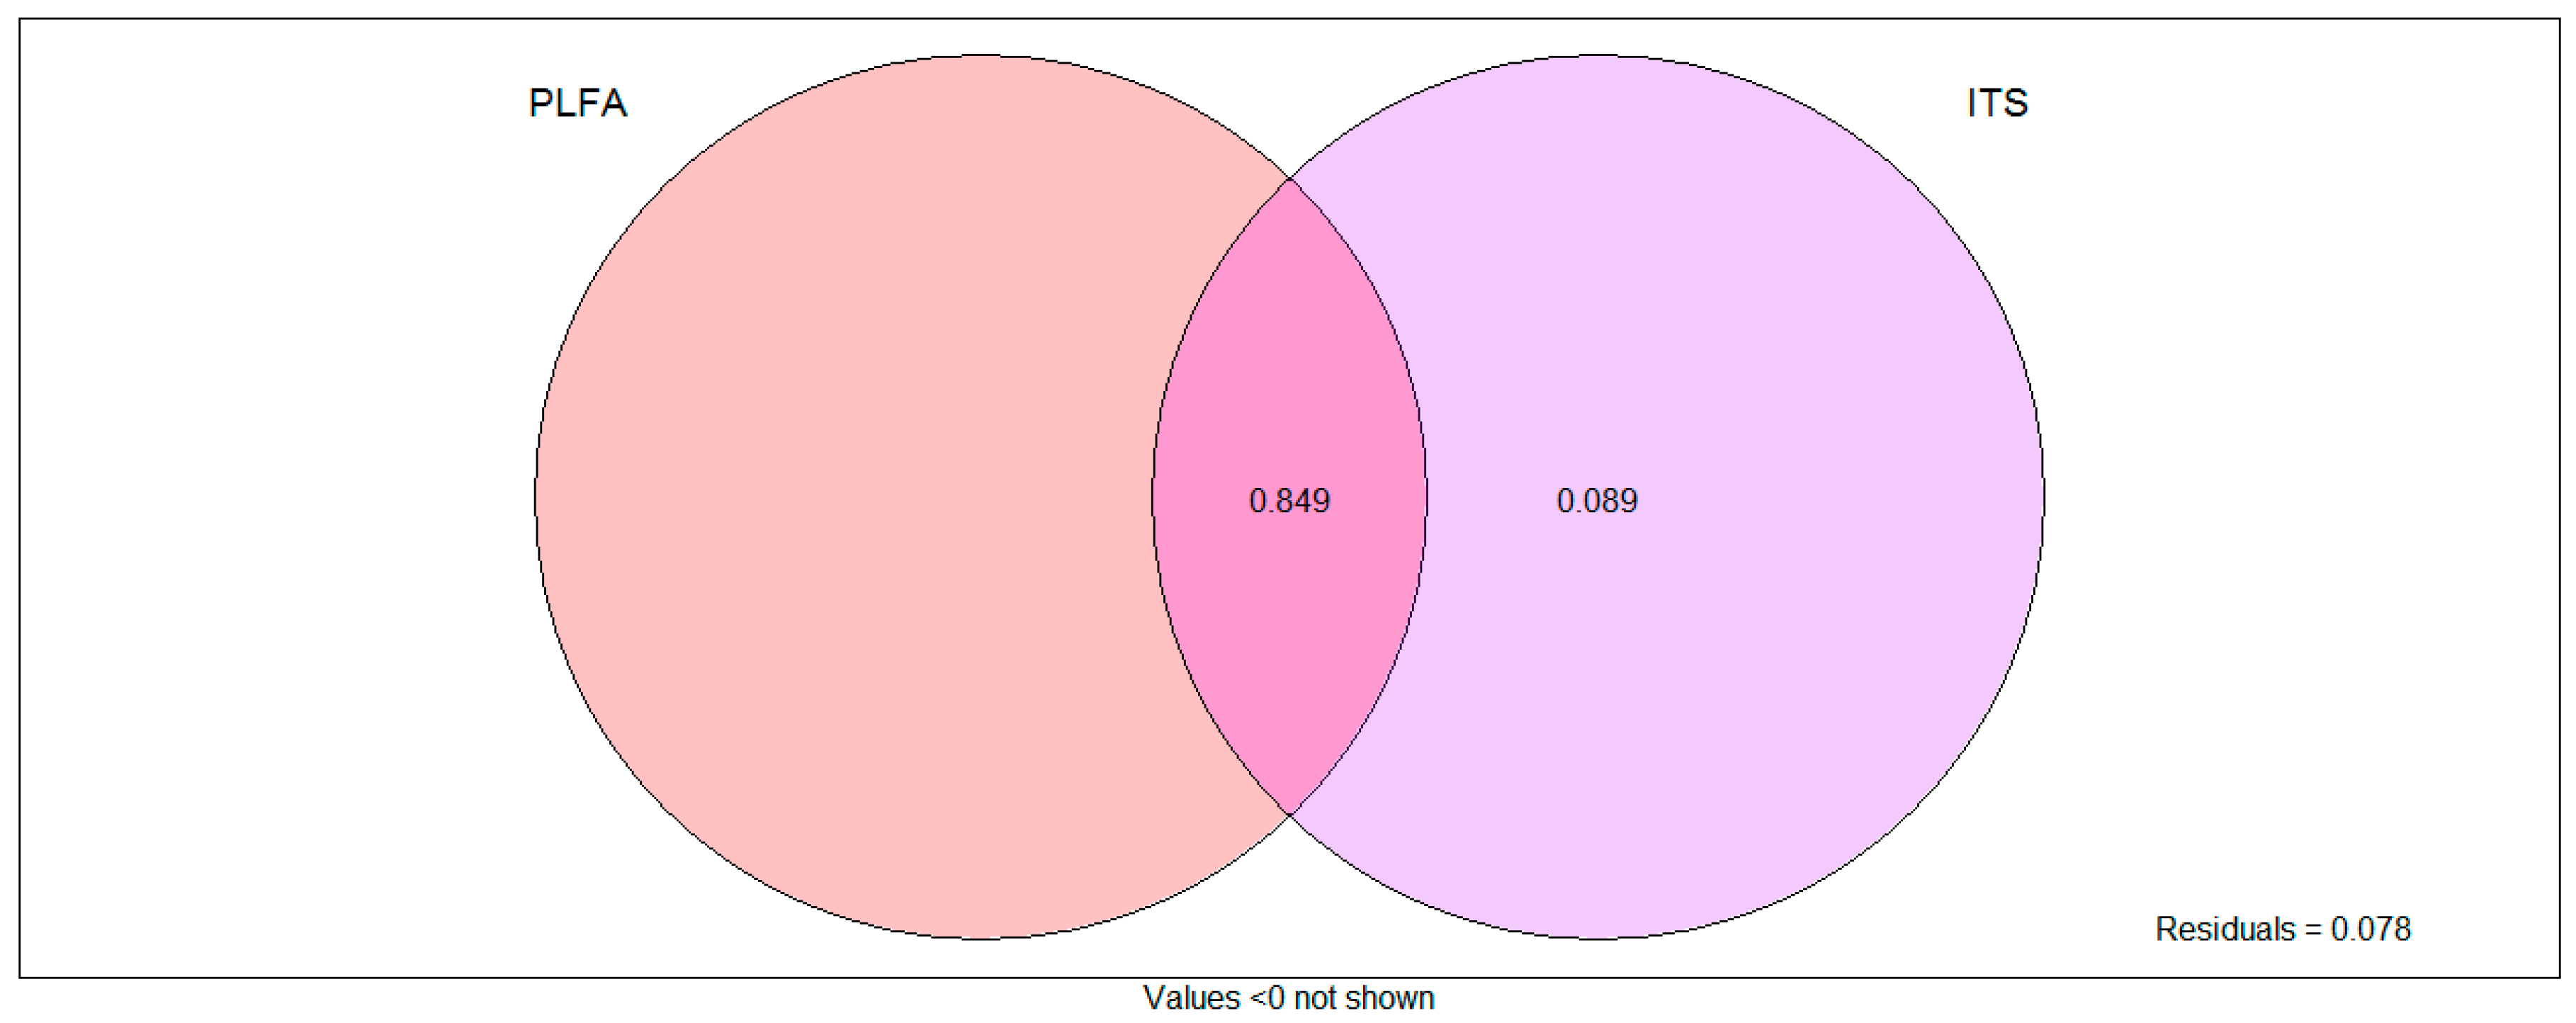
3.6. Effects of Microbial Community Structure on Plant Total Dry Weight (TDW) under eCO2

To obtain more knowledge on the effects of microbial community structure on plant total dry biomass under eCO2, dbRDA analysis was carried out (Figure 8). TDW diverged significantly between soils under aCO2 and eCO2 fumigation. Only the permutation test value of the dbRDA1 axis was significant (p = 0.0069) and PLFA and ITS explained 92.00% of the variations in the TDW (the total permutation test value of the model was 0.0069). The variation explained by both variables was significant (p < 0.05) and ITS alone explained 8.9% of the total variance.

4. Discussion

Different effects of elevated CO2 on plant growth and rhizosphere soil microbiome have been shown in previous studies. He et al. (2012) found that both aboveground and underground grass biomass were significantly stimulated, while the richness of bacterial operational taxonomic units (OTUs) and the signal intensity of all taxonomic levels of the most abundant phyla (i.e., Proteobacteria, Firmicutes, Actinobacteria, Bacteroidetes and Acidobacteria) significantly decreased under eCO2 in a 10-year study of a grassland [28]. In our results, the responses of tomato and its rhizosphere microbiota to eCO2 revealed many outcomes, including increased tomato biomass, stimulated fungal PLFA biomass and higher abundance of microbial functional genes, which partially support our hypotheses and agree with previous findings.

4.1. Changes in Plant and Soil Characteristics under eCO2

In our study, the significantly increased root C% and shoot C% suggested increased primary production under eCO2, which was similar to a previous study [28]. Most of the plant primary productivity was assumed to be used for plant growth, especially at the early stages of the experiment [53,54,55,56], which was corroborated by the unchanged soil C in our study. However, the plant dry weight after 23 days of cultivation under eCO2 increased non-significantly compared with that under aCO2, which was inconsistent with previous studies [57,58,59]. We speculated that this discrepancy among studies may have been caused by the relatively short-term CO2 fumigation in our study compared to that in studies over the whole growth cycle or to the depletion of N, which was verified by the loss of shoot and root N in our study.
The soil C and soil N contents were not affected by short-term CO2 fumigation in our study. This was not in agreement with studies revealing a higher soil C/N ratio caused by increased C-rich flows from fine roots into soil [60,61,62]. Soil C and N are dynamic and are determined by the balance between C and N inputs (secretions and plant litter) and outputs (decomposition by microorganisms). On the one hand, root secretions largely depend on the plant species as well as the concentration and duration of eCO2 fumigation, among other factors. On the other hand, the decomposition rate of microorganisms is affected by microbial succession and the antecedent availability of nutrients [60]. Usually, the effects of eCO2 on C flux are negligible compared to the size of C and N belowground and difficult to detect by modern measurement unless longer eCO2 fumigation [63], especially when the duration of eCO2 fumigation was relatively short, as in our study.

4.2. Changes in Bacterial Community Structure under eCO2

After 23 days of eCO2 fumigation, the bacterial biomass was stimulated by the increased plant biomass and root exudation, which was different from the results of other studies [64,65,66]. The apparent discrepancies in microbial biomass among studies may have been caused by the different root morphologies in specific ecosystems, although all these studies used plants. However, the bacterial community structure was almost unchanged under eCO2, as verified by the Adonis analysis of bacterial OTUs and the LEfSe analysis (p > 0.05). This result is consistent with the result for alpha diversity in a ten-year eCO2 fumigation experiment in a grassland [67] but is different from the results of several studies that suggested significant changes in taxonomic levels under eCO2 [28,68]. These variations were mainly caused by the specific ecosystem [69], plant genotype [17], different analysis methods and other abiotic factors (such as soil properties and nutrient status) [62]. Furthermore, the dbRDA analysis showed that the bacterial community structure had weaker associations with the four plant characteristics, suggesting that short-term eCO2 had a limited influence on the bacterial community structure, although significant changes occurred in some particular taxa, as indicated by the LEfSe analysis.

4.3. Changes in Fungal Community Structure under eCO2

The fungal biomass was significantly increased after 23 days of eCO2 fumigation in this study compared with that under aCO2 and this result was concordant with the findings reported in other studies [23,29]. This result may have been due to the higher C to N ratio and the phenol oxidase in fungi, which can efficiently decompose recalcitrant C to obtain the nutrients (such as N) necessary for rapid fungal growth under eCO2 [70]. Different results have also been reported by researchers and these discrepancies may have been caused by specific plant morphological characteristics and the different eCO2 fumigation treatments [71].
The fungal community structure was significantly affected by eCO2. Specifically, the alpha diversity indices decreased significantly and species at the different taxonomic levels also experienced significant changes revealed by LEfSe analysis. The relative abundance of Ascomycota increased significantly, from 91.8% to 96.7%, under eCO2. A probable explanation for the high prevalence of fungi in our pots is that soil pH value of 4.2 in this study was most favorable for growth and survival of the fungus. Other study has been shown that pH has a decisive influence on fungal biomass [4,72]. Previous studies on the effects of eCO2 on fungal community structure have documented a variety of responses, from no effect [66,73] to significant separations among communities [31,74,75]. CO2 has been reported to be one of the greatest determinants of the diversity of fungi [75] and differences in plant species, eCO2 treatment duration and other abiotic factors, such as soil nutrients, might also have some influence on fungal community structure.
In general, the responses of the microbial community to eCO2 were largely dependent on nutrient competition between plants and microbes, especially competition for N. Soil N was more likely to be limited because of the rapid growth of plants and microbes later in eCO2 fumigation [76]. During this later period, the plants used most of the soil N for growth and the soil microbial community tended to shift towards slow-growing taxa (such as fungi) that can obtain N by utilizing recalcitrant C; this is an example of the “priming effect” theory [77,78]. In addition, ectomycorrhizal (EcM) fungi interact with almost 80% of terrestrial plants and supply their host plants with important mineral nutrients (N, P); in return, they receive carbon for their own growth [21,79]. Moreover, eCO2 increased plant photosynthate allocation to arbuscular mycorrhizal fungi (AMF) and promoted the growth of AMF, which further enhanced plant access to soil minerals due to the powerful external hyphae of the AMF [20,80]. Under these conditions, AMF may have outcompeted other fungi and led to reduced fungal diversity in our study. The dbRDA analysis also showed that the fungal community was significantly influenced by the RC stimulation under eCO2 (p < 0.1).
In fact, bacteria and fungi have significantly different physiological characteristics, which may be responsible for the varied bacterial and fungal community structures. First, fungi tend to outcompete bacteria because they have a higher C/N ratio and are more resistant to N limitation. Second, fungal hyphae can efficiently absorb nutrients for growth. Third, fungi can decompose recalcitrant C such as lignin and this decomposition was stimulated by root secretions or plant litter under eCO2. Last, mycorrhizal fungi form symbionts with plant roots, contributing to increased plant and fungal growth. Therefore, the increased C resources and progressive nitrogen limitation under eCO2 in this study would have a much greater influence on fungal community structure than on bacterial community structure.

4.4. Changes in Microbial Functions under eCO2

C and methane cycling were promoted by the increased primary photosynthesis and root secretion under eCO2. Specifically, the absolute abundances of apu, cex and mnp, which are associated with labile and recalcitrant C decomposition, were all stimulated significantly. This was similar to a study that found increased amyA and pullulanase under eCO2 [27] but different from another study revealing decreased amyA abundance [67]. These inconsistent results may have been be caused by different levels of soil N availability because the genes related to carbon hydrolysis and N2 fixation always had the same variation trend, increasing or decreasing simultaneously [27,67]. This trend was also observed in our study; that is, the abundance of carbon hydrolysis- and N2 fixation-related genes increased significantly and simultaneously.
N cycling was also stimulated by eCO2, especially in terms of the increased absolute abundance of nifH. Our result was consistent with the findings of studies conducted in other soil ecosystems, such as rice ecosystems [81] but differed from the findings of one study, which reported no effect of eCO2 on N fixation [82]. The higher absolute abundance of nifH under eCO2 fumigation indicated high demand for N and high metabolic activity. In addition, the decreases in shoot and root N also reflected the strong competition between microbes and plants for N. The increased abundance of nosZ2 and hzsB may have alleviated N2O emissions to some extent. This is particularly true for hzsB, which can reduce nitrite into nitrogen gas in one step and could be developed for use in greenhouse gas elimination, although the effects of hzsB are far from being completely understood. The absolute abundance of P and S cycling related genes were promoted under eCO2, which was consistent with previous studies conducted in grassland and agricultural systems [67,83]. The accelerated decomposition of soil organic matter (priming effect) or the increased microbial biomass may have led to activated P and S cycling in this study [84].
Overall, the significantly increased absolute abundance of genes involved in C, N, P, S and methane cycling suggested rapid nutrient cycling and activated microorganisms under eCO2. The dbRDA results indicated that shoot C contributed most (~90.7%) to changes in microbial function, further suggesting the importance of accumulated C flows in shaping soil microbial function under eCO2 in tomato cultivation.

4.5. Associations Between Microbial Community Structure and Function under eCO2

Four plant properties, TDW, RC, SC and RN, significantly affected the microbial PLFA profile (p < 0.1), 16S rRNA OTUs (p < 0.05), ITS OTUs (p < 0.05) and functional genes (p < 0.05) under eCO2. The PLFA profile and ITS OTUs also significantly changed the TDW (p < 0.05) under eCO2. These results suggest that the fungal community structure was more influenced by eCO2 in the rhizosphere soils of greenhouse tomatoes than the bacterial community structure and was closely correlated with plant biomass due to specific fungal nutrient absorption and organic compound decomposition functions.

5. Conclusions

This study focused on the microbial community composition and function changes in rhizosphere soils of greenhouse tomatoes after 23 d of eCO2 fumigation. We demonstrate that fungal but not bacterial community structure is sensitive to short-term eCO2 fumigation and overall microbial functional genes related with C, N, P, S are stimulated. These effects associated with increasing plant biomass and C content of shoot and root, demonstrating elevated CO2 concentration partially affected microbial community structure and functionality in the rhizosphere soils of greenhouse tomatoes possibly due to plant soil interaction. Studies of root secretions and EcM fungal infection should be taken into account in future work.

Supplementary Materials

The following are available online at https://www.mdpi.com/2073-4395/10/11/1752/s1. Table S1: The tested 72 target genes in this study. Table S2: Absolute abundance of 72 genes under aCO2 and eCO2. Figure S1: Relative abundance of 32 main PLFAs under aCO2 and eCO2.

Author Contributions

Conceptualization, H.Y.; Data curation, H.W.; Funding acquisition, H.Y.; Investigation, H.W.; Methodology, H.Y.; Writing—original draft, H.W.; Writing—review and editing, H.F. All authors have read and agreed to the published version of the manuscript.

Funding

This work is financially supported by the National Natural Science Foundation of China (41525002; 41761134085).

Conflicts of Interest

The authors declare no conflict of interest.

References

  1. IPCC. IPCC, 2013: Climate Change 2013: The Physical Science Basis. Contribution of Working Group I to the Fifth Assessment Report of the Intergovernmental Panel on Climate Change; Cambridge University Press: Cambridge, UK; New York, NY, USA, 2014; 1535p. [Google Scholar]
  2. Zhao, L.; Liu, C.; Yue, X.; Liang, M.; Wu, Y.; Yang, T.; Zhang, J. Application of CO2-storage materials as a novel plant growth regulator to promote the growth of four vegetables. J. CO2 Util. 2018, 26, 537–543. [Google Scholar] [CrossRef]
  3. Karim, M.; Hao, P.; Nordin, N.; Qiu, C.; Zeeshan, M.; Khan, A.; Shamsi, I. Effects of CO2 enrichment by fermentation of CRAM on growth, yield and physiological traits of cherry tomato. Saudi J. Biol. Sci. 2020, 27, 1041–1048. [Google Scholar] [CrossRef] [PubMed]
  4. Diao, T.; Peng, Z.; Niu, X.; Yang, R.; Ma, F.; Guo, L. Changes of Soil Microbes Related with Carbon and Nitrogen Cycling after Long-Term CO2 Enrichment in a Typical Chinese Maize Field. Sustainability 2020, 12, 1250. [Google Scholar] [CrossRef] [Green Version]
  5. Procter, A.C.; Gill, R.A.; Fay, P.A.; Polley, H.W.; Jackson, R.B. Soil carbon responses to past and future CO2 in three Texas prairie soils. Soil Biol. Biochem. 2015, 83, 66–75. [Google Scholar] [CrossRef] [Green Version]
  6. Van der Kooi, C.J.; Reich, M.; Löw, M.; De Kok, L.J.; Tausz, M. Growth and yield stimulation under elevated CO2 and drought: A meta-analysis on crops. Environ. Exp. Bot. 2016, 122, 150–157. [Google Scholar] [CrossRef]
  7. Calvo, O.C.; Franzaring, J.; Schmid, I.; Fangmeier, A. Root exudation of carbohydrates and cations from barley in response to drought and elevated CO2. Plant Soil 2019, 438, 127–142. [Google Scholar] [CrossRef]
  8. Bertin, C.; Yang, X.; Weston, L.A. The role of root exudates and allelochemicals in the rhizosphere. Plant Soil 2003, 256, 67–83. [Google Scholar] [CrossRef]
  9. Badri, D.V.; Vivanco, J.M. Regulation and function of root exudates. Plant Cell Environ. 2009, 32, 666–681. [Google Scholar] [CrossRef] [PubMed]
  10. Li, X.; Dong, J.; Chu, W.; Chen, Y.; Duan, Z. The relationship between root exudation properties and root morphological traits of cucumber grown under different nitrogen supplies and atmospheric CO2 concentrations. Plant Soil 2018, 425, 415–432. [Google Scholar] [CrossRef]
  11. Kimball, B.A.; Kobayashi, K.; Bindi, M. Responses of agricultural crops to free-air CO2 enrichment. Adv. Agron. 2002, 77, 293–368. [Google Scholar]
  12. Qicong, W.; Congzhi, Z.; Zhenghong, Y.; Jiabao, Z.; Chunwu, Z.; Zhanhui, Z.; Jiananran, X.; Jinlin, C. Effects of elevated CO2 and nitrogen addition on organic carbon and aggregates in soil planted with different rice cultivars. Plant Soil 2018, 432, 245–258. [Google Scholar]
  13. Blagodatskaya, E.; Blagodatsky, S.; Dorodnikov, M.; Kuzyakov, Y. Elevated atmospheric CO2 increases microbial growth rates in soil: Results of three CO2 enrichment experiments. Glob. Change Biol. 2010, 16, 836–848. [Google Scholar] [CrossRef] [Green Version]
  14. Dhillion, S.S.; Roy, J.; Abrams, M. Assessing the impact of elevated CO2 on soil microbial activity in a Mediterranean model ecosystem. Plant Soil 1995, 187, 333–342. [Google Scholar] [CrossRef]
  15. Dorodnikov, M.; Blagodatskaya, E.; Blagodatsky, S.; Marhan, S.; Kuzyakov, Y. Stimulation of microbial extracellular enzyme activities by elevated CO2 depends on soil aggregate size. Glob. Change Biol. 2010, 15, 1603–1614. [Google Scholar] [CrossRef]
  16. Wang, Y.; Yan, D.; Wang, J.; Ding, Y.; Song, X. Effects of Elevated CO2 and Drought on Plant Physiology, Soil Carbon and Soil Enzyme Activity with Glycine max (Soybean). Pedosphere 2017, 27, 846–855. [Google Scholar] [CrossRef]
  17. Yu, Z.; Li, Y.; Wang, G.; Liu, J.; Liu, J.; Liu, X.; Herbert, S.J.; Jin, J. Effectiveness of elevated CO2 mediating bacterial communities in the soybean rhizosphere depends on genotypes. Agric. Ecosyst. Environ. 2016, 231, 229–232. [Google Scholar] [CrossRef]
  18. Qiu, Y.; Jiang, Y.; Guo, L.; Zhang, L.; Hu, S. Shifts in the Composition and Activities of Denitrifiers Dominate CO2 Stimulation of N2O Emissions. Environ. Sci. Technol. 2019, 53, 11204–11213. [Google Scholar] [CrossRef]
  19. Jossi, M.; Fromin, N.; Tarnawski, S.; Kohler, F.; Gillet, F.; Aragno, M.; Hamelin, J. How elevated pCO2 modifies total and metabolically active bacterial communities in the rhizosphere of two perennial grasses grown under field conditions. FEMS Microbiol. Ecol. 2006, 55, 339–350. [Google Scholar] [CrossRef] [PubMed] [Green Version]
  20. Lesaulnier, C.; Papamichail, D.; McCorkle, S.; Ollivier, B.; Skiena, S.; Taghavi, S.; Zak, D.; Van Der Lelie, D. Elevated atmospheric CO2 affects soil microbial diversity associated with trembling aspen. Environ. Microbiol. 2008, 10, 926–941. [Google Scholar] [CrossRef] [Green Version]
  21. Maček, I.; Clark, D.R.; Šibanc, N.; Moser, G.; Vodnik, D.; Müller, C.; Dumbrell, A.J. Impacts of long-term elevated atmospheric CO2 concentrations on communities of arbuscular mycorrhizal fungi. Mol. Ecol. 2019, 28, 3445–3458. [Google Scholar] [CrossRef] [Green Version]
  22. Haase, S.; Philippot, L.; Neumann, G.; Marhan, S.; Kandeler, E. Local response of bacterial densities and enzyme activities to elevated atmospheric CO2 and different N supply in the rhizosphere of Phaseolus vulgaris L. Soil Biol. Biochem. 2008, 40, 1225–1234. [Google Scholar] [CrossRef]
  23. Cheng, L.; Booker, F.L.; Burkey, K.O.; Tu, C.; Shew, H.D.; Rufty, T.W.; Fiscus, E.L.; Deforest, J.L.; Hu, S. Soil microbial responses to elevated CO2 and O3 in a nitrogen-aggrading agroecosystem. PLoS ONE 2011, 6, e21377. [Google Scholar] [CrossRef] [Green Version]
  24. Rillig, M.C.; Scow, K.M.; Klironomos, J.N.; Allen, M.F. Microbial carbon-substrate utilization in the rhizosphere of Gutierrezia sarothrae grown in elevated atmospheric carbon dioxide. Soil Biol. Biochem. 1997, 29, 1387–1394. [Google Scholar] [CrossRef]
  25. Grayston, S.J.; Campbell, C.D.; Lutze, J.L.; Gifford, R.M. Impact of elevated CO2 on the metabolic diversity of microbial communities in N-limited grass swards. Plant Soil 1998, 203, 289–300. [Google Scholar] [CrossRef]
  26. Mayr, C.; Miller, M.; Insam, H. Elevated CO2 alters community-level physiological profiles and enzyme activities in alpine grassland. J. Microbiol. Methods 1999, 36, 35–43. [Google Scholar] [CrossRef]
  27. He, Z.; Xu, M.; Deng, Y.; Kang, S.; Kellogg, L.; Wu, L.; Van Nostrand, J.D.; Hobbie, S.E.; Reich, P.B.; Zhou, J. Metagenomic analysis reveals a marked divergence in the structure of belowground microbial communities at elevated CO2. Ecol. Lett. 2010, 13, 564–575. [Google Scholar] [CrossRef]
  28. He, Z.; Piceno, Y.; Deng, Y.; Xu, M.; Lu, Z.; DeSantis, T.; Andersen, G.; Hobbie, S.E.; Reich, P.B.; Zhou, J. The phylogenetic composition and structure of soil microbial communities shifts in response to elevated carbon dioxide. ISME J. 2012, 6, 259–272. [Google Scholar] [CrossRef]
  29. Guenet, B.; Lenhart, K.; Leloup, J.; Giusti-Miller, S.; Pouteau, V.; Mora, P.; Nunan, N.; Abbadie, L. The impact of long-term CO2 enrichment and moisture levels on soil microbial community structure and enzyme activities. Geoderma 2012, 170, 331–336. [Google Scholar] [CrossRef]
  30. Karen, M.C.; Bruce, A.H.; Bert, G.D.; Patrick, M.J. Altered soil microbial community at elevated CO2 leads to loss of soil carbon. Proc. Natl. Acad. Sci. USA 2007, 104, 4990–4995. [Google Scholar]
  31. Janus, L.R.; Angeloni, N.L.; McCormack, J.; Rier, S.T.; Tuchman, N.C.; Kelly, J.J. Elevated atmospheric CO2 alters soil microbial communities associated with trembling aspen (Populus tremuloides) roots. Microb. Ecol. 2005, 50, 102–109. [Google Scholar] [CrossRef] [Green Version]
  32. Ferrocino, I.; Chitarra, W.; Pugliese, M.; Gilardi, G.; Gullino, M.L.; Garibaldi, A. Effect of elevated atmospheric CO2 and temperature on disease severity of Fusarium oxysporum f. sp. lactucae on lettuce plants. Appl. Soil Ecol. 2013, 72, 1–6. [Google Scholar] [CrossRef]
  33. Zheng, J.Q.; Han, S.J.; Zhou, Y.M.; Ren, F.R.; Xin, L.H.; Zhang, Y. Microbial Activity in a Temperate Forest Soil as Affected by Elevated Atmospheric CO2. Pedosphere 2010, 20, 427–435. [Google Scholar]
  34. Fang, H.; Cheng, S.; Lin, E.; Yu, G.; Niu, S.; Wang, Y.; Xu, M.; Dang, X.; Li, L.; Wang, L. Elevated atmospheric carbon dioxide concentration stimulates soil microbial activity and impacts water-extractable organic carbon in an agricultural soil. Biogeochemistry 2015, 122, 253–267. [Google Scholar] [CrossRef]
  35. Schonhof, I.; Kläring, H.-P.; Krumbein, A.; Schreiner, M. Interaction Between Atmospheric CO2 and Glucosinolates in Broccoli. J. Chem. Ecol. 2007, 33, 105–114. [Google Scholar] [CrossRef]
  36. Long, S.P.; Ainsworth, E.A.; Rogers, A.; Ort, D.R. Rising Atmospheric Carbon Dioxide: Plants FACE the Future. Annu. Rev. Plant Biol. 2004, 55, 591–628. [Google Scholar] [CrossRef]
  37. Korres, N.E.; Norsworthy, J.K.; Tehranchian, P.; Gitsopoulos, T.K.; Loka, D.A.; Oosterhuis, D.M.; Gealy, D.R.; Moss, S.R.; Burgos, N.R.; Miller, M.R. Cultivars to face climate change effects on crops and weeds: A review. Agron. Sustain. Dev. 2016, 36, 12. [Google Scholar] [CrossRef] [Green Version]
  38. Bligh, E.G.; Dyer, W.J. A rapid method of total lipid extraction and purification. Can. J. Biochem. Phys. 1959, 37, 911–917. [Google Scholar] [CrossRef] [Green Version]
  39. Liu, Y.; Yao, H.; Huang, C. Assessing the effect of air-drying and storage on microbial biomass and community structure in paddy soils. Plant Soil 2009, 317, 213–221. [Google Scholar] [CrossRef]
  40. Wang, J.; Chapman, S.J.; Yao, H. The effect of storage on microbial activity and bacterial community structure of drained and flooded paddy soil. J. Soils Sediments 2015, 15, 880–889. [Google Scholar] [CrossRef]
  41. Gehron, M.J. Sensitive assay of phospholipid glycerol in environmental samples. J. Microbiol. Methods 1983, 1, 23–32. [Google Scholar] [CrossRef]
  42. White, D.; Davis, W.; Nickels, J.; King, J.; Bobbie, R. Determination of the sedimentary microbial biomass by extractible lipid phosphate. Oecologia 1979, 40, 51–62. [Google Scholar] [CrossRef] [PubMed]
  43. Wang, J.; Thornton, B.; Yao, H. Incorporation of urea-derived 13 C into microbial communities in four different agriculture soils. Biol. Fertil. Soils 2014, 50, 603–612. [Google Scholar] [CrossRef]
  44. Zheng, N.; Yu, Y.; Shi, W.; Yao, H. Biochar suppresses N2O emissions and alters microbial communities in an acidic tea soil. Environ. Sci. Pollut. Res. 2019, 26, 35978–35987. [Google Scholar] [CrossRef]
  45. Zheng, B.; Zhu, Y.; Sardans, J.; Peñuelas, J.; Su, J. QMEC: A tool for high-throughput quantitative assessment of microbial functional potential in C, N, P, and S biogeochemical cycling. Sci. China Life Sci. 2018, 61, 1451–1462. [Google Scholar] [CrossRef] [PubMed] [Green Version]
  46. Zhou, Z.; Yao, H. Effects of Composting Different Types of Organic Fertilizer on the Microbial Community Structure and Antibiotic Resistance Genes. Microorganisms 2020, 8, 268. [Google Scholar] [CrossRef] [Green Version]
  47. Looft, T.; Johnson, T.A.; Allen, H.K.; Bayles, D.O.; Alt, D.P.; Stedtfeld, R.D.; Sul, W.J.; Stedtfeld, T.M.; Chai, B.; Cole, J.R. In-feed antibiotic effects on the swine intestinal microbiome. Proc. Natl. Acad. Sci. USA 2012, 109, 1691–1696. [Google Scholar] [CrossRef] [Green Version]
  48. Zhu, Y.-G.; Zhao, Y.; Li, B.; Huang, C.-L.; Zhang, S.-Y.; Yu, S.; Chen, Y.-S.; Zhang, T.; Gillings, M.R.; Su, J.-Q. Continental-scale pollution of estuaries with antibiotic resistance genes. Nat. Microbiol. 2017, 2, 16270. [Google Scholar] [CrossRef]
  49. Liao, H.; Li, Y.; Yao, H. Fertilization with inorganic and organic nutrients changes diazotroph community composition and N-fixation rates. J. Soils Sediments 2018, 18, 1076–1086. [Google Scholar] [CrossRef]
  50. Lai, J. Quantitative Ecology: Applications of the R Language; Higher Education Press: Beijing, China, 2014. [Google Scholar]
  51. Bossio, D.A.; Scow, K.M.; Graham, N.G.J. Determinants of Soil Microbial Communities: Effects of Agricultural Management, Season, and Soil Type on Phospholipid Fatty Acid Profiles. Microb. Ecol. 1998, 36, 1–12. [Google Scholar] [CrossRef]
  52. Zhang, H.; Ding, W.; Yu, H.; He, X. Carbon uptake by a microbial community during 30-day treatment with 13C-glucose of a sandy loam soil fertilized for 20 years with NPK or compost asdetermined by a GC–C–IRMS analysis of phospholipid fatty acids. Soil Biol. Biochem. 2013, 57, 228–236. [Google Scholar] [CrossRef]
  53. Jackson, R.B.; Mooney, H.; Schulze, E.-D. A global budget for fine root biomass, surface area, and nutrient contents. Proc. Natl. Acad. Sci. USA 1997, 94, 7362–7366. [Google Scholar] [CrossRef] [PubMed] [Green Version]
  54. Poorter, H.; Pérez-Soba, M. The growth response of plants to elevated CO2 under non-optimal environmental conditions. Oecologia 2001, 129, 1–20. [Google Scholar] [CrossRef]
  55. Gobat, J.M.; Arango, M.; Matthey, W. The Living Soil: Fundamentals of Soil Science and Soil Biology; Science Publishers: Plymouth, UK, 2004. [Google Scholar]
  56. Kirschbaum, M.U. Does enhanced photosynthesis enhance growth? Lessons learned from CO2 enrichment studies. Plant Physiol. 2011, 155, 117–124. [Google Scholar] [CrossRef] [PubMed] [Green Version]
  57. Mamatha, H.; Srinivasa Rao, N.K.; Laxman, R.H.; Shivashankara, K.S.; Bhatt, R.M.; Pavithra, K.C. Impact of elevated CO2 on growth, physiology, yield, and quality of tomato (Lycopersicon esculentum Mill) cv. Arka Ashish. Photosynthetica 2014, 52, 519–528. [Google Scholar] [CrossRef]
  58. Saha, S.; Sehgal, V.K.; Chakraborty, D.; Pal, M. Atmospheric carbon dioxide enrichment induced modifications in canopy radiation utilization, growth and yield of chickpea (Cicer arietinum L.). Agric. For. Meteorol. 2015, 202, 102–111. [Google Scholar] [CrossRef]
  59. Xu, S.; Zhu, X.; Li, C.; Ye, Q. Effects of CO2 enrichment on photosynthesis and growth in Gerbera jamesonii. Sci. Hortic. 2014, 177, 77–84. [Google Scholar] [CrossRef]
  60. Paterson, E.; Hall, J.; Rattray, E.; Griffiths, B.; Ritz, K.; Killham, K. Effect of elevated CO2 on rhizosphere carbon flow and soil microbial processes. Glob. Change Biol. 1997, 3, 363–377. [Google Scholar] [CrossRef]
  61. Hu, S.; Firestone, M.K.; Chapin, F.S., III. Soil microbial feedbacks to atmospheric CO2 enrichment. Trends Ecol. Evol. 1999, 14, 433–437. [Google Scholar] [CrossRef]
  62. Tarnawski, S.; Aragno, M. The influence of elevated [CO2] on diversity, activity and biogeochemical functions of rhizosphere and soil bacterial communities. In Managed Ecosystems and CO2; Springer: Berlin/Heidelberg, Germany, 2006; pp. 393–412. [Google Scholar]
  63. Smith, P. How long before a change in soil organic carbon can be detected. Glob. Change Biol. 2004, 10, 1878–1883. [Google Scholar] [CrossRef]
  64. Haase, S.; Neumann, G.; Kania, A.; Kuzyakov, Y.; Römheld, V.; Kandeler, E. Elevation of atmospheric CO2 and N-nutritional status modify nodulation, nodule-carbon supply, and root exudation of Phaseolus vulgaris L. Soil Biol. Biochem. 2007, 39, 2208–2221. [Google Scholar] [CrossRef]
  65. Simonin, M.; Nunan, N.; Bloor, J.M.; Pouteau, V.; Niboyet, A. Short-term responses and resistance of soil microbial community structure to elevated CO2 and N addition in grassland mesocosms. FEMS Microbiol. Lett. 2017, 364, fnx077. [Google Scholar] [CrossRef] [Green Version]
  66. Chung, H.; Zak, D.; Lilleskov, E. Fungal community composition and metabolism under elevated CO2 and O3. Oecologia 2006, 147, 143–154. [Google Scholar] [CrossRef]
  67. Yang, S.; Zheng, Q.; Yuan, M.; Shi, Z.; Chiariello, N.R.; Docherty, K.M.; Dong, S.; Field, C.B.; Gu, Y.; Gutknecht, J. Long-term elevated CO2 shifts composition of soil microbial communities in a Californian annual grassland, reducing growth and N utilization potentials. Sci. Total. Environ. 2019, 652, 1474–1481. [Google Scholar] [CrossRef]
  68. Reich, P.B.; Knops, J.; Tilman, D.; Craine, J.M.; Ellsworth, D.S.; Tjoelker, M.G.; Lee, T.D.; Wedin, D.A.; Naeem, S.; Bahauddin, D. Plant diversity enhances ecosystem responses to elevated CO2 and nitrogen deposition. Nature 2001, 410, 809–812. [Google Scholar] [CrossRef]
  69. Wang, P.; Marsh, E.L.; Ainsworth, E.A.; Leakey, A.D.B.; Sheflin, A.M.; Schachtman, D.P. Shifts in microbial communities in soil, rhizosphere and roots of two major crop systems under elevated CO2 and O3. Sci. Rep. 2017, 7, 15019. [Google Scholar] [CrossRef] [Green Version]
  70. Campbell, C.; Grayston, S.; Hirst, D. Use of rhizosphere carbon sources in sole carbon source tests to discriminate soil microbial communities. J. Microbiol. Methods 1997, 30, 33–41. [Google Scholar] [CrossRef]
  71. Runion, G.B.; Curl, E.A.; Rogers, H.H.; Backman, P.A.; Rodríguez-Kábana, R.; Helms, B.E. Effects of free-air CO2 enrichment on microbial populations in the rhizosphere and phyllosphere of cotton. Agric. For. Meteorol. 1994, 70, 117–130. [Google Scholar] [CrossRef]
  72. Long, X.; Yao, H.; Huang, Y.; Wei, W.; Zhu, Y. Phosphate levels influence the utilisation of rice rhizodeposition carbon and the phosphate-solubilising microbial community in a paddy soil. Soil Biol. Biochem. 2018, 118, 103–114. [Google Scholar] [CrossRef]
  73. Klamer, M.; Roberts, M.S.; Levine, L.H.; Drake, B.G.; Garland, J.L. Influence of elevated CO2 on the fungal community in a coastal scrub oak forest soil investigated with terminal-restriction fragment length polymorphism analysis. Appl. Environ. Microbiol. 2002, 68, 4370–4376. [Google Scholar] [CrossRef] [PubMed] [Green Version]
  74. Lagomarsino, A.; Knapp, B.A.; Moscatelli, M.C.; De Angelis, P.; Grego, S.; Insam, H. Structural and functional diversity of soil microbes is affected by elevated [CO2] and N addition in a poplar plantation. J. Soils Sediments 2007, 7, 399–405. [Google Scholar] [CrossRef]
  75. Hayden, H.L.; Mele, P.M.; Bougoure, D.S.; Allan, C.Y.; Norng, S.; Piceno, Y.M.; Brodie, E.L.; DeSantis, T.Z.; Andersen, G.L.; Williams, A.L. Changes in the microbial community structure of bacteria, archaea and fungi in response to elevated CO2 and warming in an A ustralian native grassland soil. Environ. Microbiol. 2012, 14, 3081–3096. [Google Scholar] [CrossRef]
  76. Drigo, B.; Kowalchuk, G.A.; Van Veen, J.A. Climate change goes underground: Effects of elevated atmospheric CO2 on microbial community structure and activities in the rhizosphere. Biol. Fertil. Soils 2008, 44, 667–679. [Google Scholar] [CrossRef] [Green Version]
  77. Hu, S.; Chapin, F.S.; Firestone, M.; Field, C.; Chiariello, N. Nitrogen limitation of microbial decomposition in a grassland under elevated CO2. Nature 2001, 409, 188–191. [Google Scholar] [CrossRef]
  78. Gill, R.A.; Polley, H.W.; Johnson, H.B.; Anderson, L.J.; Maherali, H.; Jackson, R.B. Nonlinear grassland responses to past and future atmospheric CO2. Nature 2002, 417, 279–282. [Google Scholar] [CrossRef]
  79. Balestrini, R.; Lumini, E. Focus on mycorrhizal symbioses. Appl. Soil Ecol. 2018, 123, 299–304. [Google Scholar] [CrossRef]
  80. Cheng, L.; Booker, F.L.; Tu, C.; Burkey, K.O.; Zhou, L.; Shew, H.D.; Rufty, T.W.; Hu, S. Arbuscular mycorrhizal fungi increase organic carbon decomposition under elevated CO2. Science 2012, 337, 1084–1087. [Google Scholar] [CrossRef] [PubMed]
  81. Yu, Y.; Zhang, J.; Evangelos, P.; Baluja, M.Q.; Zhu, C.; Zhu, J.; Lin, X.; Feng, Y. Divergent Responses of the Diazotrophic Microbiome to Elevated CO2 in Two Rice Cultivars. Front. Microbiol. 2018, 9, 1139. [Google Scholar] [CrossRef] [Green Version]
  82. Niboyet, A.; Le Roux, X.; Dijkstra, P.; Hungate, B.A.; Barthes, L.; Blankinship, J.; Brown, J.; Field, C.; Leadley, P. Testing interactive effects of global environmental changes on soil nitrogen cycling. Ecosphere 2011, 2, 1–24. [Google Scholar] [CrossRef] [Green Version]
  83. Jin, J.; Tang, C.; Robertson, A.; Franks, A.E.; Armstrong, R.; Sale, P. Increased microbial activity contributes to phosphorus immobilization in the rhizosphere of wheat under elevated CO2. Soil Biol. Biochem. 2014, 75, 292–299. [Google Scholar] [CrossRef]
  84. Jin, J.; Tang, C.; Armstrong, R.; Sale, P. Phosphorus supply enhances the response of legumes to elevated CO2 (FACE) in a phosphorus-deficient vertisol. Plant Soil 2012, 358, 91–104. [Google Scholar] [CrossRef]
Figure 1. Variation of soil microbial phospholipid fatty acids (PLFAs) between aCO2 and eCO2/nmol·g−1 soil. p < 0.05, *; p < 0.01, **. The biomarkers for general include 14:0, 15:0, 16:0, 17:0 and 18:0. The biomarkers for gram negative include 16:1ω9c, 16:1ω7c, 17:1ω8c, 18:1ω7c, 19:1ω8c, 19:0 cyclo ω7c, 18:1ω8c and 17:0 cyclo ω7c. The biomarkers for gram positive include 15:0iso, 15:0anteiso, 16:0iso, 17:0iso, 17:0anteiso, 14:0anteiso, 16:0anteiso, 18:0iso and 17:1isoω9c. The biomarkers for fungi include 18:2ω6c, 18:1ω9c and 16:1ω5c. The biomarkers for actinomycetes include 16:0 10-methyl, 17:0 10-methyl, 18:0 10-methyl, 17:1ω7c 10-methyl and 18:1 ω7c 10-methyl. The ratio of fungal to bacterial are defined as the sum of fungal PLFAs to the sum of PLFAs for gram negative, gram positive and actinomycetes. The error bars represent the standard deviation of the three parallel measurements. And the sample size (N) was three.
Agronomy 10 01752 g001
Figure 2. Distance-based redundancy analyses (dbRDA) of PLFA profile with plant characteristics as explanatory variables under aCO2 and eCO2. TDW: total dry weight/g, RC: root C%, SC: shoot C%, RN: root N%. The first axis significantly explained 82.44% of the total variances and the permutation value of the overall model was 0.0889.
Agronomy 10 01752 g002
Figure 3. Distance-based redundancy analysis (dbRDA) and Linear discriminant analysis Effect Size (LEfSe) analysis of the relative abundance of bacterial community (a,b) and fungal community (c,d). In detail, (a) dbRDA of bacterial community with plant characteristics as explanatory variables under aCO2 and eCO2. Only the first axis was significant with an explained variation of 11.62% (p = 0.0389) and the permutation value of the overall model was 0.0486. (b) LEfSe analysis of the relative abundance of bacteria between aCO2 and eCO2 treated soil samples. A total of 28 biomarkers were observed from the level of kingdom to genus. Labels exhibited in the figure were ranged from the level of phylum to genus. p < 0.05. (c) dbRDA of fungal community with plant characteristics as explanatory variables under aCO2 and eCO2. Only the first axis was significant with an explained variation of 53.82% (p = 0.0167), RC alone explained 17.5% of the total variance and the permutation value of the overall model was 0.0153. (d) LEfSe analysis of the relative abundance of fungi between aCO2 and eCO2 treated soil samples. A total of 167 biomarkers were observed from the level of kingdom to genus. Labels exhibited in the figure were ranged from the level of phylum to order although significant changes were also occurred at the level of genus. p < 0.05.
Agronomy 10 01752 g003
Figure 4. (a) Absolute abundance of genes related with C hydrolysis under aCO2 and eCO2. (b) Absolute abundance of genes related with CO2 fixation and methane cycling under aCO2 and eCO2. The genes are arranged by the biodegradability of their target substrates, from labile to recalcitrant. p < 0.05, *; p < 0.01, **.
Agronomy 10 01752 g004
Figure 5. (a) Absolute abundance of genes related with N cycling under aCO2 and eCO2. (b) The scheme of N cycling. In figure (b), for each functional gene, colors mean that this gene had a higher (red) abundance at eCO2 than at aCO2 with significance at p < 0.05 (*). Gray-colored genes were not targeted by this microarray or not detected in those samples.
Agronomy 10 01752 g005
Figure 6. (a) Absolute abundance of genes associated with P cycling under aCO2 and eCO2. (b) Absolute abundance of genes associated with S cycling under aCO2 and eCO2. p < 0.05, *; p < 0.01, **.
Agronomy 10 01752 g006
Figure 7. Distance-based redundancy analysis (dbRDA) of functional genes with plant characteristics as explanatory variables under aCO2 and eCO2. Only the first axis was significant with an explained variation of 87.96% (p = 0.0361) and the permutation value of the overall model was 0.0361.
Agronomy 10 01752 g007
Figure 8. Variation partitioning analysis (VPA) of TDW based on PLFA profile and fungal ITS as explanatory variables under aCO2 and eCO2. TDW, plant total dry biomass; PLFA: 32 main PLFAs, ITS: fungal OTUs. The numbers are the percentages of the total variables explained by the factors.
Agronomy 10 01752 g008
Table 1. Effects of eCO2 on plant and soil characteristics and the significance was assessed by two tails-permutation T test or Wilcox test.
aCO2eCO2Significance
Shoot weight (g)1.3876 ± 0.11052.0747 ± 0.3487
Root weight (g)0.1384 ± 0.02960.2133 ± 0.0605
Total dry weight (g)1.526 ± 0.13972.288 ± 0.4086
Root C %34.93 ± 0.4638.26 ± 1.52*
Shoot C %36.77 ± 0.839.89 ± 1.16**
Root N %2.72 ± 0.042.17 ± 0.28
Shoot N %5.08 ± 0.433.77 ± 0.37
Soil N %0.12 ± 00.13 ± 0.01
Soil C %0.86 ± 0.020.86 ± 0.05
NO3(mg/kg soil)29.64 ± 6.7125.93 ± 6.64
NH4+(mg/kg soil)9.77 ± 1.7311.61 ± 1.09
TOC/(mg/kg)425 ± 18438 ± 18
TON(mg/kg)56 ± 258 ± 2
p < 0.05, *; p < 0.01, **.
Publisher’s Note: MDPI stays neutral with regard to jurisdictional claims in published maps and institutional affiliations.

