Article

Aerial Application Methods for Control of Weed Species in Fallow Farmlands in Texas

by
Daniel E. Martin
1,*,
Mohamed A. Latheef
1,
Juan D. Lopez, Jr.
1,† and
Sara E. Duke
2
1
Aerial Application Research, Agricultural Research Service, Unit United States Department of Agriculture, College Station, TX 77845, USA
2
Agricultural Research Service, United States Department of Agriculture, College Station, Southern Plains Area, TX 77845, USA
*
Author to whom correspondence should be addressed.
Retired.
Agronomy 2020, 10(11), 1764; https://doi.org/10.3390/agronomy10111764
Submission received: 26 September 2020 / Revised: 2 November 2020 / Accepted: 6 November 2020 / Published: 12 November 2020
(This article belongs to the Section Weed Science and Weed Management)

Abstract

:
Prolific growth of weeds, especially when followed by abundant rainfall, is common in Texas farmlands during early winter and progresses into spring when farmers begin chiseling and disking operations for spring-seeded cropping. This research sought to develop aerial application technologies designed to control unwanted vegetation in croplands left fallow until spring. The aerial nozzles used in the study were conventional hydraulic (CP), rotary atomizer, and electrostatically (ES) charged nozzles. Glyphosate at 0.4145 kg ae·ha−1 was applied on weeds using a fixed-wing aircraft equipped with various aerial nozzles used as treatments. The spray application rate for the conventional and rotary atomizer nozzles was 28.1 L·ha−1, while that for the ES charged nozzle was 9.4 L·ha−1. Aerial and ground-based remote sensing and visual estimates quantified weed vigor and canopy health. Both the CP and rotary atomizer nozzles were efficacious in suppressing weeds. ES charged on nozzles at one-third of the spray application rate of the CP and the rotary atomizer nozzles were equally effective in reducing weed vigor. More aerially applied replicated field research trials conducted over time and space are needed to unravel the differences between aerial spray nozzle technologies for controlling weed populations in Texas farmlands.

1. Introduction

Glyphosate (Roundup®), a broad-spectrum herbicide, is used extensively for weed control in production agriculture as well as in urban, industrial, and recreational areas throughout the world. It inhibits the synthesis of the plant growth hormone, EPSPS synthase, through the shikimate pathway and results in metabolic disruption and death of the plant [1]. With the introduction of transgenic, glyphosate-resistant (Roundup Ready®) crops in 1996, glyphosate is being used nearly ubiquitously in well over 90% of all transgenic crops grown worldwide [2]. Excessive reliance on glyphosate, combined with inadequate weed management practices, has increased selection pressure, and facilitated the evolution of natural resistance to glyphosate among several weed species, including those that are generally more tolerant to the herbicide [2,3]. Furthermore, the emergence of weed shifts towards species that are difficult to control has transformed weed abundance and species diversity in many field crops [4,5].
The evaluation of aerial application methods to optimize application technology for weed management in field crops is fundamental to increasing spray deposits on target sites for maximum efficacy as well as to mitigate off-target spray drift. Parkin and Wyatt [6] aerially applied preemergence herbicides on a wheat crop to determine optimum spray swath width and reported that significant deviations from the optimum value will result in large losses in return on investment. Kirk et al. [7] reported that the spray mixture application rate of herbicides and airspeed significantly influenced spray deposition on Mylar cards and plant leaves. However, a significant difference in deposition due to nozzle orientation occurred only on plant leaves. Bouse et al. [8] reported that aerially applied herbicide spray against honey mesquite indicated that the relative mortality of honey mesquite increased with increased mixture application rate and decreased with droplet size. Kirk [9] reported that aerial applications of four spray mixtures from three different formulations of glyphosate showed no significant difference in deposition and spray drift as measured 320 m downwind on Mylar cards. Obviously, none of these studies described herbicidal control of weed populations in croplands before spring seeding when prolific growth of weeds predominates. An exception to these studies, however, was that reported by Zhang et al. [10] who, during a single year, evaluated aerial nozzle technologies for control of weed populations in fallow farmlands with glyphosate and assessed their efficacy with ground-based spectral reflectance measurements.
With the cost of production remaining at record highs and crop prices at all-time lows, there is a need for effective weed management prior to seeding row crops in early spring. In North American farmlands, the inputs necessary for weed control remain one of the highest production costs and controlling weeds efficiently is, therefore, imperative for reducing farmers’ overhead costs [11]. In Texas, the growers let the harvested fields remain fallow after fall harvest until farmers prepare them for spring seeding, resulting in prolific growth of weeds, especially when followed by abundant rainfall. Aerial application of glyphosate is a common practice to achieve efficacious control of unwanted vegetation before seeding row crops in early spring. The objective of this study was to determine the efficacy of aerially applied glyphosate delivered through conventional aerial nozzles and emerging nozzle technologies, using real-time spectral reflectance measurements to assess weed vigor and canopy health.
As part of this study, conventional hydraulic, rotary atomizer, and electrostatic nozzles were evaluated for deposition of glyphosate on the weed canopy and concomitant efficacy of the treatments used in the study. The intent was to develop an optimum aerial delivery method for weed suppression in early spring and to provide guidance to aerial applicators on the use of such novel nozzle technologies that could benefit growers economically.

2. Materials and Methods

2.1. Descriptions of the Study Plot

These studies were conducted during a two-year period (2007 and 2009) at a field near Snook, Burleson County, Texas (30.524588° N, 96.407181° W) (Figure 1). The study area was left fallow for several months and thus, was heavily infested with both mono- and dicotyledonous weeds. During year one, the field was dominated by grassy and broadleaf weeds such as Amaranthus spp. and Helianthus spp. During year two, broadleaf weeds predominated over grassy weeds. Henbit, Lamium amplexicaule L., was the common broadleaf weed with patches of thistle growing in between. During year one, the field was divided into four blocks and the field was divided into three blocks during year two. In order to account for the high spatial variability in weed density, the study site was blocked with treatments randomly assigned within each block.
During year two, in order to assess whether within-field variability in weed stress existed in the test plots, a 1.1 m circumference ring made of metal wire was thrown at random into each treatment plot, and grassy and broadleaf weeds within each sample area were counted. Figure 2 shows that the weed density within the test areas was reasonably uniform with no significant difference between treatments.

2.2. Descriptions of Treatments

A fixed-wing agricultural aircraft, Air Tractor 402B (Air Tractor Inc., Olney, TX, USA), was used to make the treatment applications. Nozzle treatments (Figure 3) and aircraft operating parameters, including spray pressure, spray rates, nozzle type and deflection, airspeed, and the target droplet size, are shown in Table 1.
Treatments were made with aerial electrostatic (ES) nozzles, Model TX-VK8 (Spectrum Electrostatic Sprayers Inc., Houston, TX, USA) and CP-11TT flat fan nozzles (CP Products Inc., Tempe, Arizona) in year one of the study and in year two, the AU5000 rotary atomizer nozzles, Model AU-5000 (Micron Sprayers Ltd., Bromyard, Herefordshire, UK), were added as a treatment. The electrostatic system used in two treatments was applied at the same rate and droplet size, with the only difference being one treatment was operated with the charge on (ES on) and the other with the charge off (ES off). Operating in the charged on operational mode, one boom was charged negatively and the other positively so as not to build up a net charge on the airframe. The electrostatic nozzles were charged to 400 µA and a voltage of 7.0 and 8.4 kV for the left and the right booms, respectively, inducing a charge on the spray droplets by an applied electrical field generated by a stainless steel electrode encircling the spray cone. Such bipolar charging of spray droplets not only increased spray deposition and canopy penetration through draw-down and wrap-around effects, but also resulted in the coalescence of smaller droplets into larger droplets by increasing the VMDs [12,13]. The electrostatic spray application system used in this study was described earlier for similar studies conducted to suppress sweet potato whiteflies, Bemisia tabaci (Gennadius) and cotton boll weevil, Anthonomus grandis grandis (Boheman) on cotton [12,14,15].
A spray application rate of 28.1 L·ha−1 with a target Dv0.5 of 350 and 250 µm, respectively, was used for the conventional hydraulic and rotary atomizer nozzles. The Dv0.5 is commonly known as the volume median diameter (VMD), where 50% of the spray volume is contained in droplets smaller than this value. A 350 VMD is classified as a coarse spray and is well suited for herbicide applications because of its low drift potential [10,16]. The smaller VMD for the rotary atomizer was chosen because this is the optimum spray droplet spectrum for this particular nozzle [17]. The spray application rate for the ES nozzles was 9.4 L ha−1 with a target VMD of 200 µm. The electrostatic spray nozzles produce smaller VMDs, providing a high charge-to-mass ratio (Q/M) on the droplets, which increases the attractive force of the spray droplets to the plant targets. The VMD values for the spray solutions were determined using the USDA-ARS Spray Quality models [18]. At the time of the study, the VMD of 250 µm for the AU5000 atomizer was based upon the Micronair AU5000 Atomizer Manual [19]. A subsequent atomizer model predicted a VMD of 226 µm [12].
All treatments were made with Helosate Plus (Helm Agro US, Inc., Memphis, TN, USA) at 0.4145 kg ae·ha−1 and 0.5% v/v non-ionic surfactant, R-11 (Wilbur-Ellis Co., Fresno, CA, USA). Helosate Plus contains 41% glyphosate (N-(phosphonomethyl) glycine), in the form of its isopropyl amine salt. Each treatment’s spray mixture also contained Caracid Brilliant Flavine fluorescent dye at a rate of 37 g·ha−1 to sample spray deposition on weed foliage. The physical properties of the tank mixes are reported in Table 2. Since the spray application rate for the ES nozzle, on and off, was both 9.4 L·ha−1, the same tank mix was used for both treatments. Similarly, the same tank mix (28.1 L·ha−1) was used for the CP and the rotary nozzle treatments.
Weather parameters were monitored and recorded during all spray applications with a Gill 27,005 Anemometer (R. M. Young Company, Traverse City, MI, USA), a Young 43372VC Relative Humidity and Temperature Probe (R. M. Young Company, Traverse City, MI, USA), and a Campbell 21X data logger (Campbell Scientific, Inc., Logan City, UT, USA). Meteorological conditions, describing temperature, humidity, and wind conditions during the test periods, are presented in Table 3. During year one, temperature and humidity were stable but remained warmer than year two temperatures during the study. During year two, colder temperatures and variable relative humidity prevailed during the test. Several researchers have reported that temperature and relative humidity were the major environmental factors which influenced the uptake and translocation of glyphosate, impacting efficacy against weed populations [20,21,22]. Thus, the data reported in this study were likely influenced by the weather conditions prevalent during the test period. However, an evaluation of the significance of meteorological factors on glyphosate efficacy is beyond the scope of this study.

2.3. Sampling of Spray Deposits

In order to visually distinguish the treatment plots from each other in the aerial photos and to provide a reference for sampling, the perimeter and transverse center of each plot was disked with a tractor to a width of 2 m (Figure 4). In each replicated block, each treatment plot was flagged for three swath passes of 20 m each, and each swath was sprayed for 183 m. Each experimental unit was comprised of individual treatment plot sizes of 1.10 ha (61 × 183 m). For each treatment plot, deposition sampling was performed at 20 m in from the edge of the plot along the center swath (Figure 4). Ten sampling stations were established on the south side of the center cut in the middle of the 2nd swath with 2 m between sampling stations to lessen the cross-contamination of spray deposits between plots. At each of these locations, the water sensitive papers (WSPs), 0.026 × 0.076 m (Spraying Systems, Wheaton, IL, USA) and Mylar plates (0.1 × 0.1 m) were placed together on a single plate attached to a metal t-post driven into the ground. The plate was positioned at weed canopy height, 0.15 m above ground level, with the paper clip holding the samplers placed on the upwind side. WSPs collected during Study 1 could not be processed because a brief rain shower passed over at the time of spray application of one of the treatments and contaminated the WSP strips.

2.4. Sample Collection

The deposition measured was the tracer dye deposits, which were then used to extrapolate the deposition rate of the active ingredient. The tracer dye was applied at the same amount per hectare for all treatments. Deposition samples were collected from Mylar plates, WSPs, and weed leaves at 10 different locations in each plot, as described earlier. Approximately one minute after the treatment application, the Mylar plates, WSPs, and leaf samples were collected and placed in properly labeled plastic bags or holders. During year one, sampling for deposition on the weed canopy was comprised of Amaranthus spp., Helianthus spp., and Gramineae species. Ten top canopy leaves from each broadleaf species were collected from each treatment within each replication. Similarly, Gramineae leaf blades ( x ¯ ± SEM = 34.1 ± 2.4 cm2 area) were also collected. Nitrile gloves were used during sample collection and were changed before and after each incident. During year two, three horizontal leaf samples from purple thistle, Cirsium spp., approximately 80 mm length from the top canopy were collected at each sampling location on the upwind side of the plant. These were cut with scissors and placed in the appropriate sample bags. Immediately after collection, leaf samples were placed in coolers to preserve the integrity of the samples. WSPs were placed in negative sleeves. Mylar plate samples were placed in appropriately labeled zippered bags.

2.5. Sample Processing

Mylar and weed samples were washed in 30 mL of ethanol in the collection bags. Samples were agitated to allow time for dye to dissolve into solution in the ethanol. A sample portion of the wash effluent was placed in borosilicate glass culture tubes (12 × 75 mm). The cuvettes were then placed into a spectrofluorophotometer, Model RF5000U (Shimadzu, Kyoto, Japan), with an excitation wavelength of 427 nm and an emission wavelength of 489 nm. The fluorometric readings were converted to L·ha−1 by comparisons to standards generated with the water and dye mixture used in the study. Similarly, using the area of the weed leaf samples determined by a leaf area meter (Model LI-3100; LI-COR, Inc., Lincoln, NE, USA), deposition of the dye tracer was expressed as spray volume (L·ha−1) deposited per unit area of the sample (cm2). The minimum detection level for the dye and sampling technique was 0.07 ng·cm−2.
Spray droplet images on WSP samplers were processed by DropletScan, a commercial image processing software coupled with a flatbed scanner at 1200 dpi optical resolution that has been designed to analyze spray droplet data [23]. The inner seventy-five percent of each 26 × 76 mm card (1482 mm2) was scanned to eliminate edge effects. The spray droplet spectra parameters studied included the number of droplets, size of droplets, droplet density (number of droplets per cm2), applied spray rate, and the percent area coverage. The sizes of spray droplets measured were Dv0.1, Dv0.5, and Dv0.9. The Dv0.5, known as VMD, was described earlier. Dv0.1 and Dv0.9 represent the proportion of spray volume (10 and 90%, respectively) contained in droplets of specified size or less. Each stain in the sample area was converted to a droplet diameter using a spread factor of (1.6333 + 0.0009 * stain diameter). Knowing the droplet diameters, the volume for each droplet was calculated. The spray application rate was calculated by taking the known liquid volume of droplets on a WSP and dividing that by the area of the WSP and then, expressing that in L·ha−1.

2.6. Efficacy Assessment

The efficacy of the glyphosate applications was quantified using ground-based and aerial remote sensing imagery. The imagery systems measure the amount of light reflected by the weeds and convert the light signals into electrical output. Light is measured in the range of visible (VIS, ca. 400–700 nm) and near infrared (NIR, ca. 700–2500 nm) regions. Reflectance characteristics of plants, comprised of light absorbance and transmittance, are related to physiological status, and describe their vegetative conditions [24,25].
The ground-based remote sensing system was a Red NDVI GreenSeeker Model 505 Handheld Optical Sensor (NTech Industries, Ukiah, CA, USA), an active optical sensor that uses light emitting diodes (LEDs) as a light source and detects reflection in the VIS and NIR spectral regions. During Study 1, a 3 m long area was flagged at each of the 10 sampling locations within each treatment/replicate plot. Each of the flagged strips was scanned three times for a total of 30 readings in each plot. The scans were conducted at 1 m above the canopy height, while holding the scanner level over the entire length of the strip. The data were taken at 1, 5, 7, 9, 11, and 14 days after treatment (DAT) during year one. During year two, the instrument was attached to a SpiderTrac field machine (West Texas Lee Co., Inc., Idalou, TX, USA) at 1.0 m above ground level, travelling at 1.34 m·sec−1. Readings were taken at 10 Hz along a sampling line orthogonal to the long axis of the treatment areas and 2 m north of the center of the plot at 0 and 17 DAT. Only data from the center swath were used in the analysis, which sought to eliminate the influence of adjacent treated plots.
During year two, aerial images of the treatment areas were acquired with an MS-4100 4-band multi-spectral camera (Geospatial Systems Inc., West Henrietta, NY, USA) at 0 and 16 DAT. It has a passive sensor which can detect plant stress in the VIS and NIR wavelengths using sunlight. The camera was mounted through a 0.3 m porthole in the fuselage of a Cessna U206 research aircraft. Camera operation was controlled by the TerraHawk Aerial Imaging System (TerraVerde Technologies, Stillwater, OK, USA) as documented by Lan et al. [26].
Normalized Difference Vegetation Index (NDVI) is the most widely used statistic to describe the surface reflectance characteristics of vegetation canopy to determine plant vigor and health consequent to herbicide application [27,28,29,30]. It was obtained by averaging the surface reflectance over ranges of wavelengths in the VIS and NIR regions in the electromagnetic spectrum. NDVI was calculated from the following equation for both ground and aerial remote sensing images:
N D V I = N I R R E D N I R + R E D
NIR and RED are the pixel values (0–255) in the near-infrared and red spectrums at 660 and 770 nm, respectively, for each of the pixels in the treated area. NDVI can range from −1.0 to 1.0. During year two, ground-based GreenSeeker data were obtained for treatments at 1 and 17 DAT. The percent change in NDVI values was then calculated for the treatments at 17 DAT from these data. Aerial multi-spectral data were comprised of 33 K NDVI values for each treatment and were obtained at 0 and 16 DAT. Like the ground-based data, the percentage reduction in NDVI values at 16 DAT was calculated for aerial imaging. The NDVI values for the pixels in the treated area were analyzed by custom software developed by LabView (National Instruments, Austin, TX, USA) and averaged for spectral analysis. The percent reduction in NDVI at 16 and 17 DAT was used as the statistic to evaluate the efficacy of the glyphosate in the treatment areas because its computation included initial conditions of the vegetation and subsequent loss in weed vigor in the study area.
Additionally, during year two of the study, visual estimates of weed mortality were determined at 16 DAT by randomly throwing a 1.1 m circumference ring made of metal wire into each sampling site, with eyes closed. Ten such samples were taken from each treatment within each replication. The number of live and dead plants inside the ring, comprised of grassy and broadleaf weeds, was counted, and recorded.

2.7. Data Analysis

All data were analyzed using JMP® [31]. In year one NDVI data, there were 3 treatments, 5 different DAT, and 4 replications. Within each replication, NDVI was measured at 10 locations and averaged over subsamples within the location. In year two, NDVI data were autocorrelated and were not independent due to the spatially serial nature of the ground-based NDVI data (90–108 points). Additionally, there existed a great deal of heterogeneity in the data which ranged from 0.15 to 0.75, so DAT 1 values were clustered according to their similarity using a hierarchical clustering procedure. Ten clusters were selected, and their values averaged, which represented the breadth of NDVI values. Deviations from DAT 1 to 17 DAT were then calculated.
Aerial imagery data were composed of 101,477 ± 111.2 and 33,825.7 ± 302.3 pixel values (x ± SEM), per treatment and experimental unit, respectively. These data were averaged by replication and by treatment and formed the basis of statistical comparisons using the ANOVA model. The standard deviation of the data averaged by treatment and replication was analyzed using a one-way ANOVA model of fit Y by X with treatment and standard deviation as the X and Y factors, respectively. Figure 5 shows that the standard deviation of mean percent change in NDVI values was not significantly different between treatments. Similarly, Figure 6 shows that the standard deviation of NDVI values obtained at 16 DAT did not differ significantly between treatments. These data indicated that the dispersion of pixel values from the mean was comparable between treatments and that there did not appear to be a great difference in reproducibility between the two sources of the data. The analysis of the mean response used here is similar to that described by Khaliq et al. [32], who reported that vineyard canopy vigor maps computed from pixels alone, obtained using a UAV aircraft, were more related functionally to the in-field assessment made by trained operators than to the satellite imagery. Note that these analyses have only 4 treatments and 10 error degrees of freedom (MSE) in the ANOVA model and lack statistical power to differentiate the treatments. Increasing the sample size increases power because the standard error of the mean decreases by the square root of N [33]. Therefore, the aerial imagery data were also analyzed using the 33K pixel values per experimental unit. Visual estimates of weed mortality were expressed as proportions and were analyzed using the arcsine transformation. Original means are presented to avoid difficulty in interpretation of the data. Least square means were separated using Tukey’s HSD (honestly significant difference) test at an alpha of 0.05.

3. Results and Discussion

3.1. Deposit Measurements on Mylar Cards and Weed Foliage

During year one, the deposition of dye tracer on Mylar plates was significantly higher in CP nozzle treatment than that in the ES charged on treatment. Both treatments received significantly higher deposits compared to the untreated control (Table 4). Similarly, during year two, the CP nozzle resulted in significantly higher deposition on Mylar plate samplers compared to ES charged off and on nozzles. Deposition from the rotary atomizer was significantly less than that from the CP nozzle. Both the ES on and off nozzles provided the least deposition on Mylar plates. Similar to that on Mylar samplers, the deposition of dye tracer on weed foliage significantly varied between treatments during the study (Table 4). Deposition on weed leaves for the CP and rotary nozzles was statistically similar in year one, but in year two, the CP nozzle received significantly higher deposition than the ES on and off nozzles. Deposition on the weed canopy for the CP and the rotary atomizer was statistically comparable.
Using the Mylar data as a standard deposition rate, the percent of deposit collected by the leaves appears to elicit a functional relationship between the deposition and the droplet size spectrum (Dv0.5) portfolio of 200, 250, and 350 µm expected for the ES nozzle, the rotary atomizer, and the CP nozzle, respectively. During year one, the spray deposition rates of the ES nozzle and the CP nozzle averaged 45.4% and 16.8%, respectively. During year two, the spray deposition rates averaged 96.1 and 86.9% for the ES nozzle, off and on, respectively, and the deposition rates were 49.7 and 42.3% for the rotary and the CP nozzles, respectively. These spray deposition data suggest that the nozzle which produced a smaller droplet spectrum tended to have higher deposits compared to the one with a larger droplet spectrum. Kirk et al. [7] found a significant correlation (r = 0.54) between spray deposits on Mylar and yellow foxtail grass, Setaria glauca L., but they cautioned that the coefficient of determination was too low for reliably predicting deposits on plant surfaces from that measured on artificial collectors. Artificial collectors such as Mylar plates have a rigid surface and are monotonously alike in geometry, while leaf surfaces are morphologically diverse with widely varying topography. Given that Kirk et al. [7] studied deposition on laboratory-grown foxtail plant, it is expected that in a weed-infested field with multiple species with widely varying leaf canopies, the correlation coefficient for deposition between Mylar cards and plant canopy would be probably even lower than r = 0.54.

3.2. Deposition on Water Sensitive Paper

The aerial spray nozzles significantly influenced spray application rate (Table 5). The CP nozzle increased spray rate by 36% over the rotary atomizer nozzle (16.33 vs. 12.01 L·ha−1). The volume of spray delivered by the ES on nozzle was comparable to that for the ES off nozzle (4.40 vs. 2.65 L·ha−1) and was significantly lower than those for the CP and rotary nozzles. The CP nozzle significantly increased spray coverage by 26% over the rotary atomizer nozzle (4.23 vs. 3.36%) and 238 and 446% over the electrostatic charged on and off nozzles, respectively. Spray coverage did not significantly vary between ES charged on and off nozzles (1.25 vs. 0.78%). Overall, the ES charged on nozzle treatment received nearly 61% more spray coverage (%) on an artificial collector than the ES charged off nozzle. Additionally, the volumetric deposition of spray solutions was 66% more for the ES charged on nozzle than that for the ES charged off nozzle. The rotary atomizer nozzle produced significantly greater droplet density compared to the CP nozzle (62.5 vs. 46.8 droplets/cm2). Droplet density was 33.5% more for the rotary atomizer than that for the CP nozzle.
This result was expected given that the CP and rotary nozzle treatments were applied at the same spray rate, with the rotary treatments having a VMD that was 100 µm smaller than that for the CP, which would have created a larger overall number of spray droplets at the time of spray application. Similar results were reported by Thompson et al. [34] who found that the rotary nozzle produced larger droplet density compared to the hydraulic nozzle (34.8 vs. 20.8 droplets/cm2) when glyphosate was aerially applied using a helicopter on forestry weeds in Canada. Although the ES charged on nozzle received almost 48% more droplets per unit area than the ES uncharged nozzle, they were not significantly different (29.3 vs. 19.8 droplets/cm2), likely due to the small sample size. The VMDs were significantly larger for the CP nozzle than those for the rotary atomizer nozzles. The VMDs for the ES charged on nozzles were statistically comparable to those for the ES off nozzles.
The CP nozzle treatment based on a targeted Dv0.5 of 350 μm produced droplets ranging in size from 311.1 to 345.6 μm in each of the three replications on WSP samplers. These values represent 89 to 99% of the targeted droplet size. The rotary atomizer nozzle based on a targeted Dv0.5 of 250 μm produced droplets ranging in size from 243 to 253 μm and represent 97 to 100% of the targeted size. Unlike the ES charged on nozzles, which produced droplets ranging in size from 230.4 to 249.7 μm, the droplet size for the CP and rotary atomizer nozzles appeared to be relatively constant and was in reasonable agreement with the targeted droplet size.

3.3. Efficacy

Figure 7 shows the least square mean plot for the NDVI values obtained during year one of the study. A significant difference occurred between treatments at DAT 1 (F = 3.39; p < 0.035; df = 2, 312) with the mean NDVI value for the control being significantly higher than that for the ES charged on nozzle treatment, but was comparable to that for the CP nozzle treatment. However, these treatment differences became well pronounced and deviated from one another as the season progressed. The NDVI values differed significantly between treatments at DAT 5 and thereafter throughout the sampling periods (F values were 48.50, 121.74, 94.38, 118.95, and 98.89, respectively, for DAT 5, 7, 9, 11, and 14 with p < 0.0001 at 2, 326 df). The CP nozzle at 28.1 L·ha−1 spray rate caused a significantly greater reduction in NDVI compared to the ES charged on nozzle at 9.4 L·ha−1 spray rate. The mean NDVI values decreased 56.9% in the CP nozzle treatment compared to 15.1% in the ES charged on treatment from DAT 1 to 14. Figure 8 shows the percent change in NDVI values from DAT 5 to 14, calculated from the NDVI data at DAT 1 as the baseline measurement. The differences between treatments during each of the sampling dates were highly significant (F values were 95.30, 145.82, 108.79, 140.52, and 121.11, respectively, for DAT 5, 7, 9, 11, and 14 with p < 0.0001 at 2, 326 df). The CP nozzle significantly reduced weed vigor throughout the sampling period compared to the control and the ES charged on nozzle did not perform as effectively as the CP nozzle in reducing weed vigor. The decline in weed health was as much as 3-fold greater in the CP nozzle treatment compared to the ES charged on treatment at DAT 14. The control plots exhibited positive vegetative growth throughout the sampling period, except that there was a small decline (−2.38%) in weed vigor at DAT 14.
During year two, the NDVI values for ground-based remote sensing showed that all treatments were significantly different from the control at DAT 17 (F = 33.1; p < 0.0001; df = 4, 145). Figure 9 showed that the decline in weed health was comparable between the ES charged on, the CP and the rotary atomizer nozzles. Similarly, the ES charged on nozzle reduced NDVI significantly compared to the ES charged off nozzle. Figure 10 shows that the percent change in NDVI values at 17 DAT was significantly different between treatments (F = 9.6; p < 0.0001; df = 4, 145). The test results were similar to NDVI data except that the difference between ES charged on and off was not significantly different, although the ES charged on nozzle caused a 36% reduction in weed vigor compared to 15.4% for the ES charged off nozzle.
Several researchers have reported that electrostatically charged glyphosate significantly improved weed control. For instance, Franz et al. [35] reported that electrostatically charged glyphosate significantly improved control of ryegrass compared to uncharged glyphosate under calm wind conditions, while under windy conditions with gusts up to 4.5 m·s−1, a large proportion of electrostatically charged droplets drifted away from the target site and thus, depressed the efficacy of ES charging. Wolf et al. [36] reported that electrostatically charged glyphosate increased deposition on the weed canopy 4-fold and caused a 2-fold increase in weed control compared to the uncharged glyphosate. Martin and Latheef [37] reported that ryegrass health declined 80% faster by charging the glyphosate spray solution compared to the uncharged spray. Additionally, charged glyphosate significantly decreased percent of spray volume with spray droplets <100 µm compared to uncharged glyphosate [37]. This would likely cause the spray droplets to reach the target site faster as the proportion of larger droplets predominates in the spray cloud. Additionally, Martin and Carlton [38] reported that electrostatic nozzles which produced smaller droplets had higher charge-to-mass ratios, which tend to increase the attraction between the droplets and the target. Conversely to these findings, Zhang et al. [10] reported that aerially applied glyphosate using conventional flat-fan nozzles and the rotary atomizers controlled weeds in fallow farmlands better than the ES charged off and on nozzles. It is important to note that strong wind prevailed during this study in year one (Table 3) with in-wind speeds varying from 3.3 to 5.0 m·s−1 and that this could have likely resulted in off-target drift of smaller droplets, as reported by Franz et al. [35], and thus, likely depressed glyphosate efficacy. It is noteworthy, however, that Zhang et al. [10] did not provide meteorological data and it is, therefore, not possible to assess whether or not wind velocity played a role in the results reported by them.
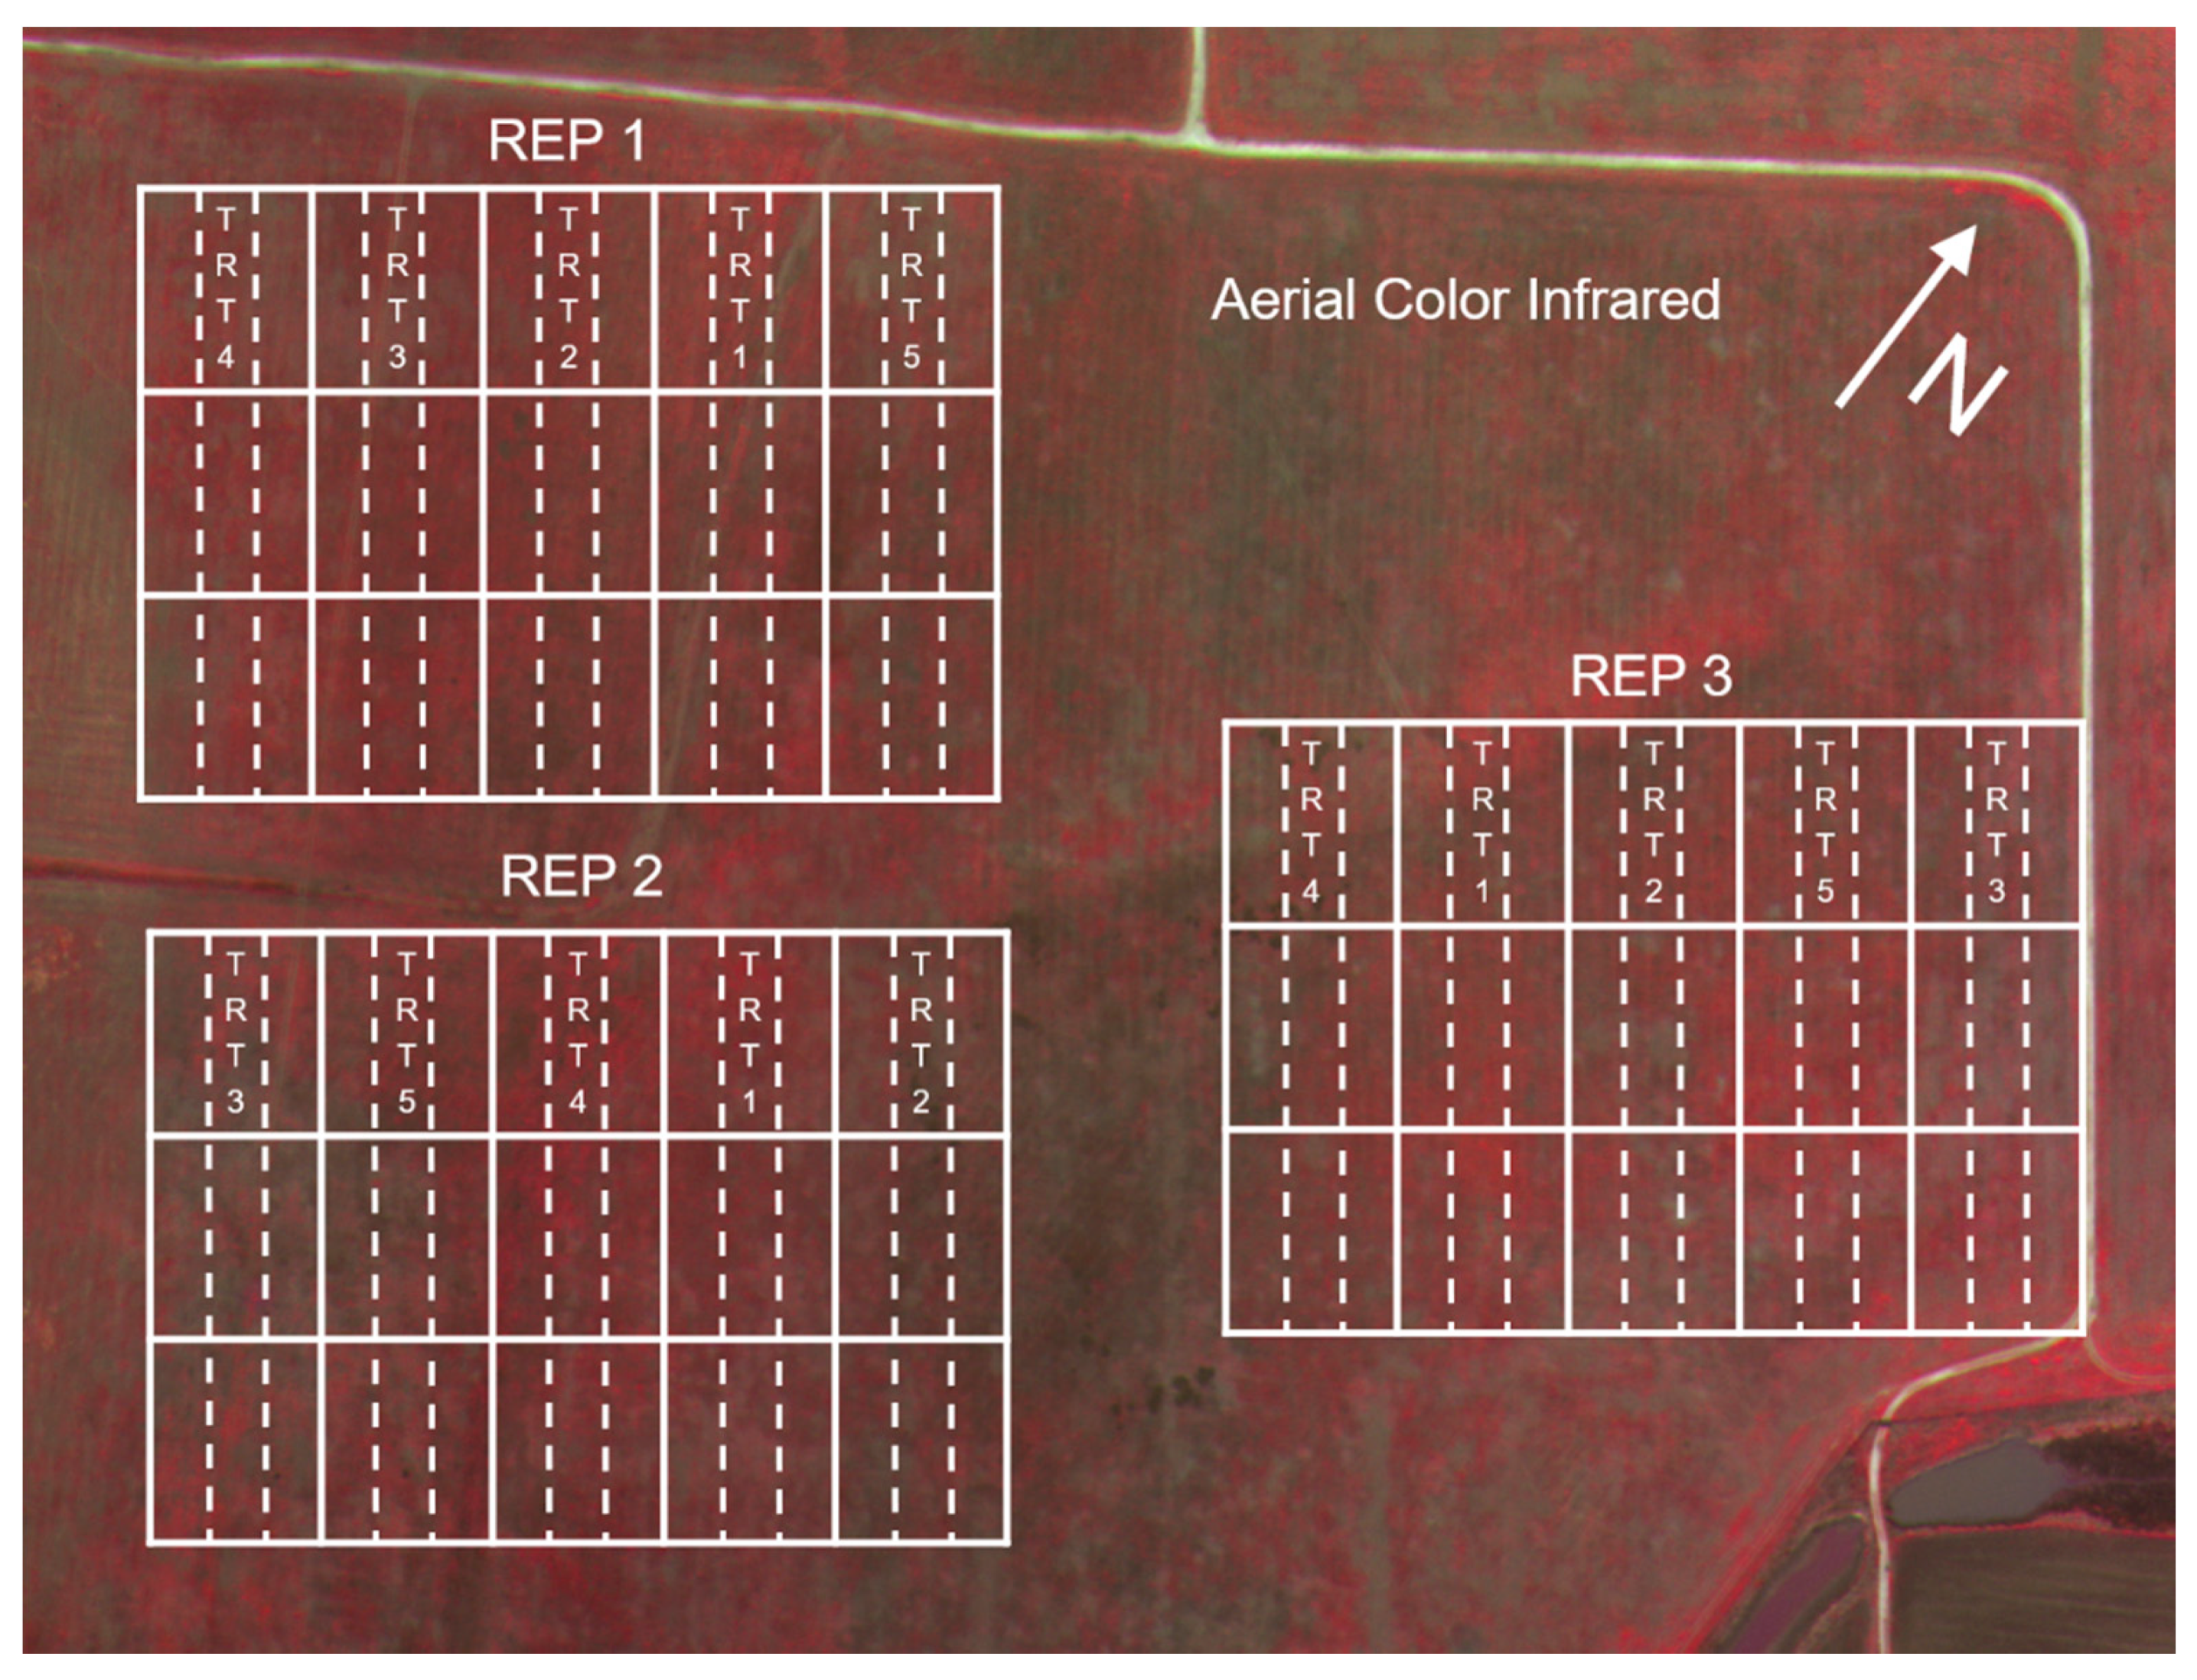
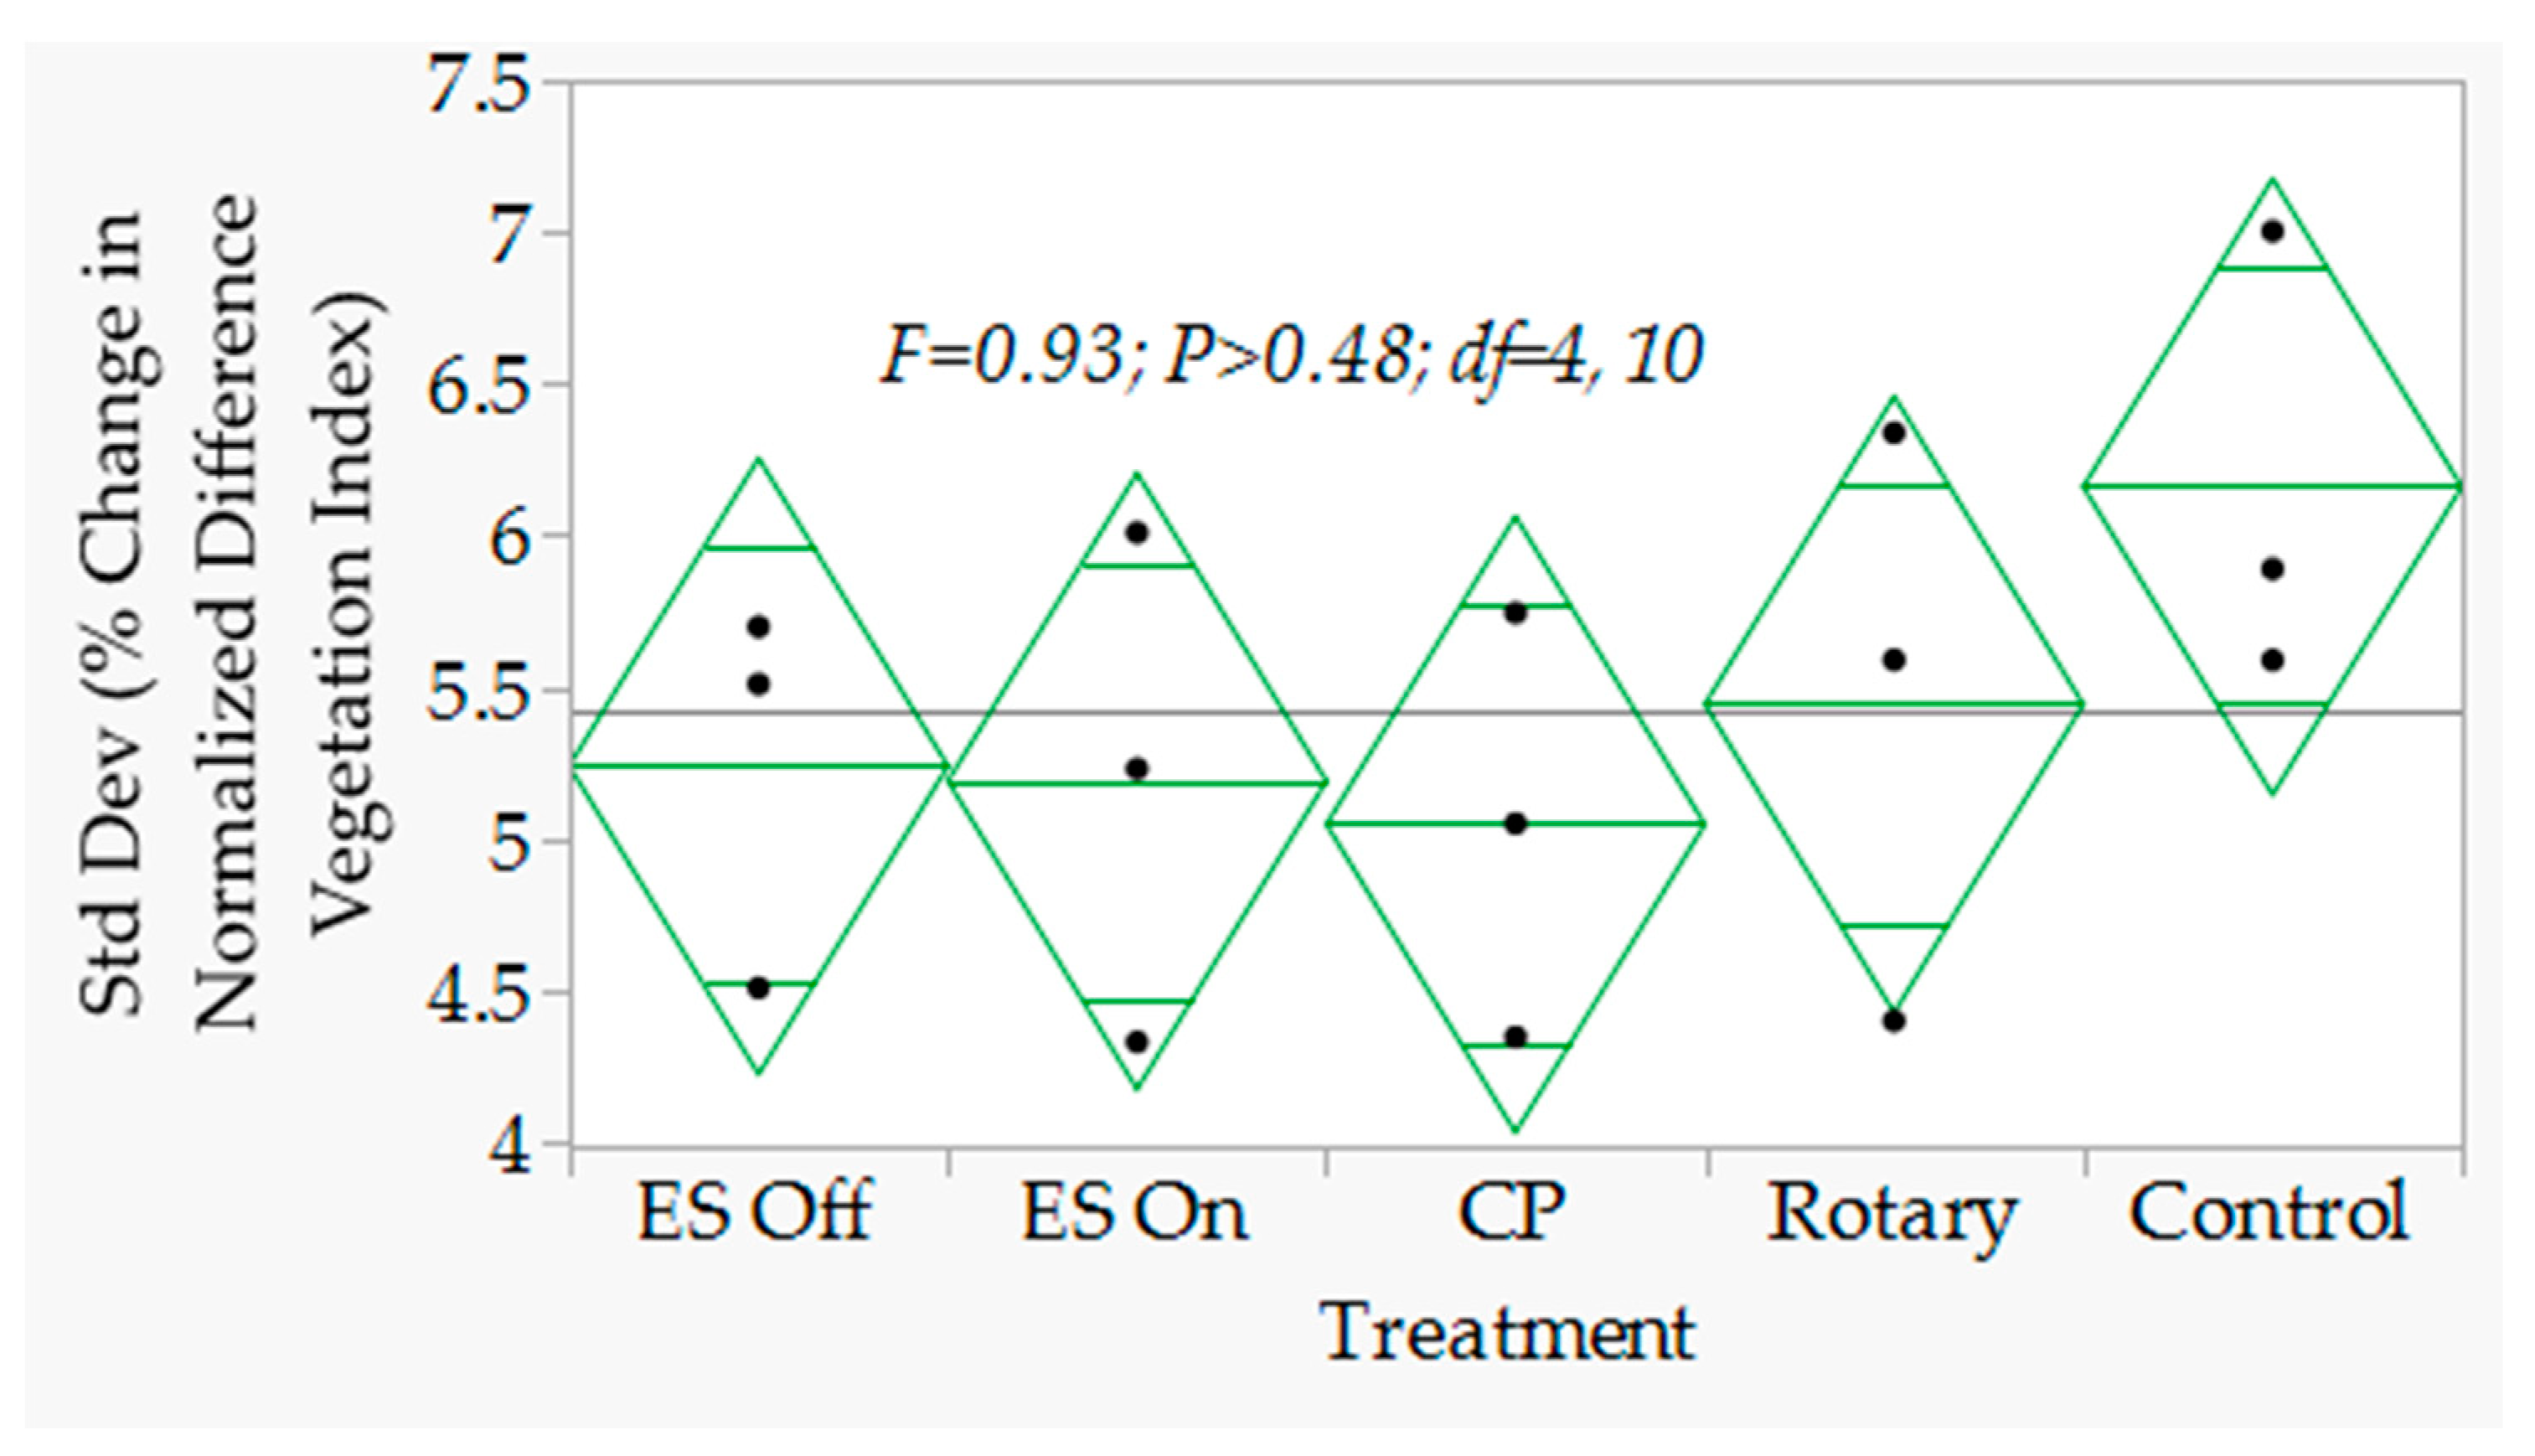
Figure 11 shows that the NDVI values obtained from aerial imaging at 16 DAT significantly varied between treatments (F = 15.34; p < 0.0003; df = 4, 10). Weed vigor was significantly depressed in all aerial nozzle treatments compared to the control. Additionally, the ES charged on nozzle improved suppression of weeds significantly compared to the control but was comparable to the uncharged glyphosate. Additionally, the rotary atomizer nozzles reduced weed vigor comparable to the ES charged on and ES charged off nozzles. However, the CP nozzles did better than the ES charged off nozzle in controlling weeds. 
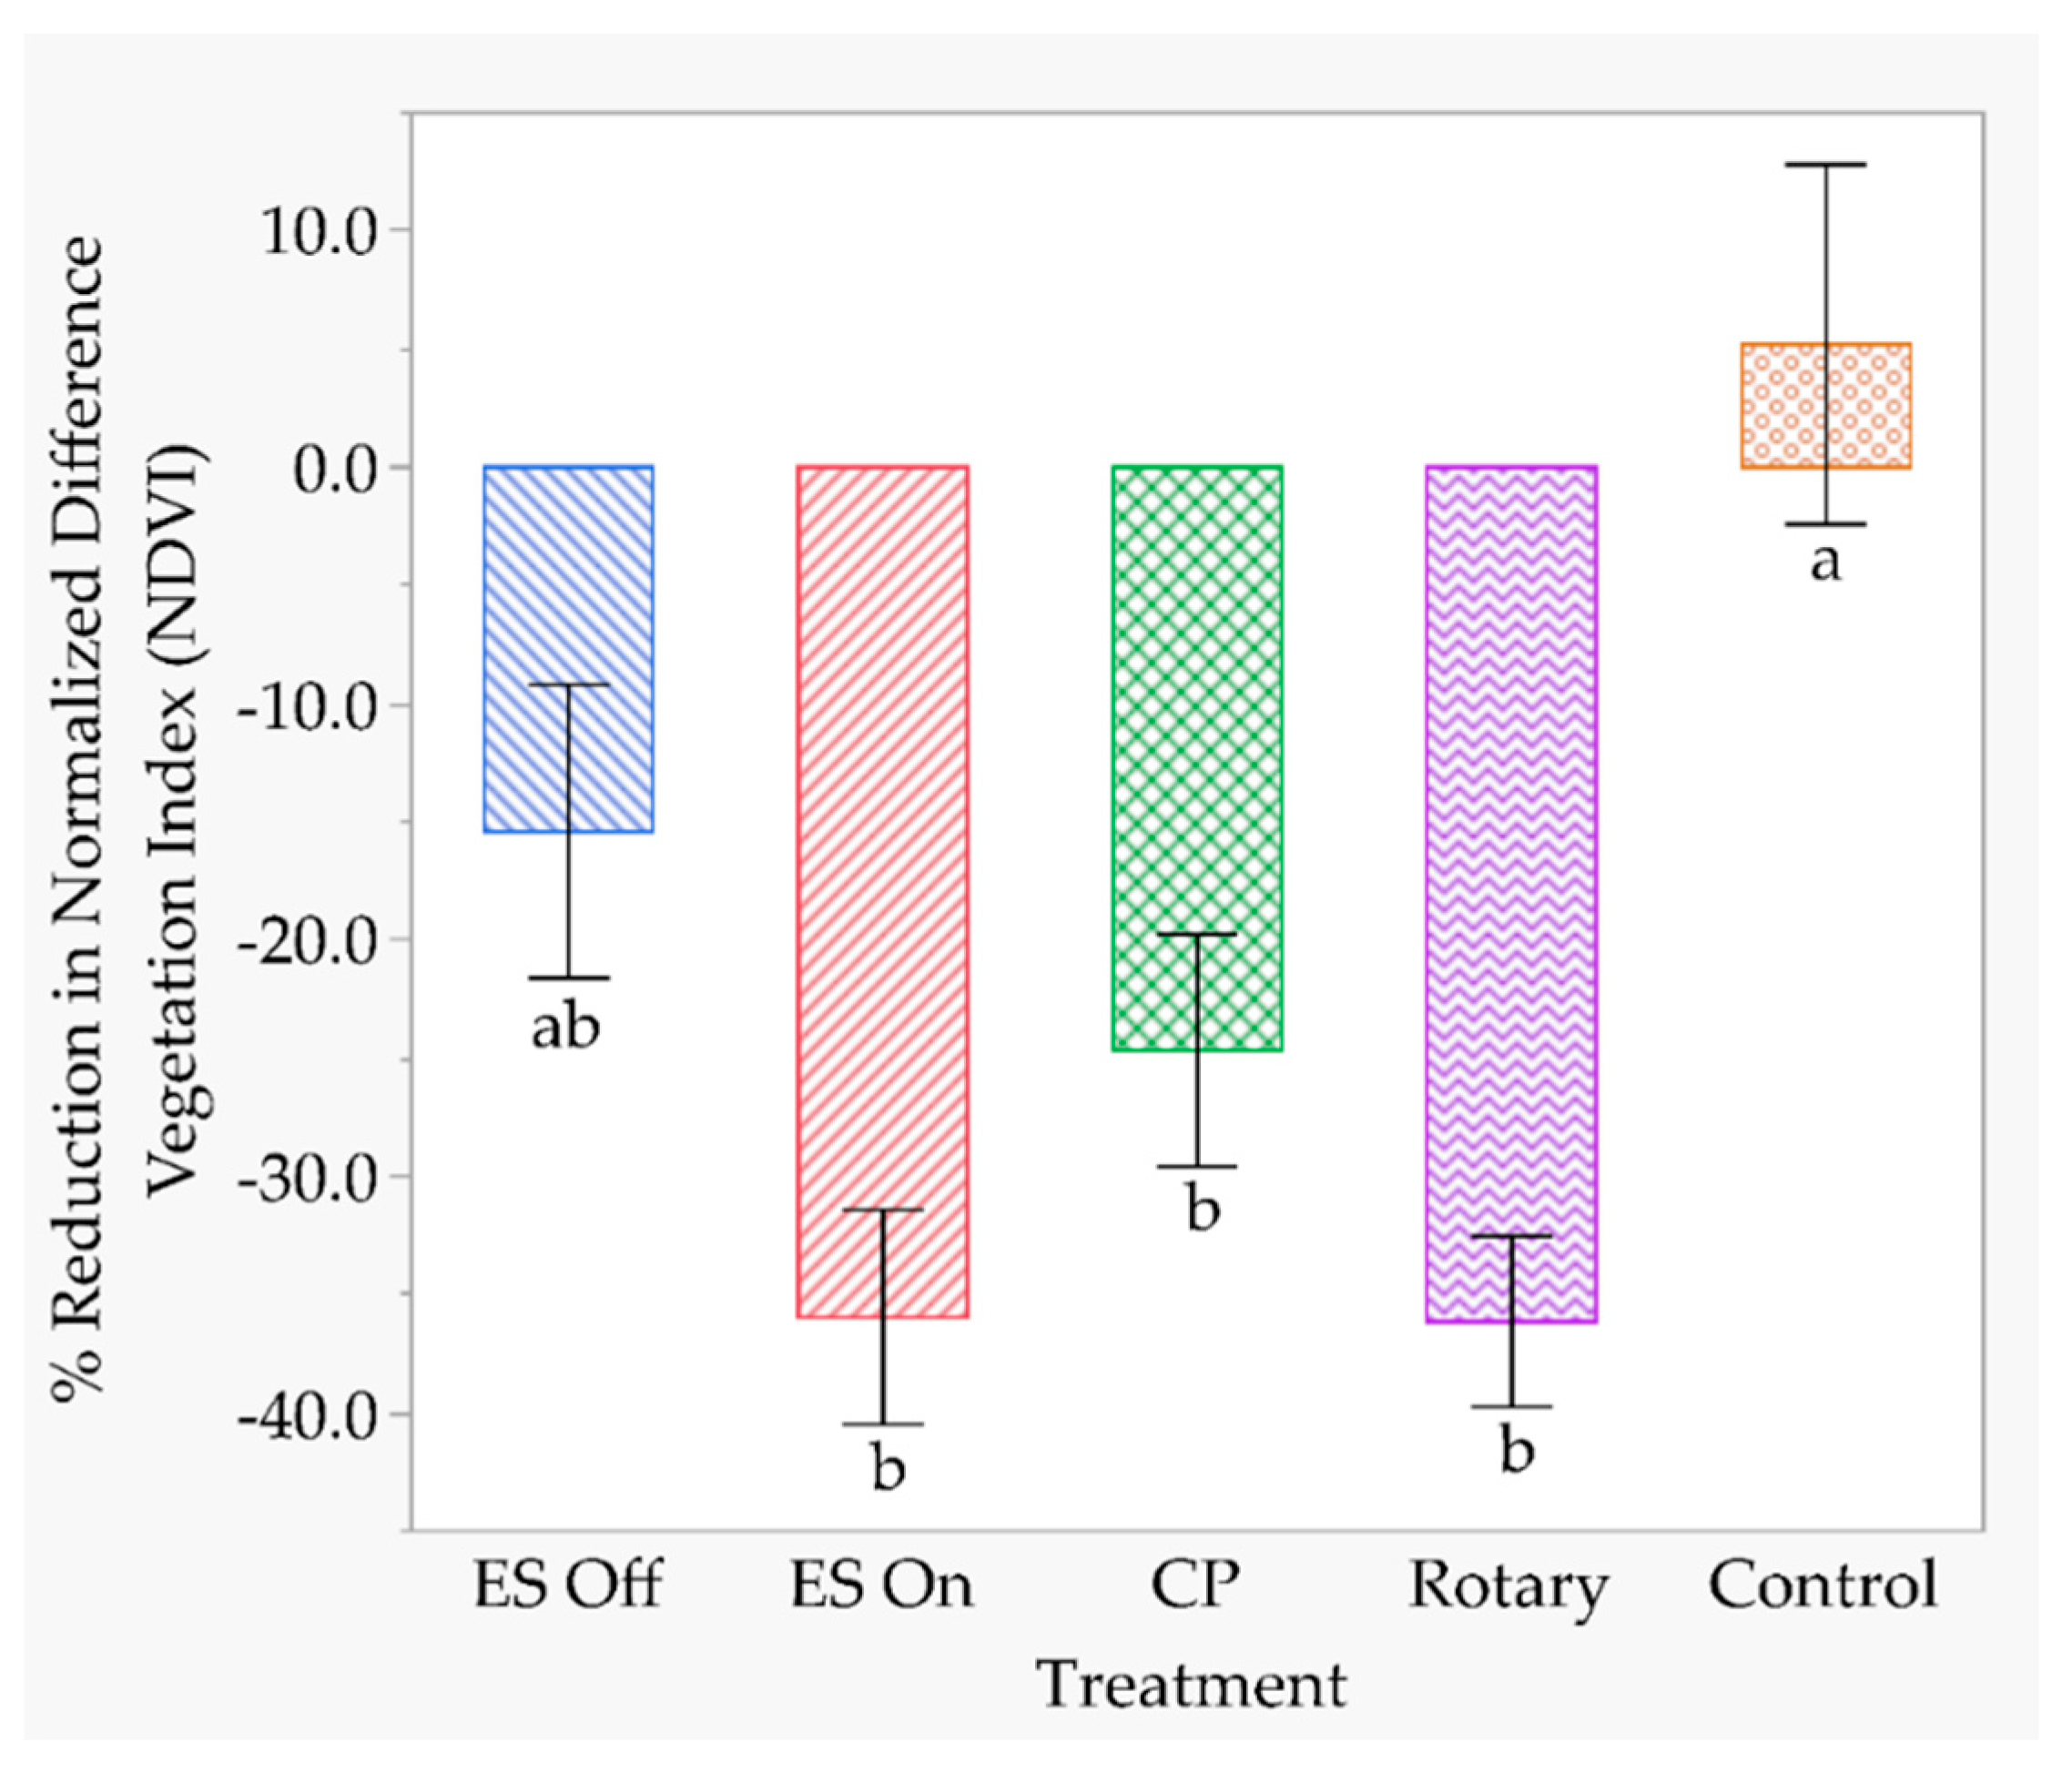
Figure 12 shows that the CP and the rotary atomizer nozzles were the only treatments which significantly depressed weed vigor compared to the control (F = 8.52; p < 0.0029; df = 4, 10). The ES charged on and ES charged off nozzles provided statistically comparable weed control. Vegetative growth continued unabated in the untreated check plots. Weed species occur as patches with mixtures of many species and cause spatial heterogeneity in their distribution [39]. The reflectance values also vary between bare soil, weed-free, and weed-infested areas [40]. Other types of land covers, such as soil, residues, rocks, etc., form part of an individual pixel and collectively become mixed pixels [40]. The aerial imagery data with mixed pixel values are likely factors that could increase the variations between treatments and make statistical separation tenuous. To date, neither an analytical technique nor an algorithm is available to separate the mixed pixel components from an individual pixel and Chang et al. [40] discussed the difficulties involved in separating the individual components in a mixed pixel.
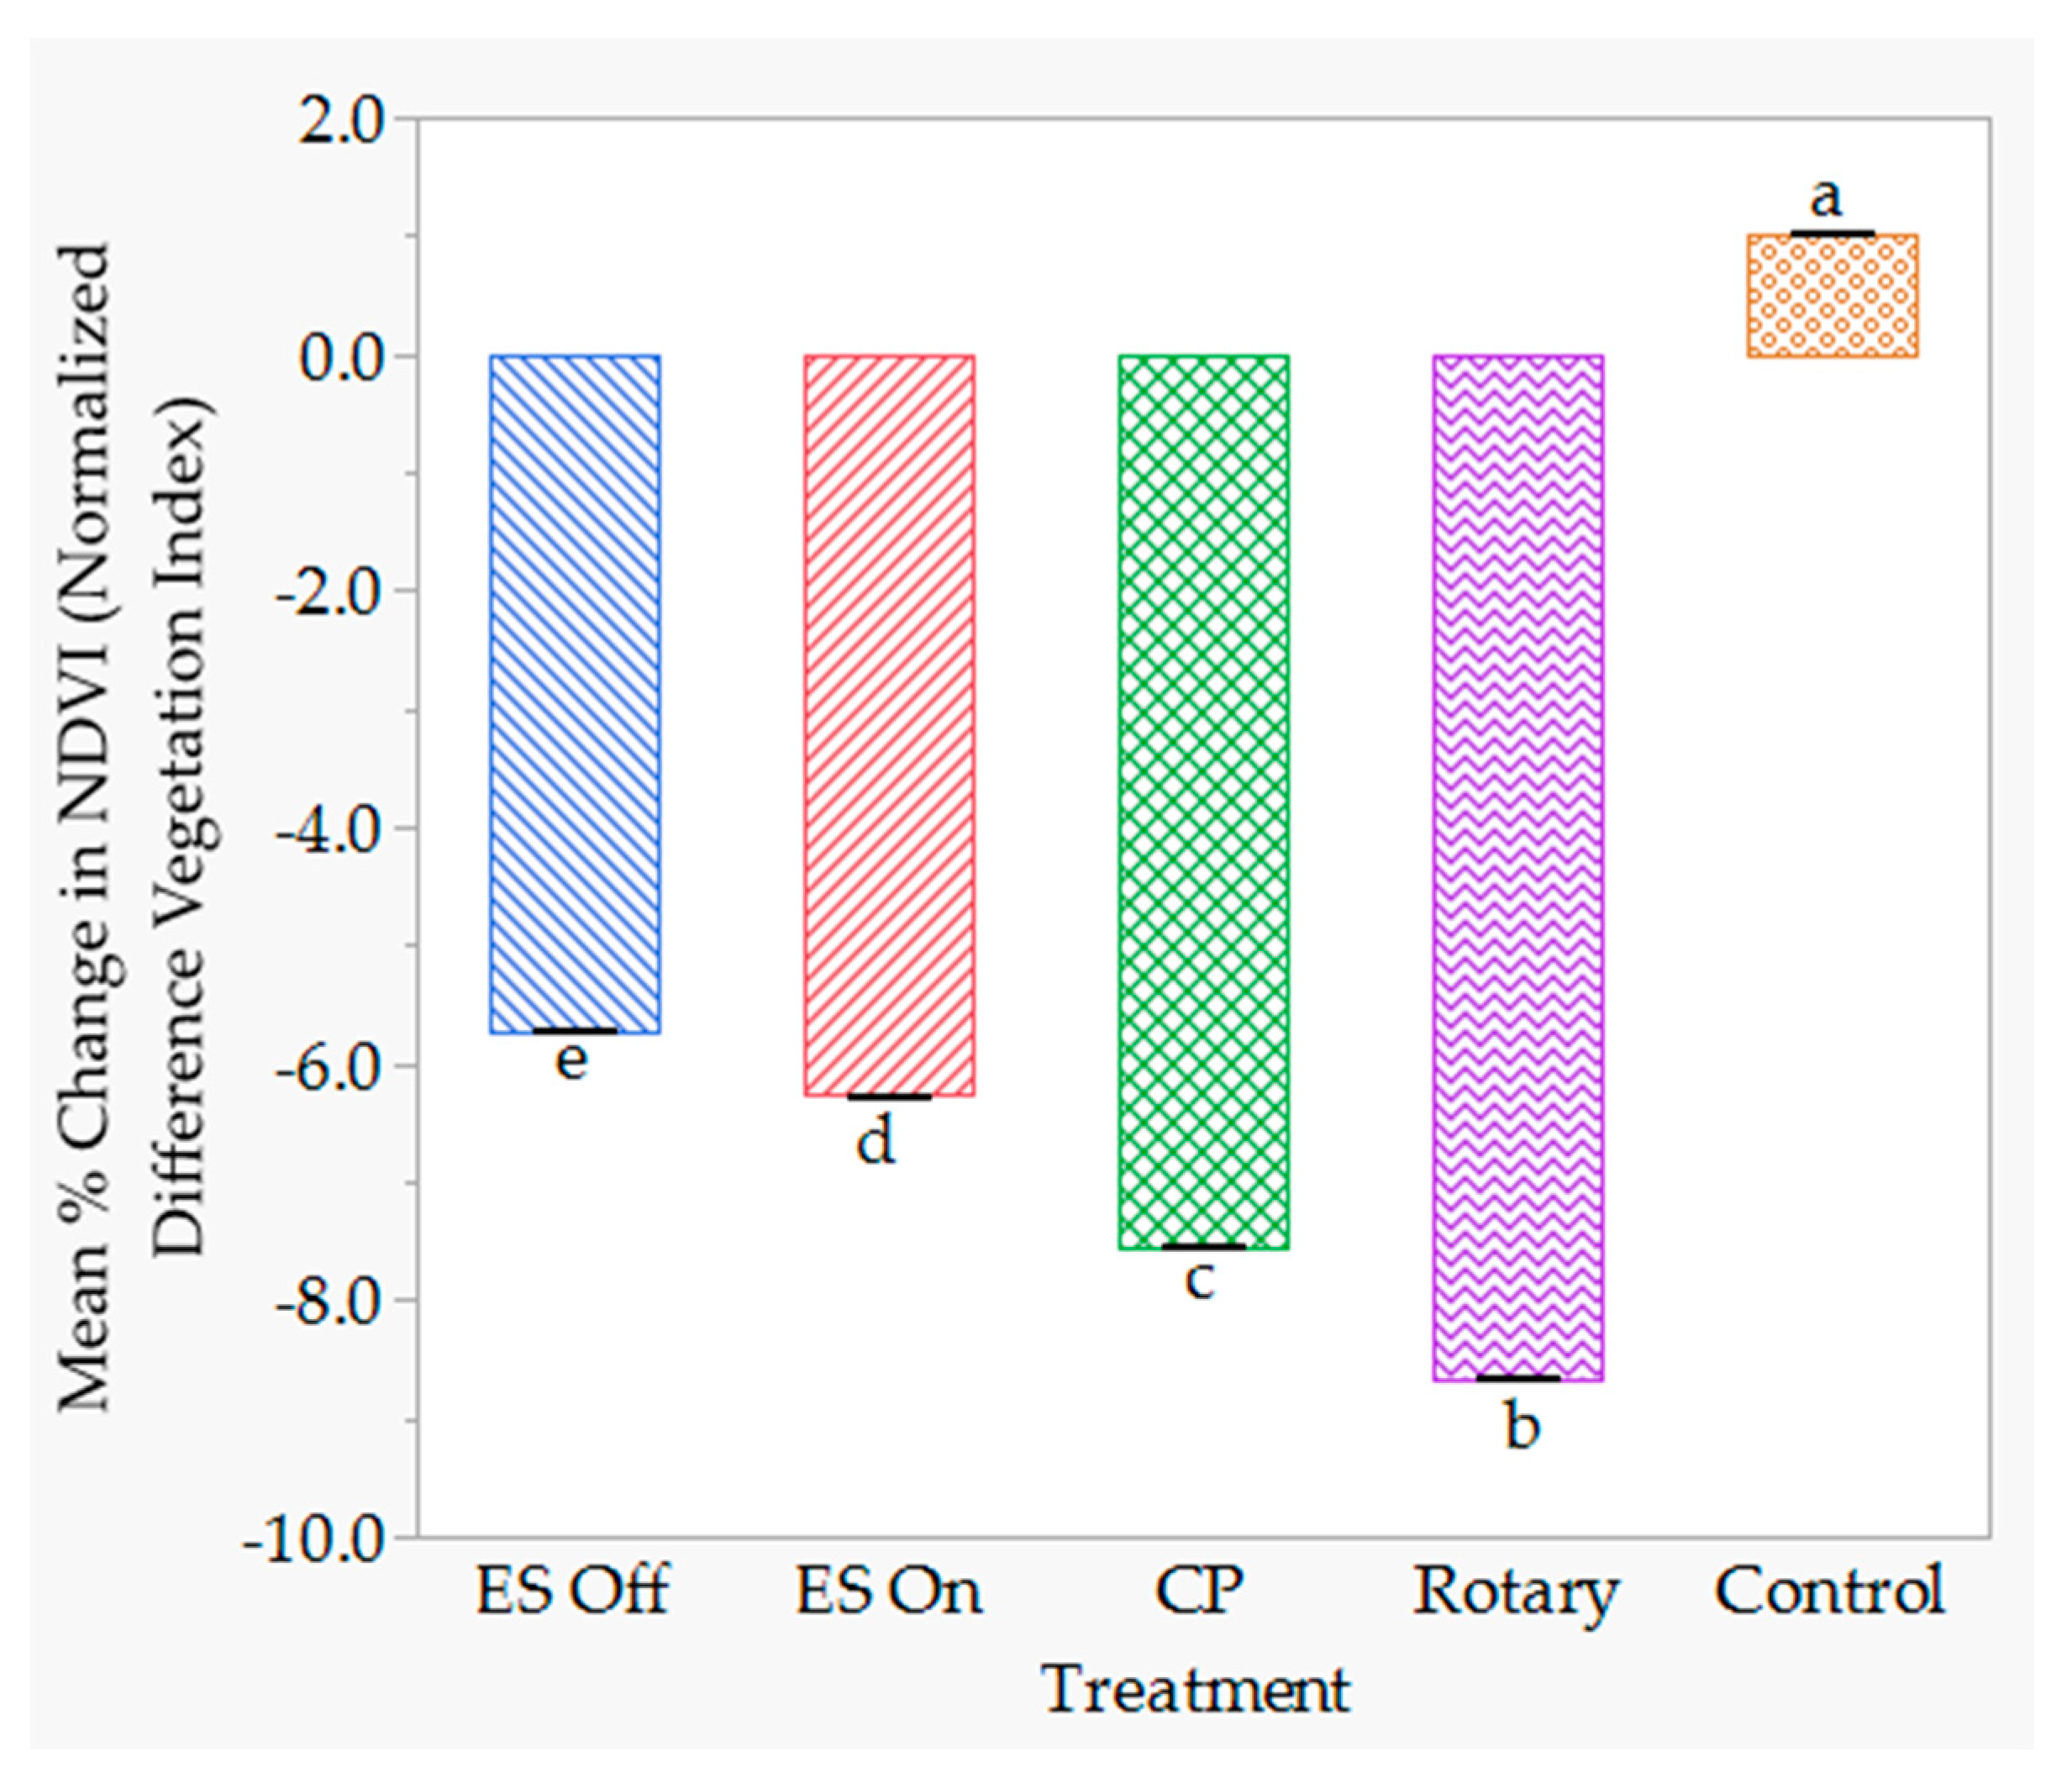
When large samples of the aerial imagery data composed of 33K pixel values per experimental unit were analyzed, all aerial nozzle treatments significantly diverged from the control (Figure 13). The rotary atomizer nozzle treatment provided the best control, followed by the CP and the ES charged on nozzles. The ES charged on nozzle treatment reduced weed vigor significantly more than the ES charged off nozzle. The decline in percent change in NDVI computed from DAT 0 as the baseline period averaged 662, 715, 840, and 949% for the ES charged off and ES charged on nozzles, the CP nozzle, and the rotary atomizer nozzle, respectively, when compared to the control. The negatively linear reduction in weed health for the aerial nozzles shown in Figure 13 indicates that the treatment efficacy conformed to an descending order with the rotary atomizer nozzle predominating in effectively controlling weeds compared to other aerial nozzle technologies.
The visual estimates of weed control at 16 DAT indicate that all the treatments were significantly different from the control (Table 6, F = 32.1; p < 0.0001; df = 4, 145). Weed mortality in the untreated check was the lowest and barely exceeded 6%. Weed mortality was comparable between the CP, the rotary atomizer, and the ES charged on nozzles. The percentage of weeds dying was two-fold greater for the ES charged on nozzle than that for the ES uncharged nozzle. Noticeably, the ES charged on nozzle received 60.7 and 45.9% greater deposition than the ES charged off nozzle on Mylar cards and weed foliage, respectively (Table 4). Furthermore, the percent area spray coverage on WSPs was nearly 61% more for the ES charged on nozzle than that for the ES charged off nozzle (Table 5). Additionally, the volumetric deposition of spray solutions was 66% more for the ES charged on nozzle than that for the ES charged off nozzle. These data suggest that the difference in weed mortality between ES charged on and ES charged off treatments (64 vs. 39%), as shown by visual estimates, was likely due to the increased spray deposition from electrically charging the spray. Several authors have reported that electrostatic charging of spray solutions did increase deposition on plant canopy [12,41,42].

3.4. Droplet Spectrum vs. Efficacy

The DV0.5 spray droplets were smaller for the rotary atomizer than those for the CP nozzles. Likewise, the DV0.5 droplets for the ES charged on nozzle were comparable to those for the rotary atomizer nozzle. This could have contributed to a greater foliar absorption of glyphosate by the weed species as several studies demonstrate that smaller droplets with higher concentration of glyphosate increased phytotoxicity against weeds [43,44,45]. However, others have reported that spray droplet size did not affect glyphosate efficacy as coarse sprays appear to provide good herbicide efficacy across a wide array of modes of action, and help mitigate spray drift potential compared to finer droplets [46,47]. Liu et al. [48] reported that although the absorption of glyphosate on Populus tremuloides Michx. increased with droplet size, herbicide concentration was more important than either the droplet size or the droplet density. Ramsdale et al. [49] found that increased herbicide concentration maximized glyphosate efficacy through reduction in the amount of antagonistic salts in the carrier volume. This was further confirmed by more efficacious low volume spray applications at 23 or 47 L·ha−1 compared to higher spray rates. However, the performance of herbicides relative to droplet size also varied with weed species [50,51,52].
The rotary atomizer nozzles had an average of 34.3% more droplets on WSP cards than the CP nozzles (638 vs. 475). Thus, droplet density was significantly higher for the rotary nozzles than that for the CP nozzles (62.5 vs. 46.8 droplets/cm2). Indeed, Behrens [53] showed that droplet spacing of about 3.1 mm equivalent to 464 droplets/cm2 for 2,4,5-T herbicide increased control of weeds on cotton and mesquite. Additionally, Phillips et al. [54] obtained better weed control in field trials with more droplets per unit area, either by reducing droplet size to 135 μm or by increasing the spray volume to 60 L·ha−1. The factors which influence spray droplet spectra for the AU5000 rotary atomizer are the rotation speed (rpm) of the rotating wire gauze cylinder, aircraft speed, and nozzle flow rate [17,55]. At higher flow rate and lower airspeed, the rotation velocity slows down and causes coarser spray droplets. Higher airspeed causes more air shear across the atomizer and produces finer spray droplets. These data indicate that the spray droplet spectra generated by the rotary atomizers could be manipulated by the aerial applicators to achieve effective weed control. Additionally, Hoffmann et al. [56] reported that the aerial applicators could add spray adjuvants to the tank mix and obtain a desirable droplet spectrum when using rotary atomizers.
A large body of research data on efficacy of glyphosate against weed populations cited above indicates that a multiplicity of factors is involved in enhancing deposition, adhesion, absorption, and translocation within the plant vascular system. Many factors such as weed foliage architecture, surfactants, droplet size, spray rates, and application hardware interact with one another and influence the suppression of weed populations. Studies have shown that the time of application of glyphosate significantly influenced its efficacy as well [57,58,59], probably because of interactions between temperature, dew, diurnal leaf movement, and botanical characteristics of weed species. Butts et al. [47] studied a range of droplet sizes using a dicamba-glyphosate mixture and found that the optimum droplet sizes within each year varied with weed species, geographic location, weather conditions, and herbicide resistance. Research data that reported on droplet spectra effects on glyphosate efficacy involved a wide variety of crops and environmental conditions, but none of them addressed the effect of aerially applied herbicides on weed mortality. It is noteworthy that the ES charged on nozzle with one-third of the spray application rate of the rotary and the CP nozzles performed equally well during year two and warrants further study. Further research is required to elucidate the relationship between herbicide efficacy and application hardware, application heights, airspeed, weather factors, and aerial platforms.

4. Conclusions

This study was conducted during two seasons to evaluate spray application technologies using a commercial fixed-wing agricultural aircraft for the control of monocot and dicot weeds in fallow farmlands where prolific growth of weeds predominates until the farmers initiate disking operations for spring seeding. Glyphosate at the 0.4145 kg ae·ha−1 active ingredient rate was aerially applied using conventional hydraulic, electrostatic, and rotary atomizer nozzles. The spray rate for the conventional and rotary nozzles was 28.1 L·ha−1, while that for the electrostatic nozzle was 9.4 L·ha−1. The DV0.5 spray droplets deposited on an artificial collector were 238, 247, and 326 µm for the electrostatically charged, the CP, and the rotary atomizer nozzles, respectively. The ground-based remote sensing data showed that the CP and ES charged on nozzles effectively reduced weed vigor during year one and two of the study. The rotary atomizer nozzle was the best application technology for reducing weed vigor during year two of the study. The electrostatically charged on nozzles, with one-third of the spray application rate of the conventional nozzles, performed equally well in comparison with the CP and the rotary atomizer nozzles in year two of the study, based on ground-based NDVI and visual weed mortality data. The ES charged on nozzles treatment received nearly 61% more spray coverage on an artificial collector than the ES charged off nozzle. Additionally, the spray volume deposition (L·ha−1) of dye tracer was 66% more for the ES charged on nozzle than that for the ES charged off nozzle. The marginal performance of the ES charged on nozzles during year 1 was likely due to gusty wind conditions that prevailed during the test period causing off-target movement of smaller charged droplets and likely decreased its efficacy. Under more favorable wind conditions, this study showed that the application of glyphosate via ES charged on nozzles at one-third of the conventional application rate can increase aerial application productivity without sacrificing herbicidal efficacy. More replicated aerial spray application studies with herbicides are needed to better understand these differences.

Author Contributions

Conceptualization, D.E.M., J.D.L.J., methodology, D.E.M., J.D.L.J., formal analysis, M.A.L., S.E.D.; writing—original draft preparation, D.E.M., M.A.L., writing—review and editing, M.A.L., D.E.M. All authors have read and agreed to the published version of the manuscript.

Funding

This research received no external funding.

Acknowledgments

We are thankful to the Aerial Application Technology Research group for help with field work. Lee Denham piloted the aircraft. Special appreciation goes to Texas A&M Research Farm Management for allowing us to use their farm for the study. The assistance of Kevin Potcner, JMP Academic Programs, in the analysis of aerial imagery data is greatly appreciated. Iqbal Latheef helped in excel data analysis.

Conflicts of Interest

The authors declare no conflict of interest.

Disclaimer

The use of trade, firm, or corporation names in this publication is for the information and convenience of the reader. Such use does not constitute an official endorsement or approval by the United States Department of Agriculture or the Agricultural Research Service of any product or service to the exclusion of others that may be suitable.

References

  1. Duke, S.O.; Powles, S.B. Glyphosate: A once-in-a-century herbicide. Pest Manag. Sci. 2008, 64, 319–325. [Google Scholar] [CrossRef] [PubMed]
  2. Nandula, V.K.; Reddy, K.N.; Duke, S.O.; Poston, D.H. Glyphosate-resistant weeds: Current status and future outlook. Outlook Pest Manag. 2005, 183–187. [Google Scholar] [CrossRef]
  3. Powles, S.B. Evolved glyphosate-resistant weeds around the world: Lessons to be learnt. Pest Manag. Sci. 2008, 64, 360–365. [Google Scholar] [CrossRef] [PubMed]
  4. Culpepper, A.S. Glyphosate-induced weed shifts 1. Weed Technol. 2006, 20, 277–281. [Google Scholar] [CrossRef]
  5. Reddy, K.N.; Norsworthy, J.K. Glyphosate-resistant crop production systems: Impact on weed species shifts. In Glyphosate Resistance in Crops and Weeds: History, Development, and Management; John Wiley and Sons: Hoboken, NJ, USA, 2010; pp. 165–184. [Google Scholar]
  6. Parkin, C.; Wyatt, J. The determination of flight-lane separations for the aerial application of herbicides. Crop Prot. 1982, 1, 309–321. [Google Scholar] [CrossRef]
  7. Kirk, I.W.; Bode, L.E.; Bouse, L.F.; Stermer, R.A.; Carlton, J.B. Deposition efficiency from aerial application of post emergence herbicides. STP 1989, 1036, 211–232. [Google Scholar]
  8. Bouse, L.; Whisenant, S.; Carlton, J. Aerial spray deposition on mesquite. Trans. ASAE 1992, 35, 51–59. [Google Scholar] [CrossRef]
  9. Kirk, I.W. Aerial spray drift from different formulations of glyphosate. Trans. ASAE 2000, 43, 555–559. [Google Scholar] [CrossRef]
  10. Zhang, H.; Lacey, R.; Lan, Y.; Hoffmann, W.C.; Martin, D.E.; Fritz, B.; Lopez, J. Ground-based spectral reflectance measurements for evaluating the efficacy of aerially-applied glyphosate treatments. Biosyst. Eng. 2010, 107, 10–15. [Google Scholar] [CrossRef]
  11. Baldwin, F.L. Transgenic crops: A view from the US Extension Service. Pest Manag. Sci. Former. Pestic. Sci. 2000, 56, 584–585. [Google Scholar] [CrossRef]
  12. Carlton, J.; Bouse, L.; Kirk, I. Electrostatic charging of aerial spray over cotton. Trans. ASAE 1995, 38, 1641–1645. [Google Scholar] [CrossRef]
  13. Kihm, K.D.; Kim, B.H.; McFarland, A.R. Atomization, charge, and deposition characteristics of bipolarly charged aircraft sprays. At. Sprays 1992, 2, 463–481. [Google Scholar] [CrossRef]
  14. Latheef, M.A.; Carlton, J.B.; Kirk, I.W.; Hoffmann, W.C. Aerial electrostatic-charged sprays for deposition and efficacy against sweet potato whitefly (Bemisia tabaci) on cotton. Pest Manag. Sci. 2009, 65, 744–752. [Google Scholar] [CrossRef] [PubMed]
  15. Kirk, I.W.; Hoffmann, W.C.; Carlton, J.B. Aerial electrostatic spray system performance. Trans. ASAE 2001, 44, 1089–1092. [Google Scholar]
  16. ASABE. Spray Nozzle Classification by Droplet Spectra; ASABE: St. Joseph, MI, USA, 2018. [Google Scholar]
  17. Teske, M.; Thistle, H.; Hewitt, A.; Kirk, I.; Dexter, R.; Ghent, J. Rotary atomiser drop size distribution database. Trans. ASAE 2005, 48, 917–921. [Google Scholar] [CrossRef] [Green Version]
  18. Kirk, I.W. Measurement and prediction of atomization parameters from fixed-wing aircraft spray nozzles. Trans. ASAE 2007, 50, 693–703. [Google Scholar] [CrossRef]
  19. Microngroup. AU5000 Atomiser Operator’s Handbook and Parts Catalogue. Available online: https://www.microngroup.com/files/au5000_web_handbook_iss_13.pdf (accessed on 20 May 2020).
  20. Jordan, T. Effects of temperature and relative humidity on the toxicity of glyphosate to bermudagrass (Cynodon dactylon). Weed Sci. 1977, 25, 448–451. [Google Scholar] [CrossRef]
  21. Coupland, D. Influence of light, temperature and humidity on the translocation and activity of glyphosate in Elymus repens (= Agropyron repens). Weed Res. 1983, 23, 347–355. [Google Scholar] [CrossRef]
  22. Whitwell, T.; Banks, P.; Basler, E.; Santelmann, P. Glyphosate absorption and translocation in bermudagrass (Cynodon dactylon) and activity in horsenettle (Solanum carolinense). Weed Sci. 1980, 28, 93–96. [Google Scholar] [CrossRef]
  23. Whittney, R.W.; Gardisser, D.R. DropletScan Operators Manual; WRK of Oklahoma and WRK of Arkansas: Stillwater, OK, USA, 2003. [Google Scholar]
  24. Sankaran, S.; Mishra, A.; Ehsani, R.; Davis, C. A review of advanced techniques for detecting plant diseases. Comput. Electron. Agric. 2010, 72, 1–13. [Google Scholar] [CrossRef]
  25. West, J.S.; Bravo, C.; Oberti, R.; Lemaire, D.; Moshou, D.; McCartney, H.A. The potential of optical canopy measurement for targeted control of field crop diseases. Annu. Rev. Phytopathol. 2003, 41, 593–614. [Google Scholar] [CrossRef] [PubMed] [Green Version]
  26. Lan, Y.; Huang, Y.; Martin, D.E.; Hoffmann, W.C. Development of an airborne remote sensing system for crop pest management: System integration and verification. Appl. Eng. Agric. 2009, 25, 607–615. [Google Scholar] [CrossRef]
  27. Felton, W.L.; Alston, C.L.; Haigh, B.M.; Nash, P.G.; Wicks, G.A.; Hanson, G.E. Using Reflectance Sensors in Agronomy and Weed Science 1. Weed Technol. 2002, 16, 520–527. [Google Scholar] [CrossRef]
  28. Rimi, F.; Macolino, S.; Leinauer, B. Winter-applied glyphosate effects on spring green-up of zoysiagrasses and ‘Yukon’bermudagrass in a transition zone. HortTechnology 2012, 22, 131–136. [Google Scholar] [CrossRef] [Green Version]
  29. Thelen, K.D.; Kravchenko, A.; Lee, C.D. Use of optical remote sensing for detecting herbicide injury in soybean. Weed Technol. 2004, 18, 292–297. [Google Scholar] [CrossRef]
  30. Hickman, M.V.; Everitt, J.H.; Escobar, D.E.; Richardson, A.J. Aerial photography and videography for detecting and mapping dicamba injury patterns. Weed Technol. 1991, 5, 700–706. [Google Scholar] [CrossRef]
  31. SAS Institute Inc. SAS JMP® 14; SAS Institute Inc.: Cary, NC, USA, 2018. [Google Scholar]
  32. Khaliq, A.; Comba, L.; Biglia, A.; Ricauda Aimonino, D.; Chiaberge, M.; Gay, P. Comparison of satellite and UAV-based multispectral imagery for vineyard variability assessment. Remote Sens. 2019, 11, 436. [Google Scholar] [CrossRef] [Green Version]
  33. Desmond, J.E.; Glover, G.H. Estimating sample size in functional MRI (fMRI) neuroimaging studies: Statistical power analyses. J. Neurosci. Methods 2002, 118, 115–128. [Google Scholar] [CrossRef] [Green Version]
  34. Thompson, D.G.; Pitt, D.G.; Fleming, R.A.; Kettela, E.G. Glyphosate efficacy on eastern Canadian forest weeds. Part I: Experimental design and on-target deposit. Can. J. For. Res. 1992, 22, 1151–1159. [Google Scholar] [CrossRef]
  35. Franz, E.; Reichard, D.L.; Carpenter, T.G.; Brazee, R.D. Deposition and Effectiveness of Charged Sprays for Pest Control. Trans. ASAE 1987, 30. [Google Scholar] [CrossRef]
  36. Wolf, T.M.; Downer, R.A.; Hall, F.R.; Wagner, O.B.; Kuhn, P. Effect of electrostatic charging on the dose transfer of water-based pesticide mixtures. In Pesticide Formulations and Application Systems: 15th Volume; ASTM International: West Conshohocken, PA, USA, 1996. [Google Scholar]
  37. Martin, D.E.; Latheef, M.A. Efficacy of electrostatically charged glyphosate on ryegrass. J. Electrost. 2017, 90, 45–53. [Google Scholar] [CrossRef]
  38. Martin, D.; Carlton, J. Airspeed and orifice size affect spray droplet spectrum from an aerial electrostatic nozzle for fixed-wing applications. Appl. Eng. Agric. 2013, 29, 5–10. [Google Scholar] [CrossRef]
  39. Cardina, J.; Johnson, G.A.; Sparrow, D.H. The nature and consequence of weed spatial distribution. Weed Sci. 1997, 45, 364–373. [Google Scholar] [CrossRef]
  40. Chang, J.; Clay, S.A.; Clay, D.E.; Dalsted, K. Detecting weed-free and weed-infested areas of a soybean field using near-infrared spectral data. Weed Sci. 2004, 52, 642–648. [Google Scholar] [CrossRef]
  41. Law, S.E.; Lane, M.D. Electrostatic Deposition of Pesticide Spray onto Foliar Targets of Varying Morphology. Trans. ASAE 1981, 24, 1441–1445. [Google Scholar]
  42. Martin, D.E.; Latheef, M.A. Aerial electrostatic spray deposition and canopy penetration in cotton. J. Electrost. 2017, 90, 38–44. [Google Scholar] [CrossRef]
  43. Feng, P.C.; Chiu, T.; Sammons, R.D.; Ryerse, J.S. Droplet size affects glyphosate retention, absorption, and translocation in corn. Weed Sci. 2009, 51, 443–448. [Google Scholar] [CrossRef]
  44. Cranmer, J.R.; Linscott, D.L. Effects of droplet composition on glyphosate absorption and translocation in velvetleaf (Abutilon theophrasti). Weed Sci. 1991, 39, 251–254. [Google Scholar] [CrossRef]
  45. Prasad, R.; Cadogan, B.L. Influence of droplet size and density on phytotoxicity of three herbicides. Weed Technol. 1992, 6, 415–423. [Google Scholar] [CrossRef]
  46. Ferguson, J.C.; Chechetto, R.G.; Adkins, S.W.; Hewitt, A.J.; Chauhan, B.S.; Kruger, G.R.; O’Donnell, C.C. Effect of spray droplet size on herbicide efficacy on four winter annual grasses. Crop Protect. 2018, 112, 118–124. [Google Scholar] [CrossRef]
  47. Butts, T.R.; Samples, C.A.; Franca, L.X.; Dodds, D.M.; Reynolds, D.B.; Adams, J.W.; Zollinger, R.K.; Howatt, K.A.; Fritz, B.K.; Hoffmann, C.W. Droplet size impact on efficacy of a dicamba-plus-glyphosate mixture. Weed Technol. 2019, 33, 66–74. [Google Scholar] [CrossRef] [Green Version]
  48. Liu, S.H.; Campbell, R.A.; Studens, J.A.; Wagner, R.G. Absorption and translocation of glyphosate in Aspen (Populus tremuloides Michx.) as influenced by droplet size, droplet number, and herbicide concentration. Weed Sci. 1996, 44, 482–488. [Google Scholar] [CrossRef]
  49. Ramsdale, B.K.; Messersmith, C.G.; Nalewaja, J.D. Spray volume, formulation, ammonium sulfate, and nozzle effects on glyphosate efficacy. Weed Technol. 2003, 17, 589–598. [Google Scholar] [CrossRef]
  50. Knoche, M. Effect of droplet size and carrier volume on performance of foliage-applied herbicides. Crop Protect. 1994, 13, 163–178. [Google Scholar] [CrossRef]
  51. Ennis, W., Jr.; Williamson, R.E. Influence of droplet size on effectiveness of low-volume herbicidal sprays. Weeds 1963, 11, 67–72. [Google Scholar] [CrossRef]
  52. Bengtsson, A. Droppstorlekens Inflytande p’a Ogräsemedlens Verkan: With a Summary in English: The Influence of Droplet Size on the Effect of Weed Killers; Almqvist & Wiksells Boktryckeri: Stockholm, Sweden, 1961. [Google Scholar]
  53. Behrens, R. Influence of various components on the effectiveness of 2, 4, 5-T sprays. Weeds 1957, 5, 183–196. [Google Scholar] [CrossRef]
  54. Phillips, M.; Bradford, A.; Harris, P. Effect on weed control of drop size, water volume and rate of a herbicide applied by spinning disc. In Proceedings of the 1980 British Crop Protection Conference-Weeds (15th British Weed Control Conference), Brighton, UK, 17–20 November 1980. [Google Scholar]
  55. Picot, J.; Vliet, M.V.; Payne, N. Droplet size characteristics for insecticide and herbicide spray atomisers. Can. J. Chem. Eng. 1989, 67, 752–761. [Google Scholar] [CrossRef]
  56. Hoffmann, W.; Fritz, B.; Yang, C. Effects of spray adjuvants on spray droplet size from a rotary atomiser. In Pesticide Formulation and Delivery Systems: 35th Volume, Pesticide Formulations, Adjuvants, and Spray Characterization in 2014; ASTM International: West Conshohocken, PA, USA, 2016. [Google Scholar]
  57. Mohr, K.; Sellers, B.A.; Smeda, R.J. Application time of day influences glyphosate efficacy. Weed Technol. 2007, 21, 7–13. [Google Scholar] [CrossRef]
  58. Stopps, G.J.; Nurse, R.E.; Sikkema, P.H. The effect of time of day on the activity of postemergence soybean herbicides. Weed Technol. 2013, 27, 690–695. [Google Scholar] [CrossRef]
  59. Martinson, K.B.; Durgan, B.R.; Gunsolus, J.L.; Sothern, R.B. Time of day of application effect on glyphosate and glufosinate efficacy. Crop Manag. 2005, 4. [Google Scholar] [CrossRef]
Figure 1. Plot layout of the study area. Note the study area was near a slough on the north side of the study plot.
Agronomy 10 01764 g001
Figure 2. Number of weeds (broadleaf and grassy weeds) per m2 in the test area during year two of the study. Treatments shown on the X-axis are electrostatically charged off (ES Off) and charged on (ES On) nozzles, the conventional hydraulic (CP) nozzle, and the rotary atomizer (Rotary) nozzle, and the untreated control. Means (±SEM) followed by the same lowercase letters are not significantly different.
Agronomy 10 01764 g002
Figure 3. Aerial nozzles used in the study: CP (A), Rotary (B), and Electrostatic (C).
Agronomy 10 01764 g003
Figure 4. Three swath passes were sprayed for 183 m in each plot within each replication and treatment. Ten sampling stations were established in the middle of the 2nd swath.
Agronomy 10 01764 g004
Figure 5. Mean standard deviation of percent change in NDVI averaged by replication and treatment. The middle line within each diamond is the group mean with the vertical point forming the 95% CIs. The center line is the grand mean for the response variable. The treatments described on the X-axis are electrostatically charged off (ES Off) and charged on (ES On) nozzles, the conventional hydraulic (CP) nozzle, and the rotary atomizer (Rotary) nozzle, compared with the Control.
Agronomy 10 01764 g005
Figure 6. Mean standard deviation of NDVI at DAT 16 averaged by replication and treatment. The middle line within each diamond is the group mean with the vertical point forming the 95% CIs. The center line is the grand mean for the response variable. The treatments described on the X-axis are electrostatically charged off (ES Off) and charged on (ES On) nozzles, the conventional hydraulic (CP) nozzle, and the rotary atomizer (Rotary) nozzle, compared with the Control.
Agronomy 10 01764 g006
Figure 7. Mean NDVI at 1, 5, 7, 9, 11, and 14 days after treatment (DAT). Means (±SEM) within each DAT followed by the same lowercase letter are not significantly different (p < 0.05) according to Tukey’s HSD test. The treatments shown in the graph are the Control, the Electrostatic charged on (ES On), and the conventional CP nozzle.
Agronomy 10 01764 g007
Figure 8. The percent change in NDVI at 5, 7, 9, 11, and 14 days after treatment (DAT). Means (±SEM) within each DAT followed by the same lowercase letter are not significantly different (p < 0.05) according to Tukey’s HSD test. The treatments shown in the graph are the Control, the Electrostatic charged on (ES On), and the conventional CP nozzle.
Agronomy 10 01764 g008
Figure 9. Mean NDVI (±SEM) obtained from ground-based remote sensing at 17 DAT. Means followed by the same lowercase letter are not significantly different (p < 0.05) according to Tukey’s HSD test. The treatments described on the X-axis are electrostatically charged off (ES Off) and charged on (ES On) nozzles, the conventional hydraulic (CP) nozzle, and the rotary atomizer (Rotary) nozzle, compared with the Control.
Agronomy 10 01764 g009
Figure 10. The percent change in NDVI (±SEM) obtained by ground-based remote sensing. Bar means followed by the same lowercase letter are not significantly different (p < 0.05) according to Tukey’s HSD test. The treatments described on the X-axis are electrostatically charged off (ES Off) and charged on (ES On) nozzles, the conventional hydraulic (CP) nozzle, and the rotary atomizer (Rotary) nozzle, compared with the Control.
Agronomy 10 01764 g010
Figure 11. Mean NDVI (±SEM) obtained from aerial imagery taken at 16 DAT. Means with the same lowercase letters are not significantly different (p < 0.0001) according to Tukey’s HSD test. The treatments described on the X-axis are electrostatically charged off (ES Off) and charged on (ES On) nozzles, the conventional hydraulic (CP) nozzle, and the rotary atomizer (Rotary) nozzle, compared with the Control.
Agronomy 10 01764 g011
Figure 12. The percent change (±SEM) in NDVI values 16 DAT obtained from aerial imagery. Means followed by the same lowercase letter are not significantly different (p < 0.05) according to Tukey’s HSD test. The treatments described on the X-axis are electrostatically charged off (ES Off) and charged on (ES On) nozzles, the conventional hydraulic (CP) nozzle, and the rotary atomizer (Rotary) nozzle, compared with the Control.
Agronomy 10 01764 g012
Figure 13. The percent change (±SEM) in NDVI values at 16 DAT obtained from aerial imagery. Means (±SEM) followed by the same lowercase letter are not significantly different (p < 0.05) according to Tukey’s HSD test. The treatments described on the X-axis are electrostatically charged off (ES Off) and charged on (ES On) nozzles, the conventional hydraulic (CP) nozzle, and the rotary atomizer (Rotary) nozzle, compared with the Control.
Agronomy 10 01764 g013
Table 1. Spray treatment setups and droplet size information.
TreatmentNo. NozzlesRate (L·ha−1)OrificeDeflectionPressureAirspeedTarget
(Degrees)(kPa)(KPH)VMD [a]
(µm)
Electrostatic Off1009.4TX-VK80483209200
Electrostatic On1009.4TX-VK80483209200
CP-11TT (4015)3928.1150241210350
AU-5000828.1VRU = Max [b]Blade-65241177250
Untreated CheckN/AN/AN/AN/AN/AN/AN/A
[a] VMD is the volume median diameter, where 50% of the spray volume is contained in droplets smaller than this value. [b] VRU is the Variable Rate Controller for the Micronair AU5000 and was used to adjust nozzle flowrate. Max is the full open setting.
Table 2. Physical properties of the spray solutions.
Tank MixDensity (gm/cm)Dynamic Surface Tension (Dyne/cm)Viscosity (cP)
Electrostatic On/Off1.006045.91.3
CP11-TT and AU50001.002543.51.1
Table 3. Weather conditions by treatments and replications during the study in year 1 and year 2.
TreatmentRepIn-Wind aCrosswind bTemperature (°C)Relative Humidity (%)
Year 1
Electrostatic On14.20.326.874.7
Electrostatic On23.31.226.873.7
Electrostatic On33.31.026.675.6
Electrostatic On43.81.326.377.4
CP-11TT14.51.128.766.5
CP-11TT24.91.028.567.4
CP-11TT35.00.328.367.7
CP-11TT44.10.828.367.7
Year 2
Electrostatic Off11.50.52.262.0
Electrostatic Off21.70.62.760.9
Electrostatic Off32.40.93.059.5
Electrostatic On12.30.93.258.3
Electrostatic On22.20.73.456.8
Electrostatic On32.20.93.954.5
CP-11TT1−3.42.110.530.1
CP-11TT2−1.13.111.029.2
CP-11TT3−1.62.411.427.5
AU-500011.4−1.312.324.6
AU-50002−1.40.913.124.3
AU-50003−1.6−0.613.423.9
a In-wind speed (m·s−1) is a measure of the wind speed in line with the aircraft’s direction of travel, in line with the long axis of the research plots. b Crosswind speed (m·s−1) is a measure of the wind speed orthogonal to the aircraft’s direction of travel.
Table 4. Mean spray volume deposition (L·ha−1) of dye tracer on an artificial sampler and on weed foliage.
TreatmentMylarLeaf
Deposit [a] (L·ha−1)Deposit [a] (L·ha−1)
Year 1
Electrostatic On3.81 b1.73 b
CP-11TT15.24 a2.56 a
Untreated Check0.58 c0.68 c
ANOVA StatisticsF = 97.7; p < 0.0001; df = 2, 117F = 35.9; p < 0.0001; df = 2, 282
Year 2
Electrostatic Off2.04 cd1.96 bc
Electrostatic On3.28 c2.85 b
CP-11TT18.97 a8.02 a
AU-500014.04 b6.98 a
Untreated Check0.010.18 c
ANOVA StatisticsF = 102.3; p < 0.0001; df = 4, 145F = 36.4; p < 0.0001; df = 4, 145
[a] The superscript lowercase letter shows Mylar and leaf deposit data. Means within each column followed by the same regular lowercase letter are not significantly different according to Tukey’s HSD test (p < 0.05).
Table 5. Mean [a] spray droplet data collected on water sensitive paper samplers during year two.
TreatmentApplication RateNumber of DropletsDroplet DensityDv0.5Coverage
(L·ha−1) (#/cm2)(μm)(%)
Electrostatic Off2.65 c201 c19.83 c220 c0.775 c
Electrostatic On4.40 c299 c29. 33 c238 bc1.249 c
CP-11TT16.33 a475 b46.77 b326 a4.226 a
AU-500012.01 b638 a62.53 a247 b3.361 b
F (df = 3, 116)45.3621.6221.6260.3243.67
[a] Means within each column followed by the same regular lower case letter are not significantly different according to Tukey’s HSD test (p < 0.05).
Table 6. Mean [a] weed mortality (%) estimated by visual sampling during year two.
NozzleWeed Mortality (%)
Electrostatic Off39.01 b
Electrostatic On63.77 a
CP-11TT74.78 a
AU-500080.76 a
Untreated Check5.98 c
F = 32.1; p < 0.0001;
df = 4, 145
[a] The lowercase letter in superscript indicates that the data were arcsine transformed. Original means within columns followed by the same regular lowercase letters are not significantly different according to Tukey’s HSD test (p < 0.05).
Publisher’s Note: MDPI stays neutral with regard to jurisdictional claims in published maps and institutional affiliations.

