Article

Effects of Sunshine Hours and Daily Maximum Temperature Declines and Cultivar Replacements on Maize Growth and Yields

1
Key Laboratory of Agricultural Soil and Water Engineering in Arid and Semi-Arid Areas, Ministry of Education, Northwest A&F University, Yangling 712100, Shaanxi, China
2
College of Water Resources and Architectural Engineering, Northwest A&F University, Yangling 712100, Shaanxi, China
3
College of Resources and Environment, Yangtze University, Wuhan 430100, Hubei, China
*
Author to whom correspondence should be addressed.
Agronomy 2020, 10(12), 1862; https://doi.org/10.3390/agronomy10121862
Submission received: 20 October 2020 / Revised: 17 November 2020 / Accepted: 24 November 2020 / Published: 26 November 2020
(This article belongs to the Special Issue Climate Change, Agriculture, and Food Security)

Abstract

:
In this study, the crop environment resource synthesis maize (CERES-Maize) model was used to explore the effects of declining sunshine hours (SSH), decreasing daily maximum temperature (Tmax), and cultivar replacements on growth processes and yields of maize in Northern China, a principal region of maize production. SSH were found to decrease at 189 of 246 meteorological stations in the northern provinces of China over the period of 1994–2012, and a decrease in Tmax was also seen at many of these stations. The most significant decrease in these two climate variables occurred during June to September, a period for summer maize growth. For this study, seven crop field stations in the ShaanXi province, in the Guanzhong Plain, were selected, all of which showed a downward trend in SSH and Tmax over the period of 1994–2012. The CERES-Maize model was first calibrated and validated against yield observations for these stations over the same period, and the yield simulations matched very well with observations. The model was then driven by the detrended SSH and Tmax data, and the simulations were compared with those with a trend in these two input variables. The decline in SSH was found to reduce the maize yield by 8% on average over these stations due mostly to limited root growth, and the decline for shorter SSH reduced the yield more than that for longer SSH. Meanwhile, the decrease in higher Tmax increased the yield by extending the growth period, while the decrease in lower Tmax reduced the yield by lowering the thermal time. In addition, the observed yield showed a significant upward trend, and our modeling results indicate that this increase can be attributed mainly to the frequent cultivar replacements over our study period. The replaced cultivars usually had a longer growth period than the prior ones, which compensated for the yield loss due to fewer SSH. Net maize production decreased with the combined effects of the declines in SSH and Tmax on yields. This study quantifies the contribution of changes in climate and cultivars to maize growth processes and yields and provides strong insights into maize production under a complex dynamic climate system.

1. Introduction

Agricultural production is significantly affected by climate change [1,2,3,4,5,6,7,8]. Global average temperatures have risen by 0.13 °C/decade since 1950. This temperature increase could shorten crop growth periods, leading to a profound impact on crop yields [9,10]. Research also indicates that daily maximum temperature (Tmax) has shown a downward trend in some regions [11,12,13,14], which generates uncertainties in predicting crop growth periods. Meanwhile, increased temperatures enhance surface evaporation, often resulting in greater cloud cover and thus, weaker incoming solar radiation [15,16]. The latter is also related to increased pollutant loads in the atmosphere [17,18,19]. The decline in solar radiation could weaken crop photosynthesis and affect production. Therefore, building a link between climate variables and crop growth processes could provide better understanding and prediction of agricultural production.
Solar radiation is an essential variable for crop growth, and it is often represented by sunshine hours (SSH) in agriculture studies. Decreasing solar radiation is found to be a dominant phenomenon in many regions of the world along with increasing temperatures [17,19,20,21,22,23,24,25,26,27]. Many studies have shown that declining SSH reduces crop yield by weakening photosynthesis [10,26,28,29,30]. However, these studies do not provide details as to how and to what extent SSH decline affects crop yield.
Temperature is a variable used to calculate the thermal time that determines crop growth stages. Many studies show that a temperature increase can reduce yields by shortening grain-filling time [2,3,9,31,32,33,34,35,36,37,38,39,40,41,42,43]. However, it is still uncertain whether a temperature increase would decrease or increase the yield for different crops [44,45,46]. Research has also found a decrease in daily temperature in some regions, a cooling resulting mostly from a lowered Tmax, which is associated with the weakened solar radiation caused by more aerosols in the atmosphere [11,12,13,14]. The cooling climate could also affect crop growth processes by extending the growth period [47,48,49], but its significance to crop growth and yield needs to be further investigated.
Cultivar replacement is an important measure to adapt to climate change and improve crop production [10,50,51]. Crop cultivar replacement could compensate for yield loss due to climate change [52,53,54]. In addition, the effects of cultivar replacement on crop growth under a warming climate have been investigated by many researchers [2,4,10,50,51,55,56]. How these effects change in a cooling climate with reduced solar radiation is not very well understood and is explored in this study.
Due to its rapid economic development and increasing population, China is experiencing unprecedented climate change and higher levels of atmospheric aerosols than ever before [57,58]. The latter reduces incoming solar radiation and shortens SSH [59], possibly also lowering the temperature in some regions [60]. Maize is the number one crop in terms of growing area and total yield among all the crops in China [61], and it was selected in this study to examine the effects of changes in climate and cultivars on growth and yield using a crop model.
Based on the facts mentioned above, we aimed to quantify the contribution of cultivar replacement and declines in SSH and Tmax to maize growth and yield in a selected region of China using the crop environment resource synthesis maize (CERES-Maize) model [62,63]. Our results showed that cultivar replacement was a dominant factor increasing the maize yield in our study region. We also analyzed the trends of SSH and Tmax for the period of 1994–2012 and separated the effect of SSH on maize growth and yield from that of Tmax by comparing the differences between the model simulations with the original and detrended SSH and Tmax. We found that the SSH decline showed a negative effect on maize growth, while the Tmax reduction produced both negative and positive effects on maize growth. This study provides an improved understanding of maize growth processes under a complex dynamic climate system and provides clues for better prediction of maize yield under different climate change conditions.

2. Materials and Methods

2.1. Data

Total maize area accounts for more than half of the total crop area in Northern China, and the production of maize in this area accounts for more than 60% of the nation’s total [61]. Therefore, this area plays a vital role in securing food production in China. However, it has also experienced a more serious downward trend in SSH than other areas in China [22]. We compared the number of stations with decreasing SSH among the main provinces planted in maize in Northern China during the period 1994–2012 (Table 1). SSH is mostly decreasing in ShaanXi Province, at 18 of 19 stations.
The study area focuses on ShaanXi Province in Northern China, which is located in an arid and semiarid region with a temperate monsoon climate. The SSH data were from 19 meteorological stations in the ShaanXi Province (Figure 1), and maize phenology dates, yield, and management data were collected from the National Meteorological Information Centre of China. Soil data were obtained from the Chinese soil database (website: http://vdb3.soil.csdb.cn/).

2.2. Model and Input Data

We explored the effects of SSH decline on maize and its yield using the CERES-Maize model [62]. The model is one of the most widely used crop models in the world, and it is embedded in the Agricultural Technology Transfer Decision Support System (DSSAT) [63]. It can simulate maize growth and development processes in daily time steps, and it can reflect the response of maize to many factors, such as genetic, environmental, and management characteristics. The potential growth of maize each day in the model depends on the photosynthetically active radiation intercepted by the maize canopy, and the actual biomass production is then calculated considering temperature stress, soil water deficits, and nitrogen deficiencies [62,64,65]. Weather data, field management information, and soil and crop parameters are needed to run the CERES-Maize model. Weather input variables are daily minimum and maximum air temperature (°C), daily sum of solar radiation (MJ/m2), and daily sum of precipitation (mm). Crop management information includes tillage, planting date, planting density, planting depth, irrigation date and volume, application of fertilizer, etc. Crop genetic parameters are given in three genetic files: cultivar, ecotype, and species, and these parameters control crop growth and development. Users are only allowed to adjust cultivar parameters (Table 2). Soil input variables include soil particle composition, physical and chemical properties, and hydrodynamic characteristics in each layer [62,64].
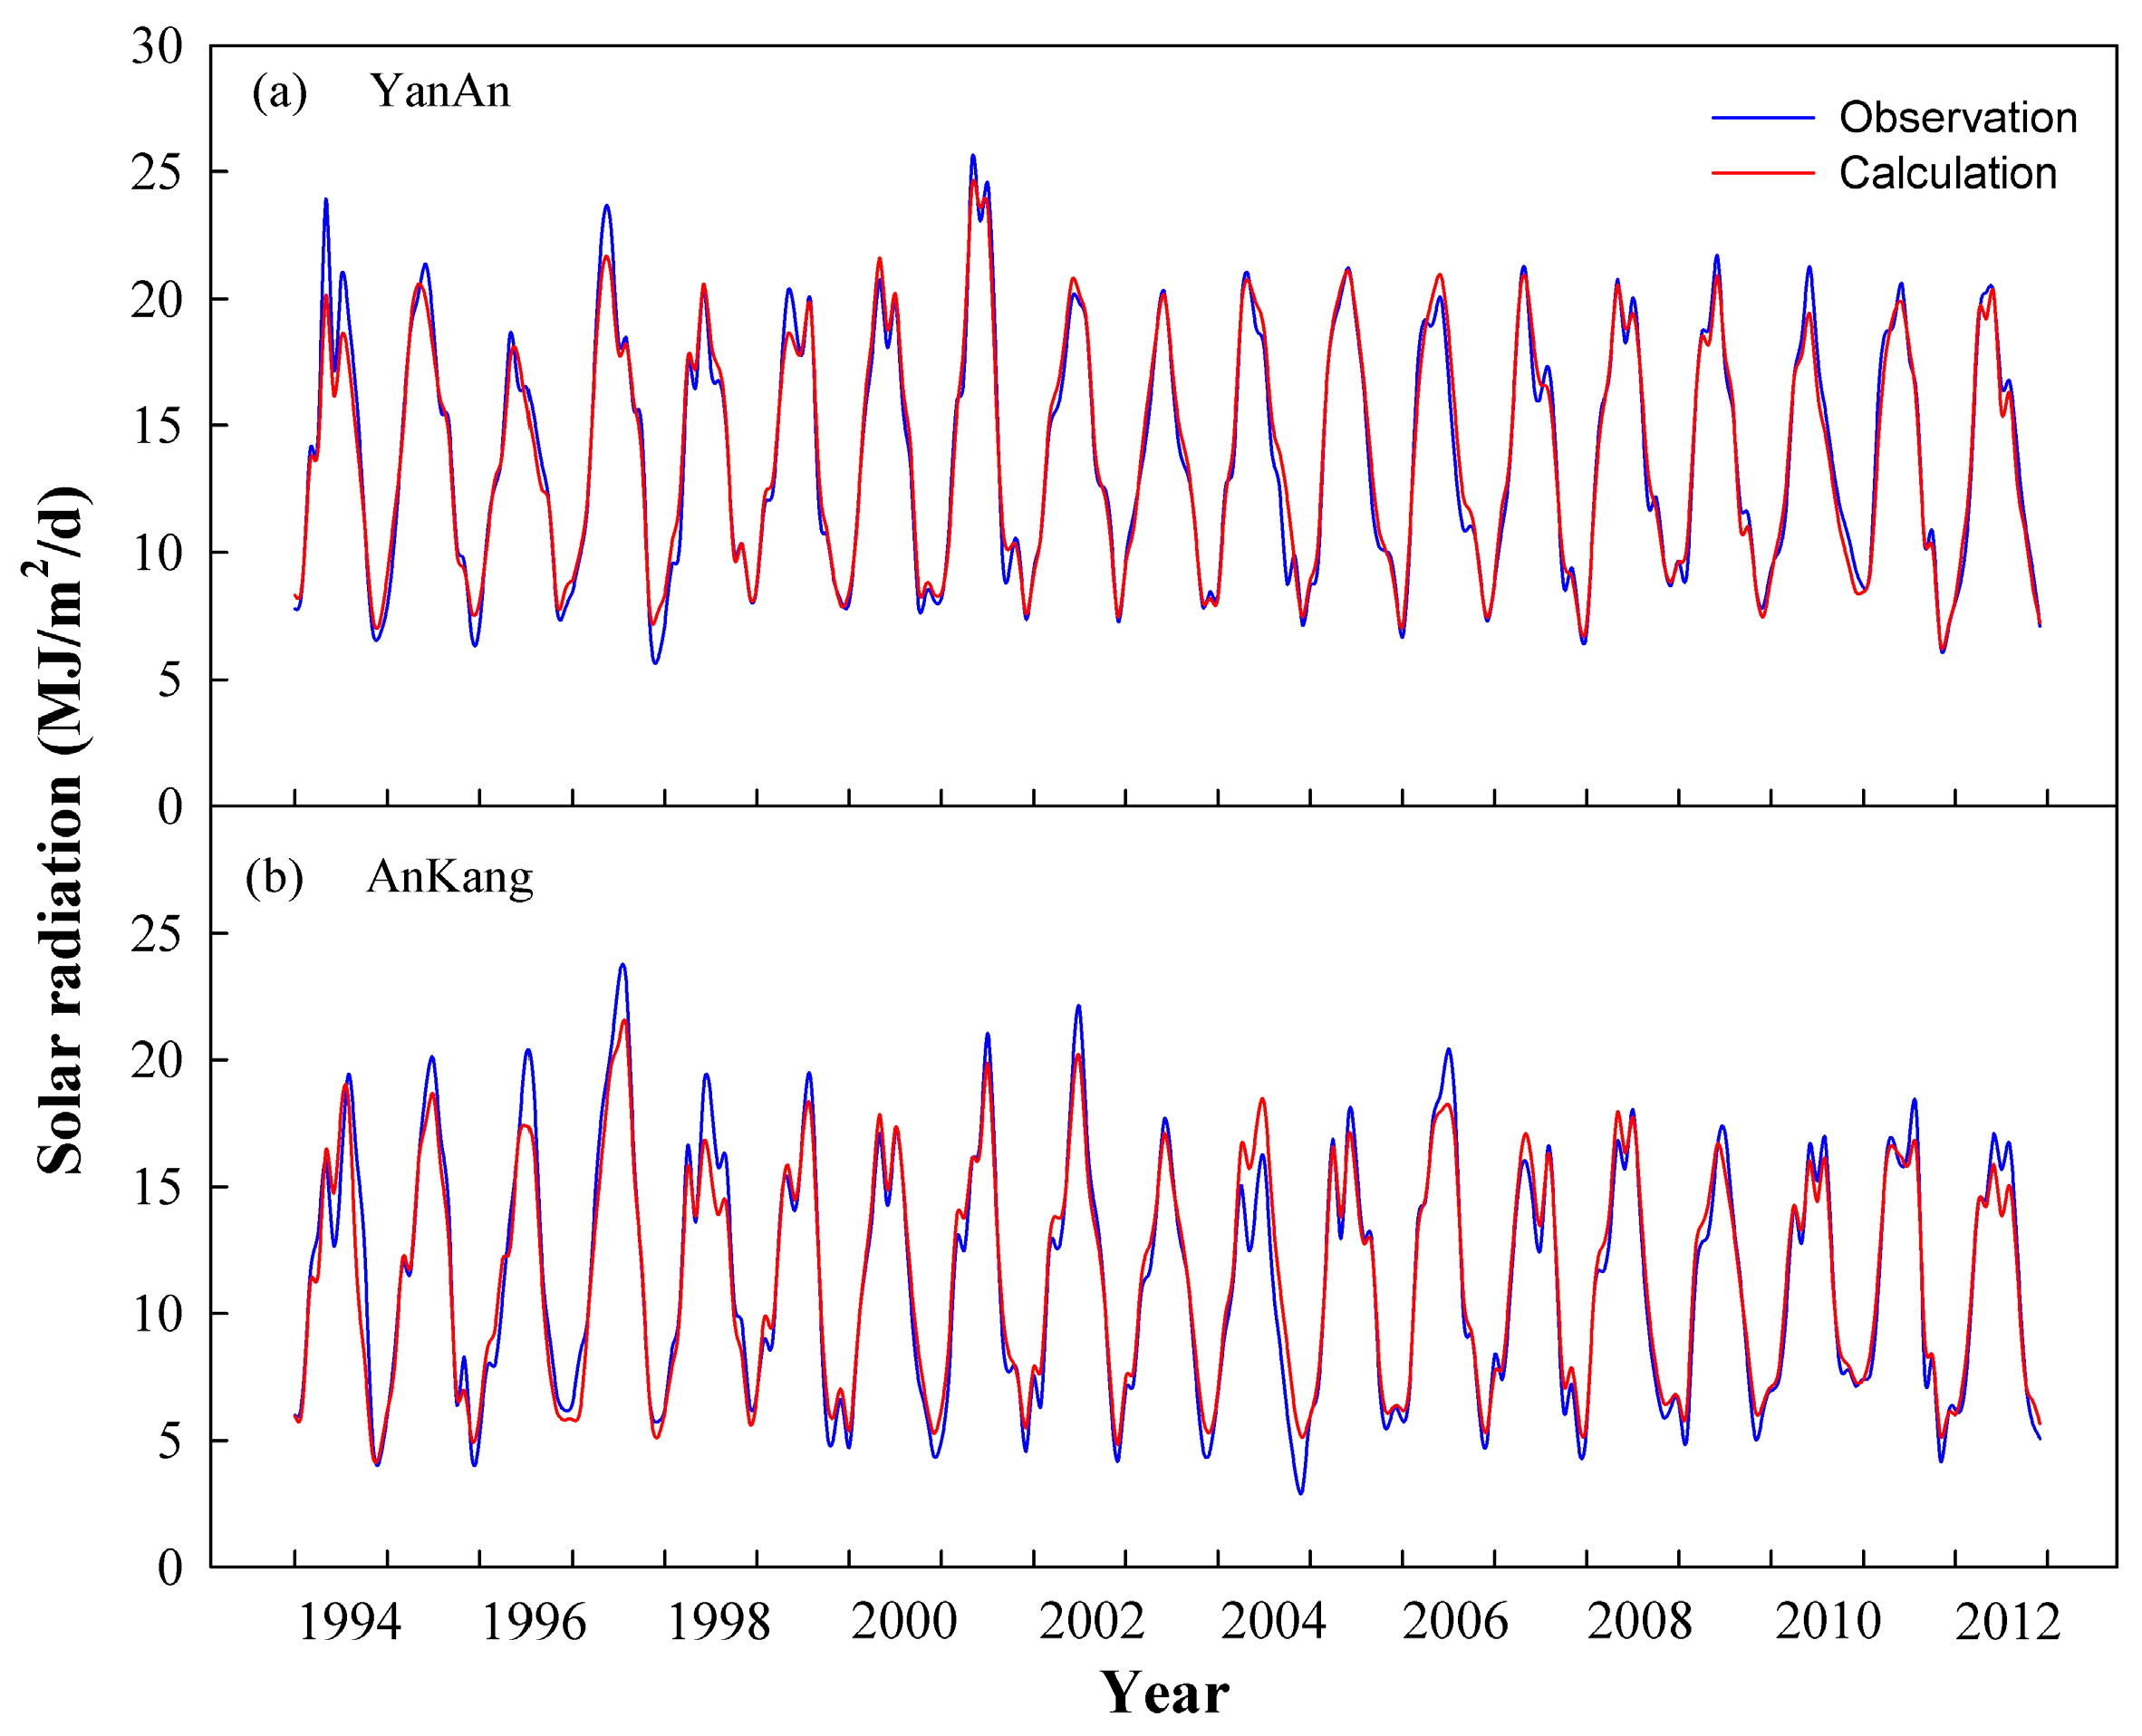
In the model, solar radiation is estimated with daily SSH by the Angstrom empirical formula [66], which performs well in calculations of solar radiation with SSH in our study region (Figure 2):
R s = R max ( a s + b s n N )
where Rs is total solar radiation (MJ/m2); Rmax is astronomical radiation (MJ/m2); as and bs are the empirical coefficients associated with atmospheric quality (an as value of 0.25 and a bs value of 0.50 are recommended by the Food and Agriculture Organization) [67]; n is actual day SSH (h); and N is maximum SSH (h).

2.3. Model Calibration and Validation

For this study, we calibrated six cultivar parameters with the CERES-Maize model using GLUE, a software package attached to the model (Table 2). Our observed data show that every maize cultivar used in the experiments was planted at least two years at each station. We performed model calibration and validation with our field data for each cultivar, and the data for the last year were always retained for validation and the earlier years were used for calibration. Detailed information for model validation and calibration is shown in Table 3.
In this study, the absolute relative error (ARE) between the simulation and observation were used to evaluate the accuracy of the model output
A R E = | S i O i | O i × 100 %
where Si is the i-th simulated value and Oi is the i-th observed value.

2.4. Methodology

2.4.1. The Mann–Kendall Trend Test

We examined the significance of the trends with the Mann–Kendall trend test [68,69] in which the correlation was calculated between the ranks of a time series and their time order. For the n time series values X = {x1, x2, …, xn}, the statistic S is computed as follows:
S = i = 1 n 1 [ j = i + 1 n sgn ( x j x i ) ]
where,
sgn ( x j x i ) = sgn ( R j R i ) = { 1 0 1 x i < x j x i = x j x i > x j
where Ri and Rj are the ranks of observations xi and xj of the time series, respectively. If the null hypothesis H0 (i.e., there is no trend in the data set) is true, then S is approximately normally distributed with:
μ = 0
σ = n ( n 1 ) ( 2 n + 5 ) / 18
The Z-statistic is therefore:
Z = { ( S 1 ) / σ 0 ( S + 1 ) / σ S > 0 S = 0 S < 0
A positive (negative) value of S indicates an upward (a downward) trend. The trend test was conducted for SSH, maximum and minimum temperatures, average temperature, and summer maize growth period.

2.4.2. Model Settings

CERES-Maize was run with historical climate data (1994–2012) to quantify the effects of changes in SSH, temperature, and cultivars on maize growth periods and yields in the ShaanXi Province. These effects were examined with five sets of simulations. The first set (original) was the control simulations, and the second (SSH) and third sets (Tmax) were conducted with detrended SSH and Tmax. The fourth set (cultivar) was run with the cultivars for 1994 for all stations throughout the 19-year simulation period (Table 4). The last set (climate) was conducted with both detrended SSH and Tmax. Actual field management information including planting, irrigation, and fertilization were applied to all these runs.

3. Results

3.1. Long-Term Trend and Seasonal Change in SSH

The time-series of the annual average SSH for the 19-year period (1994–2012) using the data from the 19 meteorological stations is shown in Figure 3a. A general trend of −0.2 h/decade (minus sign indicates a downward trend) in SSH is observed for the 19-year period. The maximum trend was −0.5 h/decade at the HuaShan station, and the minimum trend was −0.1 h/decade at the HengShan station. There was a slightly increasing trend at the DingBian station.
To understand the seasonal variations in SSH at these stations, we used the SSH data for two periods, 1994–2003 and 2003–2012, for our analysis. Averaged monthly SSH for these periods was computed, with results shown in Figure 4. The figure clearly shows that averaged monthly SSH for the period 2003–2012 was consistently lower than for 1994–2003 (Figure 3b), with the exception of December, where a very minor increase was seen in the later period. The most remarkable decline, with a value of 0.9 h, occurred from June through September, a maize growth period.
The time-series of the averaged SSH of the maize growth period is presented in Figure 3c. The SSH at all 19 stations shows a trend with a value of −0.7 h/decade for the averaged data for the summer maize growth period over the 19-year period. The maximum trend was −1.3 h/decade at the ShiQuan station, and the minimum trend was −0.1 h/decade at the WuQi station.

3.2. Trends of Weather Variables over the Maize Growing Period

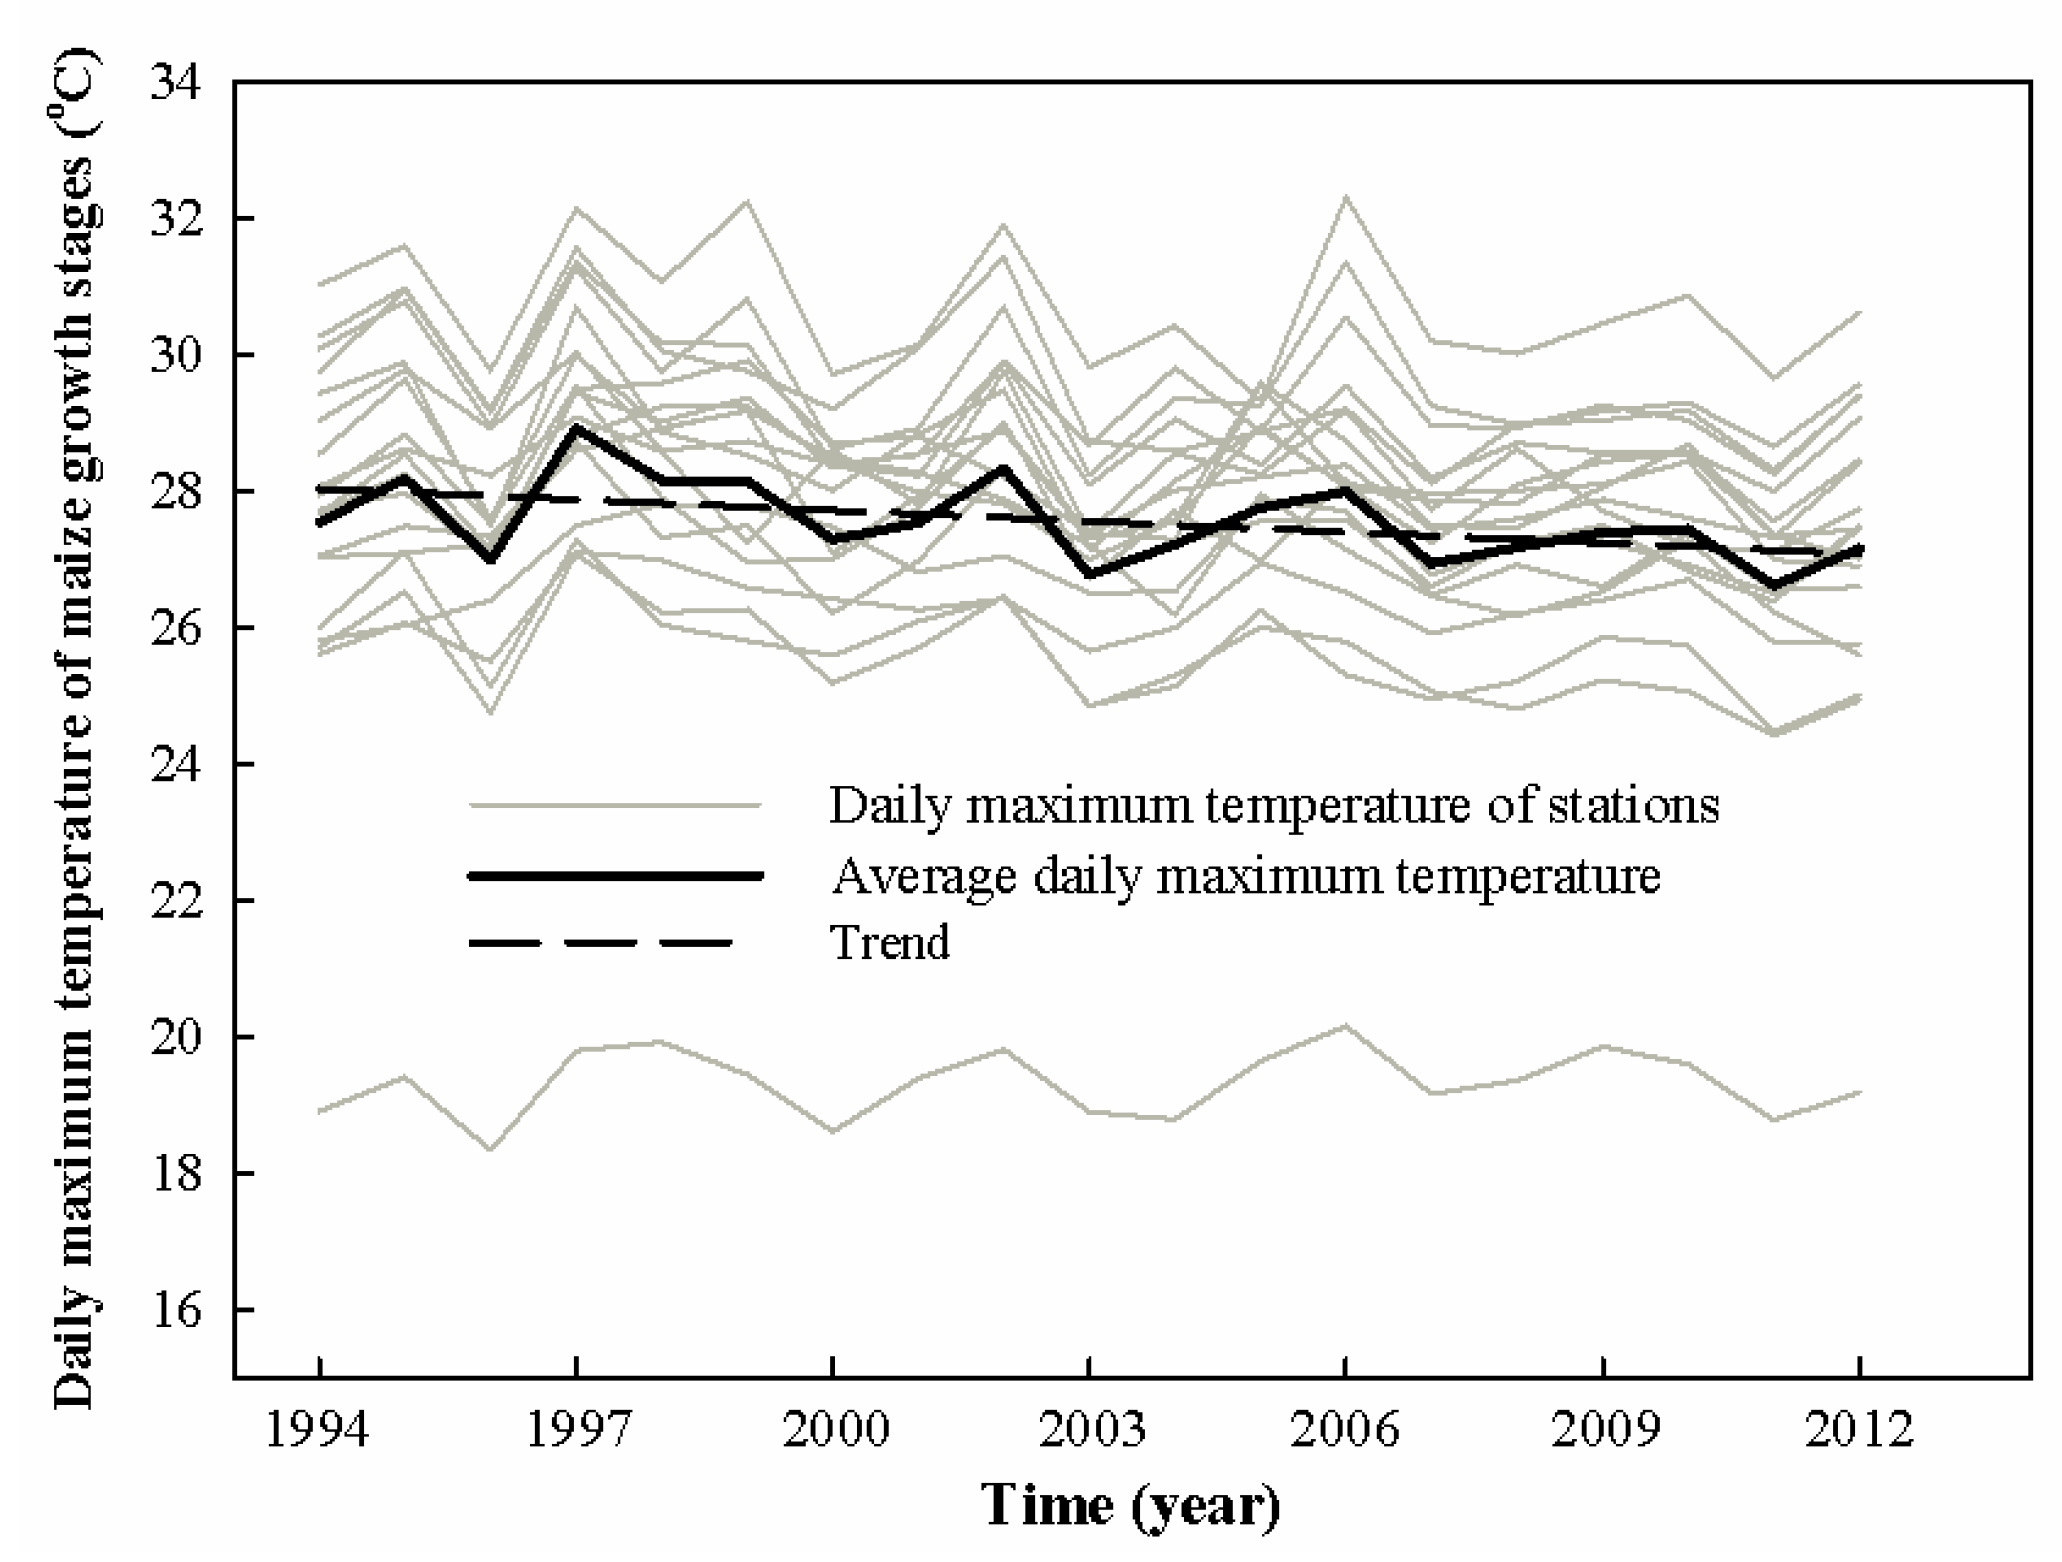
Daily maximum and minimum temperatures and precipitation, the other three forcing variables for CERES-Maize, may also have effects on maize growth. However, we focused only on maximum and minimum temperatures and excluded precipitation in this study, since our study cases all used full irrigation. Figure 4 shows the time-series of the averaged Tmax over the maize growth period for the 19 stations (light gray lines), which all show a declining trend over time. The lowest Tmax was for the HuaShan station where the elevation was 2064.9 m. The averages from these stations decreased by a trend of −0.5 °C/decade (dark thick line). The maximum and minimum trends were −1.1 °C/decade and −0.04 °C/decade, which appeared at the YuLin and WuQi stations, respectively. The trends of minimum temperature for all stations were insignificant (figure not shown).
We selected seven crop experiment stations in the Guanzhong Plain for our study, including DaLi, FengXiang, LinTong, ShangLuo, WeiNan, WuGong, and XianYang stations, due to the availability of detailed long-term observations and field management data for 19 years (1994–2012). Table 5 shows the trends of SSH, maximum and minimum temperature, and precipitation at the seven selected stations for the maize growth period over the study period. For our selected stations, the trend of SSH was from −0.9 to −1.3 h/decade for the period of 1994–2012, all with a p-value of less than 0.05. The trends of Tmax for the seven stations ranged between −0.1 and −1.1 °C/decade, but those for DaLi and WeiNan did not pass the 95% significance test. The minimum temperature was essentially unchanged at all stations, and the change in average temperature was caused by the change in Tmax. The trend of precipitation varied among the seven crop stations (7.7–17 mm/year), while the mean precipitation over the study period ranged from 350 to 450 mm at these stations.

3.3. Analysis of Trends in the Maize Growth Period

For this study, we examined the trends in the phenology and growth period of maize at our selected seven stations. Table 6 shows that the trends that pass the significance test for the phenology and length of each developmental phase were quite randomly distributed. However, the lengths of the entire growth period for all seven stations show an upward trend, all of which passed the significance test. The maximum trend of 14.9 days/decade appeared at ShangLuo, while the minimum trend of 4.8 days/decade was seen at WeiNan.

3.4. Results of Model Calibration and Validation

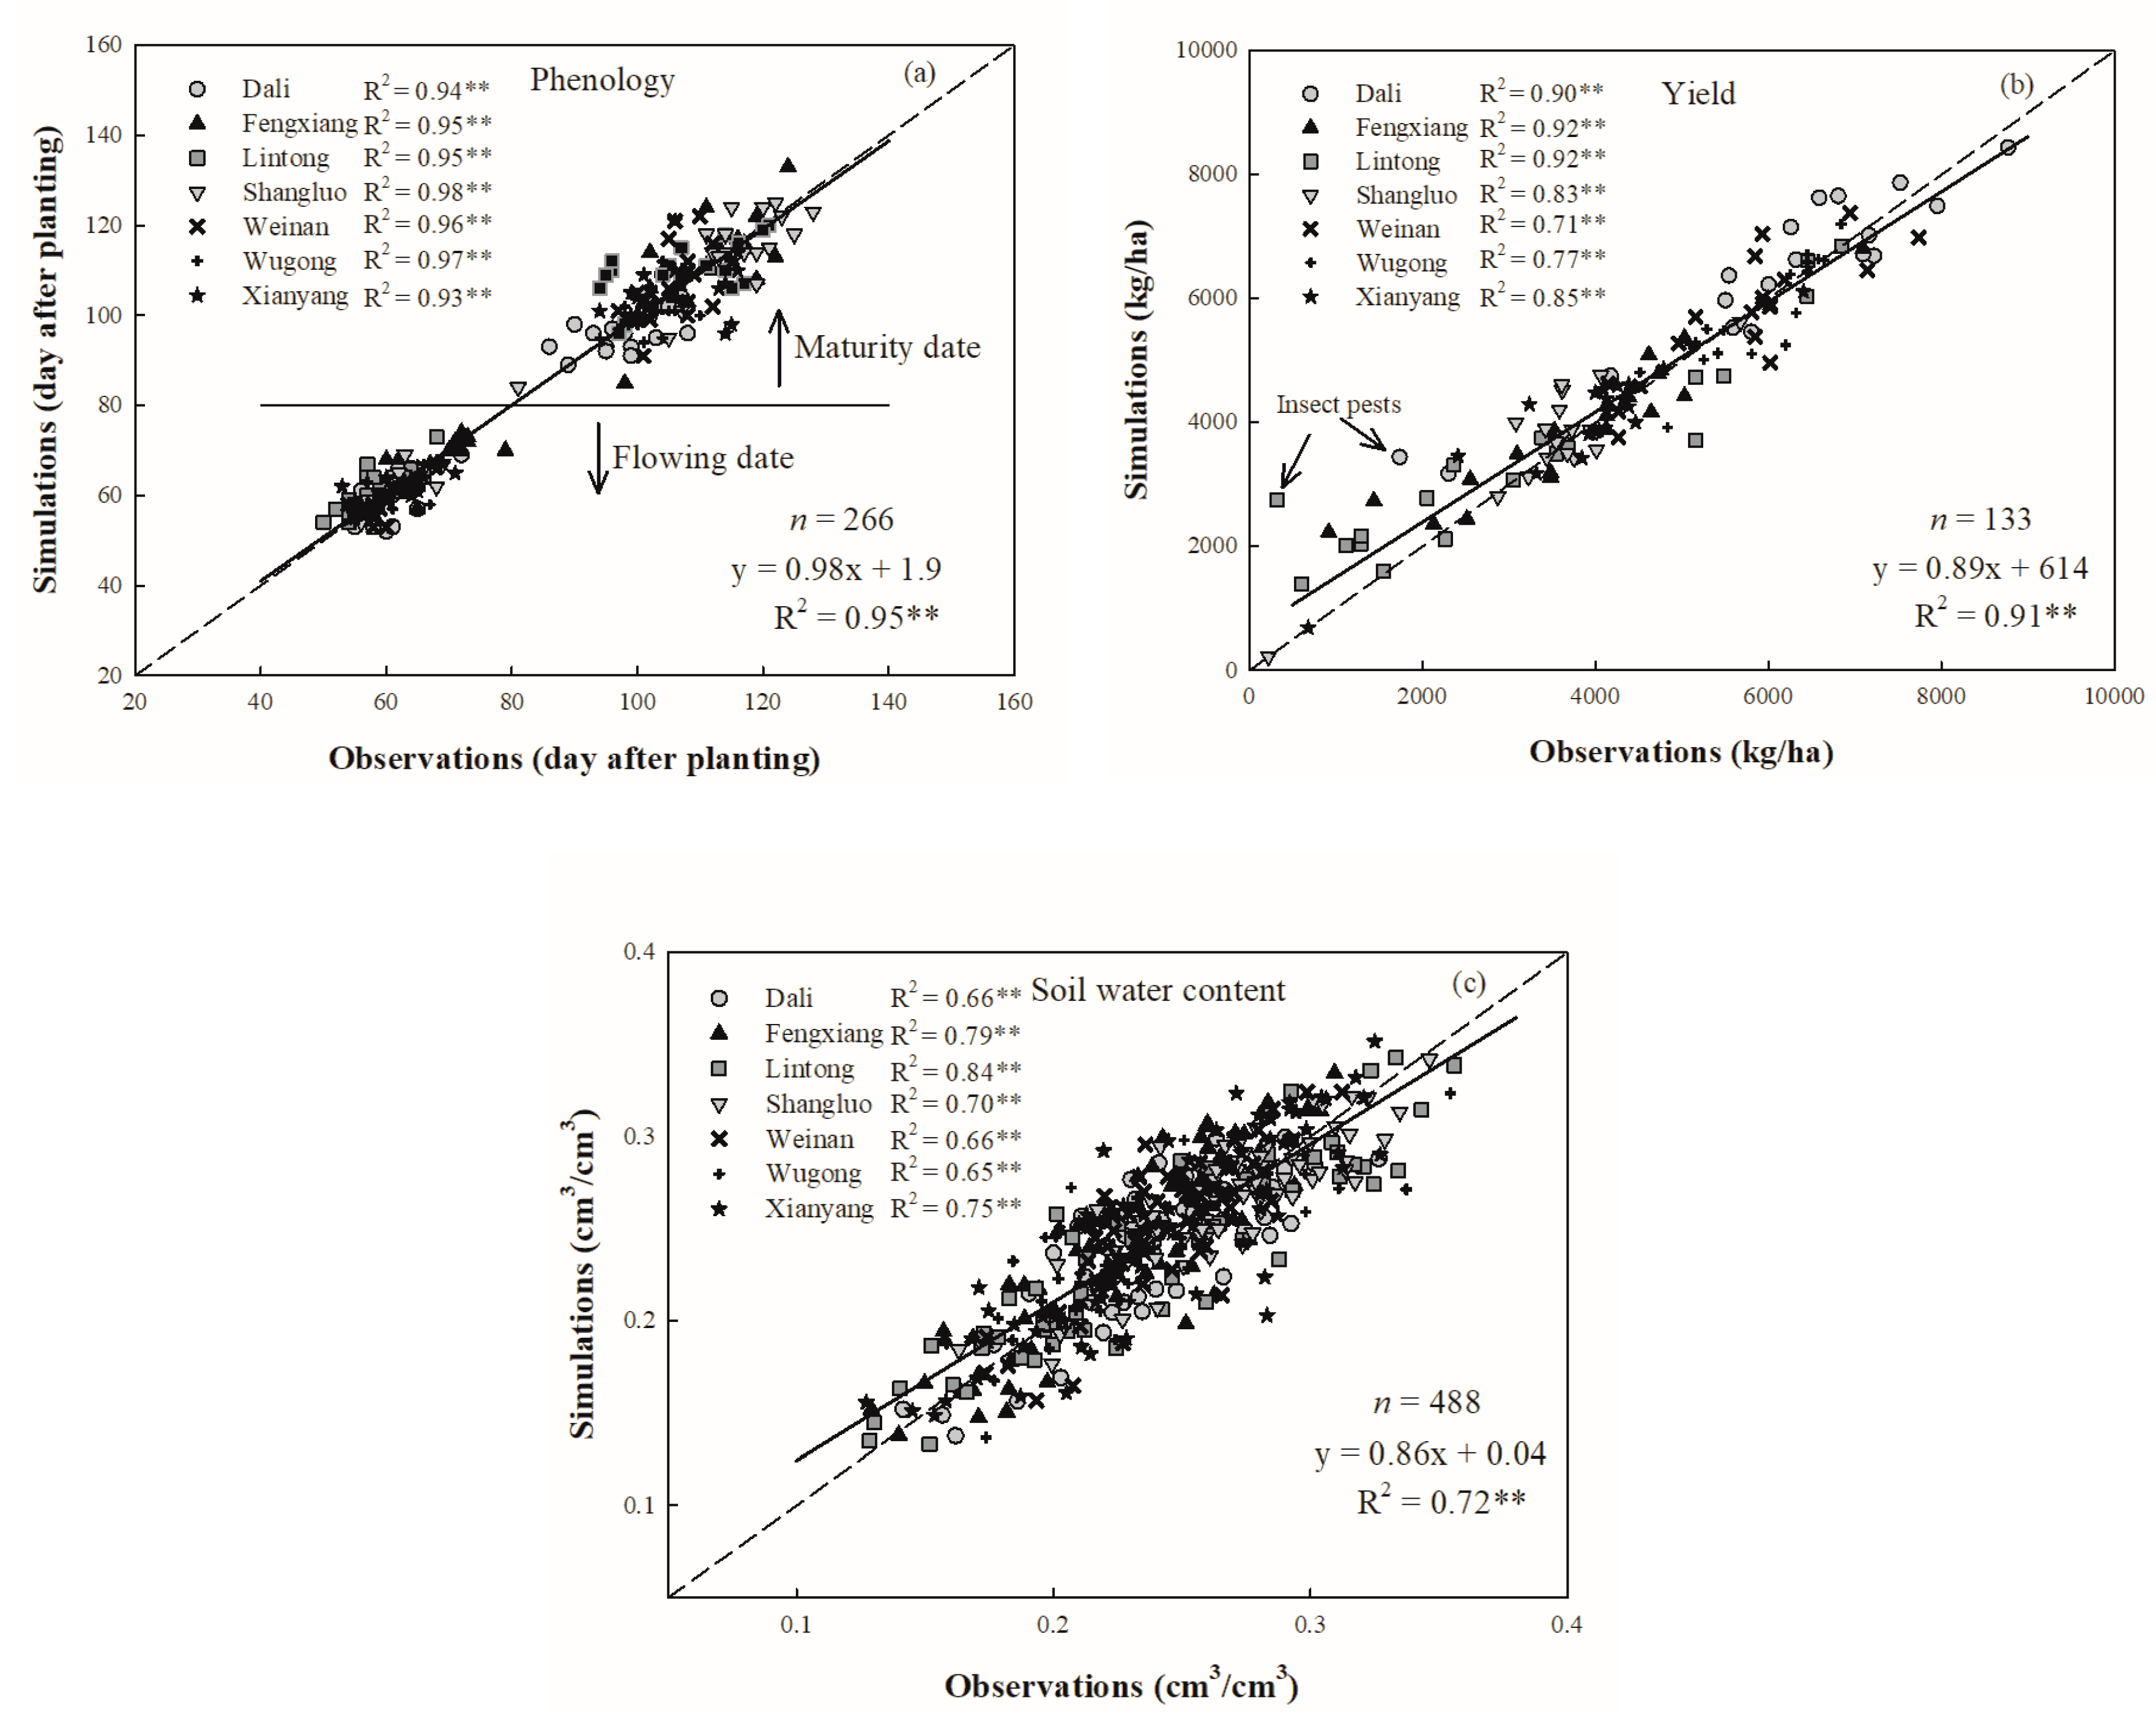
The cultivar parameter and yield results are shown in the Table 7. These parameters are compatible with the cultivar description (website: http://www.chinaseed114.com/seed/26/). The simulations with our calibrated cultivar parameters are shown in Figure 5. The simulations of flowering and maturity date were very close to the corresponding observations, and their coefficients for all seven stations were above 0.9 (Figure 5a). The simulations of yield were very close to the corresponding observations in each year at each station, except for DaLi and LinTong stations in 1994 (Figure 5b). Due to a serious pest outbreak at DaLi and LinTong in that year, the record was not detailed enough. Such a pest effect was not included in our simulations with CERES-Maize. Thus, a large gap between observations and simulations is seen for those two stations in 1994 (Figure 5b insect pest points). Furthermore, we also evaluated the soil water content simulations. Figure 5c shows the soil water content simulations compared against observations, and the coefficients for the seven stations range from 0.64 to 0.85, all of which pass the 99% significance level.

3.5. The Cultivars and Cultivar Parameter Change

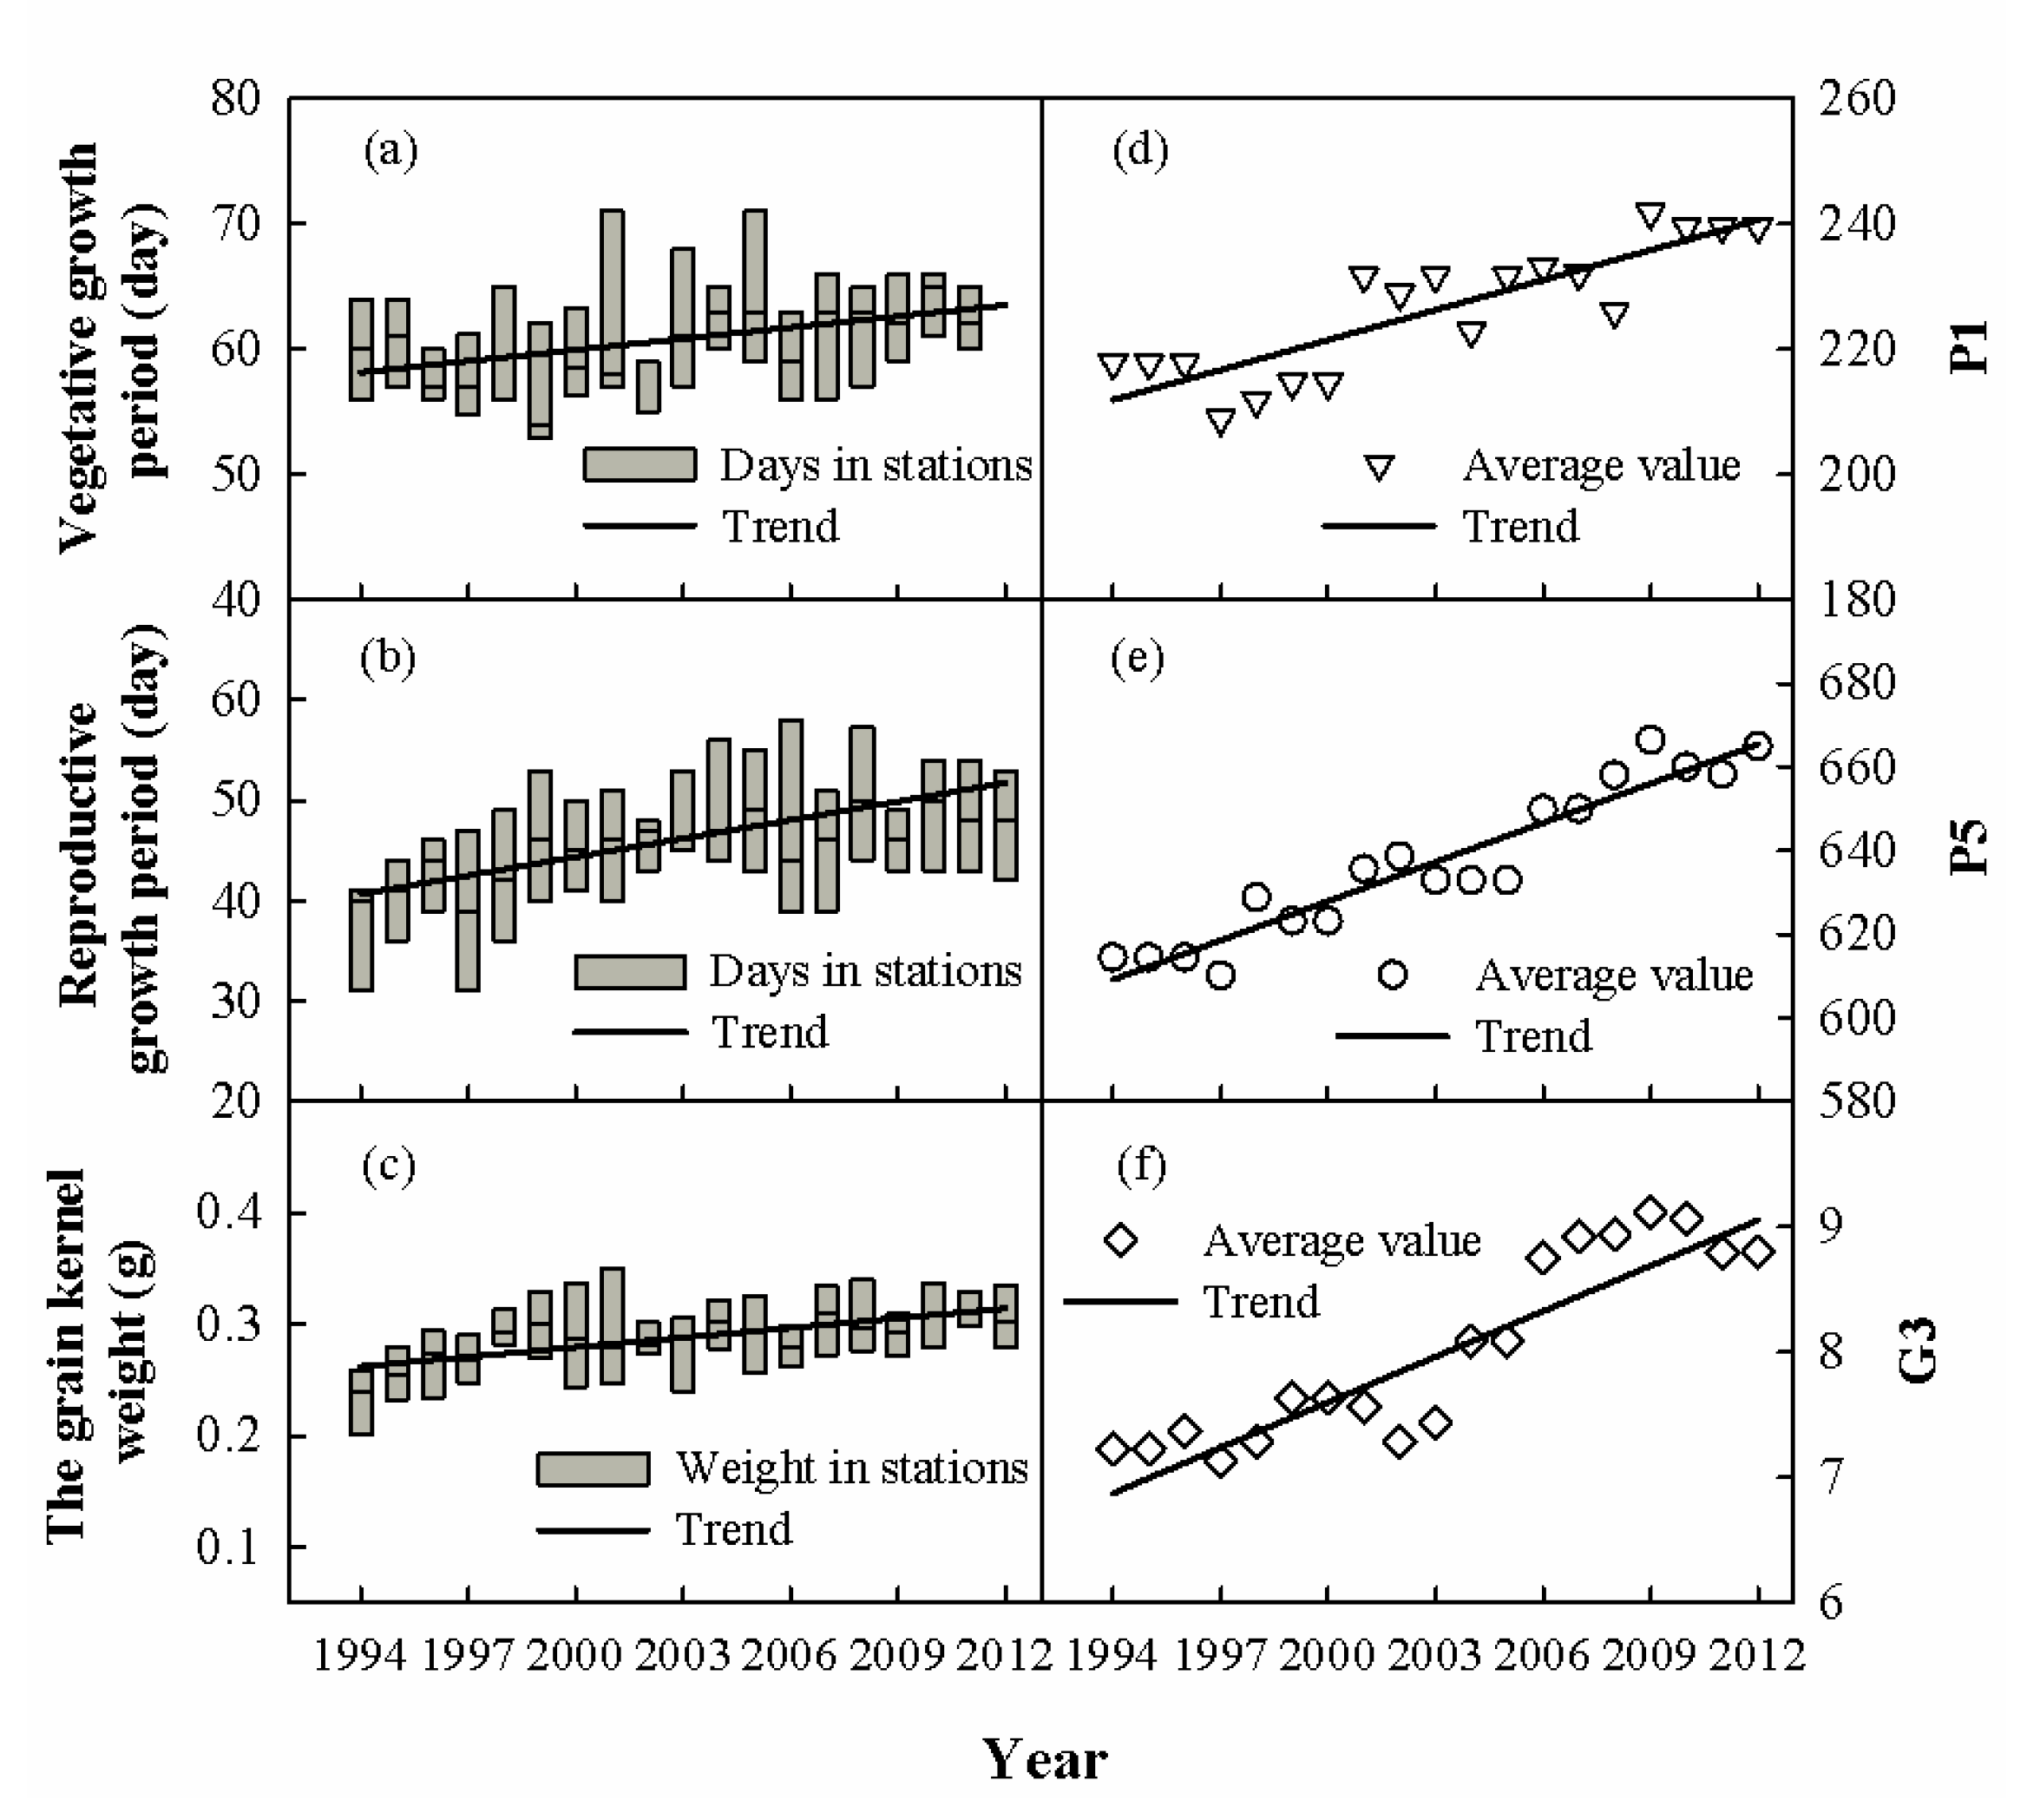
Cultivar replacement is a way to adapt to changes in environmental conditions such as climate change, and increase crop yield [50,51,55,56,70,71], as shown in Table 6. Our optimized cultivar parameters show significant changes, which are consistent with the cultivar observations. Figure 6 indicates that three cultivar parameters (P1, P5, and G3) had significant upward trends over our study period, corresponding to extended growth periods and heavier kernel weight. The latter led directly to a yield increase. The other three cultivar parameters (P2, G2, and PHINT) did not show similar changes over the same period, implying that these parameters were insensitive to cultivar selection.

3.6. Maize Yield Affected by Climate and Cultivar

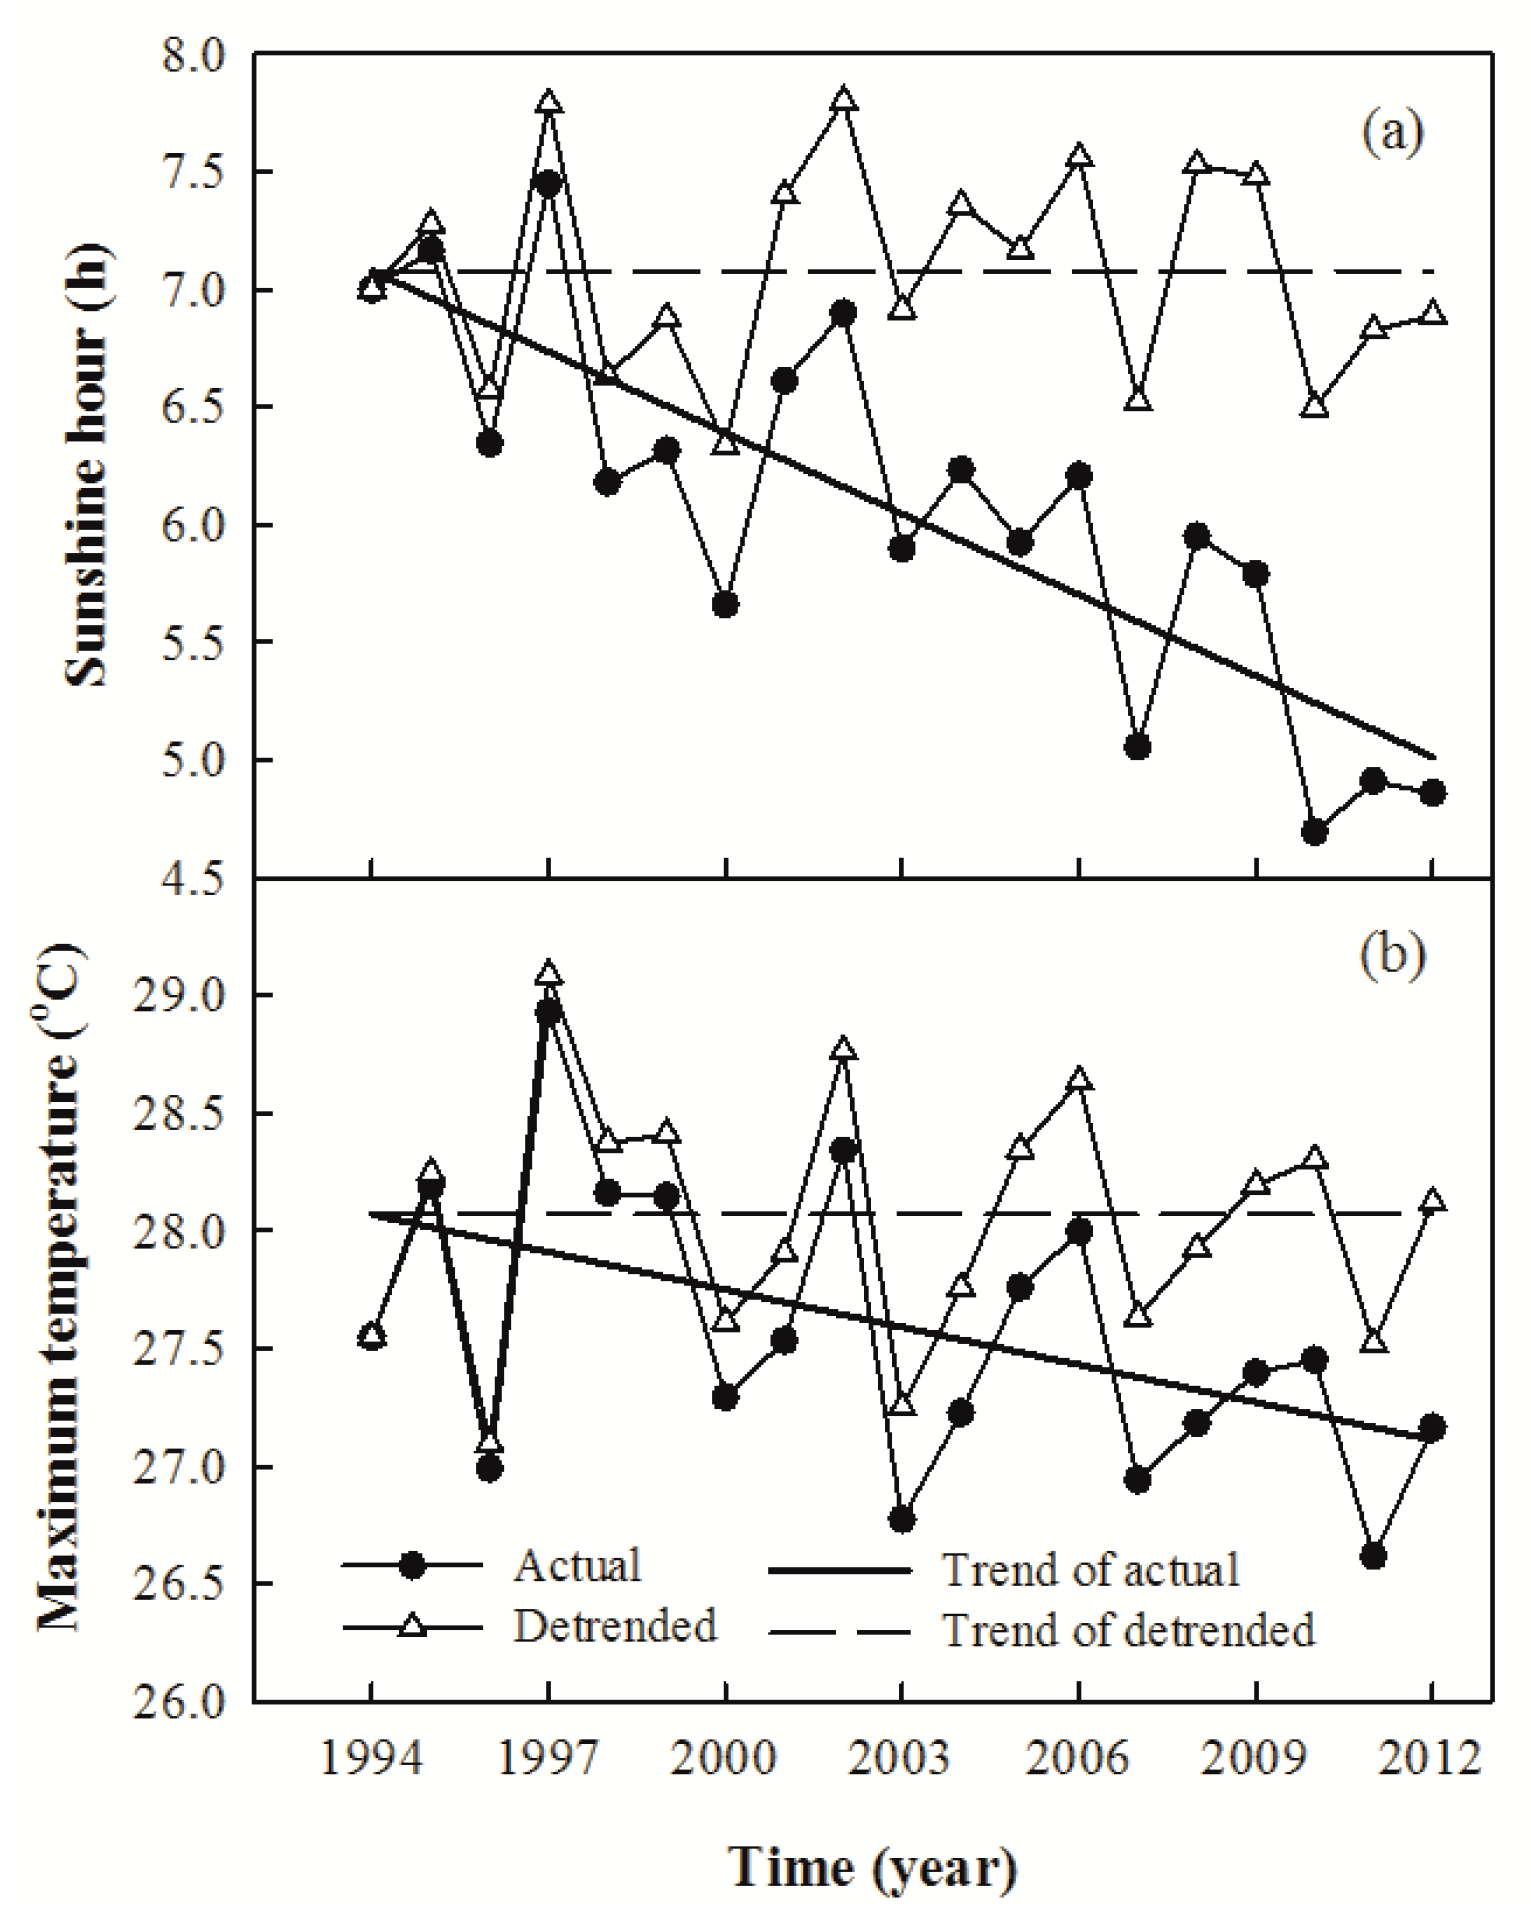
To further understand how a decline in SSH and Tmax affect maize yield, we removed the trends of SSH and Tmax over the maize growth stage for the seven crop stations, respectively. Figure 7 shows the averaged SSH and Tmax over those stations with and without the trend. In this figure, we can see that the averaged SSH changed from about seven hours to about five hours for the maize growth stage over the period of 1994–2012, while Tmax decreased by about 1 °C over the same period. Without the trends, the averaged SSH fluctuated around 7.1 h, and the averaged Tmax varies around the 28.1 degree level.
For this study, we performed our simulations again with the new SSH and Tmax data without the long-term trend to simulate maize yield for our seven selected stations. We also conducted a simulation using only the cultivar for 1994 throughout the whole 19-year simulation period. By comparing these new simulations with our original modeling results, we quantified the contributions of cultivar selection and the reduction in temperature and SSH to the yield increase (Figure 8). In Figure 8, we can see that the cultivar changes and decline in Tmax increased the maize yield quite significantly over our study period, while the decline in SSH reduced the maize yield over the same period. The changes in annual yield due to changes in temperature, cultivar, and SSH were 25, 81, and −51 kg/ha/year, respectively. Compared with that for 1994, the averaged yield for 2012 increased by 498 and 1747 kg/ha due to the respective changes in temperature and cultivar and decreased by 857 kg/ha due to the SSH reduction. The averaged yield increased by 5% and 25% due to the temperature changes and cultivar replacement, respectively, and decreased by 8% due to the SSH reduction at these stations during 1994–2012.
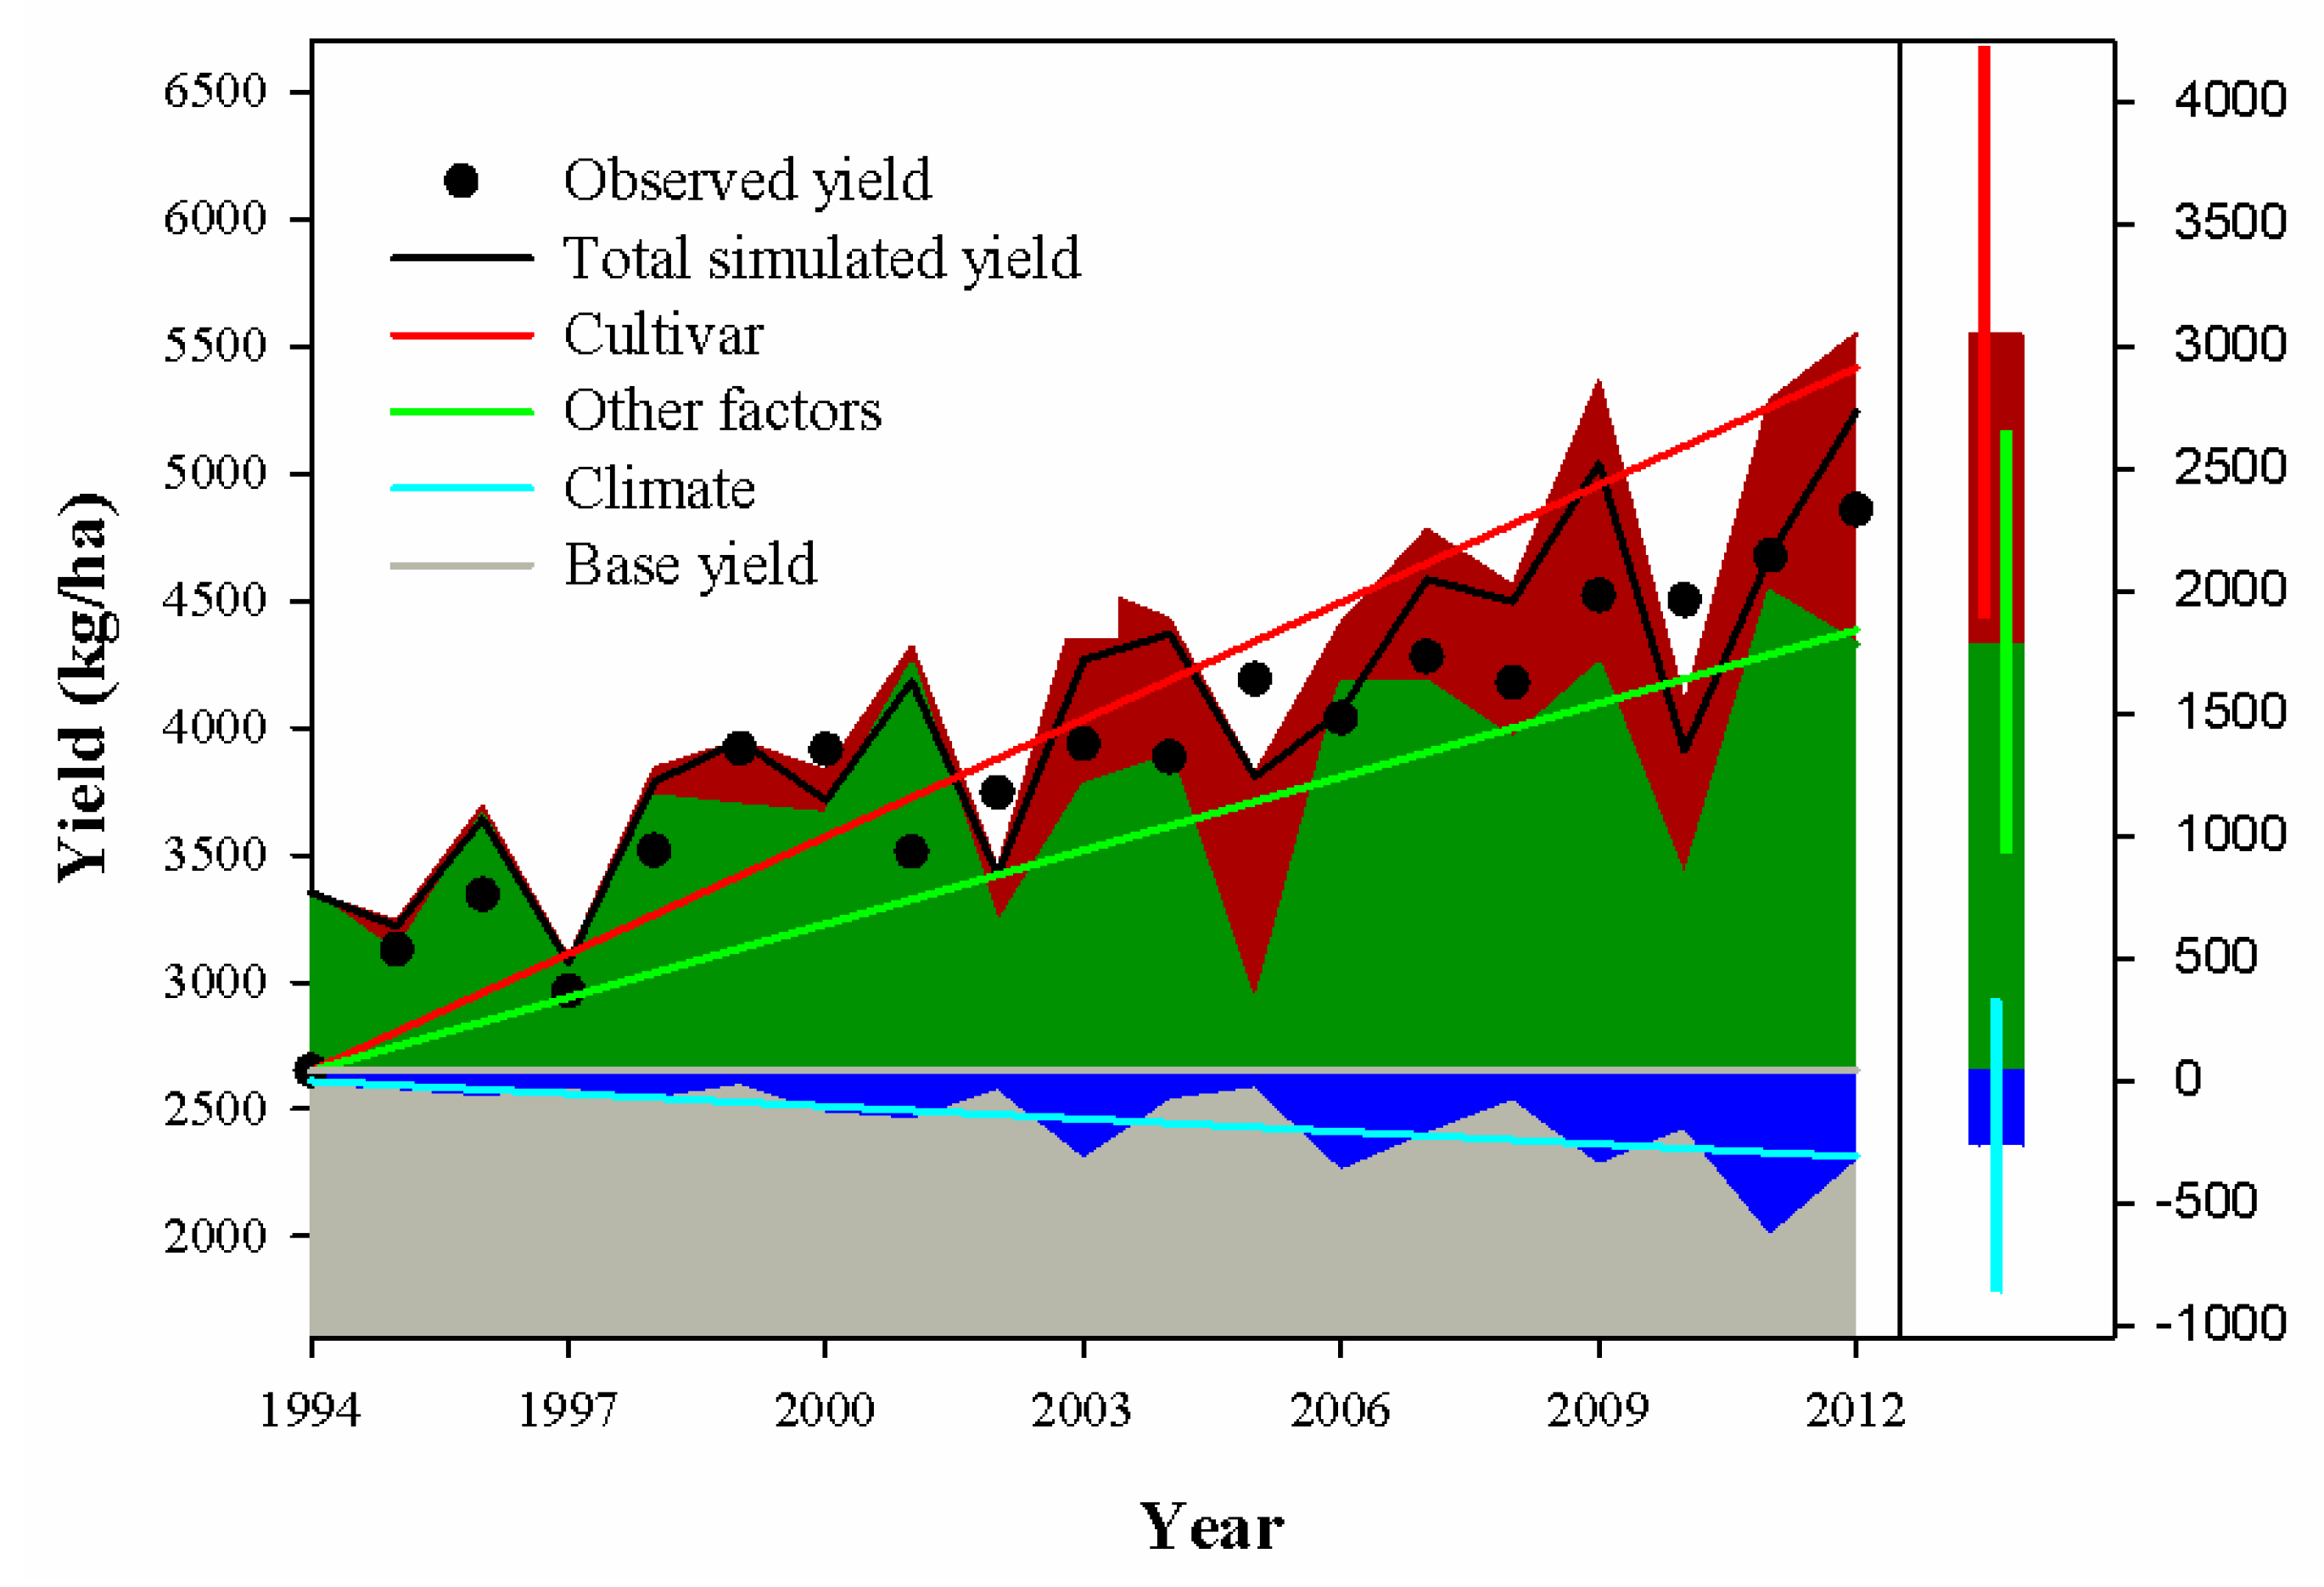
We used a representative cultivar in each year to simulate maize yield for all 19 stations across the study area. Figure 9 shows the simulated yields averaged over those stations for the period of 1994–2012 against observations. The trend of observed yield was 988 kg/ha per decade, while the trend of the simulated total yield was 882 kg/ha per decade, indicating that the model accurately reproduced the observations. Climate change (the SSH and Tmax reductions) had a negative contribution to the total yield. The Tmax and SSH trends together accounted for a downward yield trend of −201 kg/ha per decade, reducing the trend of the total simulated yield by 28%. The cultivar replacement accounted for a yield trend of 588 kg/ha per decade, contributing to 67% of the total simulated trend (Figure 9). Therefore, although cultivar replacement is a dominant factor increasing the maize yield in our study region, the negative effects of climate change could not be neglected.
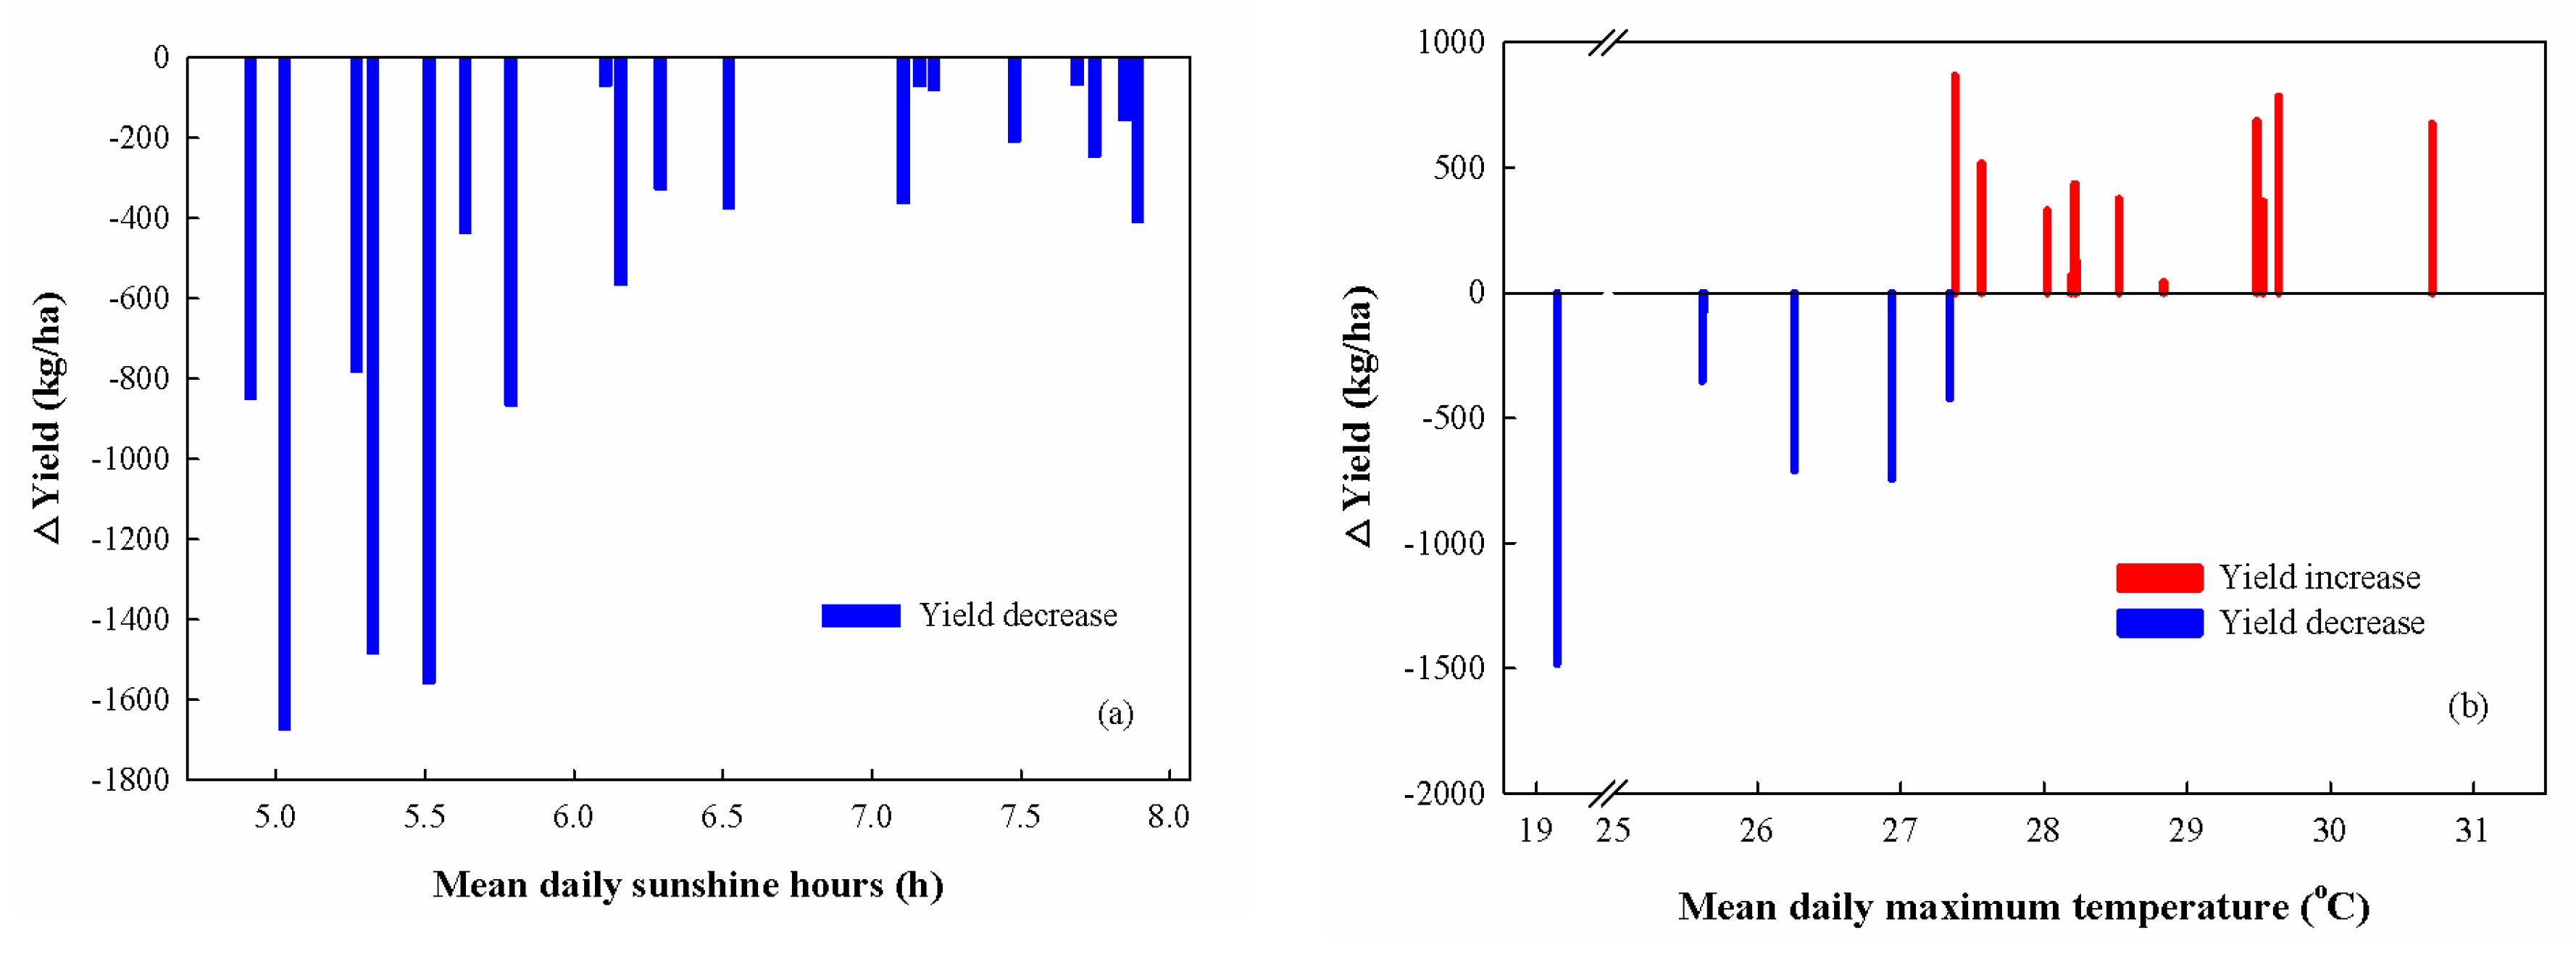
In this study, different climate change trends affected the maize yield differently across all our study stations. The yield reduction ranged from 67 to 1674 kg/ha due to SSH varying from 4.9 to 7.9 h, with a similar downward trend for all stations (Figure 10a). Generally, the larger yield reduction corresponded to shorter daily SSH and vice versa. For shorter SSH, solar radiation may be a limiting factor in photosynthesis, and even a small decrease in SSH could have a remarkably adverse effect on the maize yield (Figure 10a). For longer SSH, solar radiation might not restrict photosynthesis. Thus, the effect of a small decrease in SSH on the yield is sometimes minor.
As aforementioned, the Tmax reduction increased the mean maize yield over the 19 study stations for the period of 1994–2012. However, our detailed analysis indicated that the yield decreased over six stations due to the Tmax reduction (Figure 10b), where Tmax was equal to or lower than 27.3 °C. When Tmax was above this temperature, the yield increased due to the reduction in Tmax over the rest of the 13 stations. No matter which situation occurred, the reduction in Tmax decreased the thermal time, tending to lower the yield. Hence, the increase or decrease in the final yield was determined by temperature stress. For lower Tmax (≤27.3 °C), the daily mean temperature was unable to reach the lower boundary of the temperature triggering heat stress (33.0 °C in CERES-Maize), and a decrease in Tmax did not have an impact on the yield. Thus, we see a reduction in the final yield. Meanwhile, for higher Tmax (>27.4 °C), the daily mean temperature often surpassed the heat stress threshold temperature, lowering the yield. A decrease in Tmax tended to alleviate the heat stress, increasing the yield. In this study, we can see that the alleviation of heat stress played a more important role in affecting the maize yield than the reduction in thermal time, and both were caused by the decrease in Tmax. Therefore, an increase in yield was seen for the reduction in the higher Tmax. The generic criterion to distinguish between a lower and a higher Tmax still needs to be determined with a larger dataset.
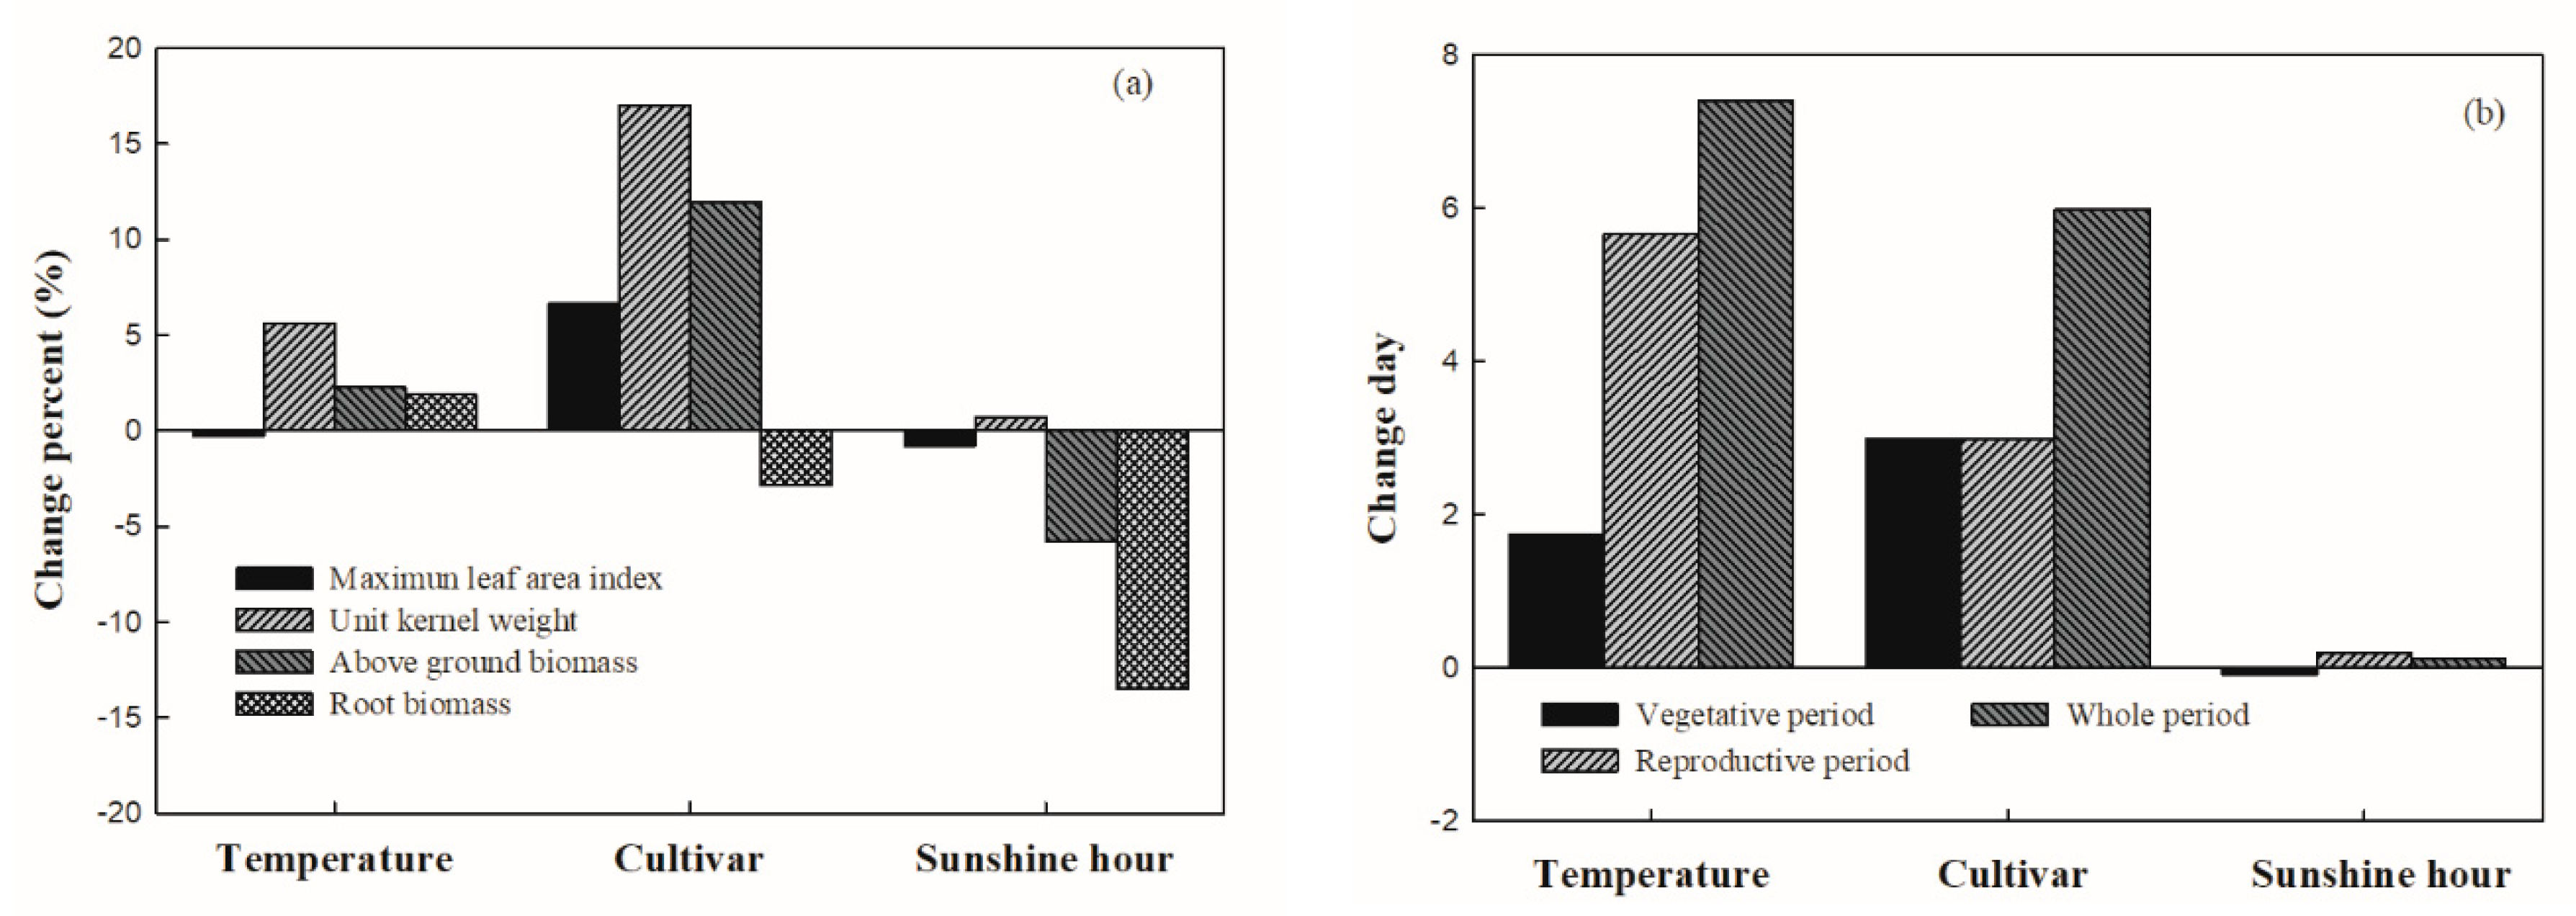
Moreover, we explored the reasons for the yield changes caused by the above three variables. Figure 11a shows the difference in the maximum leaf area index, kernel weight, aboveground biomass, and root biomass between the original and detrended simulations. We can see that kernel weight had the largest increase under the Tmax decline and cultivar replacement, while root biomass declined the most due to the SSH reduction. The decrease in Tmax more significantly prolonged the reproductive period than the vegetative period (Figure 11b), leading to an increase in kernel weight. Since the grain number (G2) did not show a meaningful change, the yield increases were due mostly to the kernel weight increase. When compared with the prior cultivars, the replaced cultivars usually had a longer growth period and kernel weight. Yield increase with cultivar replacement accounted for 30% due to a longer growth period and 70% due to heavier kernel weight based on our two additional tests (fixed phenology or kernel weight parameters, data and figure not shown).
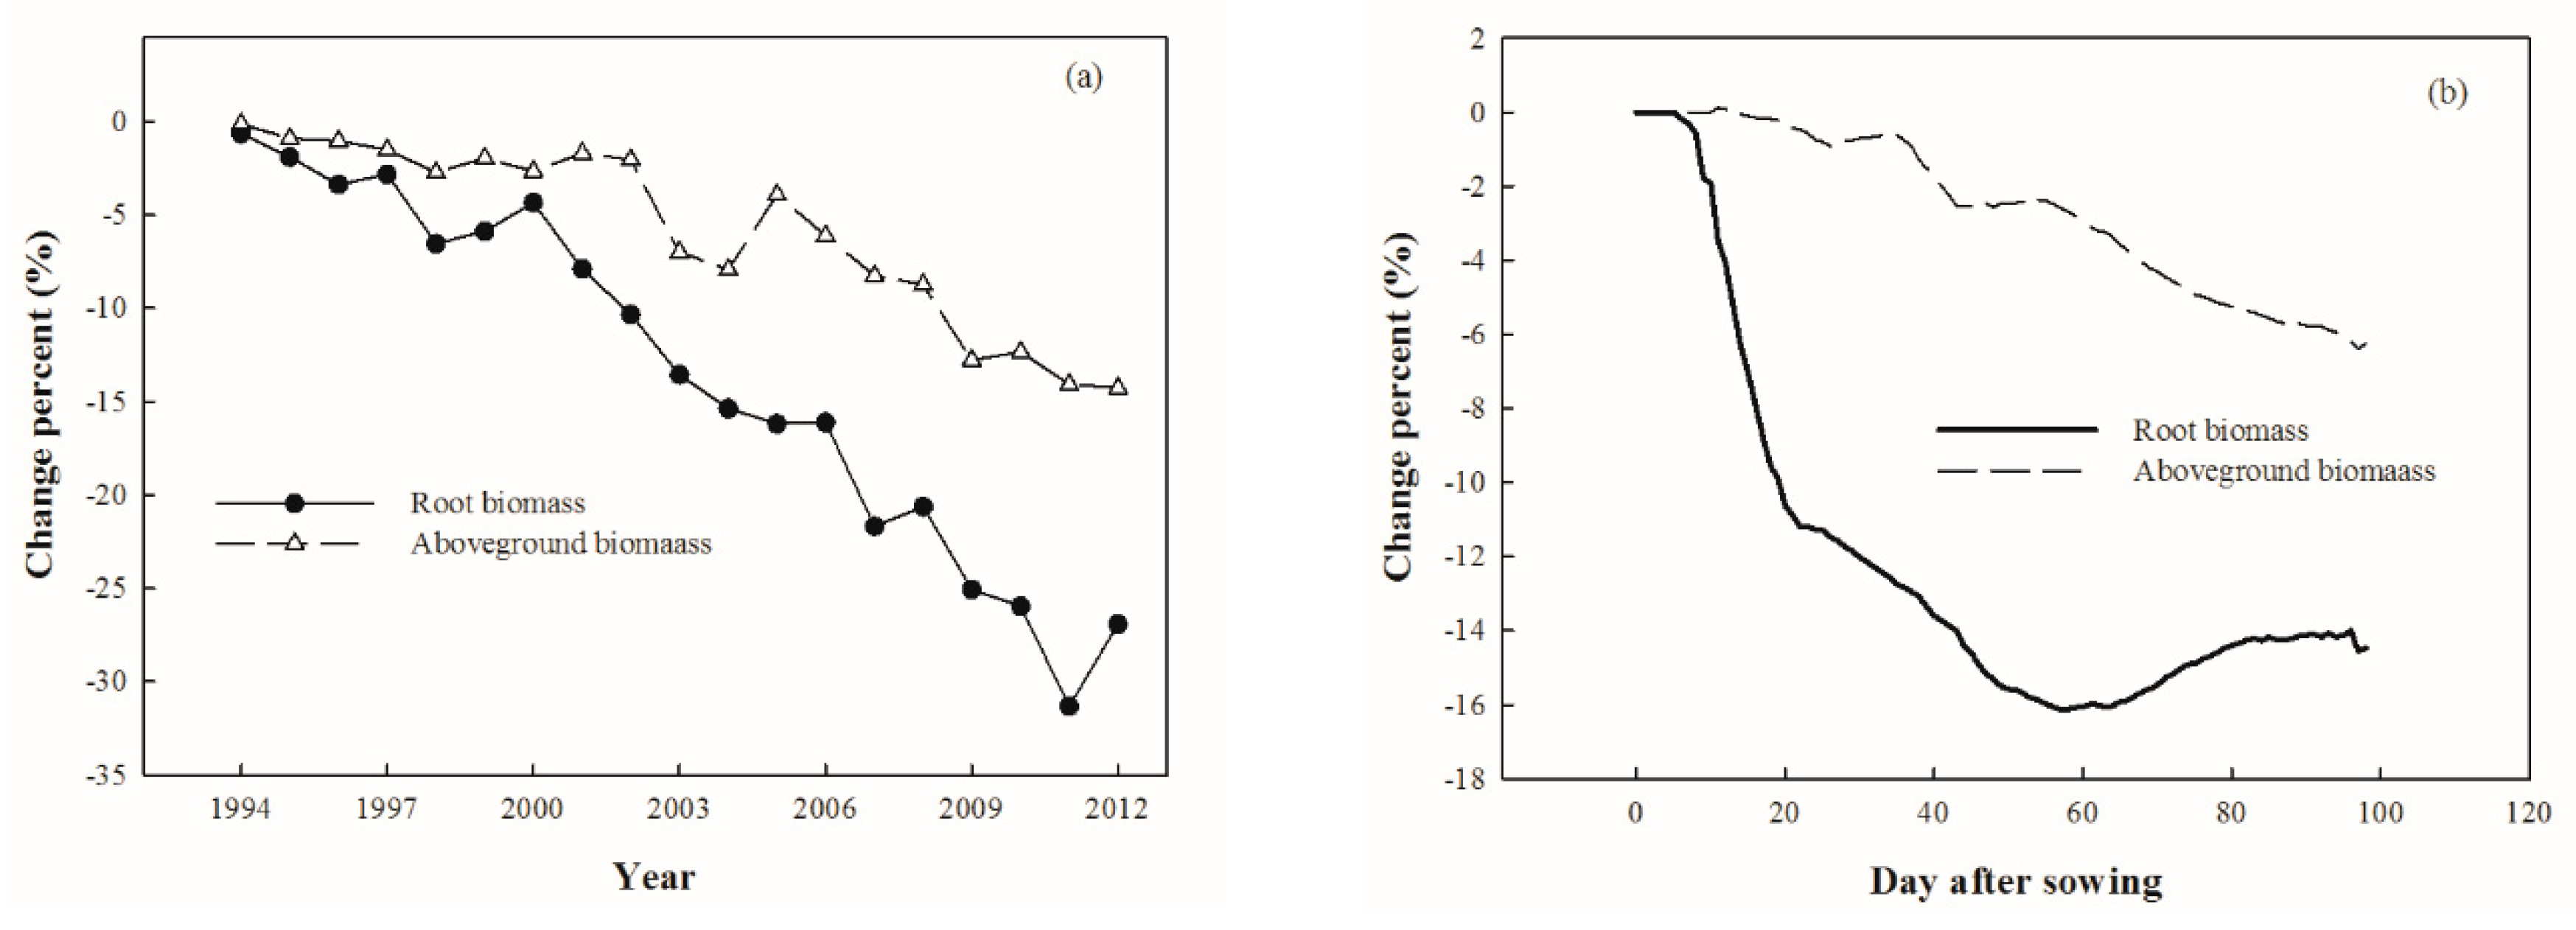
To further understand how declining SSH reduces root biomass and yield, the annual and seasonal time series of the root biomass and aboveground biomass are included in Figure 12. We can see that the difference in root biomass between the simulations with and without the SSH trend was remarkably larger than that in aboveground biomass. Starting from 10 days after planting, the difference in root biomass dramatically decreased, while the aboveground biomass difference had a much gentler decrease at both seasonal and long-term scales. As we know, maize develops its roots in the early seedling stage, and the growth of maize roots is very sensitive to the external environment during this period [72,73], when less photosynthesis leads to a decrease in root mass, beginning with less sunshine. Decreased root mass in the early growth stage greatly hinders the development of aboveground biomass during the later growth period due to weaker water and nutrient absorption.

3.7. Causes of SSH Trends

It is believed that the downward trend of SSH is largely caused by the increases in cloud cover and manmade aerosols [74,75]. In this study as illustrated in Figure 4, the decline in SSH was highest during the summer while it is lowest during the winter. In the meanwhile, the manmade aerosol emission was strongest during the winter and weakest during the summer [76,77,78,79]. Therefore, we believe that the increase in cloud cover was most likely a strong reason for the SSH decline.
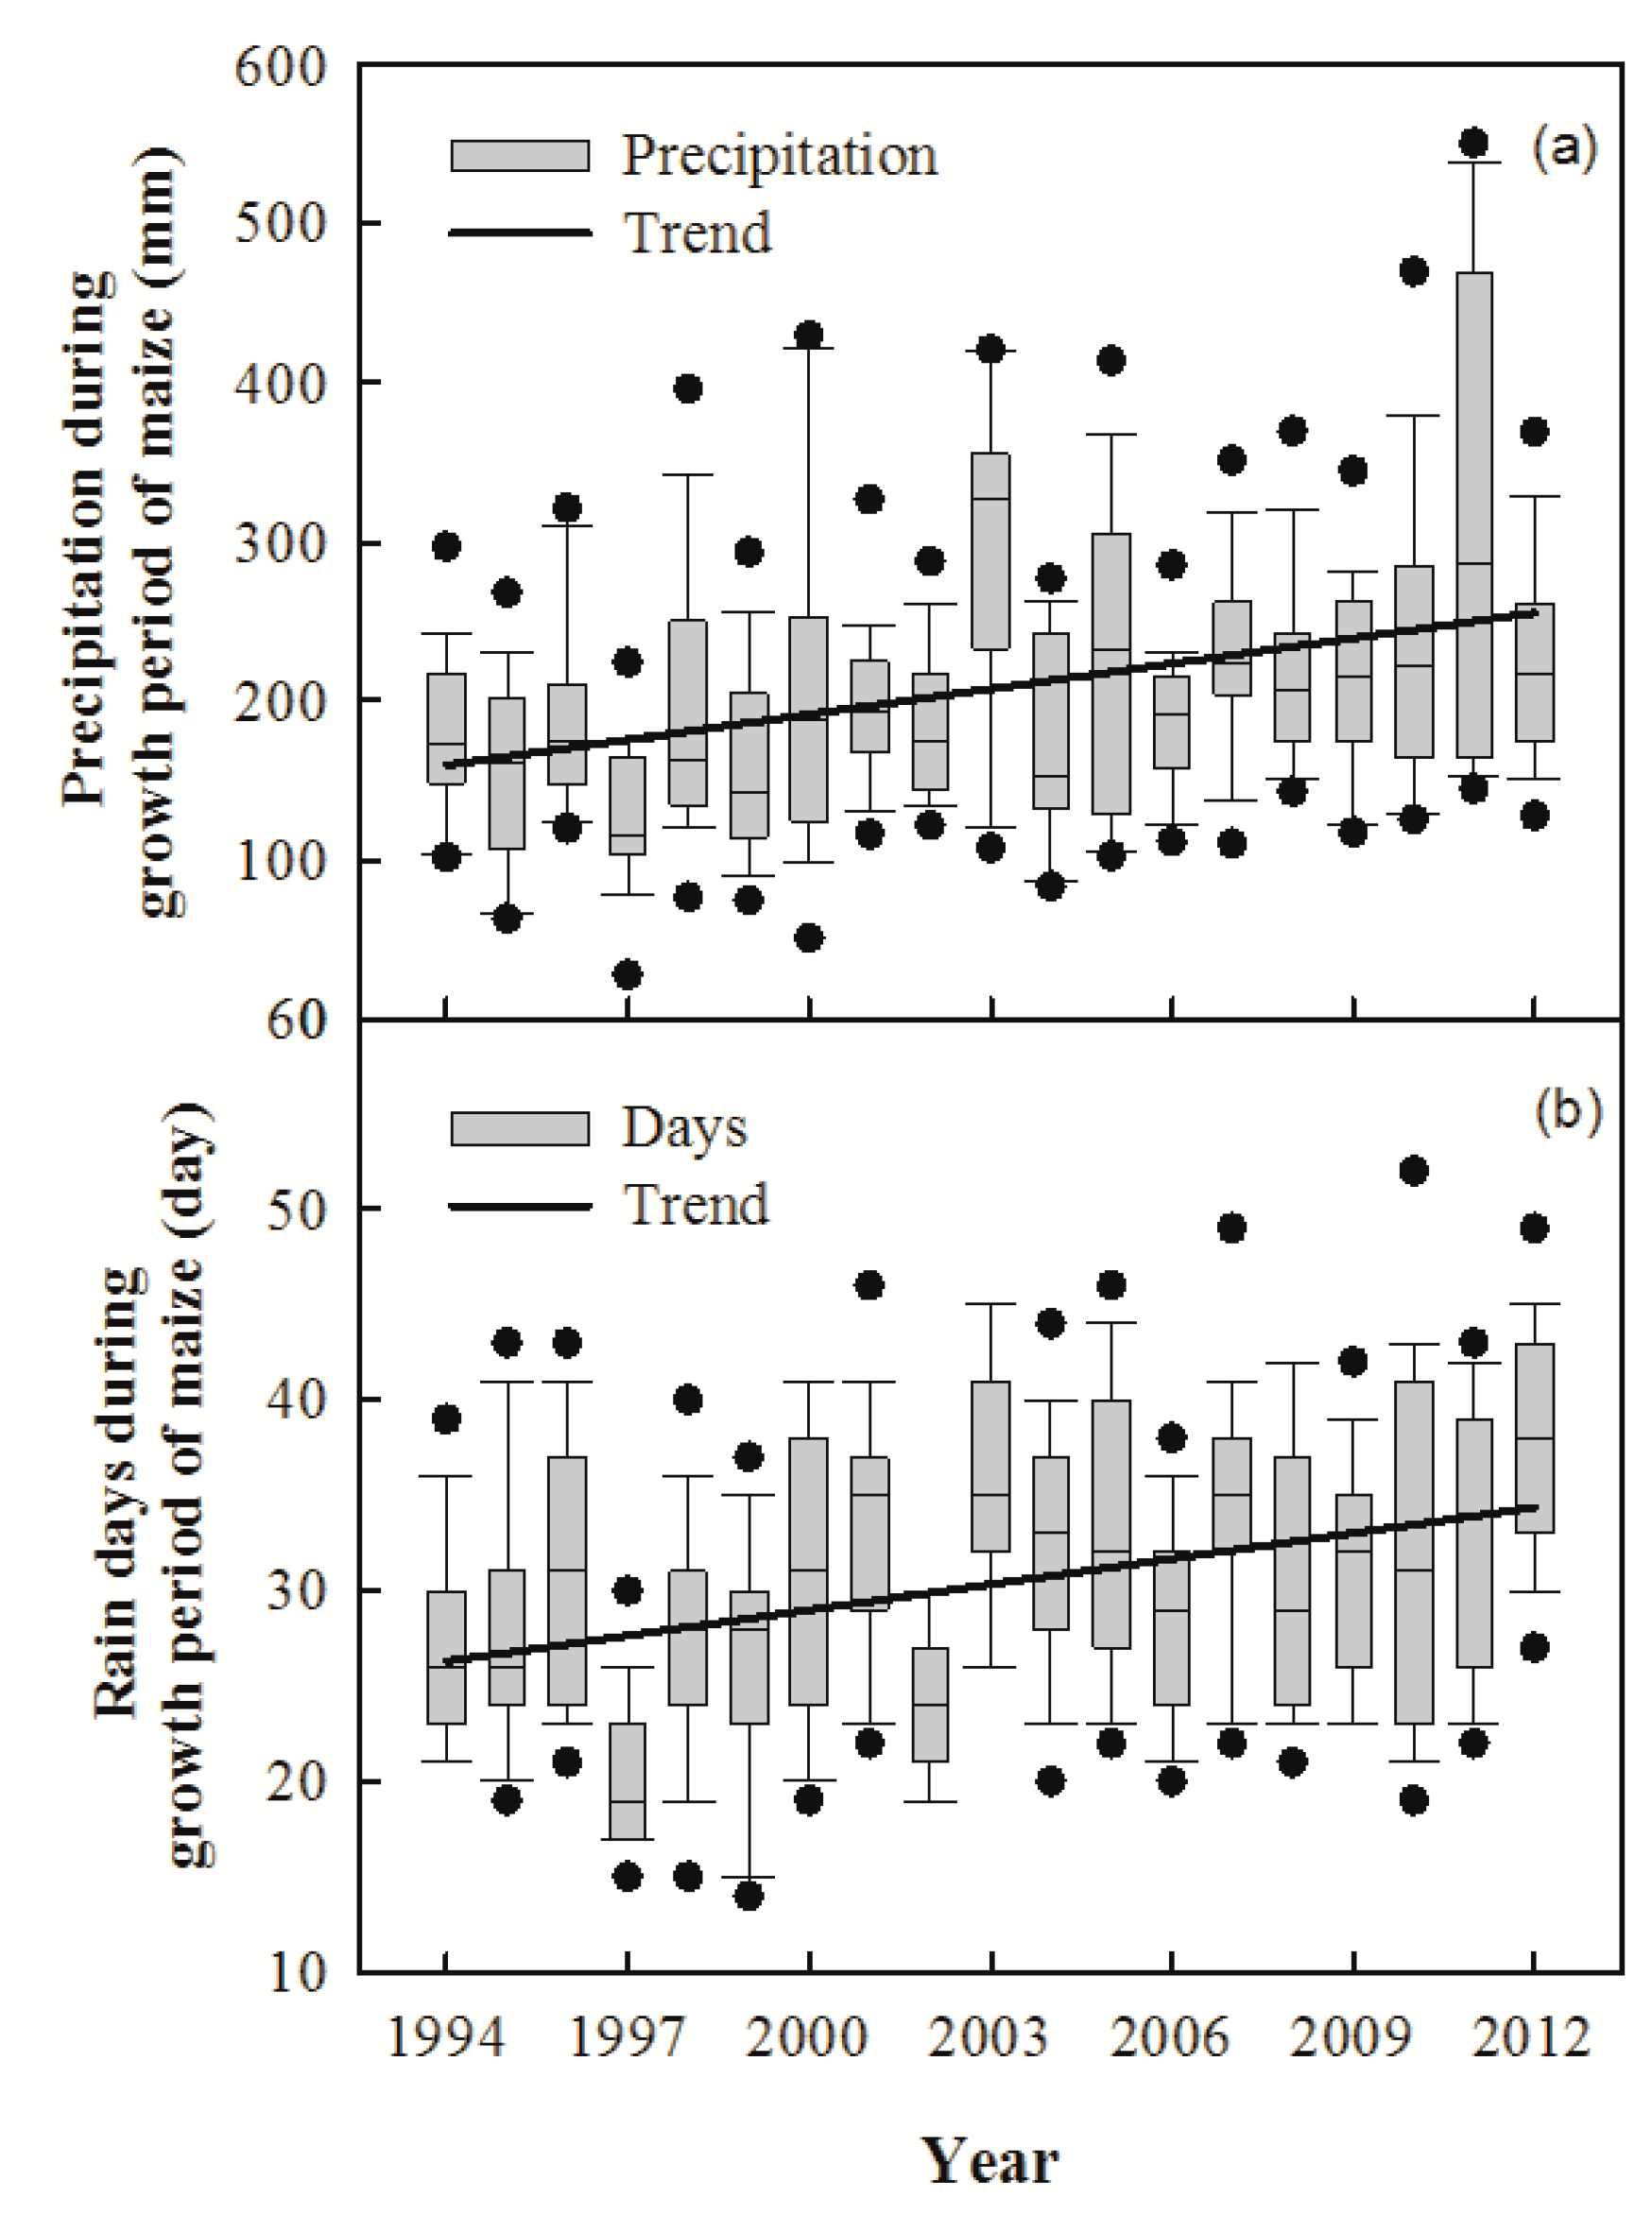
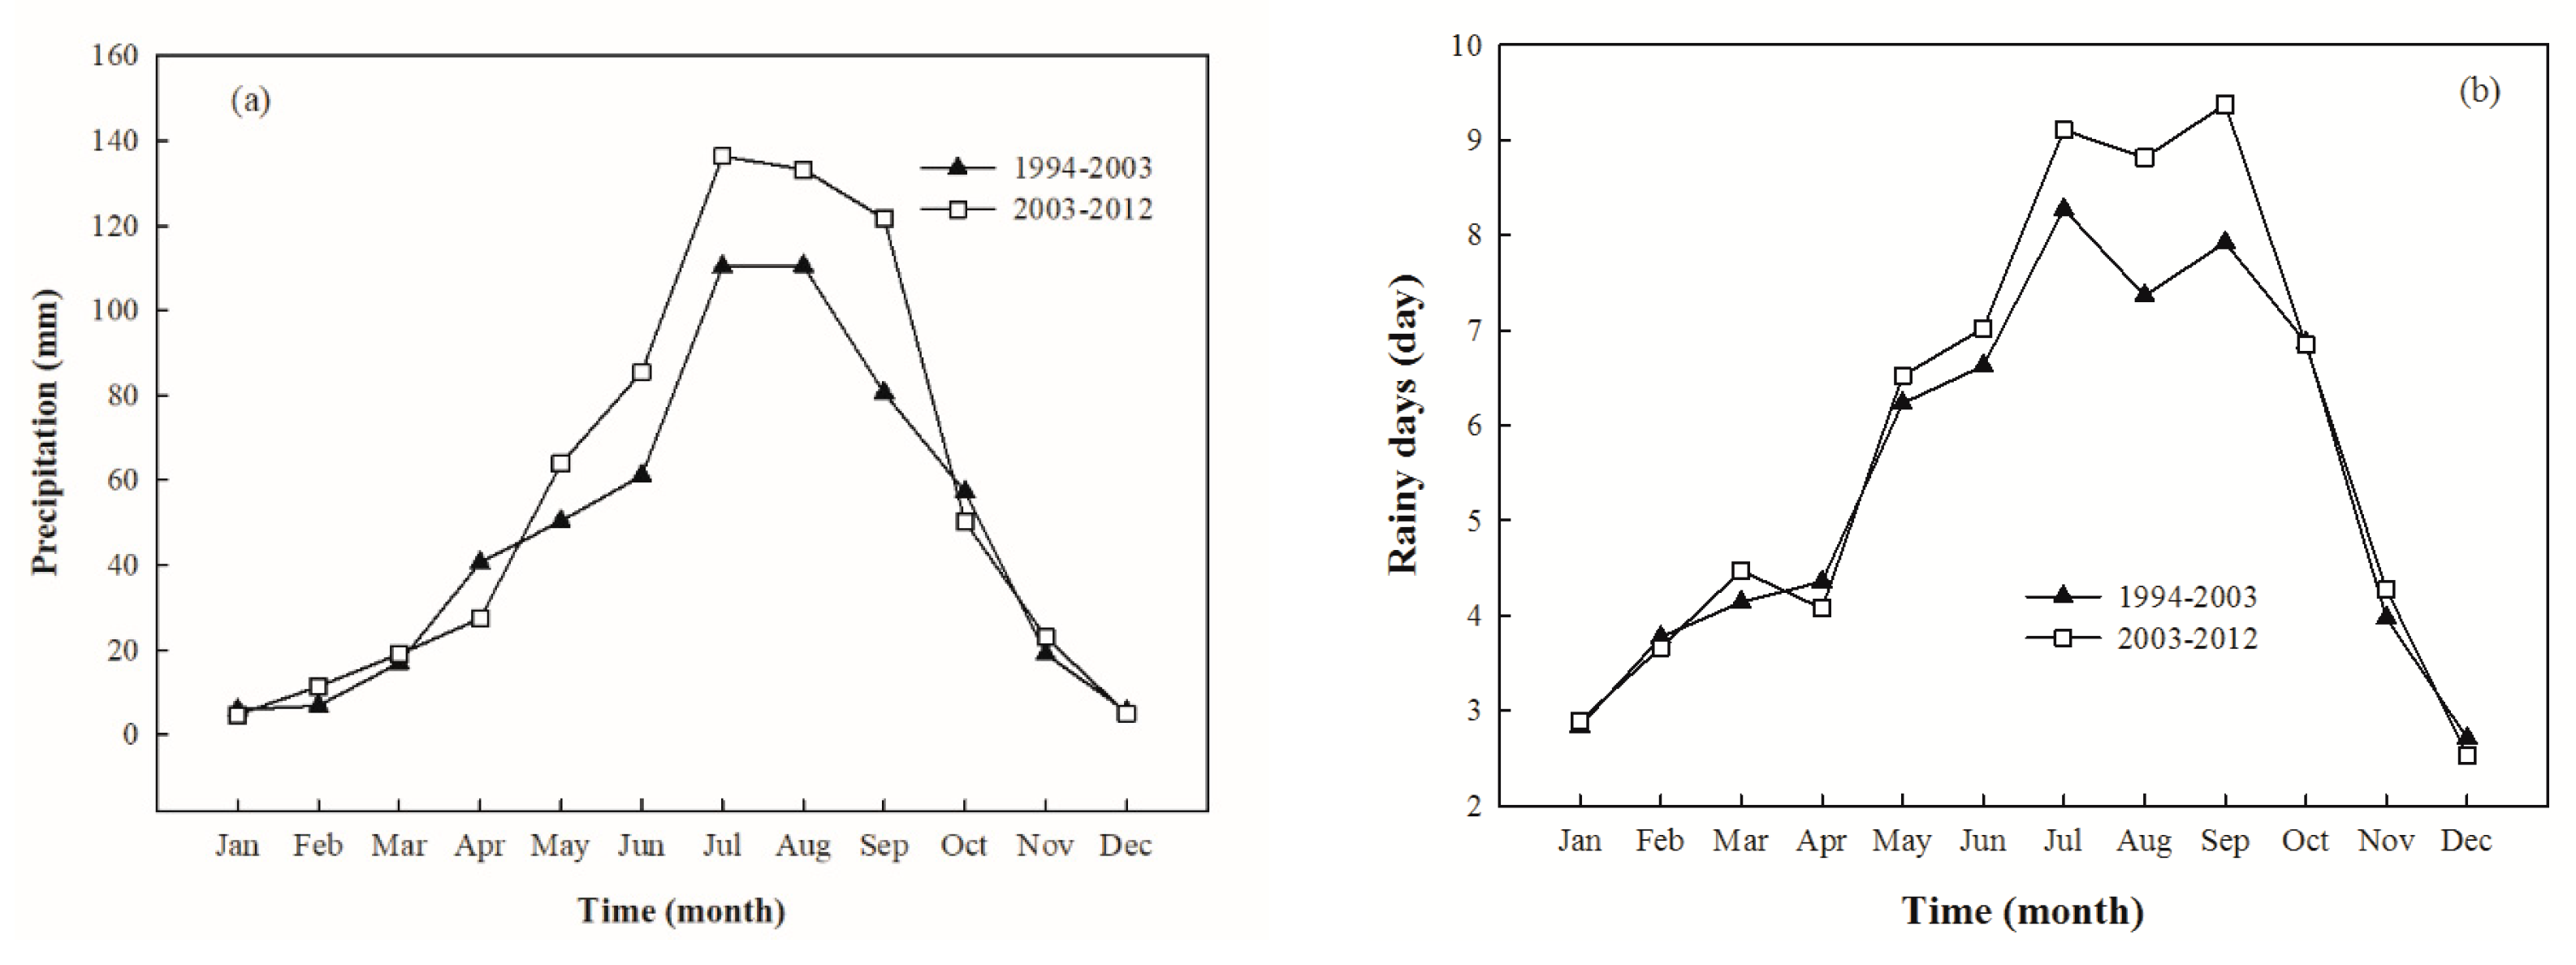
To further understand the reason for the decrease in SSH, we analyzed precipitation and rainy days for the summer maize growth period (June to September) over 1994–2012 (Figure 13). There is a general rising trend of 85.5 mm/decade and 4.5 day/decade in precipitation and rainy days, respectively, during the summer maize growth period. The average monthly rainy days for the same two periods (1994–2003 and 2003–2012) was computed, with results shown in Figure 14. The difference in rainy days between these two periods is very similar to that in SSH. The increase in rainy days was also highest from June to September, as reflected in SSH (Figure 3 and Figure 14). The increase in precipitation and rainy days led to a decrease in sunny days and a decrease in SSH. Essentially, the connection between SSH and rainy days resulted from cloud cover. This strongly suggests that the increase in precipitation and rainy days was the main reason for the decrease in SSH.

3.8. Effects of Precipitation on the Yield

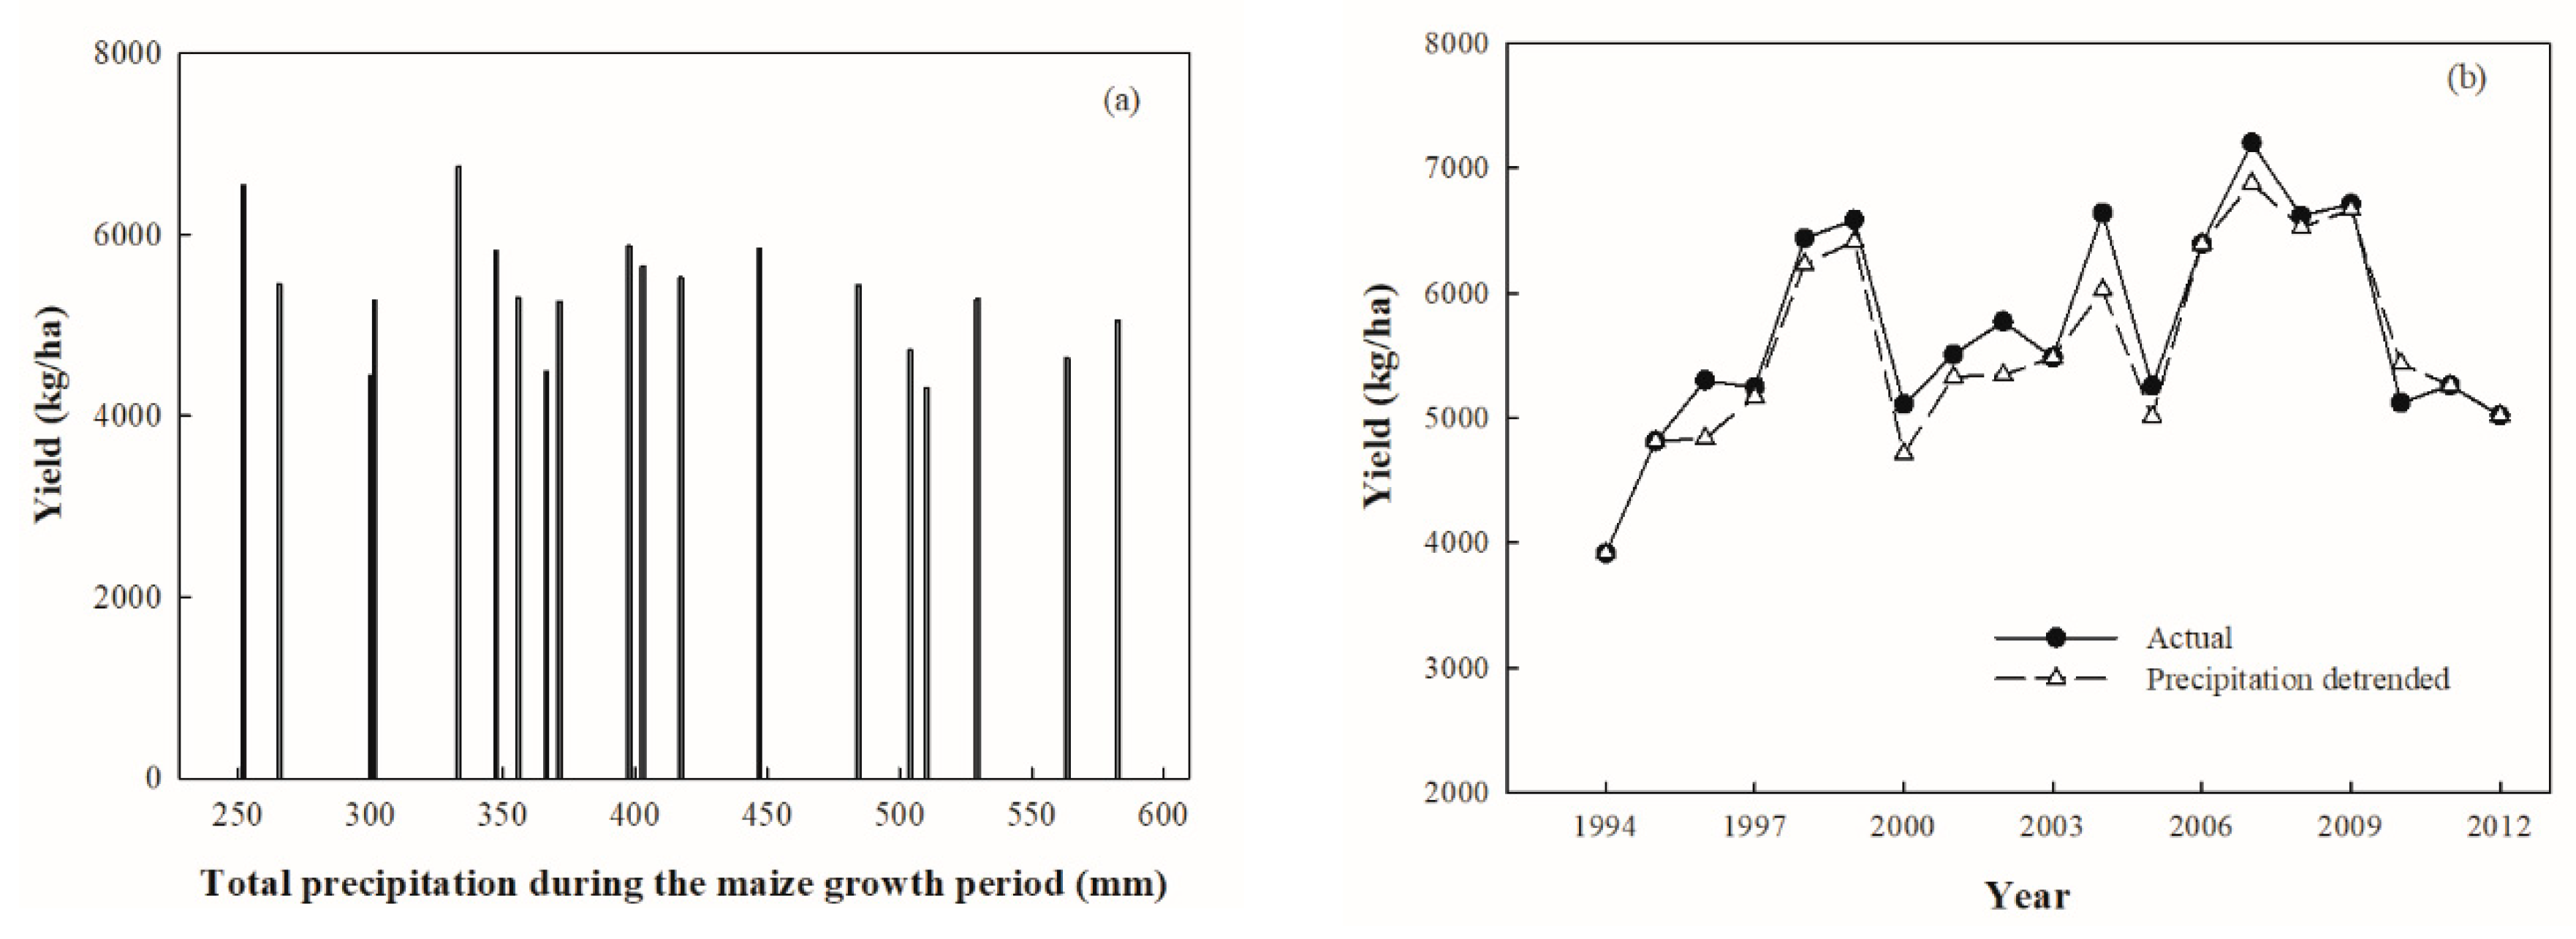
Studies show that precipitation affects crop production under full irrigation treatments [80,81]. This could occur when precipitation significantly changes solar radiation, and air moisture or water stress occurs between irrigation events. In this study, we examined the effect of precipitation on maize yield with observations. Figure 15a shows the precipitation amount against maize yield for the 19 study stations where precipitation ranged remarkably from 252 to 583 mm. Our results indicate that the change in precipitation did not have a significant impact on maize yield. Furthermore, we produced the yield difference between the simulations with the original and detrended precipitation for the WuGong station (one of the 19 stations), with an upward precipitation trend of 18 mm/year (Figure 15b). Therefore, in our study region with remarkable precipitation changes, we did not see a significant effect of precipitation on maize yield.

4. Conclusions

A decline in SSH was observed across most of the meteorological stations in Northern China. We found this decline to be highest in the warm season, when summer maize grows. A downward trend of −0.068 h/day for SSH was observed over the seven selected crop stations in central China for the summer maize growth period of 1994–2012. A downward trend of −0.5 °C/decade in Tmax was observed for the same period, which is likely associated with the decline in SSH. The CERES-Maize model was first calibrated and validated against observed yields, and the simulations agreed very well with observations. The model was then used to quantify the effects of the declines in SSH and Tmax on the maize growth period and yields, which were examined with and without the trends of these two climate forcing variables. CERES-Maize was also used to examine how cultivar replacements affected maize yields by comparing the results with and without cultivar replacement. Our modeling results indicated that the decline in SSH reduced the maize yield by 8% on average over our study stations by limiting root growth, and the decline for shorter SSH played a more important role in affecting the yield than that for longer SSH. In the meantime, the decrease in higher Tmax increased the yield where the extended growth period generated a dominant effect, while the decrease in lower Tmax reduced the yield where the lowered thermal time was most important. In addition, the observed yield showed a significant upward trend, which can be attributed mainly to the frequent cultivar replacements over the study period based on our modeling results. When compared with the prior cultivars, the replaced cultivars usually had a longer growth period, prolonging grain-filling time. Net maize production increased with the combined effects of cultivar replacements and the declines in SSH and Tmax on yields.
Temperature increases have become more significant on a global scale since the beginning of this century [82]. In this dynamic climate system, the feedback resulting from temperature increase is very complex. In some regions, the temperature shows a downward trend over certain seasons, which may be related to the reduced solar radiation due to greater cloud cover and higher aerosol loads as discussed above. These complex changes in the climate system probably have different effects on crop growth and yields. This study explored the issue at a relatively small spatial scale. Further studies should focus on a much larger scale or even a global scale, and on different crops.

Author Contributions

L.S. conducted the experiment, designed the experiment, performed the analysis, and drafted the manuscript; J.J. interpreted the results, supervised the research, contributed ideas during analysis and interpretation, and edited the paper. All authors have read and agreed to the published version of the manuscript.

Funding

This work was supported by the National Natural Science Foundation of China (grant number 91637209).

Conflicts of Interest

The authors declare no conflict of interest.

References

  1. Fischer, G.; Shah, M.; Tubiello, F.V.H. Socio-economic and climate change impacts on agriculture: An integrated assessment, 1990–2080. Philos. Trans. R. Soc. Lond. 2005, 360, 2067–2083. [Google Scholar] [CrossRef]
  2. He, L.; Asseng, S.; Zhao, G.; Wu, D.; Yang, X.; Zhuang, W.; Jin, N.; Yu, Q. Impacts of recent climate warming, cultivar changes, and crop management on winter wheat phenology across the Loess Plateau of China. Agric. For. Meteorol. 2015, 200, 135–143. [Google Scholar] [CrossRef]
  3. Jesse, T.; Andrew, B.; Lawton Lanier, N. Effect of warming temperatures on US wheat yields. Proc. Natl. Acad. Sci. USA 2015, 112, 6931–6936. [Google Scholar]
  4. Kassie, B.T.; Asseng, S.; Rotter, R.P.; Hengsdijk, H.; Ruane, A.C.; Van Ittersum, M.K. Exploring climate change impacts and adaptation options for maize production in the Central Rift Valley of Ethiopia using different climate change scenarios and crop models. Clim. Chang. 2015, 129, 145–158. [Google Scholar] [CrossRef]
  5. Parry, M.L.; Rosenzweig, C.; Iglesias, A.; Livermore, M.; Fischer, G. Effects of climate change on global food production under SRES emissions and socio-economic scenarios. Glob. Environ. Chang. 2004, 14, 53–67. [Google Scholar] [CrossRef]
  6. Rötter, R.; Geijn, S.C.V.D. Climate Change Effects on Plant Growth, Crop Yield and Livestock. Clim. Chang. 1999, 43, 651–681. [Google Scholar] [CrossRef]
  7. Rosenzweig, C.; Hillel, D. Climate Change and the Global Harvest; Oxford University Press: New York, NY, USA, 1998. [Google Scholar]
  8. Sun, W.; Huang, Y. Global warming over the period 1961–2008 did not increase high-temperature stress but did reduce low-temperature stress in irrigated rice across China. Agric. For. Meteorol. 2011, 151, 1193–1201. [Google Scholar] [CrossRef]
  9. Luo, Q. Temperature thresholds and crop production: A review. Clim. Chang. 2011, 109, 583–598. [Google Scholar] [CrossRef]
  10. Zhang, T.; Huang, Y.; Yang, X. Climate warming over the past three decades has shortened rice growth duration in China and cultivar shifts have further accelerated the process for late rice. Glob. Chang. Biol. 2013, 19, 563–570. [Google Scholar] [CrossRef]
  11. Liu, B.; Ming, X.; Henderson, M.; Ye, Q.; Li, Y. Taking China’s Temperature: Daily Range, Warming Trends, and Regional Variations, 1955 2000. J. Clim. 2004, 17, 4453–4462. [Google Scholar] [CrossRef]
  12. Rusticucci, M.; Barrucand, M. Observed Trends and Changes in Temperature Extremes over Argentina. J. Clim. 2004, 17, 4099–4107. [Google Scholar] [CrossRef] [Green Version]
  13. Vose, R.S.; Easterling, D.R.; Gleason, B. Maximum and minimum temperature trends for the globe: An update through 2004. Geophys. Res. Lett. 2005, 32, 23. [Google Scholar] [CrossRef] [Green Version]
  14. Ye, J.; Li, F.; Sun, G.; Guo, A. Solar dimming and its impact on estimating solar radiation from diurnal temperature range in China, 1961–2007. Theor. Appl. Climatol. 2010, 101, 137–142. [Google Scholar] [CrossRef]
  15. Penner, J.E. Climate change: The cloud conundrum. Nature 2004, 432, 962. [Google Scholar] [CrossRef]
  16. Pounds, J.A.; Bustamante, M.R.; Coloma, L.A.; Consuegra, J.A.; Fogden, M.P.; Foster, P.N.; La Marca, E.; Masters, K.L.; Merino-Viteri, A.; Puschendorf, R. Widespread amphibian extinctions from epidemic disease driven by global warming. Nature 2006, 439, 161. [Google Scholar] [CrossRef]
  17. Norris, J.R.; Wild, M. Trends in aerosol radiative effects over Europe inferred from observed cloud cover, solar “dimming,” and solar “brightening”. J. Geophys. Res. Atmos. 2007, 112, D8. [Google Scholar] [CrossRef] [Green Version]
  18. Power, H.C. Trends in solar radiation over Germany and an assessment of the role of aerosols and sunshine duration. Theor. Appl. Climatol. 2003, 76, 47–63. [Google Scholar] [CrossRef]
  19. Stanhill, G.; Cohen, S. Global dimming: A review of the evidence for a widespread and significant reduction in global radiation with discussion of its probable causes and possible agricultural consequences. Agric. For. Meteorol. 2001, 107, 255–278. [Google Scholar] [CrossRef]
  20. Alpert, P.; Kishcha, P.; Kaufman, Y.J.; Schwarzbard, R. Global dimming or local dimming?: Effect of urbanization on sunlight availability. Geophys. Res. Lett. 2005, 321, 317–330. [Google Scholar] [CrossRef] [Green Version]
  21. Kaiser, D.P.; Qian, Y. Decreasing trends in sunshine duration over China for 1954–1998: Indication of increased haze pollution? Geophys. Res. Lett. 2002, 29, 38-1–38-4. [Google Scholar] [CrossRef]
  22. Li, Z.; Zhang, W.; He, Y.; Wang, X.; Catto, N.; An, W.; Du, J.; Chen, A.; Liu, L.; Hu, M. Decreasing trend of sunshine hours and related driving forces in Southwestern China. J. Lanzhou Univ. 2012, 109, 305–321. [Google Scholar]
  23. Liang, F.; Xia, X.A. Long-term trends in solar radiation and the associated climatic factors over China for 1961–2000. Ann. Geophys. 2005, 23, 2425–2432. [Google Scholar] [CrossRef] [Green Version]
  24. Qian, Y.; Kaiser, D.P.; Leung, L.R.; Xu, M. More frequent cloud-free sky and less surface solar radiation in China from 1955 to 2000. Geophys. Res. Lett. 2015, 33, 311–330. [Google Scholar] [CrossRef] [Green Version]
  25. Van den Besselaar, E.; Sanchez-Lorenzo, A.; Wild, M.; Klein Tank, A.; de Laat, A. Relationship between sunshine duration and temperature trends across Europe since the second half of the twentieth century. J. Geophys. Res. Atmos. 2015, 120, 10823–10836. [Google Scholar] [CrossRef] [Green Version]
  26. Wild, M. Enlightening Global Dimming and Brightening. Bull. Amer. Meteor. Soc 2012, 93, 27–37. [Google Scholar] [CrossRef]
  27. Wild, M.; Ohmura, A.; Makowski, K. Impact of global dimming and brightening on global warming. Geophys. Res. Lett. 2007, 34, 545–559. [Google Scholar] [CrossRef] [Green Version]
  28. Chen, C.; Wang, E.; Yu, Q.; Zhang, Y. Quantifying the effects of climate trends in the past 43 years (1961–2003) on crop growth and water demand in the North China Plain. Clim. Chang. 2010, 100, 559–578. [Google Scholar] [CrossRef]
  29. Choudhury, B.J. Modeling radiation- and carbon-use efficiencies of maize, sorghum, and rice. Agric. For. Meteorol. 2001, 106, 317–330. [Google Scholar] [CrossRef]
  30. Yang, X.; Asseng, S.; Wong, M.T.F.; Yu, Q.; Li, J.; Liu, E. Quantifying the interactive impacts of global dimming and warming on wheat yield and water use in China. Agric. For. Meteorol. 2013, 182–183, 342–351. [Google Scholar] [CrossRef]
  31. Garatuzapayan, J.; Argentelmartinez, L.; Yepez, E.A.; Arredondo, T. Initial response of phenology and yield components of wheat (Triticum durum L., CIRNO C2008) under experimental warming field conditions in the Yaqui Valley. Peerj 2018, 6, e5064. [Google Scholar] [CrossRef] [Green Version]
  32. Ainsworth, E.A.; Ort, D.R. How do we improve crop production in a warming world? Plant. Physiol. 2010, 154, 526–530. [Google Scholar] [CrossRef] [PubMed] [Green Version]
  33. Kucharik, C.J.; Serbin, S.P. Impacts of recent climate change on Wisconsin corn and soybean yield trends. Environ. Res. Lett. 2008, 3, 10. [Google Scholar] [CrossRef]
  34. Lobell, D.B.; Field, C.B. Global scale climate–crop yield relationships and the impacts of recent warming. Environ. Res. Lett. 2007, 2, 014002. [Google Scholar] [CrossRef]
  35. Lu, P.L.; Yu, Q.; Wang, E.; Liu, J.D.; Xu, S.H. Effects of climatic variation and warming on rice development across South China. Clim. Res. 2008, 36, 79–88. [Google Scholar] [CrossRef]
  36. Meerburg, B.G.; Verhagen, A.; Jongschaap, R.E.E.; Franke, A.C.; Schaap, B.F.; Dueck, T.A.; Van Der Werf, A. Do nonlinear temperature effects indicate severe damages to US crop yields under climate change? Proc. Natl. Acad. Sci. USA 2009, 106, 15594–15598. [Google Scholar] [CrossRef] [Green Version]
  37. Mo, F.; Sun, M.; Liu, X.Y.; Wang, J.Y.; Zhang, X.C.; Ma, B.L.; Xiong, Y.C. Phenological responses of spring wheat and maize to changes in crop management and rising temperatures from 1992 to 2013 across the Loess Plateau. Field Crop. Res. 2016, 196, 337–347. [Google Scholar] [CrossRef]
  38. Mohammat, A.; Wang, X.; Xiangtao, X.U.; Peng, L.; Yang, Y.; Zhang, X.M.; Ranga, B.; Piao, S. Drought and spring cooling induced recent decrease in vegetation growth in Inner Asia. Agric. For. Meteorol. 2013, 178–179, 21–30. [Google Scholar] [CrossRef]
  39. Rezaei, E.E.; Siebert, S.; Ewert, F. Climate and management interaction cause diverse crop phenology trends. Agric. For. Meteorol. 2017, 233, 55–70. [Google Scholar] [CrossRef]
  40. Rezaei, E.E.; Siebert, S.; Hüging, H.; Ewert, F. Climate change effect on wheat phenology depends on cultivar change. Sci. Rep. 2018, 8, 4891. [Google Scholar] [CrossRef] [Green Version]
  41. Peng, S.; Huang, J.; Sheehy, J.E.; Laza, R.C.; Visperas, R.M.; Zhong, X.; Centeno, G.S.; Khush, G.S.; Cassman, K.G. Rice yields decline with higher night temperature from global warming. Proc. Natl. Acad. Sci. USA 2004, 101, 9971–9975. [Google Scholar] [CrossRef] [Green Version]
  42. Tao, F.; Yokozawa, M.; Liu, J.; Zhang, Z. Climate–crop yield relationships at provincial scales in China and the impacts of recent climate trends. Clim. Res. 2008, 38, 83–94. [Google Scholar] [CrossRef]
  43. Huang, Y.; Zhang, W.; Sun, W.; Zheng, X. Net primary production of Chinese croplands from 1950 to 1999. Ecol. Appl. 2007, 17, 692–701. [Google Scholar] [CrossRef] [PubMed]
  44. Roy, K.S.; Bhattacharyya, P.; Neogi, S.; Rao, K.S.; Adhya, T.K. Combined effect of elevated CO2 and temperature on dry matter production, net assimilation rate, C and N allocations in tropical rice (Oryza sativa L.). Field Crop. Res. 2012, 139, 71–79. [Google Scholar] [CrossRef]
  45. Welch, J.R.; Vincent, J.R.; Auffhammer, M.; Moya, P.F.; Dobermann, A.; Dawe, D. Rice yields in tropical/subtropical Asia exhibit large but opposing sensitivities to minimum and maximum temperatures. Proc. Natl. Acad. Sci. USA 2010, 107, 14562–14567. [Google Scholar] [CrossRef] [Green Version]
  46. Wang, B.; Li, J.; Wan, Y.; Li, Y.E.; Qin, X.; Gao, Q.; Waqas, M.A.; Wilkes, A.; Cai, W.; You, S. Responses of yield, CH4 and N2O emissions to elevated atmospheric temperature and CO2 concentration in a double rice cropping system. Eur. J. Agron. 2018, 96, 60–69. [Google Scholar] [CrossRef]
  47. Tubiello, F.N.; Jean-FranOis, S.S.; Mark, H. Crop and pasture response to climate change. Proc. Natl. Acad. Sci. USA 2007, 104, 19686–19690. [Google Scholar] [CrossRef] [Green Version]
  48. Wheeler, T.R.; Craufurd, P.Q.; Ellis, R.H.; Porter, J.R.; Prasad, P.V.V. Temperature variability and the yield of annual crops. Agric. Ecosyst. Environ. 2015, 82, 159–167. [Google Scholar] [CrossRef]
  49. Rezaei, E.E.; Siebert, S.; Ewert, F. Intensity of heat stress in winter wheat—Phenology compensates for the adverse effect of global warming. Environ. Res. Lett. 2015, 10, 024012. [Google Scholar] [CrossRef]
  50. Liu, Y.; Wang, E.; Yang, X.; Wang, J. Contributions of climatic and crop varietal changes to crop production in the North China Plain, since 1980s. Glob. Chang. Biol. 2010, 16, 2287–2299. [Google Scholar] [CrossRef]
  51. Yu, Y.; Huang, Y.; Zhang, W. Changes in rice yields in China since 1980 associated with cultivar improvement, climate and crop management. Field Crop. Res. 2012, 136, 65–75. [Google Scholar] [CrossRef]
  52. Challinor, A.J.; Watson, J.; Lobell, D.B.; Howden, S.M.; Smith, D.R.; Chhetri, N. A meta-analysis of crop yield under climate change and adaptation. Nat. Clim. Chang. 2014, 4, 287–291. [Google Scholar] [CrossRef]
  53. Lobell, D.B. Climate change adaptation in crop production: Beware of illusions. Glob. Food Secur. 2014, 3, 72–76. [Google Scholar] [CrossRef]
  54. Southworth, J.; Randolph, J.C.; Habeck, M.; Doering, O.C.; Pfeifer, R.A.; Rao, D.G.; Johnston, J.J. Consequences of future climate change and changing climate variability on maize yields in the midwestern United States. Agric. Ecosyst. Environ. 2000, 82, 139–158. [Google Scholar] [CrossRef]
  55. Rötter, R.P.; Höhn, J.; Trnka, M.; Fronzek, S.; Carter, T.R.; Kahiluoto, H. Modelling shifts in agroclimate and crop cultivar response under climate change. Ecol. Evol. 2013, 3, 4197–4214. [Google Scholar] [CrossRef] [PubMed] [Green Version]
  56. Tao, F.; Zhang, Z.; Shi, W.; Liu, Y.; Xiao, D.; Zhang, S.; Zhu, Z.; Wang, M.; Liu, F. Single rice growth period was prolonged by cultivars shifts, but yield was damaged by climate change during 1981–2009 in C hina, and late rice was just opposite. Glob. Chang. Biol. 2013, 19, 3200–3209. [Google Scholar] [CrossRef] [PubMed]
  57. Govindaraju, V.C.; Tang, C.F. The dynamic links between CO2 emissions, economic growth and coal consumption in China and India. Appl. Energy 2013, 104, 310–318. [Google Scholar] [CrossRef]
  58. Lu, Z.; Streets, D.G.; Zhang, Q.; Wang, S.; Carmichael, G.R.; Cheng, Y.F.; Wei, C.; Chin, M.; Diehl, T.; Tan, Q. Sulfur dioxide emissions in China and sulfur trends in East Asia since 2000. Atmos. Chem. Phys. 2010, 10, 6311–6331. [Google Scholar] [CrossRef] [Green Version]
  59. Petäjä, T.; Järvi, L.; Kerminen, V.M.; Ding, A.J.; Sun, J.N.; Nie, W.; Kujansuu, J.; Virkkula, A.; Yang, X.; Fu, C.B. Enhanced air pollution via aerosol-boundary layer feedback in China. Sci. Rep. 2016, 6, 18998. [Google Scholar] [CrossRef] [Green Version]
  60. Li, C.; Zhao, T.; Ying, K. Effects of anthropogenic aerosols on temperature changes in China during the twentieth century based on CMIP5 models. Theor. Appl. Climatol. 2016, 125, 529–540. [Google Scholar] [CrossRef]
  61. National Bureau of Statistics of China. China Statistics Yearbook; China Statistics Press: Beijing, China, 2007–2017. [Google Scholar]
  62. Jones, C.A. CERES-Maize, A Simulation Model of Maize Growth and Development; Texas A & M University Press: College Station, TX, USA, 1986. [Google Scholar]
  63. Jones, J.W.; Hoogenboom, G.; Porter, C.H.; Boote, K.J.; Batchelor, W.D.; Hunt, L.A.; Wilkens, P.W.; Singh, U.; Gijsman, A.J.; Ritchie, J.T. The DSSAT cropping system model. Eur. J. Agron. 2003, 18, 235–265. [Google Scholar] [CrossRef]
  64. Ritchie, J. Soil water balance and plant water stress. In Understanding Options for Agricultural Production; Kluver Academic Publishers: Dordrecht, The Netherlands, 1998; pp. 41–54. [Google Scholar]
  65. Ritchie, J.; Godwin, D. Description of soil water balance. In Research Bulletin 12; ICRISAT: Pradesh, India, 1989. [Google Scholar]
  66. Angstrom, A. Solar and terrestrial radiation. Report to the international commission for solar research on actinometric investigations of solar and atmospheric radiation. Q. J. R. Meteorol. Soc. 2010, 50, 121–126. [Google Scholar] [CrossRef]
  67. Allen, R.G.; Pereira, L.S.; Raes, D.; Smith, M. Crop Evapotranspiration-Guidelines for Computing Crop Water Requirements-FAO Irrigation and Drainage Paper 56; FAO: Rome, Italy, 1998; Volume 300, p. D05109. [Google Scholar]
  68. Mann, H.B. Nonparametric tests against trend. Econom. J. Econom. Soc. 1945, 13, 245–259. [Google Scholar] [CrossRef]
  69. Kendall, M. Rank Correlation Methods; Book Series, Charles Griffin; Oxford University Press: New York, NY, USA; London, UK, 1975. [Google Scholar]
  70. Howden, S.M.; Soussana, J.-F.; Tubiello, F.N.; Chhetri, N.; Dunlop, M.; Meinke, H. Adapting agriculture to climate change. Proc. Natl. Acad. Sci. USA 2007, 104, 19691–19696. [Google Scholar] [CrossRef] [Green Version]
  71. Jain, S.M. Mutagenesis in crop improvement under the climate change. Rom. Biotechnol. Lett. 2010, 15, 88–106. [Google Scholar]
  72. Hanway, J.J. How a Corn Plant Develops; Iowa State University Digital Press: Ames, IA, USA, 1966. [Google Scholar]
  73. Richner, W.; Soldati, A.; Stamp, P. Shoot-to-root relations in field-grown maize seedlings. Agron. J. 1996, 88, 56–61. [Google Scholar] [CrossRef]
  74. Ertekin, C.; Yaldız, O. Estimation of monthly average daily global radiation on horizontal surface for Antalya (Turkey). Renew. Energy 1999, 17, 95–102. [Google Scholar] [CrossRef]
  75. Pinker, R.; Zhang, B.; Dutton, E. Do satellites detect trends in surface solar radiation? Science 2005, 308, 850–854. [Google Scholar] [CrossRef] [Green Version]
  76. An, J.; Zhang, R.; Han, Z. Seasonal changes of total suspended particles in the air of 15 big cities in northern parts of China. Clim. Environ. Res. 2000, 5, 25–29. [Google Scholar]
  77. Yu, S.; Lin, X.; Xu, X. Temporal and spatial characteristics of air pollution in Beijing. J. Appl. Meteorol. Sci. 2002, 13, 92–99. [Google Scholar]
  78. Ma, Y.J.; Cui, J.S.; Liu, X.M.; Zhang, J. Analyese on variation characteristics of atmospheric pollutant in a group of cities in central Liaoning from 1987 to 2002. Plateau Meteorol. 2005, 24, 428–435. [Google Scholar]
  79. Niu, Y.; He, L.; Hu, M.; Zhang, J.; Zhao, Y. Pollution characteristics of atmospheric fine particles and their secondary components in the atmosphere of Shenzhen in summer and in winter. Sci. China Ser. B Chem. 2006, 49, 466–474. [Google Scholar] [CrossRef]
  80. Fishman, R. More uneven distributions overturn benefits of higher precipitation for crop yields. Environ. Res. Lett. 2016, 11, 024004. [Google Scholar] [CrossRef]
  81. Irmak, S. Interannual variation in long-term center pivot–irrigated maize evapotranspiration and various water productivity response indices. I: Grain yield, actual and basal evapotranspiration, irrigation-yield production functions, evapotranspiration-yield production functions, and yield response factors. J. Irrig. Drain. Eng. 2015, 141, 04014068. [Google Scholar]
  82. Blunden, J.; Arndt, D.S.; Hartfield, G.; Weyhenmeyer, G.A.; Ziese, M.G. State of the Climate in 2017. Bull. Am. Meteorol. Soc. (BAMS) 2018, 99, S1–S310. [Google Scholar]
Figure 1. Location, topography, and distribution of meteorological stations in the study area.
Agronomy 10 01862 g001
Figure 2. Comparison of SSH between observations and calculations with Equation (1) at YanAn (a) and AnKang (b) stations. Blue lines represent observations and red lines represent calculations with Equation (1).
Agronomy 10 01862 g002
Figure 3. (a) Annual variation and average trend of sunshine hours in ShaanXi Province during 1994–2012 averaged for 19 meteorological stations. (b) Comparison of averaged monthly sunshine hours for two 10-year periods (averaged for 1994–2003 and for 2003–2012). (c) Variation and average trend of daily sunshine hours of the maize growth period in ShaanXi Province during 1994–2012 averaged for 19 meteorological stations.
Agronomy 10 01862 g003
Figure 4. Variation and average trend of daily maximum temperature of the maize growth period in ShaanXi Province during 1994–2012 at 19 meteorological stations. The time series of the lowest Tmax is for the HuaShan station with an elevation of 2064.9 m.
Agronomy 10 01862 g004
Figure 5. Relationships between simulated and observed phenology dates (a), yield (b), and soil water content (c) for 19 years (1994–2012) at seven crop stations. The dashed line represents a 1:1 relationship. R2 is the coefficient of determination of the linear regression between simulated and observed values. Asterisks indicate significance at ** p < 0.01, and n represents the number of samples.
Agronomy 10 01862 g005
Figure 6. Change in growth period [(a) for vegetative growth and (b) for reproductive growth] and kernel weight (c) and the changing model parameters that correspond to them. P1 (d), P5 (e), and G3 (f) are genetic coefficient parameters in the CERES-Maize model, shown in Table 7.
Agronomy 10 01862 g006
Figure 7. Removal of the trend of daily sunshine hours (a) and maximum temperature (b) of the maize growth stage in ShaanXi Province since 1994, averaged for the seven crop stations.
Agronomy 10 01862 g007
Figure 8. Mean change in yield due to sunshine hour decrease, maximum temperature decrease, and cultivar change.
Agronomy 10 01862 g008
Figure 9. Contribution of different factors to the total yield against observations in the study region for the period of 1994–2012 (the left axis). The baseline yield is that for 1994 (2651 kg/ha). The right axis represents the yield change in terms of the baseline yield. The stacked and error bars on the far right side show the contribution of each factor to the total yield as of 2012.
Agronomy 10 01862 g009
Figure 10. Yield difference between simulations with the original and detrended SSH (a) and Tmax (b) for the 19 study stations averaged over the period of 1994–2012. The horizontal axis is for the original SSH (a) and Tmax (b).
Agronomy 10 01862 g010
Figure 11. (a) Change in the percentage of maximum leaf area index, unit kernel weight, aboveground biomass, and root biomass under temperature, cultivar, and sunshine hour runs compared with the original run. (b) Change in the duration of the vegetative period (planting to flowering), reproductive period (flowering to maturity), and the whole period (planting to maturity) of maize under temperature, cultivar, and sunshine hour runs compared with the original run.
Agronomy 10 01862 g011
Figure 12. Annual (a) and seasonal (b) time series of root and aboveground biomass with and without trend in sunshine hours.
Agronomy 10 01862 g012
Figure 13. Variation and average trend of precipitation (a) and rainy days (b) of the maize growth period in ShaanXi Province during 1994–2012 averaged for 19 meteorological stations.
Agronomy 10 01862 g013
Figure 14. Seasonal difference of precipitation (a) and rainy days (b) for two 10-year periods (average for 1994–2003 and for 2003–2012) in ShaanXi Province during 1994–2012 averaged for 19 meteorological stations.
Agronomy 10 01862 g014
Figure 15. (a) Simulated yields for the 19 study stations averaged over the period of 1994–2012 against total precipitation. (b) Yield difference between simulations with the original and detrended precipitation for the WuGong station.
Agronomy 10 01862 g015
Table 1. Total number of meteorological stations in each province in Northern China and the number of meteorological stations with a decrease in sunshine hours (SSH).
ProvinceTotal Number of StationsNumber of Stations with SSH Decrease
ShaanXi1918
ShanXi2724
ShanDong2320
HeNan1916
HeBei2015
NeiMengGu4533
LiaoNing3323
JiLin2920
HeiLongJiang3120
Table 2. Genetic coefficient parameters and their ranges in the CERES-Maize model.
ParameterDefinitionUnitRange
P1Thermal time from seedling emergence to the end of the juvenile phase°C d100–400
P2 Photoperiod sensitivity coefficient 0–4
P5 Thermal time from silking to physiological maturity°C d600–1000
G2 Maximum possible number of kernels per plant 500–1000
G3Kernel filling rate during the linear grain-filling stage under optimum conditions mg/d5–12
PHINTInterval in thermal time (degree days) between successive leaf tip appearances°C d30–75
Table 3. Detailed information for model calibration and validation.
SiteCultivar NameCalibration DataValidation Data
DaLiHuDan11994–19951996
HuDan219981997
HuDan31999, 20002001
HuDan42002–20042005
JunDan2006, 20072008
JunDan202009–20112012
FengXiangHuDan1994–19961997
ShanDan1998, 19992000
DengHai12001–20042005
ZhengDan20062007
ZhengDan51820082009
ShanYu7822010–20112012
LinTongHuDan1994, 19951996
ZhangYu1997–19992000
GaoNong12001–20042005
HuDan42006–20112012
ShangLuoHuDan1994–19992000
ShenDan102001–20062007
DengHui1120082009
ZhengDa122010, 20112012
WeiNanDanYu131994–19992000
HuDan42001–20042005
JiYu920062009
ZhengDan9582007, 2008, 2010, 20112012
WuGongShanDan91994–19961997
ShanDan9021998, 19992000
YeDan19–12001, 20022003
ZhengDan9582004–20072008
ZhongKe1120092010
ZhangYu920112012
XianYangXiDan21994, 19952002
YeDan121996, 19971998
GaoNong21999, 20002006
Shan9112001, 2003, 20042005
ZhengDan9582007, 20102011
JunDan202008, 20092012
Table 4. Model runs performed in this study.
NameSSHTemperatureCultivar
OriginalActual Actual Actual
SSHDetrendedActual Actual
TmaxActual DetrendedActual
CultivarActual Actual Unchanged
ClimateDetrended Detrended Actual
Note: SSH represents sunshine hours and Tmax is the daily maximum temperature.
Table 5. Trends of weather variables during the maize growing period at seven stations over the period 1994–2012.
DaLiFengXiangLinTongShangLuoWeiNanWuGongXianYang
SSHAverage (hour)6.25.55.55.86.55.35.3
Trend (hour/decade)−1.2 **−1.0 **−1.0 **−0.9 **−1.3 *−1.3 **−1.3 **
TmaxAverage (°C)28.327.627.428.228.529.529.5
Trend (°C/decade)−0.1−0.8 *−0.8 *−0.7 *−0.8−1.1 *−1.1 *
TminAverage (°C)17.317.517.417.818.619.519.5
Trend (°C/decade)0.00.40.30.0−0.2−0.4−0.4
TaveAverage (°C)22.222.122.122.223.124.024.0
Trend (°C/decade)0.0−0.3−0.3−0.5 *−0.6 *−0.8 **−0.8 **
PREAverage (mm)447398402417356366366
Trend (mm/year)8.410.8 **8.511.8 *7.717.0 **17.0 **
Note: SSH represents daily sunshine hours, Tmax, Tmin, and Tave represent daily maximum, minimum, and average temperature, respectively, and PRE represents total precipitation during the growth period. Asterisks in the table indicate significance at ** p < 0.01 and * p < 0.05 with the Mann–Kendall test, with values shown in bold.
Table 6. Averages and trends of observed planting, flowering, and maturity dates, and the duration of the vegetative period (planting to flowering), reproductive period (flowering to maturity), and the whole period (planting to maturity) of maize at the seven stations over the period 1994–2012. Trends are given in days per decade.
DaLiFengXiangLinTongShangLuoWeiNanWuGongXianYang
Planting dateAverage (Day of year)159164162161162163166
Trend (days/decade)−2.32.5−5.2 *−2.40.70.3−2.7
Flowering dateAverage (Day of year)220232220222219222227
Trend (days/decade)0.55.6 **−2.93.31.45.1 **1.3
Maturity dateAverage (Day of year)259275269276263268271
Trend (days/decade)4.39.8 **6.712.5 **5.6 *7.0 *5.2
Vegetative periodAverage (days)61675961575962
Trend (days/decade)2.83.4 *2.45.7 **0.74.8 **1.1
Reproductive periodAverage (days)39434954444744
Trend (days/decade)5.5 **4.29.5 **9.24.1 *1.63.9 *
Entire growth periodAverage (days)99110108115101106107
Trend (days/decade)6.5 **7.3 *11.9 **14.9 **4.8 **6.7 **4.9 *
Note: Asterisks in the table indicate significance at ** p < 0.01 and * p < 0.05 with the Mann–Kendall test, with values shown in bold.
Table 7. The yield results of model calibration and validation.
Cultivar NameCultivar CoefficientsCalibration ARE (%)Validation ARE (%)
P1P2P5G2G3PHINT
HuDan12600.157669.9874.87.95169.12134.6
HuDan2227.80.11662.8813.87.0965.062.637.8
HuDan3227.80.11662.8813.89.7965.067.314.2
HuDan4227.80.11662.8813.89.7965.0611.15.8
JunDan262.80.835706.6802.610.4468.185.63.8
JunDan20353.20.157765.1874.811.6569.128.45.9
HuDan1800.557479.9874.87.95169.128.86
ShanDan227.80.11470.9813.87.0965.068.720.7
DengHai1262.80.51470.9700.86.0965.069.13.5
ZhengDan227.80.51460.8873.87.95165.0610.20.5
ZhengDan518222.80.51470.8813.87.95165.0610.49.8
ShanYu782227.80.11512.8873.87.0965.067.48.4
ZhangYu1500.11456.8813.87.0965.066.92.3
GaoNong11800.11556.8813.87.0965.063.36.2
ShenDan10227.80.11662.8713.86.0965.068.917
DengHui11200.80.11662.8813.86.265.064.13.9
ZhengDa122000.157622.9813.86.765.068.82.3
DanYu13247.80.11722.8513.87.4965.067.39.5
JiYu9247.80.11770.9813.89.7965.067.91.8
ZhengDan958227.80.11662.8813.89.7965.063.97.9
ShanDan9227.80.11622.8813.86.0965.069.41.7
ShanDan902227.80.11762.8813.88.0965.061.112
YeDan19−1227.80.11662.8813.86.0965.066.40.1
ZhongKe11227.80.11662.8813.89.7965.064.15.4
ZhangYu9227.80.157649.9874.87.95169.123.24.5
XiDan2227.80.11662.8513.86.0965.0624.22.8
YeDan12227.80.11662.8813.87.0965.062.14.6
GaoNong2247.80.51622.8813.86.7965.065.932.7
Shan911247.80.11622.8813.87.9965.068.24.1
Average 7.58.3
Note: some data were not included in calculating absolute relative error (ARE) due to a serious pest outbreak in those years and very large errors.
Publisher’s Note: MDPI stays neutral with regard to jurisdictional claims in published maps and institutional affiliations.