Effect of Habitat and Foliar Fertilization with K, Zn and Mn on Winter Wheat Grain and Baking Qualities


Abstract
:1. Introduction
2. Materials and Methods
2.1. Experiment Location
2.2. Study Factors
2.3. Agrotechnical and Soil Conditions
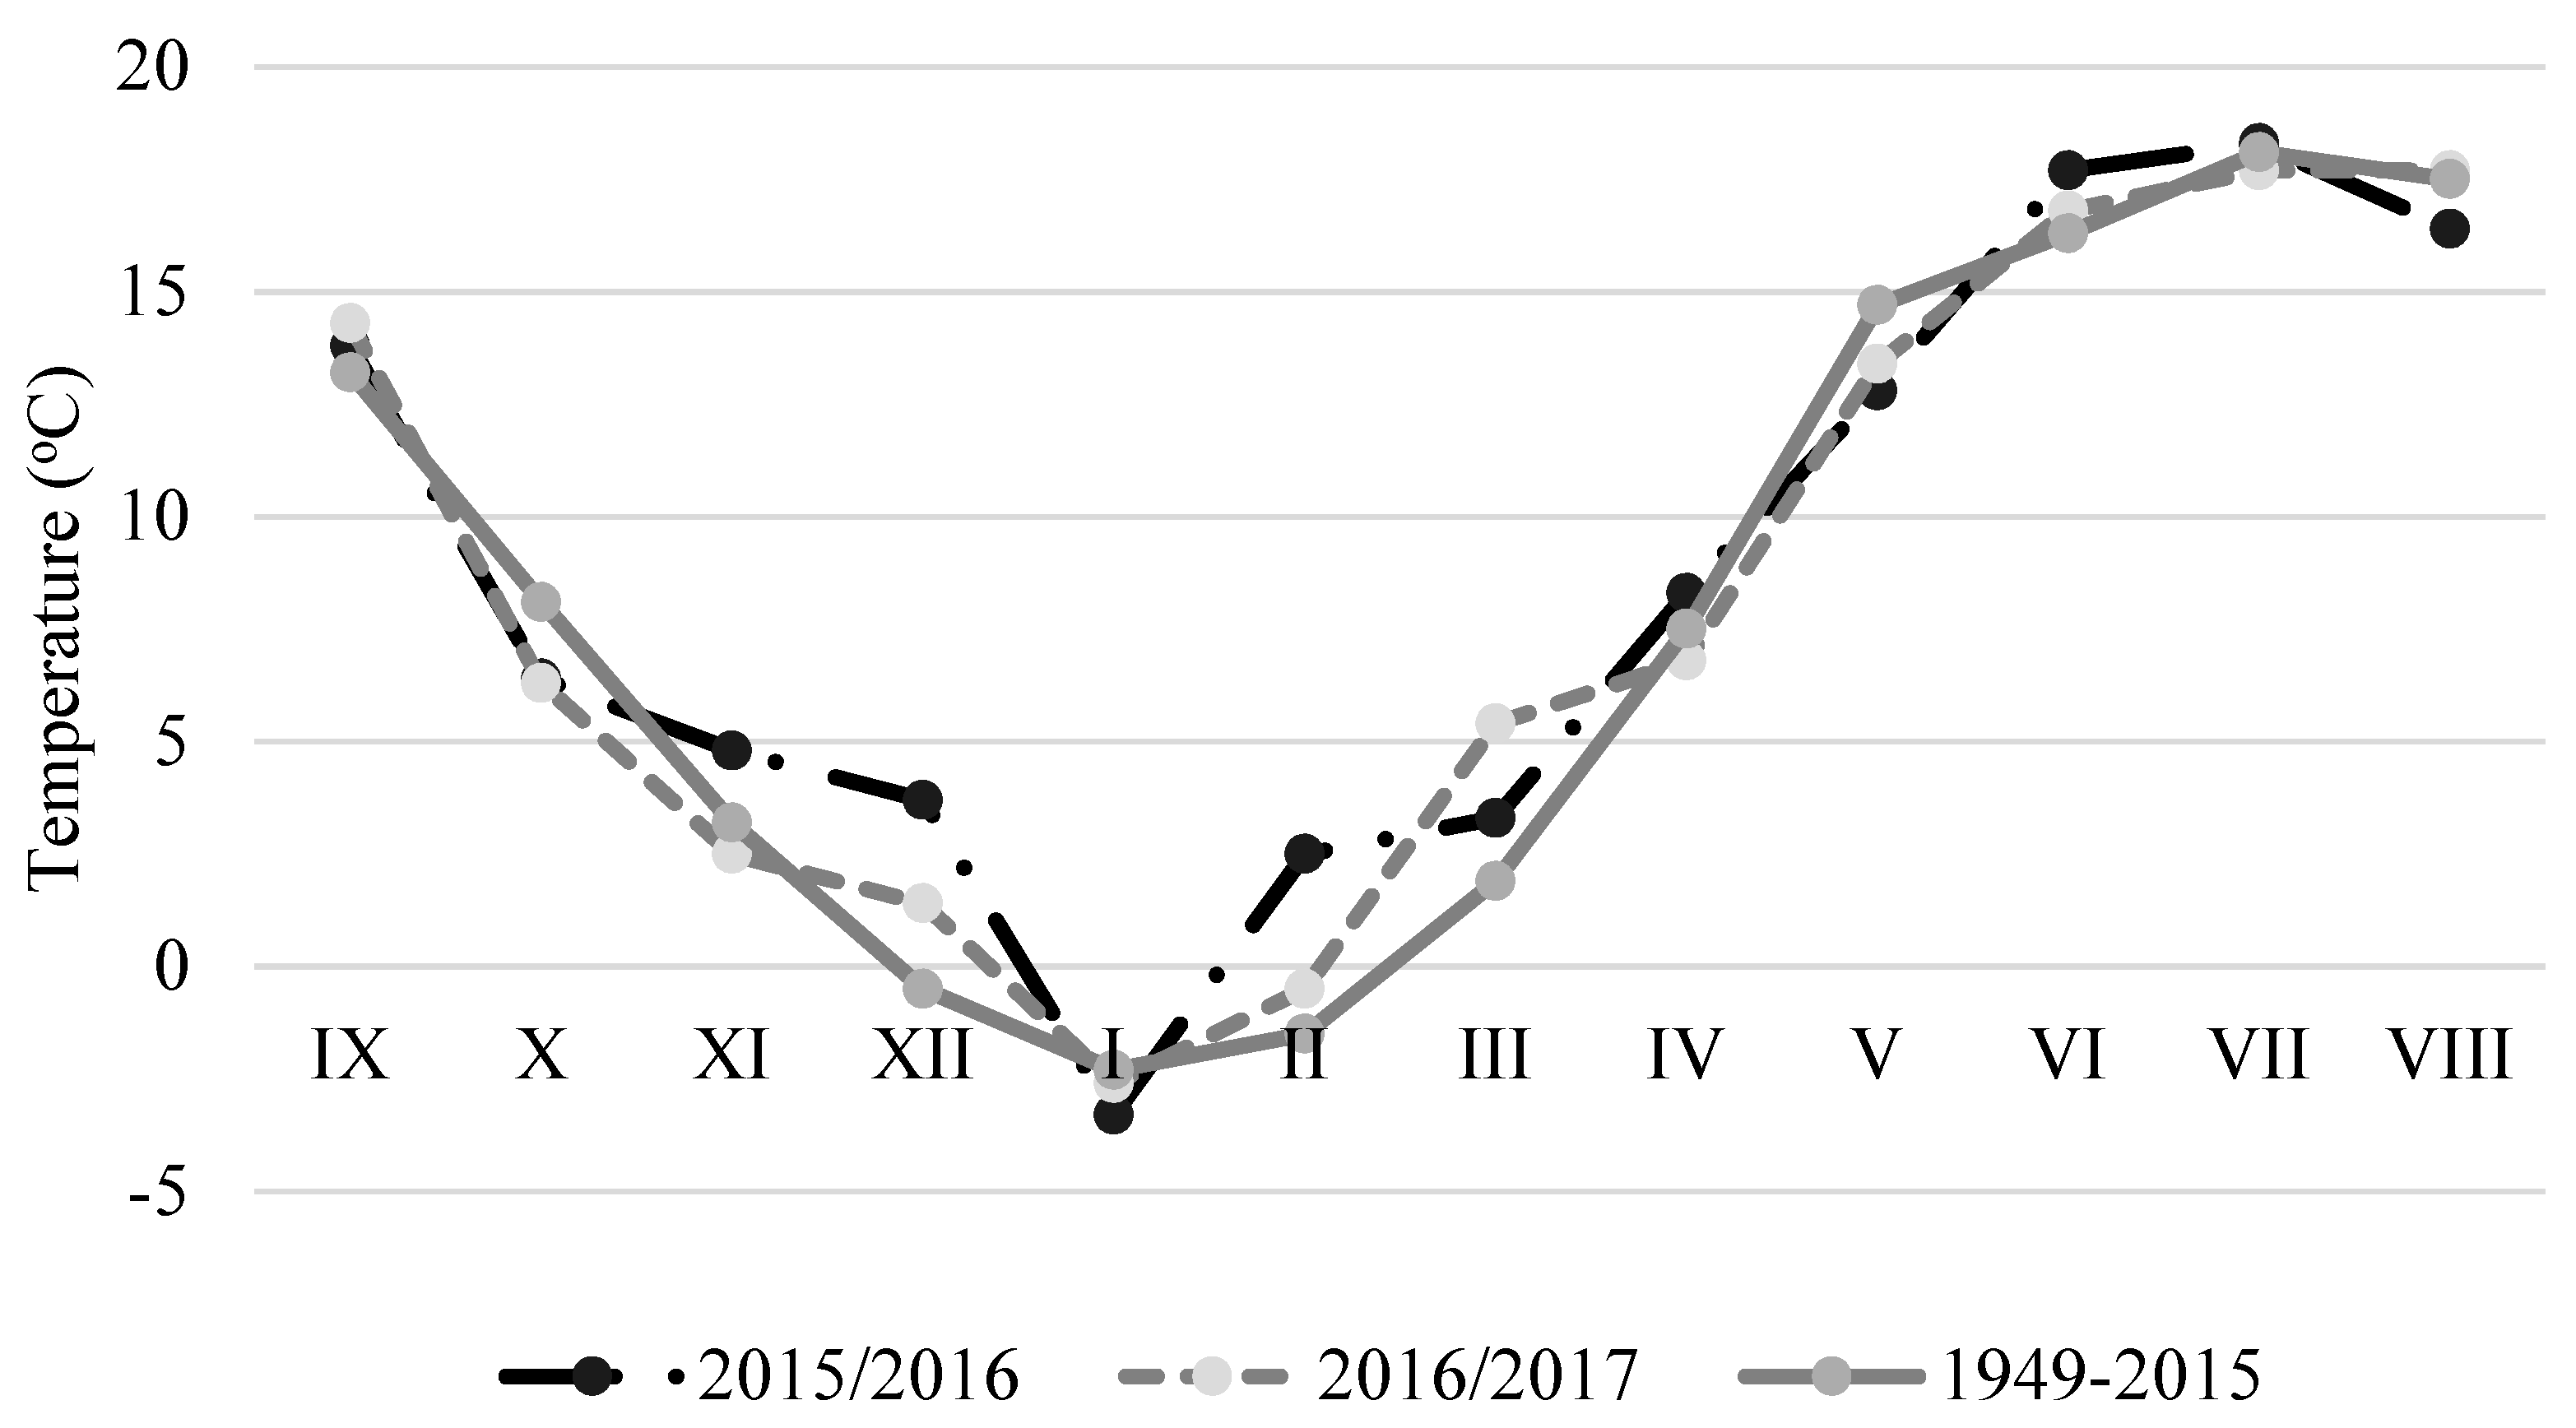
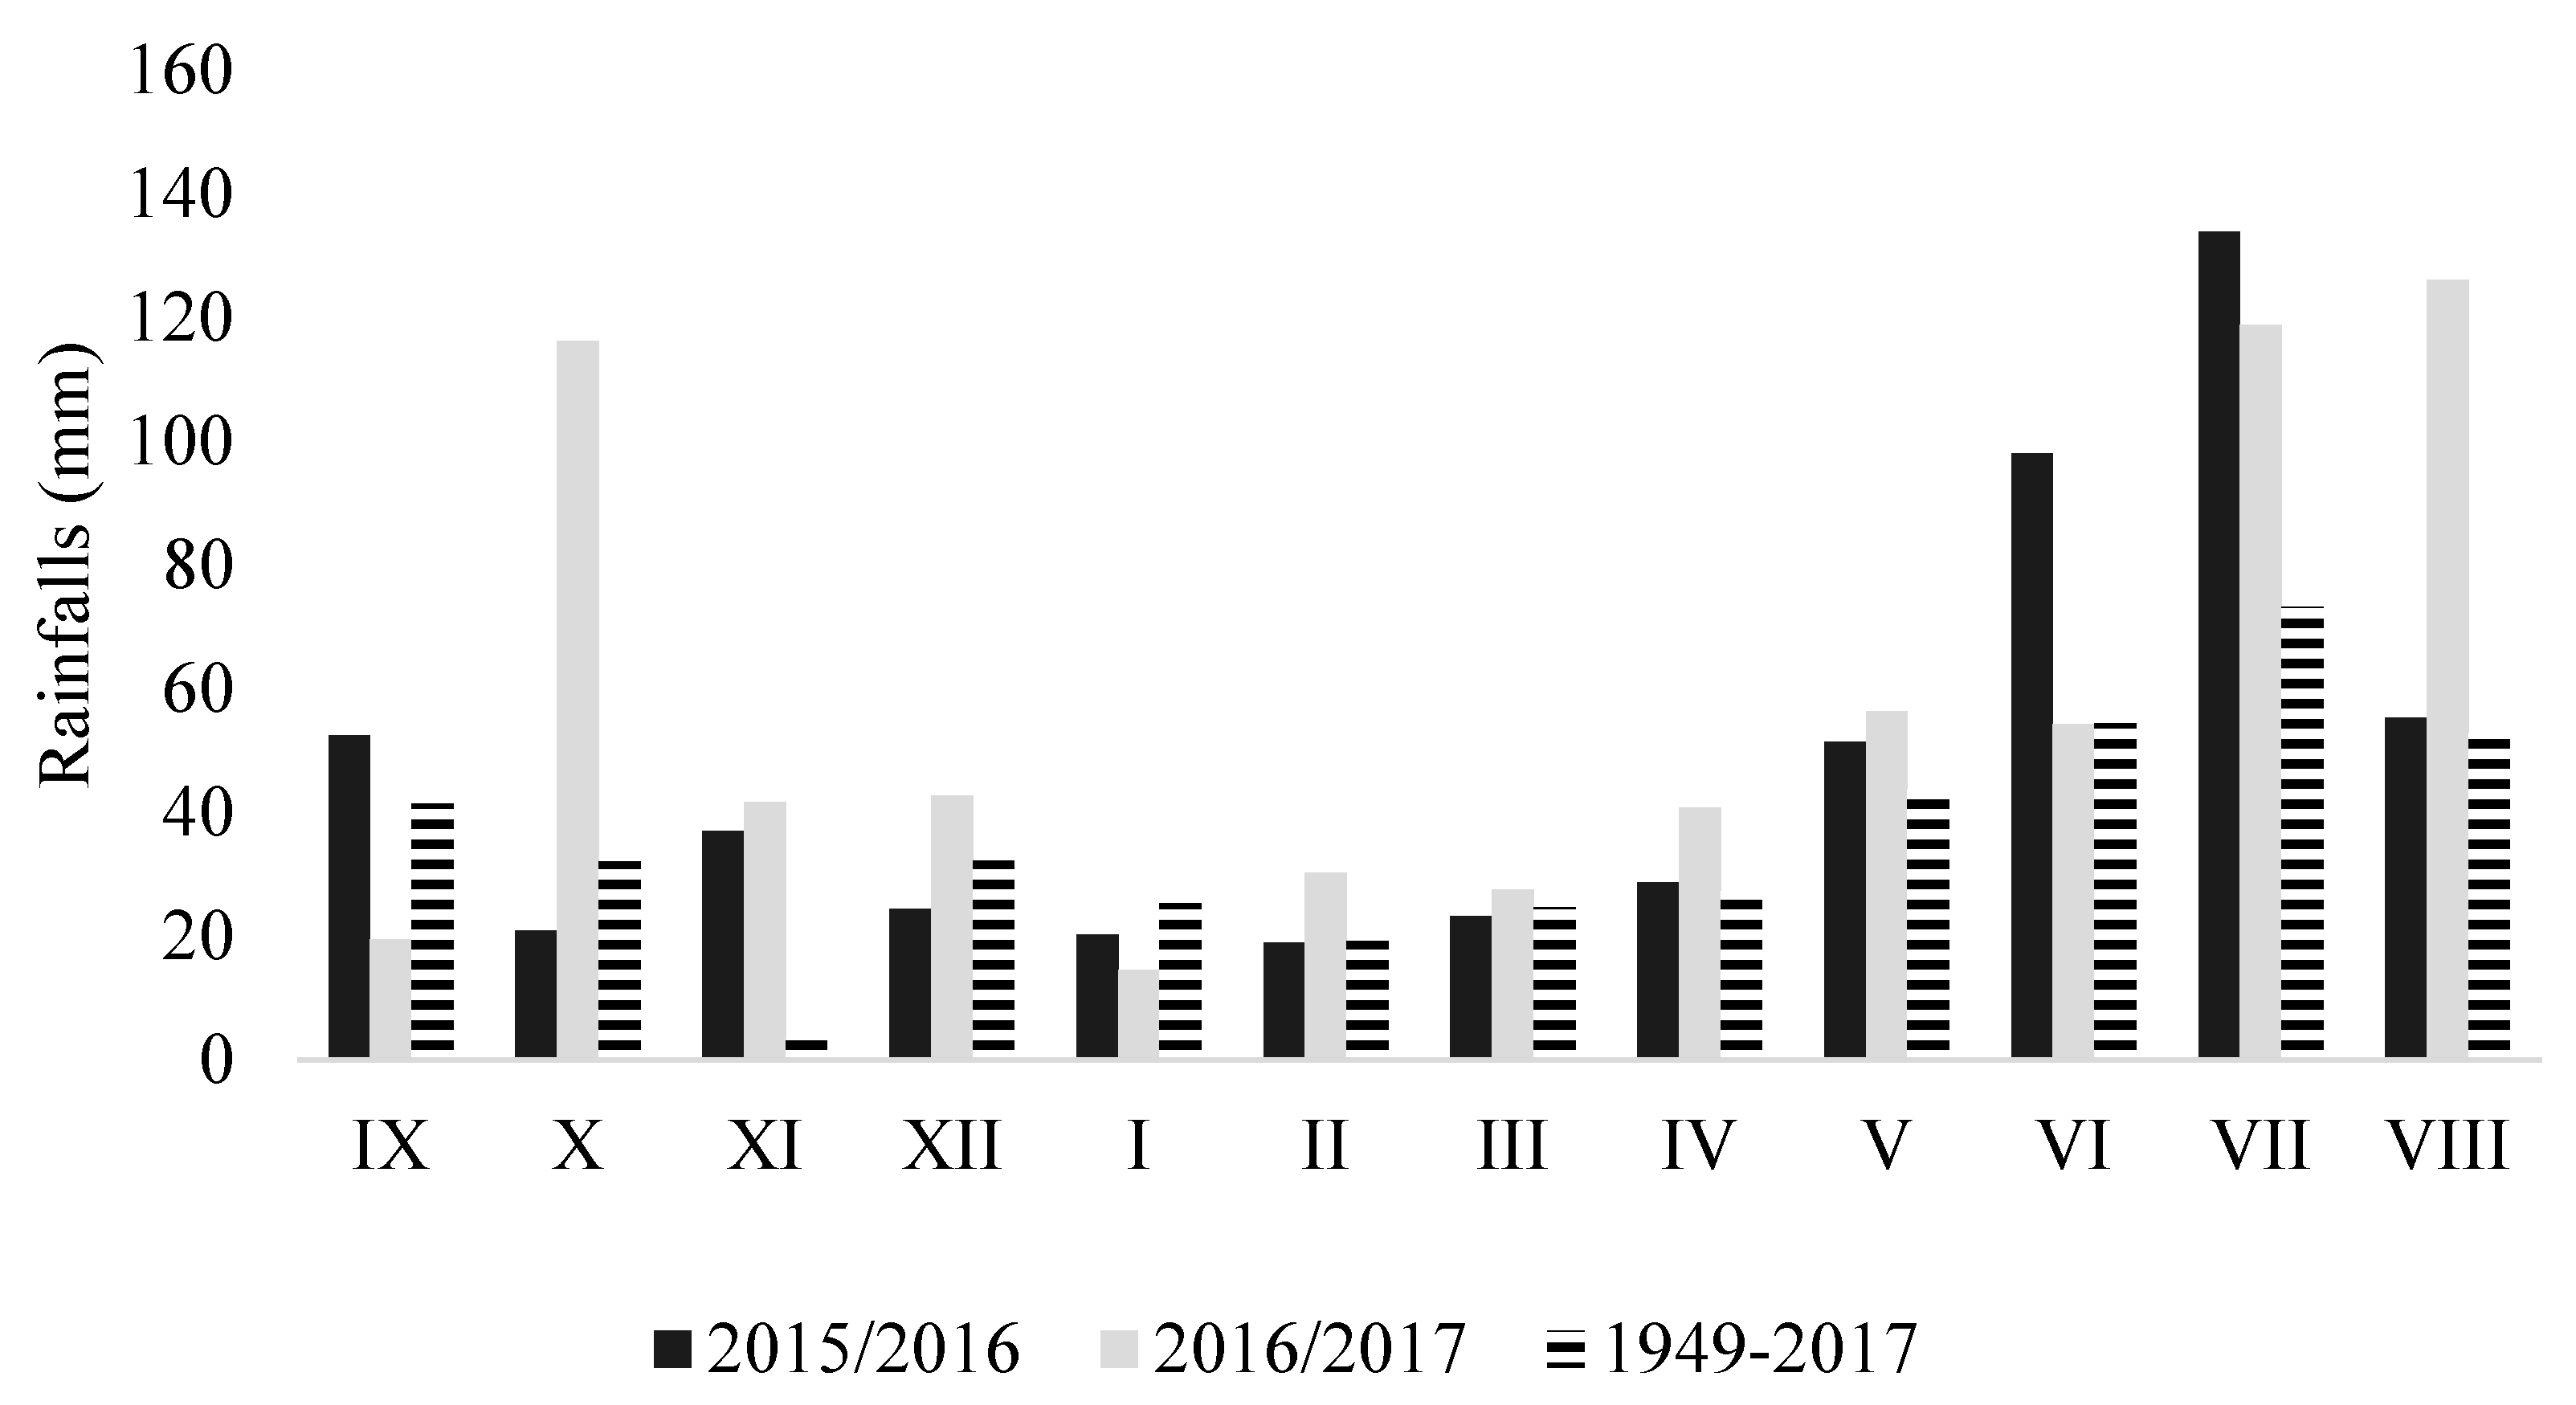
2.4. Meteorological–Standard Measurements from the Measuring Point at the Experimental Station in Mochełek
2.5. Yield and Yield Elements
2.6. Qualitative Markers in Wheat Grain and Flour
2.7. Chemical Analysis
2.8. Statistical Analysis
3. Results
4. Discussion
4.1. Yield and its Components
4.2. Quality Properties of Grain and Dough
4.3. Farinographic Properties of Grain and Flour
4.4. Zinc, Manganese and Potassium Content in Wheat Leaves and Grain Depending on the Habitat and Foliar Fertilization
5. Conclusions
Author Contributions
Funding
Conflicts of Interest
References
- Sobolewska, M.; Stankowski, S. The influence of farming systems on the technological quality of grain and flour cultivars of winter wheat. Ann. UMCS Sect. Agric. 2016, 4, 79–87. [Google Scholar] [CrossRef]
- FAO Statistical Pocket Book: World Food and Agriculture; FAO: Rome, Italy, 2015.
- World Bank. World Bank Country and Lending Groups. Available online: https://datahelpdesk.worldbank.org/knowledgebase/articles/906519-world-bank-country-and-lending-groups (accessed on 17 April 2019).
- Wenda-Piesik, A.; Holkova, L.; Solarova, E.; Pokorny, R. Attributes of wheat cultivars for late autumn sowings in genes expression and field estimates. Eur. J. Agron. 2016, 75, 42–49. [Google Scholar] [CrossRef]
- Parylak, D.; Pytlarz, E. Effects on production of winter wheat in monoculture under reduced tillage. Fragm. Agron. 2013, 30, 114–121. [Google Scholar]
- White, P.J.; Broadley, M.R. Biofortifying crops with essential mineral elements. Trends Plant Sci. 2005, 10, 586–593. [Google Scholar] [CrossRef] [PubMed]
- Kutman, U.B.; Yildiz, B.; Cakmak, I. Improved nitrogen status enhances zinc and iron concentrations both in the whole grain and the endosperm fraction of wheat. J. Cereal Sci. 2011, 53, 118–125. [Google Scholar] [CrossRef]
- Barunawati, N.; Hettwer Giehl, R.F.; Bauer, B.; Von Wirén, N. The influence of inorganic nitrogen fertilizer forms on micronutrient re-translocation and accumulation in grains of winter wheat. Front. Plant Sci. 2013, 4, 1–11. [Google Scholar] [CrossRef] [Green Version]
- Erenoglu, E.B.; Kutman, U.B.; Ceylan, Y.; Yildiz, B.; Cakmak, I. Improved nitrogen nutrition enhances root uptake, root-to-shoot translocation and remobilization of zinc (65Zn) in wheat. New Phytol. 2011, 189, 438–448. [Google Scholar] [CrossRef]
- Kutman, U.B.; Kutman, B.Y.; Ceylan, Y.; Ova, E.A.; Cakmak, I. Contributions of root uptake and remobilization to grain Zinc accumulation in wheat depending on post-anthesis zinc availability and nitrogen nutrition. Plant Soil. 2012, 361, 177–187. [Google Scholar] [CrossRef]
- Hotz, C.; Brown, K.H. Assessment of the risk of Zinc deficiency in populations and options for its control. Food Nutr. Bull. 2004, 2, 194–204. [Google Scholar]
- Cakmak, I.; Pfeiffer, W.; McClafferty, B. Review: Biofortification of Durum Wheat with Zinc and Iron. Cereal Chem. 2010, 87, 10–20. [Google Scholar] [CrossRef] [Green Version]
- Welch, R.M.; Graham, R.D. Breeding for micronutrients in staple food crops from a human nutrition perspective. J. Exp. Bot. 2004, 55, 353–364. [Google Scholar] [CrossRef] [PubMed] [Green Version]
- Shewry, P.R.; Pellny, T.K.; Lovegrove, A. Is modern wheat bad for health. Nat. Plants. 2016, 2, 16097. [Google Scholar] [CrossRef] [PubMed]
- Cakmak, I.; Kutman, U.B. Agronomic biofortification of cereals with zinc: A review. Eur. J. Soil Sci. 2018, 69, 172–180. [Google Scholar] [CrossRef] [Green Version]
- Borrill, P.; Connorton, J.M.; Balk, J.; Miller, A.J.; Sanders, D.; Uauy, C. Biofortification of wheat grain with iron and zinc: Integrating novel genomic resources and knowledge from model crops. Front. Plant Sci. 2014, 5, 1–8. [Google Scholar] [CrossRef] [Green Version]
- de Valença, A.W.; Bake, A.; Brouwer, I.D.; Giller, K.E. Agronomic bio fortification of crops to fight hidden hunger in sub-Saharan Africa. Blob. Food Secur. 2017, 12, 8–14. [Google Scholar] [CrossRef]
- Frossard, E.; Bucher, M.; Mächler, F.; Mozafar, A.; Hurrell, R. Potential for increasing the content and bioavailability of Fe, Zn and Ca in plants for human nutrition. J. Sci. Food Agric. 2000, 80, 861–879. [Google Scholar] [CrossRef]
- Cakmak, I. Enrichment of cereal grains with zinc: Agronomic or genetic biofortification? Plant Soil. 2008, 302, 1–17. [Google Scholar] [CrossRef]
- Zou, C.Q.; Zhang, Y.Q.; Rashid, A.; Ram, H.; Savasli, E.; Arisoy, R.Z.; Ortiz-Monasterio, I.; Simunji, S.; Wang, Z.H.; Sohu, V.; et al. Biofortification of wheat with zinc through zinc fertilization in seven countries. Plant Soil. 2012, 361, 119–130. [Google Scholar] [CrossRef]
- Li, M.; Wang, S.; Tian, X.; Li, S.; Chen, Y.; Jia, Z.; Liu, K.; Zhao, A. Zinc and iron concentrations in grain milling fractions through combined foliar applications of Zn and macronutrients. Field Crops Res. 2016, 187, 135–141. [Google Scholar] [CrossRef]
- Pataco, I.M.; Lidon, F.C.; Ramos, I.; Oliveira, K.; Guerra, M.; Pessoa, M.F.; Carvalho, M.L.; Ramalho, J.C.; Leitão, A.E.; Santos, J.P.; et al. Biofortification of durum wheat (Triticum turgidum L. ssp. durum (Desf.) Husnot) grains with nutrients. J. Plant Int. 2017, 12, 39–50. [Google Scholar]
- Cakmak, I.; Kalayci, M.; Kaya, Y.; Torun, A.; Aydin, N.; Wang, Y. Biofortification and localization of zinc in wheat grain. J. Agric. Food Chem. 2010, 58, 9092–9102. [Google Scholar] [CrossRef] [PubMed]
- Kutman, U.B.; Yildiz, B.; Cakmak, I. Effect of nitrogen on uptake, remobilization and partitioning of zinc andiron throughout the development of durum wheat. Plant Soil. 2011, 342, 149–164. [Google Scholar] [CrossRef]
- Singh, B.R.; Timsina, Y.N.; Lind, O.C.; Cagno, S.; Jenssen, K. Zinc and iron concentration as affected by nitrogen, fertilization and their localization in wheat grain. Fron. Plant. Sci. 2018, 9, 307. [Google Scholar] [CrossRef] [Green Version]
- Rozbicki, J.; Ceglińska, A.; Gozdowski, D.; Jakubczak, M.; Cacak Pietrzak, G.; Mądry, W.; Golbad, J.; Piechociński, M.; Sobczyński, G.; Studnicki, M.; et al. Influence of the cultivar, environment and management on the grain yield and bread-making quality in winter wheat. J. Cereal Sci. 2015, 61, 126–132. [Google Scholar] [CrossRef]
- Stępień, A.; Wojtkowiak, K.; Skłodowski, M.; Pietrusiewicz, M. Effect of foliar fertilization (Cu, Zn and Mn) on grain quality indicators and yield components of winter spelt (Triticum aestivum ssp. spelta L.). Fragm. Agron. 2017, 34, 97–108. [Google Scholar]
- Knapowski, T.; Spychaj-Fabisiak, E.; Kozera, W.; Barczak, B.; Murawska, B. Mineral fertilization and baking value of grain and flour of Triticum aestivum ssp. spelta L. Am. J. Exp. Agric. 2016, 11, 1–11. [Google Scholar] [CrossRef]
- Jaskulski, D.; Jaskulska, I. Production effect of foliar application of magnesium-and-microelement fertilizer Sonata on the cultivation of winter wheat depending on the rainfall and soil richness. Zeszt. Probl. Post. Nauk Rol. 2009, 541, 157–164. [Google Scholar]
- Babulicová, M.; Gavurníková, S. The influence of cereal share in crop rotations on the grain yield and quality of winter wheat. Agriculture 2015, 61, 12–21. [Google Scholar] [CrossRef]
- Babulicová, M. The influence of fertilization and crop rotation on the winter wheat production. Plant Soil Environ. 2014, 60, 297–302. [Google Scholar] [CrossRef] [Green Version]
- Jankowski, K.J.; Budzyński, W.S.; Dubis, B. Correlations between the yield components and grain yield of winter wheat (Triticum aestivum ssp. vulgare L.) grown after winter rapeseed. Oilseed Crops 2015, 36, 26–38. [Google Scholar]
- Weiser, C.; Fuß, R.; Kage, H.; Flessa, H. Do farmers in Germany exploit the potential yield and nitrogen benefits from preceding oilseed rape in winter wheat cultivation? Arch. Agron. Soil Sci. 2018, 64, 25–37. [Google Scholar] [CrossRef]
- Pszczółkowska, A.; Okorski, A.; Olszewski, J.; Fordoński, G.; Krzebietke, S.; Chareńska, A. Effects of pre-preceding leguminous crops on yield and chemical composition of winter wheat grain. Plant Soil Environ. 2018, 64, 592–596. [Google Scholar] [CrossRef]
- Ignaczak, S. Productivity of seed plantations of fodder galega (Galega orientalis Lam.) cultivated extensively. J. Res. Appl. Agric. Engin. 2010, 55, 122–127. [Google Scholar]
- Kaczmarska, M.; Gawrońska-Kulesza, A. Effect of crop rotation on winter wheat yield. Post. Nauk Rol. 2000, 4, 51–63. [Google Scholar]
- ICC. International Association for Cereal Science and Technology (ICC) Standard Method No.107/1. Determination of the “falling number” According to Hagberg-Perten as a Measure of the Degree of Alpha-amylase Activity in Grain and Flour; ICC Secretariat: Vienna, Austria, 1995. [Google Scholar]
- ICC. nternational Association For Cereal Science And Technology (ICC) Standard Method No. 116/1. Determination of Sedimentation Value (Ac. to Zeleny) as an Approximate Measure of Baking Quality; ICC Secretariat: Vienna, Austria, 1994. [Google Scholar]
- ICC. International Association for Cereal Science and Technology (ICC) Standard Method No. 155. Determination of Wet Gluten Quantity and Quality of whole Wheat Meal and Wheat Flour; ICC Secretariat: Vienna, Austria, 1994. [Google Scholar]
- AACC. Approved Methods of The American Association of Cereal Chemists, 10th ed.; AACC: Saint Paul, MN, USA, 2000. [Google Scholar]
- Egner, H.; Riehm, H.; Domingo, W.R. Untersuchungen über die chemische Bodenanalyse als Grundlage für die Beurteilung des Nahrstoffzustandes der Boden, II: Chemische Extractionsmetoden zu Phosphorund Kaliumbestimmung. Kungliga Lantbrukshügskolans. Annaler. 1960, 26, 199–215. [Google Scholar]
- PN-ISO 13536. Soil quality. Determination of the potential cation exchange capacity and exchangeable catios using barium chloride solution buffored at pH = 8.1; Wydaw. Normaliz.: Warszawa, Poland, 2002. [Google Scholar]
- Faligowska, A.; Szymańska, G.; Panasiewicz, K.; Szukała, J.; Koziara, W.; Ratajczak, K. The long-term effect of legumes as forecrops on the productivity of rotation (winter rape-winter wheat-winter wheat) with nitrogen fertilization. Plant Soil Environ. 2019, 65, 138–144. [Google Scholar] [CrossRef]
- Knapowski, T.; Barczak, B.; Kozera, W.; Wszelaczyńska, E.; Pobereżny, J. Crop stimulants as a factor determining the yield and quality of winter wheat grown in Notec Valley. Curr. Sci. 2019, 116, 1009–1015. [Google Scholar] [CrossRef]
- Asseng, S.; Foster, I.; Turner, N.C. The impact of temperature variability on wheat yields. Glob. Chang. Biol. 2011, 17, 997–1012. [Google Scholar]
- Lobell, D.B.; Sibley, A.; Ortiz-Monasterio, J.I. Extreme heat effects on wheat senescence in India. Nat. Clim. Chang. 2012, 2, 186–189. [Google Scholar] [CrossRef]
- Bujak, H.; Trawal, G.; Weber, R.; Kaczmarek, J. An analysis of spatial similarity in the variability of yields of winter wheat (Triticum aestivum L.) cultivars in Western Poland. Zemdirb. Agric. 2013, 100, 311–316. [Google Scholar] [CrossRef] [Green Version]
- Erekul, O.; Kohn, W. Effect of weather and soil conditions on yield components and bread-making quality of winter wheat (Triticum aestivum L.) and winter triticale (Triticosecale Wittm.) varieties in North-East Germany. J Agron. Crop Sci. 2006, 192, 452–464. [Google Scholar] [CrossRef]
- Kozak, M. Analysis of cause-and-effect relationships in agronomy and plant breeding. Biul. IHAR 2011, 259, 3–21. [Google Scholar]
- Griffiths, S.; Wingen, L.; Pietragalla, J.; Garcia, G.; Hasan, A.; Miralles, D.; Calderini, D.F.; Ankleshwaria, J.B.; Waite, M.L.; Simmonds, J.; et al. Genetic dissection of grain size and grain number trade-offs in CIMMYT wheat germplasm. PLoS ONE 2015. [Google Scholar] [CrossRef] [Green Version]
- Weber, R.; Biskupski, A. Influence of seeding density and seeding date on the characters of yield structure components and the yield of winter wheat cultivars on light soil. Acta Sci. Pol. Agric. 2007, 6, 77–85. [Google Scholar]
- Sadras, V.O. Evolutionary aspects of the trade-off between seed size and number in crops. Field Crop Res. 2007, 100, 125–138. [Google Scholar] [CrossRef]
- Zeidan, M.S.; Mohamed, M.F.; Hamouda, H.A. Effect of foliar fertilization of Fe, Mn and Zn on wheat yield and quality in low sandy soils fertility. World J. Agric. Sci. 2010, 6, 696–699. [Google Scholar]
- Abbasi, A.; Shekari, F.; Mousavi, S.B.; Sabaghnia, N. Assessment of the effect of zinc sulfate biofortification on the quality and quantity characteristics of spring wheat cultivars. Adv. Biores. 2016, 7, 18–25. [Google Scholar]
- Sultana, S.; Naser, H.M.; Shil, N.C.; Akhter, S.; Begum, R.A. Effect of foliar application of zinc on yield of wheat grown by avoiding irrigation at different growth stages. Bangladesh J. Agr. Res. 2016, 41, 323–334. [Google Scholar] [CrossRef]
- Esfandiari, E.; Abdoli, M.; Mousavi, S.B.; Sadeghzadeh, B. Impact of foliar zinc application on agronomic traits and grain quality parameters of wheat grown in zinc deficient soil. Indian J. Plant Physiol. 2016, 21, 263–270. [Google Scholar] [CrossRef]
- Gonzalez, C.; Zheng, Y.; Lovatt, C.J. Properly timed foliar fertilization can and should result in a yield benefit and net increase in grower income. Acta Hort. 2010, 868, 273–286. [Google Scholar] [CrossRef]
- Rerkasem, B.; Sangruan, P.; Prom-u-thai, C.T. Effect of polishing time on distribution of monomeric anthocyanin, iron and zinc content in different grain layers of four Thai purple rice varieties. Int. J. Agric. Biol. 2015, 17, 828–832. [Google Scholar] [CrossRef]
- El-Dahshouri, M.F.; El-Fouly, R.K.; Khalifa, M.; Abd El-Ghany, H.M. Effect of zinc foliar application at different physiological growth stages on yield and quality of wheat under sandy soil conditions. Agric. Eng. Int. 2017, special issue, 193–200. [Google Scholar]
- Han, J.L.; Li, Y.M.; Ma, C.Y. The impact of zinc on crop growth and yield (review). J. Hebei Normal Univ. Sci. Technol. 2004, 18, 72–75. [Google Scholar]
- Hänsch, R.; Mendel, R.R. Physiological functions of mineral micronutrients (Cu, Zn, Mn, Fe, Ni, Mo, B, Cl). Curr. Opin. Plant Biol. 2009, 12, 259–266. [Google Scholar] [CrossRef]
- Zafar, S.; Yasin, M.A.; Anwar, S.; Qasim, A.; Noman, A. Yield enhancement in wheat by soil and foliar fertilization of K and Zn under saline environment. Soil Environ. 2016, 35, 46–55. [Google Scholar]
- Yosefi, K.M.; Galavi, M.; Ramrodi, M.; Mousavi, S.R. Effect of bio-phosphate and chemical phosphorus fertilizer companied with micronutrient foliar application on growth, yield and yield components of maize (Single Cross 704). Aust. J. Crop Sci. 2011, 5, 175–180. [Google Scholar]
- Iqbal, J.S.; Kanwal, S.; Hussain, T.A.; Maqsood, M.A. Zinc application improves maize performance through ionic homeostasis and ameliorating devastating effects of brackish water. Int. J. Agric. Biol. 2014, 16, 383–388. [Google Scholar]
- Knapowski, T.; Ralcewicz, M.; Spychaj-Fabisiak, E.; Ložek, O. Grain Quality evaluation in winter wheat grown as exposed to varied nitrogen fertilisation. Fragm. Agron. 2010, 27, 73–80. [Google Scholar]
- Silva, R.R.; Benin, G.; de Almeida, J.L.; de Batista Fonseca, I.C.; Zucareli, C. Grain yield and baking quality of wheat under different sowing dates. Acta Sci. Agron. 2014, 36, 201–210. [Google Scholar] [CrossRef] [Green Version]
- Harasim, E.; Wesołowski, M. Yield and some quality traits of winter wheat (Triticum aestivum L.) grain as influenced by the application of different rates of nitrogen. Acta Agrobot. 2013, 66, 67–72. [Google Scholar] [CrossRef] [Green Version]
- Makawi, A.B.; Ishag, M.; Mahmood, M.I.; Hassan, H.A.R.; Ahmed, I.A.M. Grains quality characteristics of local wheat (Triticum aestivum) cultivars grown at Khartoum State, Sudan. Int. J. Life Sci. 2013, 7, 12–16. [Google Scholar] [CrossRef] [Green Version]
- Nuttalla, J.G.; O’Learya, G.J.; Panozzoa, F.; Walkera, C.K.; Barlowb, K.M.; Fitzgeralda, G.J. Models of grain quality in wheat—A review. Field Crop Res. 2017, 202, 136–145. [Google Scholar] [CrossRef] [Green Version]
- Campillo, R.; Jobet, C.; Undurraga, P. Effects of nitrogen on productivity, grain quality, and optimal nitrogen rates in winter wheat cv. Kumpa-INIA in andisols of southern Chile. Chil. J. Agric. Res. 2010, 70, 122–131. [Google Scholar] [CrossRef] [Green Version]
- Matus, I.; Madariaga, R.; Jobet, C.; Zúñiga, J.; Kipa, C. INIA, new high yield spring bread wheat variety for Chile. Chil. J. Agric. Res. 2011, 71, 323–328. [Google Scholar] [CrossRef] [Green Version]
- Wanic, M.; Denert, M.; Treder, K. Effect of forecrops on the yield and quality of common wheat and spelt wheat grain. J. Elem. 2019, 24, 369–383. [Google Scholar] [CrossRef]
- Stępień, A.; Wojtkowiak, K.; Orzech, K.; Wiktorski, A. Nutritional and technological characteristics of common and spelt wheats are affected by mineral fertilizer and organic stimulator nano-gro. Acta Sci. Pol. Agric. 2016, 15, 49–63. [Google Scholar]
- Başlar, M.; Ertugay, M.F. Determination of protein and gluten quality-related parameters of wheat flour using near-infrared reflectance spectroscopy (NIRS). Turk. J. Agri. For. 2011, 35, 139–144. [Google Scholar]
- Chwil, S. Effects of foliar feeding under different soil fertilization conditions on the yield structure and quality of winter wheat (Triticum Aestivum L.). Acta Agrobot. 2014, 67, 135–144. [Google Scholar] [CrossRef] [Green Version]
- Daniel, C.; Triboi, E. Changes in wheat protein aggregation during grain development: effects of temperatures and water stress. Eur. J. Agron. 2002, 16, 1–12. [Google Scholar] [CrossRef]
- Linina, A.; Ruza, A. Weather conditions effect on fresh and stored winter wheat grain gluten quantity and quality. In Proceedings of the Nordic view to sustainable rural development, 25th congress, Riga, Latvia, 16–18 June 2015. [Google Scholar]
- Varga, B.; Svečnjak, Z.; Jurković, Z.; Kovačević, J.; Jukić Željko, J. Wheat grain and flour quality as affected by cropping intensity. Food Technol. Biotechnol. 2003, 41, 321–329. [Google Scholar]
- Fernando, N.; Panozzo, J.; Tausz, M.; Norton, R.; Fitzgerald, G.; Seneweera, S. Rising atmospheric CO2 concentration affects mineral nutrient and protein concentration of wheat grain. Food Chem. 2012, 133, 1307–1311. [Google Scholar] [CrossRef]
- Tomić, J.M.; Torbica, A.M.; Popović, L.M.; Rakita, S.M.; Živančev, D.R. Bread making potential and proteolytic activity of wheat varieties from two production years with different climate conditions. Food Feed Res. 2015, 42, 83–90. [Google Scholar] [CrossRef]
- Nikolić, N.Č.; Stojanović, J.S.; Gordana, S.; Stojanović, G.S.; Mastilović, J.S.; Karabegović, I.T.; Petrović, G.M.; Lazić, M.L. The effect of some protein rich flours on farinograph properties of the wheat flour. Advanced Technol. 2013, 2, 20–25. [Google Scholar]
- Klikocka, H.; Marks, M. Sulphur and Nitrogen Fertilization as a Potential Means of Agronomic Biofortification to Improve the Content and Uptake of Microelements in Spring Wheat Grain DM. J. Chem. 2018, 1–20. [Google Scholar] [CrossRef]
- Hao, Z.; Tian, J.C.; Sun, Y.; Jiang, X.L. Correlation analysis between contents of Cu, Fe, Zn, Mn and pigmentation of testa in different color wheat. J. Chin. Cereals Oils Assoc. 2008, 23, 12–16. [Google Scholar]
- Jiang, L.N.; Hao, B.Z.; Zhang, D.J.; Shao, Y.; Li, C.X. Genotypic and environmental differences in grain contents of Zn, Fe, Mn and Cu and how they relate to wheat yield. Chin. J. Eco-Agric. 2010, 18, 982–987. [Google Scholar] [CrossRef]
- Rafique, E.; Rashid, A.; Ryan, J.; Bhatti, A.U. Zinc deficiency in rainfed wheat in Pakistan: magnitude, spatial variability, management, and plant analysis diagnostic norms. Commun. Soil Sci. Plant Anal. 2006, 37, 181–197. [Google Scholar] [CrossRef]
- Niyigaba, E.; Twizerimana, A.; Mugenzi, I.; Ngnadong, W.A.; Ye, Y.P.; Wu, B.M.; Hai, J.B. Winter wheat grain quality, zinc and iron concentration affected by a combined foliar spray of zinc and iron fertilizers. Agron. J. 2019, 9, 250. [Google Scholar] [CrossRef] [Green Version]
- Gomaa, M.A.; Radwan, F.I.; Kandil, E.E.; El-Zweek, S.M.A. Effect of some macro and micronutrients application methods on productivity and quality of wheat (Triticum aestivum, L.). Middle East J. Agric. Res. 2015, 4, 01–11. [Google Scholar]
- Arif, M.; Khan, M.A.; Akbar, H.; Ali, S. Respects of wheat as a dual purpose crop and its impact on weeds. Pak. J. Weed Sci. Res. 2006, 12, 13–17. [Google Scholar]
- Wojtkowiak, K.; Stępień, A. Nutritive value of spelt (Triticum aestivum spp. spelta L.) as influenced by the foliar application of copper, zinc and manganese. Zemdirbyste 2015, 102, 389–396. [Google Scholar] [CrossRef] [Green Version]

| Compound | H1 | H2 | |
|---|---|---|---|
| 2015 | 2016 | 2015 | |
| P available | 95.9 | 135.4 | 273.0 |
| K available | 167.6 | 179.2 | 336.6 |
| Mg replaceable | 54.5 | 57.2 | 66.2 |
| Year | Date | |||
|---|---|---|---|---|
| Sowing | Foliar Fertilization | Foliar Sampling | Harvest | |
| 2015/2016 | 01.10.2015 | 19.05.2016 03.06.2016 | 03.06.2016 18.06.2016 | 08.08.2016 H1 12.08.2016 H2 |
| 2016/2017 | 29.09.2016 | 24.05.2017 10.06.2017 | 08.06.2017 25.06.2017 | 15.08.2017 H1 20.08.2017 H2 |
| Characteristic | Y | H | Y * H | F | Y * F | H * F | Y * H * F | V% |
|---|---|---|---|---|---|---|---|---|
| TKW (g) | ** | ns | ns | ns | ns | ns | ns | 2.1 |
| Test Weight (kg hL−1) | ** | ns | ns | ns | ns | ns | ns | 3.6 |
| Grain Fraction >2.2 mm (%) | ns | ns | ns | ns | ns | ns | ns | 3.2 |
| Falling Number (s) | ** | ns | ns | ns | ns | ns | ns | 6.3 |
| Protein Content (%) | ** | ** | ns | ns | ns | ns | ns | 3.4 |
| Gluten Content (%) | ** | ** | ns | ns | ns | ns | ns | 5.9 |
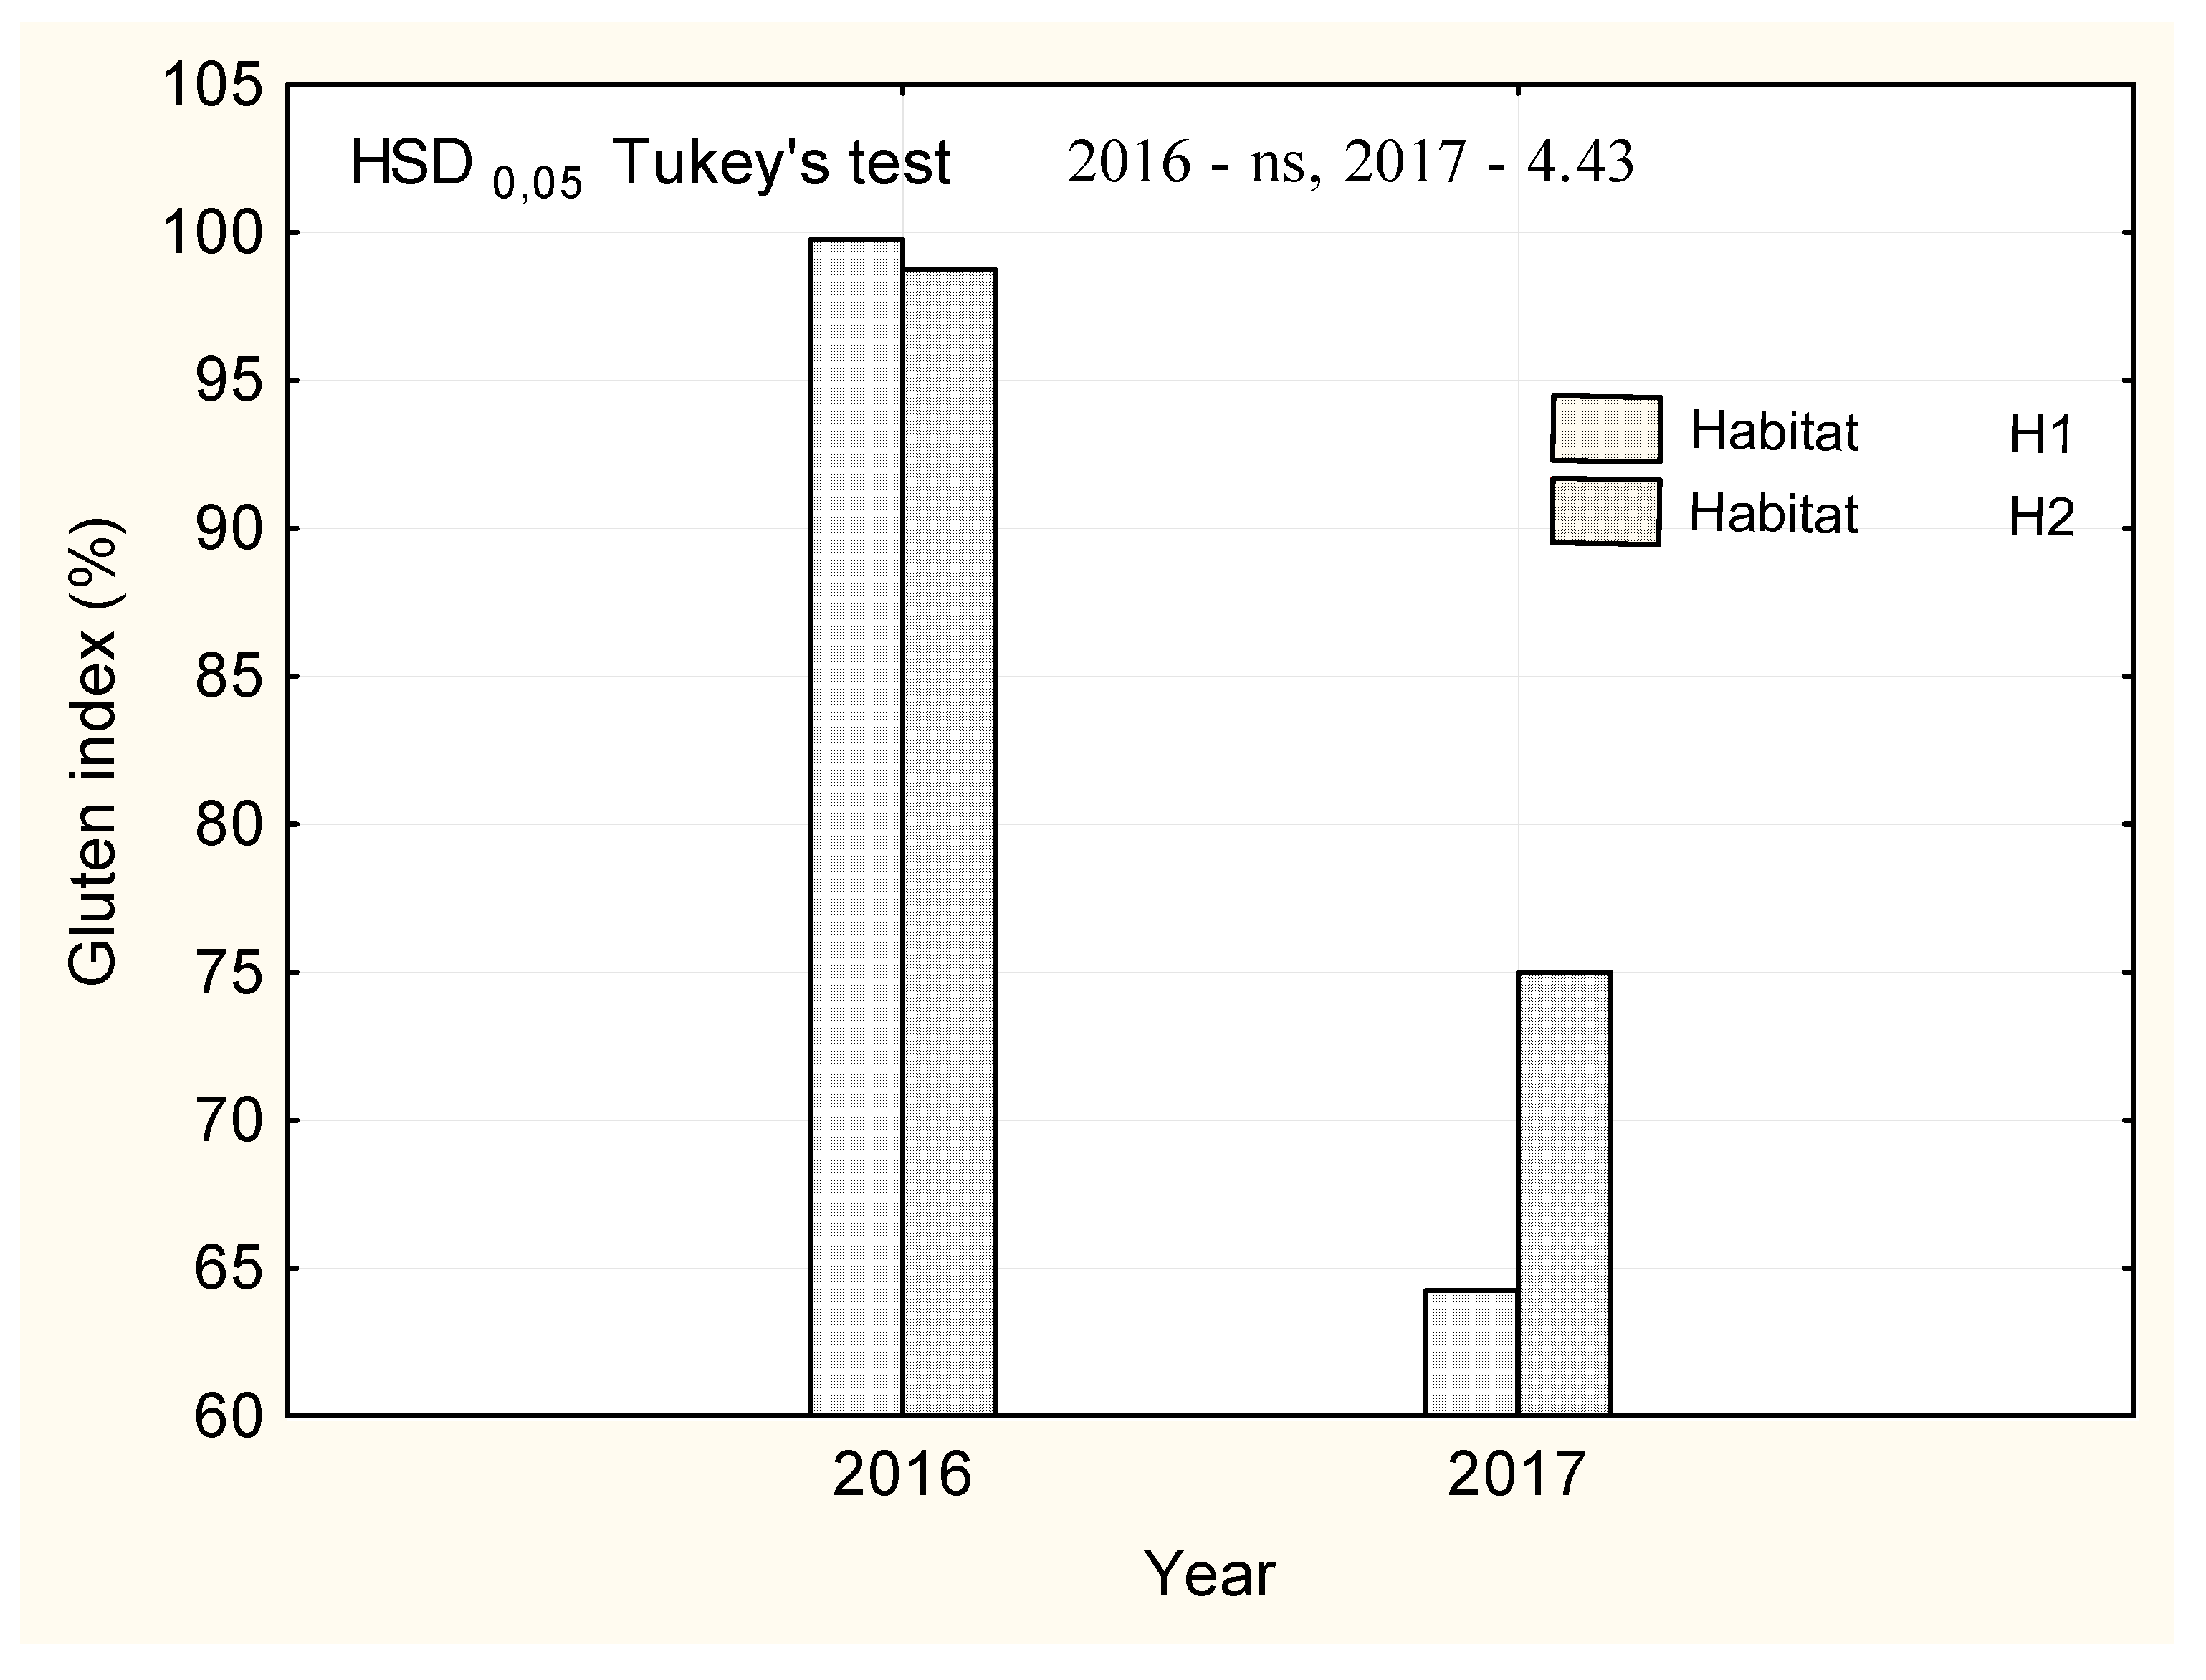
| Gluten Index (%) | ns | ns | * | * | ns | ns | ns | 5.3 |
| Zeleny Test (mL) | ** | ** | ns | ns | ns | ns | ns | 4.3 |
| Water Absorption (%) | ** | ** | ns | ns | ns | ns | ns | 4.7 |
| Development Time (min) | ns | ** | ns | ns | ns | ns | ns | 8.7 |
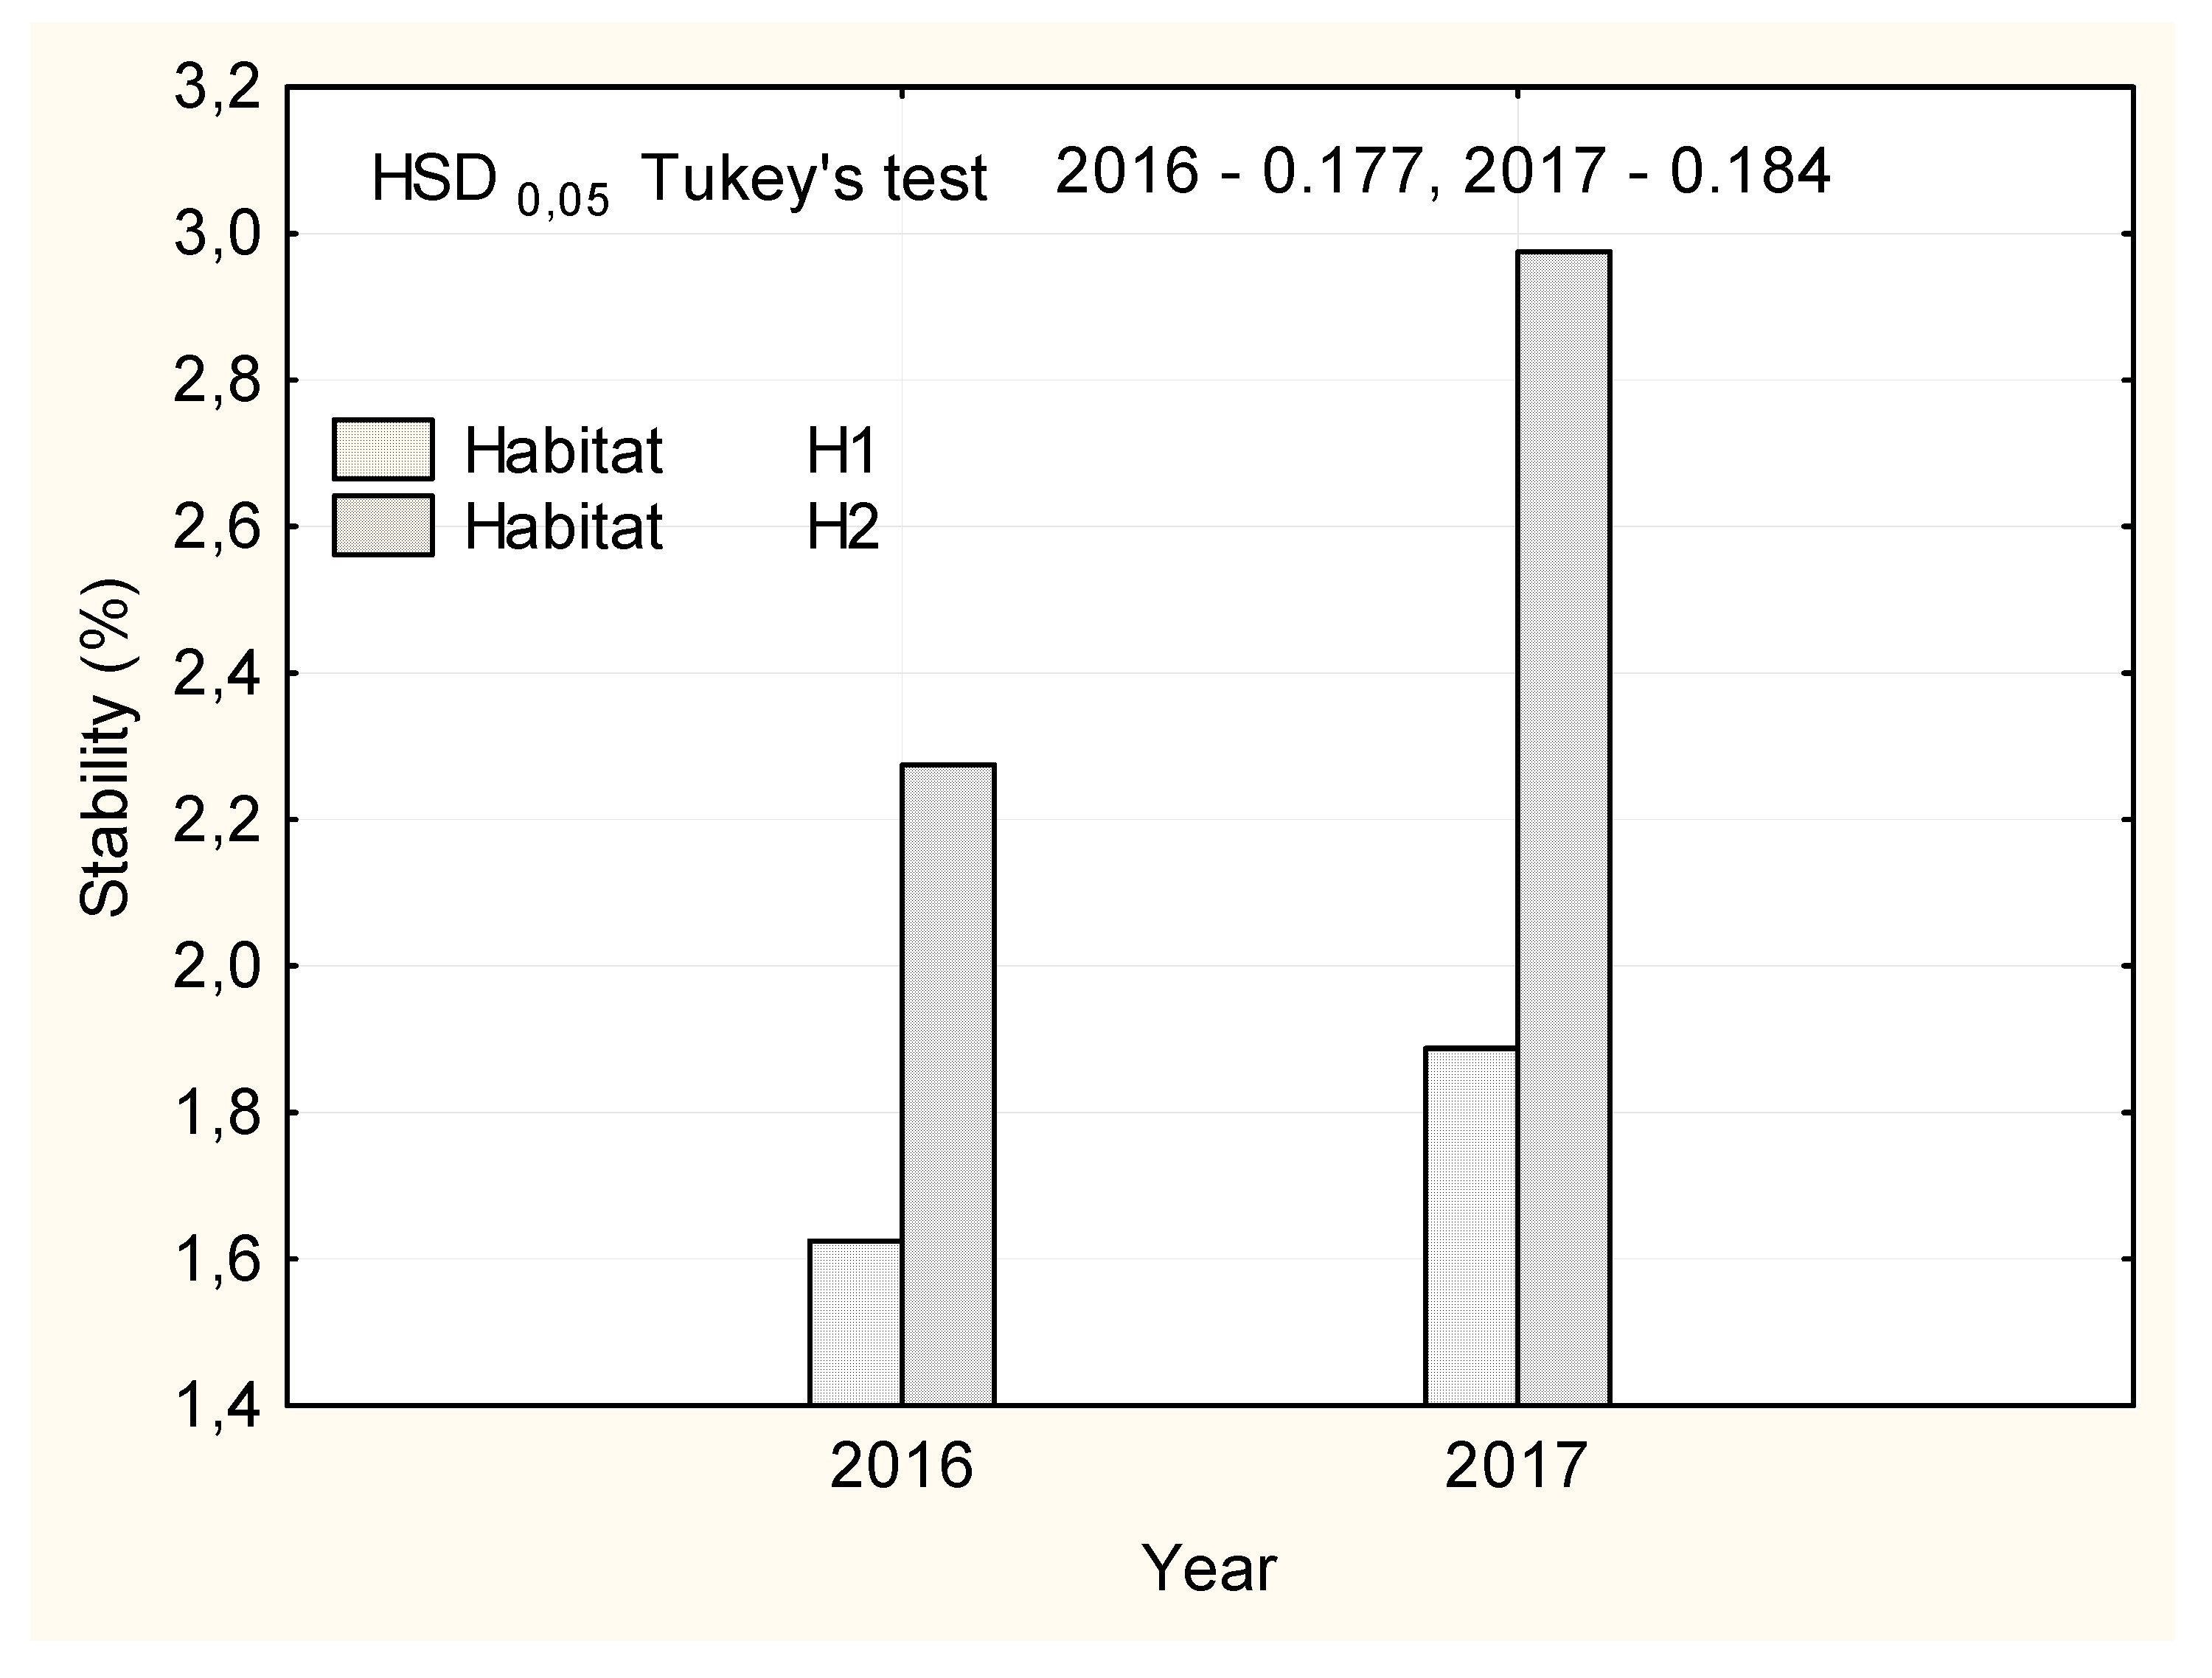
| Stability (min) | ** | ** | ** | ** | ns | ns | ns | 7.6 |
| Degree of Softening (FU) | ns | ns | ns | ns | ns | ns | ns | 6.6 |
| Factor | Variant | TKW (g) | Test Weight (kg hL−1) | Grain Fraction >2.2 mm (%) |
|---|---|---|---|---|
| Habitat (H) | H1 | 42.2 a# | 77.4 a | 98.7 a |
| H2 | 42.3 a | 78.9 a | 98.6 a | |
| Foliar Fertilization (F) | F0 | 42.2 a | 78.4 a | 99.0 a |
| F1 | 42.0 a | 78.2 a | 98.5 a | |
| F2 | 42.3 a | 77.8 a | 98.5 a | |
| F3 | 42.4 a | 78.2 a | 98.5 a | |
| Year (Y) | 2016 | 40.6 b | 76.8 b | 97.6 a |
| 2017 | 43.9 a | 78.9 a | 99.7 a | |
| Mean | 42.2 | 78.2 | 98.6 | |
| Factor | Variant | Falling Number (s) | Protein Content (%) | Gluten Content (%) | Gluten Index (%) | Zeleny Test (mL) |
|---|---|---|---|---|---|---|
| Habitat (H) | H1 | 317 a# | 12.7 b | 29.8 b | 82.9 a | 24.2 |
| H2 | 312 a | 13.6 a | 33.8 a | 86,9 a | 27.4 | |
| Foliar Fertilization (F) | F0 | 286 b | 12.9 a | 31.3 a | 83.4 a | 26.3 |
| F1 | 318 ab | 13.4 a | 31.6 a | 83.8 a | 25.0 | |
| F2 | 319 ab | 13.1 a | 32.2 a | 85.0 a | 25.5 | |
| F3 | 335 a | 13.2 a | 31.5 a | 85.5 a | 26.6 | |
| Year (Y) | 2016 | 296 b | 12.7 b | 28,1 b | 99.2 a | 14.4 |
| 2017 | 330 a | 13.5 a | 35.2 a | 70.7 b | 27.4 | |
| Mean | 315 | 13.1 | 31.7 | 84.9 | 25.9 | |
| Factor | Variant | Water Absorption (%) | Development Time (min) | Stability (min) | Degree of Softening (FU) |
|---|---|---|---|---|---|
| Habitat (H) | H1 | 45.2 b | 1.83 a | 1.76 b | 77.6 a |
| H2 | 48.9 a | 2.09 b | 2.62 a | 79.5 a | |
| Foliar Fertilization (F) | F0 | 47.4 a | 1.88 a | 2.20 a | 78.6 a |
| F1 | 46.0 a | 1.88 a | 2.16 a | 79.6 a | |
| F2 | 46.9 a | 2.12 a | 2.22 a | 78.0 a | |
| F3 | 47.5 a | 1.98 a | 2.18 a | 77.8 a | |
| Year (Y) | 2016 | 56.5 a | 1.95 a | 1.95 b | 72.1 b |
| 2017 | 37.4 b | 1.98 a | 2.41 a | 85.0 a | |
| Mean | 46.9 | 1.96 | 2.19 | 78.6 | |
| Characteristic | Regression Equation | r | r2 |
|---|---|---|---|
| Gluten Content (%) | Y = −44.0 + 5.86 x | +0.82 | 0.672 |
| Gluten Index (%) | Y = 245 − 12.2 x | −0.50 | 0.250 |
| Zeleny Test (mL) | Y = −150 + 13.4 x | +0.73 | 0.533 |
| Water Absorption (%) | Y = 18.9 + 2.99 x | +0.88 | 0.744 |
| Stability (min) | Y = −7.22 + 0.73 x | +0.91 | 0.828 |
| Habitat (H) | Foliar Fertilization (F) | Number of Ears per m2 | Number of Kernels per Ear | Ear Length (cm) | TKW (g) | Grain (t ha−1) |
|---|---|---|---|---|---|---|
| H1 | F0 | 443 ± 20.9 | 26.6 ± 2.37 | 6.98 ± 0.45 c | 37.9 ± 0.80 | 4.99 ± 0.11c |
| F1 | 408 ± 22.9 | 33.3 ± 3.92 | 8.22 ± 0.26 a | 43.3 ± 0.56 | 5.90 ± 0.10 a | |
| F2 | 412 ± 24.9 | 32.0 ± 3.34 | 7.81 ± 0.54 ab | 44.5 ± 1.31 | 5.60 ± 0.15 ab | |
| F3 | 448 ± 8.4 | 1.0 ± 3.43 | 7.17 ± 0.36 bc | 44.9 ± 1.43 | 5.49 ± 0.12 abc | |
| Mean | 428 ± 10.2 | 30.7 ± 3.79 B | 7.54 ± 0.63 B | 42.7 ± 0.87A | 5.50 ± 0.08 A | |
| H2 | F0 | 424 ± 16.0 | 31.0 ± 4.41 | 7.88 ± 0.27 abc | 28.0 ± 0.80 | 3.96 ± 0.10 d |
| F1 | 400 ± 20.5 | 34.0 ± 5.16 | 7.98 ± 0.26 abc | 33.6 ± 1.44 | 5.07 ± 0.16 ab | |
| F2 | 395 ± 17.0 | 35.0 ± 3.34 | 8.17 ± 0.61 ab | 34.4 ± 1.29 | 4.98 ± 0.13 c | |
| F3 | 417 ± 10.7 | 39.9 ± 4.76 | 8.31 ± 0.54 a | 31.0 ± 1.01 | 5.22 ± 0.10 a | |
| Mean | 409 ± 8.1 | 35.0 ± 5.41 A | 8.06 ± 0.45 A | 31.7 ± 0.83 B | 4.80 ± 0.11 B | |
| Overall | F0 | 433 ± 12.9 | 28.8 ± 4.06 B | 7.43 ± 0.59 B | 32.9 ± 1.94 B | 4.48 ± 0.15 B |
| F1 | 404 ± 14.7 | 33.6 ± 3.92 AB | 8.05 ± 0.30 A | 38.5 ± 1.98 A | 5.48 ± 0.14 A | |
| F2 | 404 ± 14.8 | 33.5 ± 4.18 AB | 7.99 ± 0.57 A | 39.4 ± 2.09 A | 5.29 ± 0.13 A | |
| F3 | 433 ± 7.7 | 35.4 ± 6.11 A | 7.74 ± 0.74 AB | 37.9 ± 2.75 A | 5.35 ± 0.08 A | |
| Mean | 418 ± 6.6 | 38.0 ± 1.24 | 7.80 ± 0.59 | 37.2 ± 1.15 | 5.15 ± 0.08 | |
| F | Factor H (1; 53) & | 2.03 | 9.45 ** | 11.7 ** | 17.9 *** | 39.9 *** |
| Factor F (3; 53) | 1.70 | 4.12 * | 3.56 * | 12.7 *** | 26.1 *** | |
| H x F (3; 53) | 1.12 | 1.52 | 4.72 ** | 1.52 | 3.33 * |
| Organ/Sampling | Foliar Fertilization(F) | Habitat (H) | ||||||
|---|---|---|---|---|---|---|---|---|
| Galega Pre-crop | Rapeseed Pre-crop | |||||||
| Zn (ppm) | Mn (ppm) | K (g · kg−1) | Zn (ppm) | Mn (ppm) | K (g · kg−1) | |||
| Leaf | 14 DAT I | F0 | 19.2 c | 32.2 d | 14.00 b | 16.1 b | 26.3 b | 17.40 c |
| F1 | 22.9 a | 46.5 c | 17.10 a | 19.9 a | 34.1 a | 18.80 bc | ||
| F2 | 21.1 b | 57.8 b | 17.70 a | 21.5 a | 35.6 a | 19.30 b | ||
| F3 | 22.2 a | 61.4 a | 18.00 a | 22.0 a | 35.6 a | 22.30 a | ||
| Mean | 21.4 A | 49.5 A | 16.7 B | 19.9 B | 32.9 B | 19.5 A | ||
| 14 DAT II | F0 | 14.5 c | 64.0 c | 11.60 c | 11.8 c | 33.0 b | 13.10 c | |
| F1 | 15.6 b | 87.0 b | 30.40 a | 12.2 c | 33.1 b | 17.70 b | ||
| F2 | 17.9 a | 86.0 b | 20.30 b | 13.3b c | 36.2 b | 19.50 b | ||
| F3 | 17.0 a | 105.9 a | 32.70 a | 14.9 a | 44.7 a | 28.10 a | ||
| Mean | 16.3 A | 85.7 A | 23.8 A | 13.1 B | 36.8 B | 19.6 B | ||
| Grain | F0 | 34.3 ab | 45.8 c | 0.40 b | 22.8 b | 30.7 b | 0.43 b | |
| F1 | 33.5 bc | 44.1 c | 4.30 a | 21.6 b | 30.1 b | 4.28a | ||
| F2 | 32.9 c | 49.1 bc | 4.60 a | 21.8 b | 30.2 b | 4.21 a | ||
| F3 | 35.6 a | 55.9 a | 4.70 a | 35.6 a | 55.9 a | 4.57 a | ||
| Mean | 34.1 A | 48.7 A | 3.50 A | 25.5 B | 36.7 B | 3.37 A | ||
© 2020 by the authors. Licensee MDPI, Basel, Switzerland. This article is an open access article distributed under the terms and conditions of the Creative Commons Attribution (CC BY) license (http://creativecommons.org/licenses/by/4.0/).
Share and Cite
Sobolewska, M.; Wenda-Piesik, A.; Jaroszewska, A.; Stankowski, S. Effect of Habitat and Foliar Fertilization with K, Zn and Mn on Winter Wheat Grain and Baking Qualities. Agronomy 2020, 10, 276. https://doi.org/10.3390/agronomy10020276
Sobolewska M, Wenda-Piesik A, Jaroszewska A, Stankowski S. Effect of Habitat and Foliar Fertilization with K, Zn and Mn on Winter Wheat Grain and Baking Qualities. Agronomy. 2020; 10(2):276. https://doi.org/10.3390/agronomy10020276
Chicago/Turabian StyleSobolewska, Magdalena, Anna Wenda-Piesik, Anna Jaroszewska, and Sławomir Stankowski. 2020. "Effect of Habitat and Foliar Fertilization with K, Zn and Mn on Winter Wheat Grain and Baking Qualities" Agronomy 10, no. 2: 276. https://doi.org/10.3390/agronomy10020276