Article

Nitrogen and Phosphorus Absorption and Yield of Tomato Increased by Regulating the Bacterial Community under Greenhouse Conditions via the Alternate Drip Irrigation Method

1
College of Resources and Environment, Shanxi University of Finance and Economics, Taiyuan 030006, China
2
Institute of Soil and Water Conservation, Northwest A&F University, Yangling 712100, China
*
Authors to whom correspondence should be addressed.
Agronomy 2020, 10(3), 315; https://doi.org/10.3390/agronomy10030315
Submission received: 29 January 2020 / Revised: 23 February 2020 / Accepted: 23 February 2020 / Published: 25 February 2020

Abstract

:
Alternate drip irrigation (ADI) is a useful irrigation method for water conservation and the regulation of soil quality; however, knowledge about the underlying mechanism of soil-root-bacterium interactions is limited. To determine the mechanism by which ADI transforms soil nutrients and thereby promotes plant growth and to provide a basis for the reasonable selection of drip irrigation methodology, the present study investigated the effects of ADI on the composition and potential function of the bacterial community in tomato rhizosphere soils under greenhouse conditions and analyzed the soil-root-bacterium interactions under ADI. The results revealed that, compared with the soils of the plots treated with surface drip irrigation with plastic film mulching (DI-PFM), the soils of the plots treated with ADI presented an optimized bacterial community structure and optimized soil nitrogen (N) and phosphorus (P) metabolism. The soil available N contents under ADI with lower irrigation limits of 50%, 60%, and 70% of field capacity (A50, A60, and A70 treatments, respectively) were 1.48, 2.19, and 1.91 times greater than those under DI-PFM, respectively; similarly, the soil available P contents were 1.49, 1.65, and 2.91 times greater; the total phosphorus (TP) contents in the tomato roots were 1.06, 1.94, and 1.59 times greater, respectively; and the TP contents in the tomato plants were 1.03, 1.75, and 2.84 times greater, respectively. In addition, the total nitrogen (TN) contents in the tomato roots under ADI with lower irrigation limits of 60% and 70% of field capacity were 1.07 and 1.14 times greater than those under DI-PFM, and the TN contents in the tomato stems were 1.21 and 1.12 times greater than those under DI-PFM. However, compared with DI-PFM, ADI improved tomato yields by 24.23% under only 70% of field capacity. Therefore, ADI significantly enhanced soil-root interactions and stimulated the activation of soil N and P, but only a proper low soil moisture content (SMC) led to significantly increased tomato yields.

1. Introduction

Intensive agricultural irrigation and cropping in the greenhouse can lead to an imbalance in soil nutrients and can degrade soil quality [1,2,3]. Therefore, it is very important to improve agronomic methods to resolve these problems [4]. Alternate drip irrigation (ADI) is a useful irrigation method for water conservation and for the regulation of soil quality [5].
ADI involves alternately irrigating the two sides of crop roots within a certain period of time to maintain one side of the crop roots as wet, whereas the other side is maintained as relatively dry. In this way, local areas of the crop rhizosphere are manually controlled to experience alternating wet/dry conditions [6]. Compared with conventional drip irrigation, ADI not only significantly increases water-use efficiency but also increases photosynthesis [7], increases crop yields, and improves fruit quality [8]. There are several reasons for the advantages of ADI. First, when stimulated and induced by alternating wet/dry conditions, crop roots generate corresponding signals that alter stomatal conductance and reduce transpiration, thereby increasing plant water-use efficiency [9]. Second, alternating wet/dry conditions can stimulate root growth, increase root activity [10], increase the root/shoot ratio [11], and increase the proportion of photosynthates allocated to the reproductive organs [12,13]. Third, frequent alternations of wet/dry conditions have several additional advantages, such as increasing soil microbial activity, accelerating the mineralization of soil organic matter (OM), altering the soil C/N ratio, increasing soil nitrogen (N) accumulation on the root surface, stimulating N uptake by roots [14], and increasing N fertilizer-use efficiency [15]. However, knowledge about the changes in microbial community structure and function under ADI is limited, which could be used to determine the mechanisms by which ADI conserves water, regulates soil quality and promotes crop growth.
Soil microbes are an important driving force for the decomposition and transformation of nutrients in farmland soil ecosystems [16]. Particularly in the rhizosphere, plants and microbes compose a closely linked, dynamically changing system and continuously interact with one another [17], thereby affecting matter flow and energy exchange in the soil. Under ADI conditions, the alternating wet/dry cycles in the soil frequently occur within a brief period of time, which can alter environmental factors (e.g., water and heat) and the composition of soil microbial communities, affecting soil-crop-microbe interactions and regulating the cycling of soil nutrients [18], with effects on plant nutrient uptake and nutrient-use efficiency [19]. However, the effects of ADI on the composition of the microbial communities (e.g., soil bacteria) within the rhizosphere have been studied via culture techniques, which resulted in the identification of only an extremely small portion (0.1–1%) of microbial species in the soil [20]. High-throughput sequencing techniques have been widely used to study microbial communities; this technique can provide a large amount of information and compensate for the shortcomings of conventional methods [21]. Nevertheless, relevant in-depth studies are still lacking.
Soil bacteria not only compose the largest role of soil microbes and a major portion of the biodiversity [22] but also play important roles in biogeochemical cycles, and soil bacteria have been used to improve crop production for decades, as plant-bacterium interactions in the rhizosphere can determine plant health and soil fertility [23]. Another assumption is that the underlying mechanism of the regulation of soil-root-bacteria and of soil nitrogen (N) and phosphorus (P) metabolism might be an important factor by which ADI not only conserves water but also transforms soil nutrients, thereby promoting plant growth. However, the responses of the regulation of “soil-root-plant” interactions and of soil N and P metabolism to ADI have not been well addressed. Thus, in the present study, we investigated the changes in the composition and potential function of bacterial communities in soils and explored soil-crop-bacterium interactions under different ADI conditions via high-throughput sequencing. Some important indices of agricultural soil metabolism, for example, soil urease and phosphatase activity, were also determined to understand the soil-crop-bacterium interactions. Moreover, in the region of the study location, tomato is popular and extensively planted in accordance with the ADI method; therefore, the tomato was selected as the research object. The results provide new insights into the bacterial communities in soils related to ADI and contribute to the understanding of the underlying mechanism by which ADI regulates soil quality and improves crop growth. The results are also helpful for reasonably selecting irrigation methods and improving soil quality in intensive irrigation and cropping systems.

2. Materials and Methods

2.1. Experimental Field and Experimental Design

The experimental field was located at 108°08′ E, 34°16′ N at an altitude of 521 m in a warm temperate semi-humid monsoon zone; the region has a mean temperature of approximately 16.3 °C per year, a mean precipitation of approximately 535.6 mm per year, a mean sunshine duration of approximately 2163 h per year, and a mean frost-free period of 210 d per year. The experimental soil had a bulk density of 1.35 g·cm−3, and the experimental field had a water capacity of 28.17% (water mass content). The soil texture consisted of sand (2–0.02 mm; 25.4%), silt (0.02–0.002 mm; 44.1%), and clay particles (< 0.002 mm; 30.5%).
The experiment was conducted in a plastic greenhouse in Dazhai village, Dazhai township, Yangling district, Xianyang city, Shaanxi Province, China, between October 2014 and May 2015. The experimental greenhouse was 108 m long in the east–west direction and 8 m long in the south–north direction. Plots were established in the greenhouse from west to east, with double ridges in each plot; the area of each plot was 3.6 m2 (length, 6.0 m; ridge width, 0.6 m; ridge height, 0.2 m; furrow width, 0.3 m). A total of 34 tomato plants were planted at a spacing of 0.35 m in two rows per plot. A guard row was established at each of the two ends of the experimental field.
Conventional surface drip irrigation with plastic film mulching (DI-PFM) was also applied as a control (CK). A drip irrigation pipe was placed midway between the two rows of tomato plants in each CK plot. The experimental field consisted of lou soil, with a soil available water (SAW) content of 21% (mass content). For the CK treatment, the lower and upper limits of the irrigation amount were set to 70% and 80% of the SAW, respectively. Three ADI treatments were investigated in the present study. The lower irrigation limits of these three ADI treatments were set to 50%, 60%, and 70% of the SAW, and the upper limits were 60%, 70%, and 80%, respectively; these treatments were denoted as A50, A60, and A70, respectively. One drip irrigation pipe was placed at each of the two ends of each plot at a distance of 40 cm from the roots of the tomato plants. Only one of the two drip irrigation pipes in each plot was used at each irrigation time; the two drip irrigation pipes were used one at a time such that only one side of the plot was irrigated with water during each irrigation event.
Each irrigation treatment was repeated three times, resulting in a total of 12 planting plots. A 0.014-mm-thick, white, clear, high-pressure low-density polyethylene mulch film (manufactured by Jiangsu Jingjiang Xinfeng Plastics Plant, Jingjiang, China) was placed on the surface of each plot. Inner inlay flat drip irrigation pipes (manufactured by Dayu Water-saving Co., Ltd., Jiuquan, China) were used for the drip irrigation system. The dimensions of the drip irrigation pipes were as follows: diameter, 16 mm; wall thickness, 0.3 mm; emitter spacing, 30 cm; operating pressure, 0.1 MPa; drip rate, 1.2 L·h−1.
A probe was inserted into the soil to a depth of 100 cm at the center of each plot. A Field TDR 200 soil moisture content (SMC) analyzer (Spectrum, Aurora, IL, USA) was used to measure the SMC, and soil moisture was controlled in consideration of these measurements. The SMC was measured at intervals of 10 cm to a depth of 60 cm. Calibration was also performed by collecting soil samples by drilling and coring; the samples were then dried to determine the SMC. When the SMC reached the lower limit, the soil was irrigated with the water amount calculated in consideration of the 40-cm-deep wet layer according to the following equation:
M = s ρ b p h θ f ( q 1 q 2 ) / η
where, M is the irrigation amount (m3); s is the planned wetting area (s = 4.6 m2); ρ b is the soil bulk density ( ρ b = 1.35 g·m−3); p is the percentage of wetted soil (p = 0.8); h is the depth of the wet layer (h = 0.4 m); θ f is the maximum field capacity ( θ f = 28.17%); q1 and q2 are the upper limits of the irrigation amount and the measured SMC, respectively (%F); and η is the water-use coefficient (η = 0.95).

2.2. Sampling

When the tomato fruits began to ripen, three tomato plants were randomly selected from each plot and marked with numbers. Fruits were harvested between 18 March 2015, and 3 May 2015. The fruits were numbered for matching to their corresponding plant and then were weighed via an electronic balance with a precision of 0.01 g. After the fruits were harvested, the aboveground parts of the marked tomato plants were cut and detached from the belowground parts, after which they were collected and analyzed for both dry matter mass and nutrient composition.
The roots of these tomato plants and the rhizosphere soil were sampled. A 40 × 30 cm2 rectangular area equal to the actual root depth of approximately 50 cm was excavated while considering the centerline boundary between two adjacent plants. The complete root system of each tomato plant was subsequently excavated, and the large soil clumps attached to the roots were removed. The remaining soil adhering to roots was forcibly shaken onto a piece of clean filter paper that had been sterilized at high temperature and was divided into two portions, each placed in a sterilized plastic test tube and immediately transported at 4 °C to the laboratory. One tube of soil (approximately 50 g) was stored at −80 °C for further analysis, whereas the other tube of soil (approximately 10 g) was immediately analyzed for bacterial diversity. The roots of each tomato plant were placed in a mesh bag (with a mesh size of 0.5 mm) and transported to the laboratory for subsequent analysis.

2.3. Soil Temperature, pH, Enzyme Activity, Carbon Dioxide (CO2) Flux and Porosity

Geothermometers were placed at depths of 5, 10, 15, 20, and 25 cm in the center of each plot to measure the soil temperature. Measurements were taken every 5 d at 10:00 a.m. The soil temperature measurements obtained during the tomato growing period were subsequently averaged (unit: °C). Three tomato plants were randomly selected from each plot on 21 December 2014 (the flowering and fruit-setting period), 23 January 2015 (the peak fruiting period), and 23 April 2015 (the fruit maturation period). Tomato rhizosphere soils were collected by excavation as described in the Sampling section and were used to determine soil pH and enzyme activities. The soil pH was measured with a pHB-4 acidometer (soil/water ratio, 1/5). Soil urease activity was determined according to the method of Tabatabai (1994), whereby urea was used as a substrate in phosphate buffer at pH 7.0 at 30 °C for 1.5 h. The soil urease activity was expressed as micromoles of NH3 per gram of soil per hour. Soil alkaline phosphatase activity was determined as described by Tabatabai [24], whereby p-nitrophenyl phosphate (pNP) was used as a substrate in a modified universal buffer at pH 11.0 at 37 °C for 1 h. The phosphatase activity was expressed as micromoles of pNP per gram of soil per hour.
Soil CO2 flux was measured in situ according to the static black-box method; CO2 was collected every 10 d during the tomato growing period and analyzed using an Agilent 7890 B gas chromatograph (Agilent Technologies 7890A GC System, Santa Clara, USA) [25].
After the tomato fruits were harvested, three sampling points were established in each of the plots subjected to the irrigation treatments. Soil samples were collected every 10 cm from the surface to a depth of 40 cm via cutting rings with a volume of 100 cm3. The soil samples were then dried in the laboratory, and the bulk density of each soil sample was determined. The soil bulk density was calculated according to the following equation:
d = ( W 1 W 0 ) × ( 1 W % ) / V
where d is the soil bulk density (g·cm−3), W1 is the total weight of the cutting ring and the soil in its natural structure (g), W0 is the weight of the cutting ring (g), W% is the moisture content of the fresh soil, and V is the volume of the cutting ring (cm3).
Soil porosity was calculated on the basis of the soil bulk density according to the following equation:
P = ( 1 d ρ W % ) × 100 %
where P represents the soil porosity (%), d represents the soil bulk density (g·cm−3), and ρ represents the soil density (ρ = 2.65 g·cm−3).

2.4. Analysis of the Dry Matter, Nutrient Composition, and Roots of Tomato Plants

The tomato plant samples (see Sampling section) were brought to the laboratory. After their fresh mass was determined, each tomato plant sample was dried in an air-blast drying oven until its weight no longer changed (deactivation of enzymes was performed at 105 °C for 30 min, after which drying was conducted at 75 °C for 36 h). The dry mass of each tomato plant sample was then determined. The total nitrogen (TN) and total phosphorus (TP) content in the stems and roots of each tomato plant and of its corresponding rhizosphere soil were determined via the semimicro-Kjeldahl method and the molybdenum-antimony (Mo-Sb) colorimetric method after sulfuric acid-perchloric acid (H2SO4-HClO4) digestion, respectively.
Each root sample collected from the experimental field was soaked in water in the laboratory. The root samples were then rinsed with water to separate the soil from the roots. Three layers of fine gauze were placed in a rinse tank to collect the fine roots while each root sample was rinsed. The rinsed roots were then placed in a self-sealing bag via tweezers. The roots were subsequently scanned with an Epson Expression 1600 Pro Model EU-35 double-sided scanner (Epson, Suwa-shi, Japan). The total length (units: cm) and surface area (units: cm2) of the roots were then analyzed by the WinRHIZO Pro2004b (Version 5.0) image analysis system (Regent Instruments, Inc., Quebec, Canada). In addition, a portion of each root sample was used to determine root activity via the triphenyl tetrazolium chloride (TTC) method.

2.5. High-Throughput Analysis of the Soil Bacterial Community

The soil samples collected from the experimental field (see Sampling section) were used for analysis. The main steps are described below.
(1) DNA extraction. The total DNA was extracted from each soil sample via an E.Z.N.A.® Soil DNA Kit (Omega Bio-tek, Norwalk, Conn, USA). The extracted DNA was purified with a DP209 DNA purification kit (Tiangen Biotechnology Co., Ltd., Beijing, China). The DNA concentration and mass were determined via a Nanodrop ND 2000 ultramicro-spectrophotometer (Thermo Scientific, Waltham, Massachusetts, USA), and the DNA integrity was determined by 1% agarose (Amresco, Solon, OH, USA) gel electrophoresis (AGE). The purified DNA was stored in a refrigerator at −20 °C for subsequent polymerase chain reaction (PCR) and Illumina 300-bp paired-end sequencing on a MiSeq machine.
(2) PCR amplification. The V3 and V4 regions of the prokaryotic 16S rRNA genes were amplified by PCR in triplicate via DNA polymerase (TransGen AP221-02: TransStart Fastpfu DNA polymerase) with the primers 338F (5′-ACTCCTACGGGAGGCAGCAG-3’) and 806R (5′-GGACTACHVGGGTWTCTAAT-3′), which were labeled with a unique barcode.
The PCR system (20 µL) was composed of 4 μL of 5× FastPfu buffer, 2 μL of 2.5 mM deoxynucleotide triphosphates, 0.8 μL of forward primer (5 μM), 0.8 μL of reverse primer (5 μM), 0.4 μL of FastPfu polymerase, and 10 ng of DNA sample. Double-distilled water was added to the PCR system to obtain a final volume of 20 µL.
PCR was performed via an ABI GeneAmp® 9700 PCR instrument. The PCR parameters were as follows: a. 1× (3 min at 95 °C); b. 27× (30 s at 95 °C, 30 s at 55 °C, and 45 s at 72 °C); and c. 10 min at 72 °C, followed 10°C until halted by the user.
(3) High-throughput sequencing of the 16S rRNA gene. The PCR amplification products were examined by 2% AGE, purified via an AxyPrep DNA gel extraction kit (Axygen Biosciences, Tewksbury, MA, USA) and quantified by a QuantiFluor™-ST fluorometer (Promega, Madison, WI, USA). The purified amplification products obtained from the different soil samples were quantitatively mixed and then subjected to paired-end sequencing. Paired-end sequencing was performed via the MiSeq Illumina platform at Shanghai Majorbio Bio-Pharm Technology Co., Ltd., Shanghai, China.
(4) MiSeq-sequencing data processing. The raw data obtained from the MiSeq platform were merged with Fast Length Adjustment of Short Reads (FLASH) under the default settings and processed using Quantitative Insights into Microbial Ecology (QIIME 1.17) [26]. The raw data were subjected to a quality control and then filtered to obtain effective sequences as follows: (I) Sequences with ambiguous bases were discarded and truncated for any site receiving an average quality score of <20 across a 50-bp sliding window; (II) The number of mismatches allowed in the barcode and the maximum number of mismatches allowed for the primers were 0 and 2, respectively; and (III) The sequences were longer than 300 bp, and an average quality score of >20 was included for further analyses. Chimeric sequences were detected and excluded by the QIIME implementation of the USEARCH algorithm [27]. Under a 97% similarity level, DNA sequences were classified into operational taxonomic units (OTUs) using USEARCH 7.1. The representative sequences were aligned using PyNAST, and FastTree was used to construct a phylogenetic tree [28,29]. RDP classifier [30] was used to annotate the taxa on the basis of the information within the Silva Database [31], with a 70% bootstrap cutoff.

2.6. Data Processing and Statistical Analyses

The structure of the top 100 genera within the bacterial community in the targeted soil was analyzed. Within the bacterial community, the N and P metabolism-related functional traits that were reasonably associated with soil nutrient metabolism in agriculture were further assessed using Phylogenetic Investigation of Communities via the Reconstruction of Unobserved States (PICRUSt) [32]. On the basis of a reference genome database of full sequences and information from the 16S rRNA gene dataset, PICRUSt was used to perform a Kyoto Encyclopedia of Genes and Genomes (KEGG)-based [33] pathway analysis, which classified the functions of the microbial community.
The dissimilarity of phylogenetic diversity among the bacterial communities was measured using a Bray-Curtis distance matrix [34]. The bacterial communities were subjected to redundancy analyses (RDAs) by R version 3.1.0 [35] via the functions of the Vegan package [36]. One-way ANOVA and Pearson’s correlation analyses were performed via SPSS 22.0, and tables and graphs were constructed with Microsoft Excel.

3. Results

3.1. Structure of the Bacterial Communities in the Soils

Our investigation revealed that each treatment contained at least 400 genera of bacteria, but those genera whose relative abundance within the bacterial community was in the top 100 constituted more than 85% in each of the four treatments; therefore, we analyzed those 100 genera in the bacterial communities in each irrigation treatment (Figure 1). The results showed that the structure of the bacterial communities in the A50 treatment was similar to that in the A60 treatment, whereas the structure of the bacterial communities in the A70 treatment was different from that in the CK and other treatments (Figure 1 and Figure 2). In the CK treatment, the top three most abundant bacterial genera were Pseudomonas (14.39%), Anaerolineaceae_uncultured (9.36%), and Nitrosomonadaceae_uncultured (6.59%). However, in the A50 treatment, the top three most abundant bacterial genera were Anaerolineaceae_uncultured (9.20%), Candidate_division_TM7_norank (6.00%), and Rhodanobacter (5.85%); in the A60 treatment, Anaerolineaceae_uncultured (10.41%), Subgroup_6_norank (6.24%), and Nitrosomonadaceae_uncultured (5.28%); and in the A70 treatment, Anaerolineaceae_uncultured (10.59%), Subgroup_6_norank (6.14%), and Nitrosomonadaceae_uncultured (6.06%).

3.2. Factors Influencing the Bacterial Community Composition

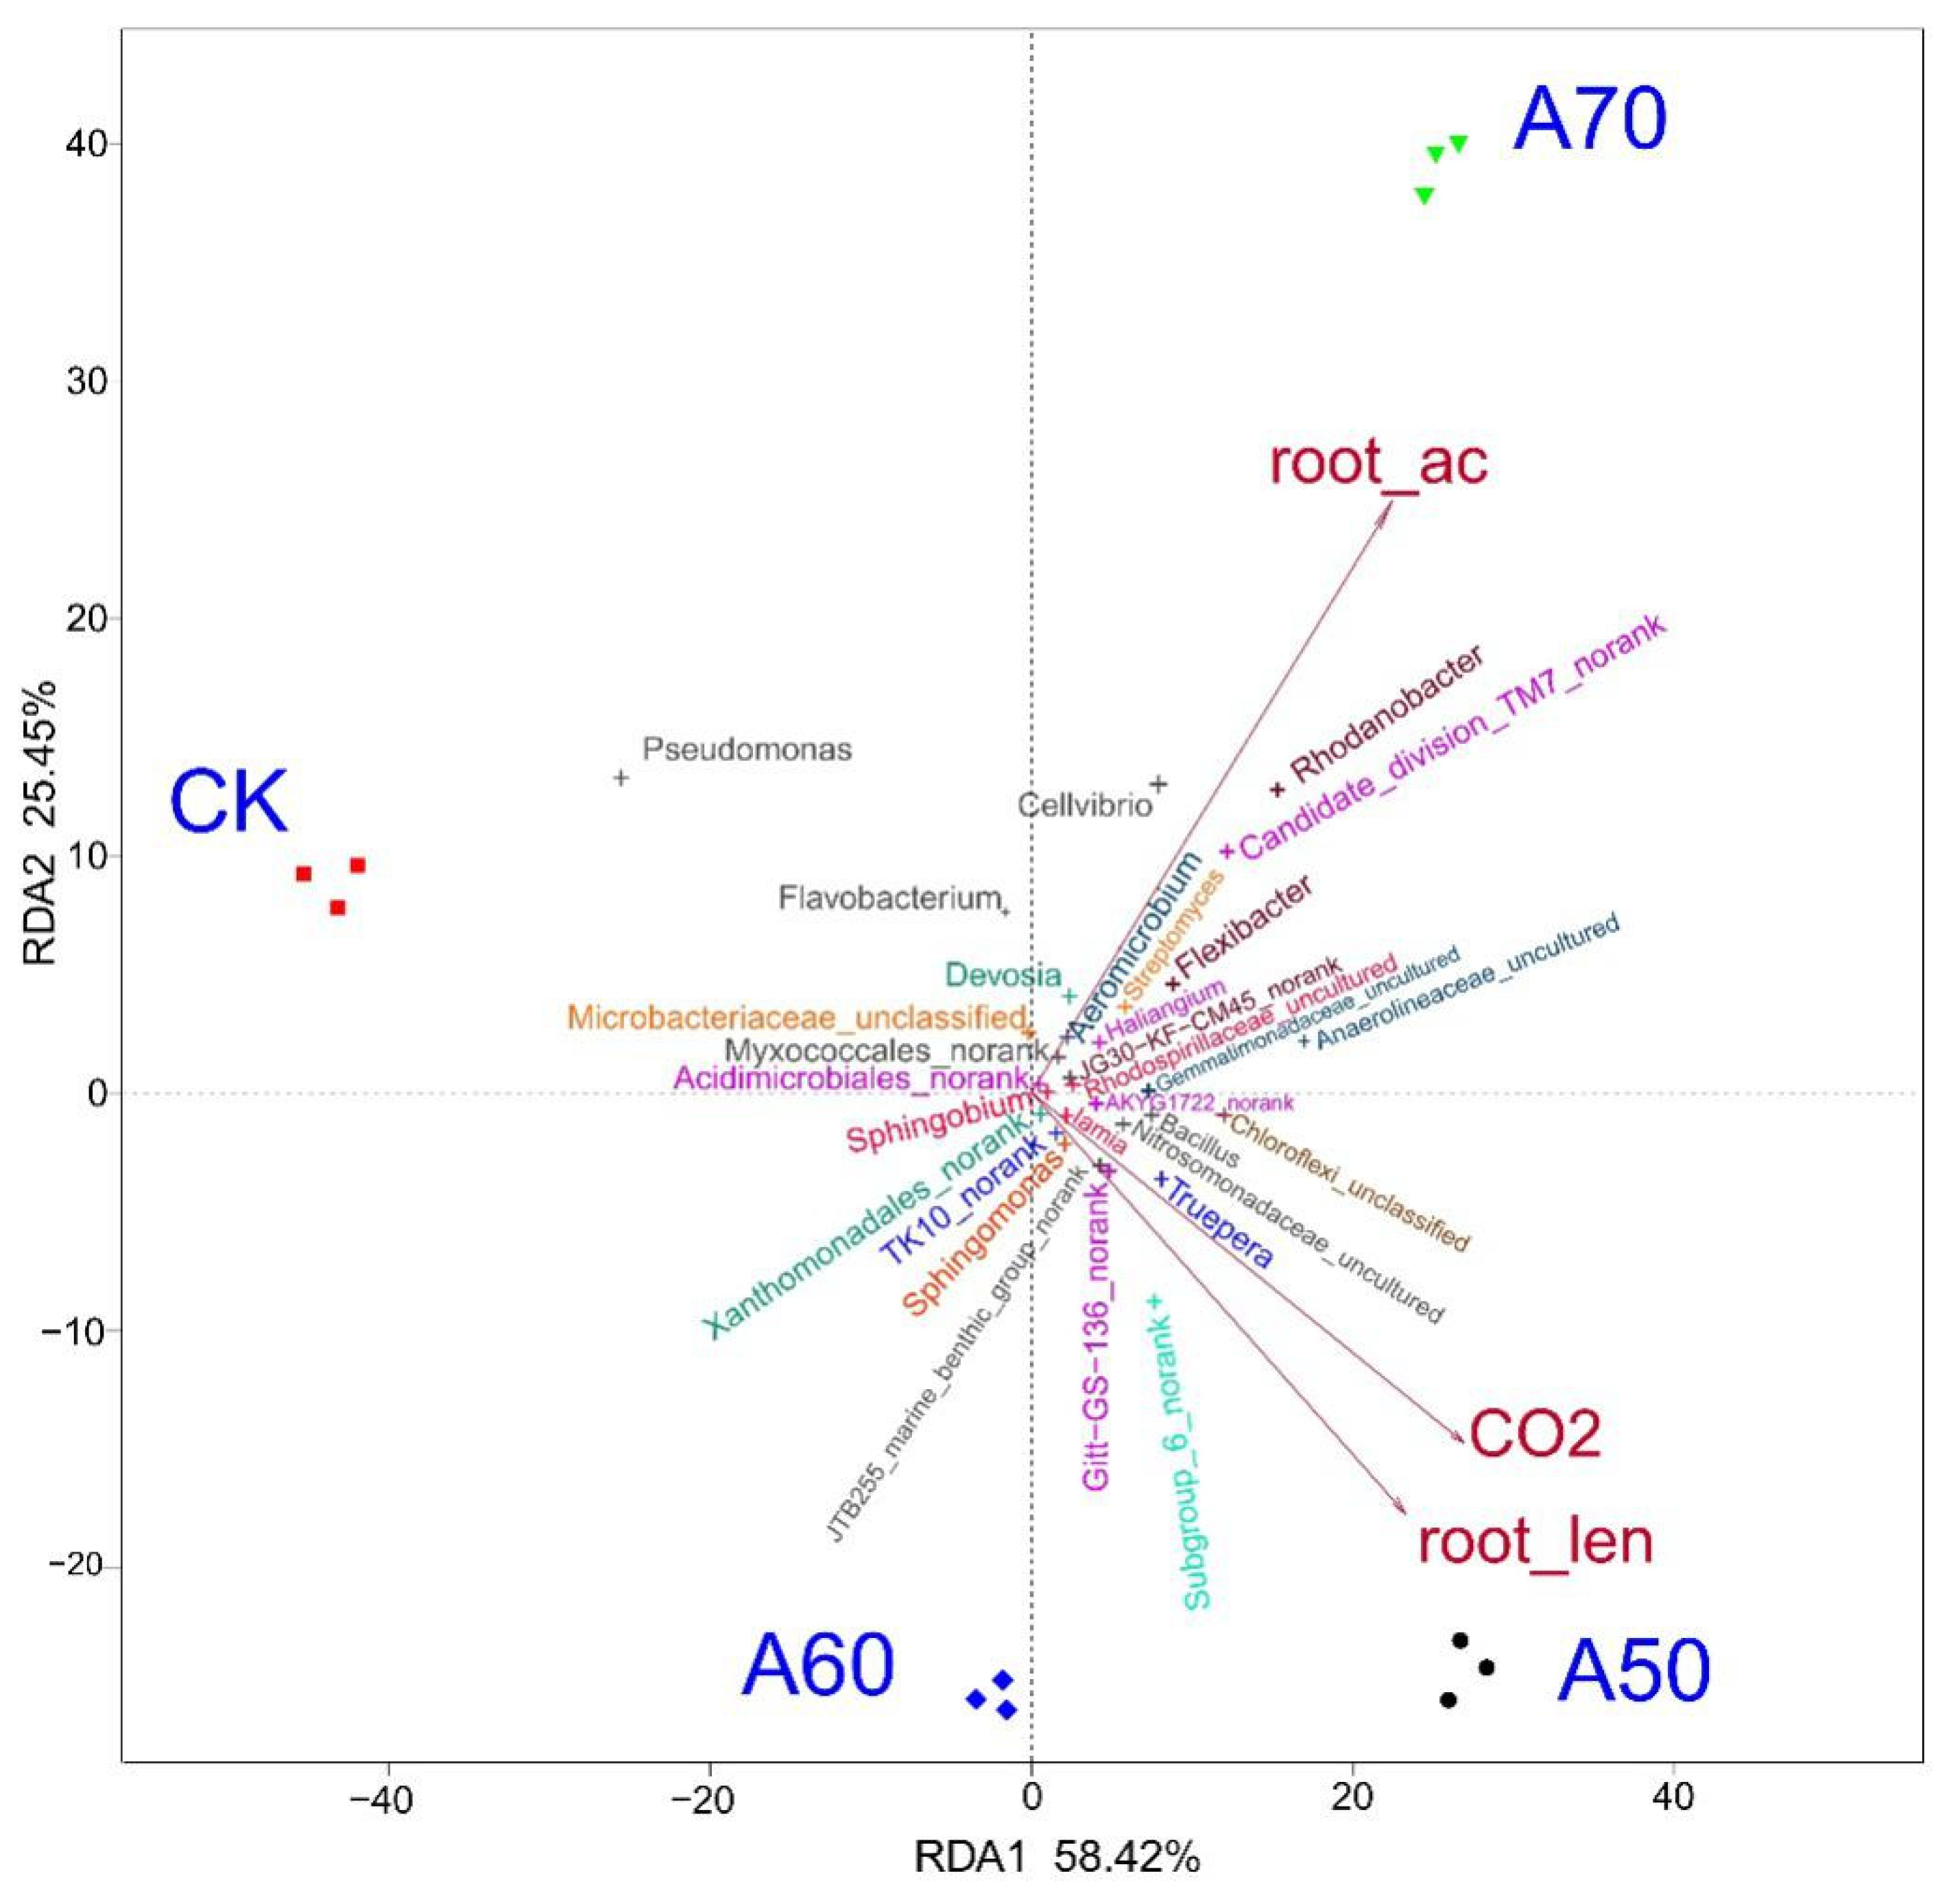
Microorganisms play key roles in element cycles, and environmental factors can influence microbial community composition. To identify the specific environmental factors that influenced the bacterial community structure in the present study, RDA (Figure 2) was conducted and revealed that the soil CO2 flux and root length caused the four treatments (CK, A50, A60, and A70) to separate significantly, and the effects of the soil CO2 flux and root length on the bacterial composition in the four treatments varied significantly. In addition, root activity also caused the composition in the four treatment samples to deviate significantly; however, this activity affected the CK and A50 treatments to a similar extent.
An in-depth analysis of the relationships between the relative abundance of the top 30 genera and corresponding rhizosphere environmental factors was performed. These genera were significantly correlated with root activity, the number of root forks, and soil CO2 flux (Figure 2). Bacteria of the genera Nitrosomonadaceae_uncultured, Acidimicrobiales_norank, Rhodospirillaceae_uncultured, Bacillus, Sphingobium, AKYG1722_norank, Chloroflexi_unclassified, Truepera, Haliangium, JG30-KF-CM45_noran,k and Gemmatimonadaceae_uncultured were positively correlated with root activity, root length, and soil CO2 flux. Moreover, bacteria of the genera Gitt-GS-136_norank, JTB255_marine_benthic_group_norank, Subgroup_6_norank, TK10_norank, Xanthomonadales_norank, Iamia, and Sphingomonas were positively correlated with root length and soil CO2 flux but negatively correlated with root activity. Bacteria of the genera Myxococcales_norank, Flexibacter, Rhodanobacter, Anaerolineaceae_uncultured, Streptomyces, Cellvibrio, Devosia, Microbacteriaceae_unclassified, Candidate_division_TM7_norank, Aeromicrobium, Flavobacterium, and Pseudomonas were positively correlated with root activity but negatively correlated with root length and soil CO2 flux.

3.3. Predicted Functional Metabolism of Bacterial Communities

To analyze the function of the community further, the N and P metabolism-related genes were predicted using PICRUSt, as shown in Table 1. The results showed that the total copies of N metabolism- and P metabolism-related genes in the ADI treatment (i.e., A50, A60, and A70) compared with the CK treatment increased, which indicated that ADI can optimize the bacterial community structure. Specifically, compared with those in the CK, the total number of copies of N metabolism-related genes in A50, A60, and A70 increased by 6.45%, 16.12%, and 16.61%, respectively. Further, the total copies of N fixation-related genes were 1.25, 1.39 and 1.35 times greater in the A50, A60, and A70 treatments than in the CK treatment, and compared with those in the CK treatment, the denitrification genes were 6.63%, 17.34%, and 22.28% more abundant; however, compared with those in the CK treatment, the total amount of nitrification genes in A50, A60, and A70 treatments decreased by 8.80%, 5.17%, and 13.21%, respectively. Moreover, compared with that in the CK treatment, the total number of P metabolism-related genes in the A50, A60, and A70 treatments was 4.18%, 4.63%, and 4.74%, greater, respectively.

3.4. Soil Nutrients and Tomato Growth Indices

Bacterial community changes can affect the uptake of soil nutrients and the growth of tomato plants. According to the data in Table 2, during the peak fruiting period, urease activity in the soils in the A50 treatment was 25.27% lower than that in the CK treatment. Moreover, during the peak fruiting period, the phosphatase activity in the soils in the A50 and A60 treatments was 87.56% and 69.16% lower than that in the CK treatment, respectively. However, the available N contents in the soils in the A50, A60, and A70 treatments were 1.48, 2.19, and 1.91 times greater than the content in the CK treatment, respectively. Similarly, the available P contents in the A50, A60, and A70 treatments were 1.49, 1.65, and 2.91 times greater than the content in the CK treatment. The TP contents in the roots of the tomato plants in the A50, A60, and A70 treatments were 1.06, 1.94, and 1.59 times greater than those in the CK treatment, and the TP contents in the stems of the tomato plants in the A50, A60, and A70 treatments were 1.03, 1.75, and 2.84 times greater than those in the CK treatment, respectively. Moreover, the TN contents in the roots of the tomato plants in the A60 and A70 treatments were 1.07 and 1.14 times greater than those in the CK treatment. Furthermore, the TN contents in the stems of the tomato plants in the A60 and A70 treatments were 1.21 and 1.12 times greater than those in the CK treatment. However, the TN contents in the stems in the A50 treatment were markedly lower than those in the CK treatment. The tomato yield per plant in the A70 treatment improved by 24.23%, which was markedly greater than that in the CK treatment.

3.5. Correlation Analysis

As shown in Table 3, root activity was significantly positively correlated with the copy numbers of N fixation-related genes, TN metabolism-related genes, and TP metabolism-related genes; however, root forks were significantly positively correlated only with TP metabolism-related gene copy numbers. Similar to that for total dry matter, soil available N was significantly positively correlated with the copy numbers of N fixation-related genes and TN metabolism-related genes. In addition, there was a significant positive correlation between yield and TN metabolism-related gene copy number.
In addition to the aforementioned correlations, the copy numbers of TN metabolism-related genes were significantly positively correlated with the copy numbers of N fixation-related genes and denitrification-related genes. In addition, the copy number of TP metabolism-related genes was significantly positively correlated with the copy number of N fixation-related genes.

3.6. Irrigation Amounts and Irrigation Water-Use Efficiency (IWUE)

As shown in Table 4, compared with that in the CK, A60, and A70 treatments, the irrigation amount in the A50 treatment decreased by 29.67%, 25.38%, and 33.92%, respectively, and the irrigation amount in the A60 treatment decreased by 11.45%. However, the IWUE in the A50 treatment was 1.46, 1.22, and 1.25 times that in the CK, A60, and A70 treatments, respectively. In addition, compared with that in the CK treatment, the IWUE in the A60 and A70 treatments increased by 19.54% and 17.05%, respectively.

4. Discussion

4.1. ADI Optimized the Bacterial Community and Improved Soil N and P Availability

ADI can alter the composition of the microbial community by alternating the wet/dry conditions of soils, thereby altering the rate of mineralization of soil nutrients such as N and P [37]. The results of the present study showed significant differences in the composition of the metabolizing bacterial communities in the tomato rhizosphere soils in the ADI and DI-PFM treatments. Compared with DI-PFM, ADI significantly increased the numbers of genes related to TN and TP metabolism, especially N fixation and denitrification. Under the ADI conditions, the relatively frequent alternation of the wet/dry conditions [38] led to dynamic fluctuations in the stability of the rhizospheric soil microenvironment; these changes inevitably accelerated the restoration of the dynamic equilibrium between the structure and function of the bacterial community in the soil, thereby further increasing the heterogeneous differences in the migration and distribution of water as well as the nutrients within the rhizosphere [39]. These effects might be more favorable to the activation of certain functional metabolizing bacteria, such as N-fixing and denitrifying bacteria. The significant changes in the abundance of N-fixing and denitrifying bacteria indicated changes in nutrient metabolism in the soils [40]. The results of the present study showed that, compared with the DI-PFM treatment, the three ADI treatments (with lower irrigation limits equal to 50%, 60%, and 70% of SAW) significantly increased the soil available N and P contents (Table 2). However, only under relatively high irrigation amounts of ADI (60% and 70% of SAW) were the TN contents in the roots and stems of tomato plants greater than those under DI-PFM. Under the relatively dry ADI treatment (50% of SAW), the TN contents in the roots did not significantly differ from those under DI-PFM; however, the TN contents in the stems were markedly reduced in the dry ADI treatment compared with the DI-PFM treatment. Differences in soil nutrient activation and absorption affect productivity [18]. Accordingly, ADI at 70% of field capacity increased tomato yields by 24.23%, which was markedly greater than that under DI-PFM. ADI can obviously significantly stimulate the activation of soil N and P, but a lower SMC might significantly restrict soil N and P absorption by plants. Therefore, compared with DI-PFM, ADI did not improve tomato yields when the field capacity was lower than 50% and 60%, but when the field capacity was below the same lower limit (70% of SAW), compared with DI-PFM, ADI markedly improved tomato yields. Studies have shown that ADI is more favorable to the activation of soil N and P than is conventional drip irrigation and that the former can significantly stimulate crops to absorb N and P from the soil [41]; these findings are consistent with the results of the present study. However, those authors did not thoroughly investigate the relationships between the activation and absorption of N and P and the structure of the microbial community in the rhizosphere.

4.2. The Relatively High Soil Wet/Dry Alternating Frequency by ADI Was not Conducive to Soil Nutrient Activation

Complex interactions among soils, roots, and microbes occur in the rhizosphere [42]. Soil microbes within the soil-root-microbe system are an important driving force for nutrient transformation and decomposition [16]. Root-zone environmental factors (e.g., soil temperature, soil acidity, and soil porosity) vary with irrigation amount and the alteration frequency of the wet/dry conditions of the soil when ADI is implemented [13,43], and this effect influences the structure and function of the microbial community and regulates soil-root-microbe interactions, thereby affecting soil nutrient activation and nutrient absorption and use by plants [44]. The results of the present study showed that the bacterial community in the tomato rhizosphere varied significantly due to the different irrigation amounts of ADI. ADI at 50% SAW (i.e., the A50 treatment) led to a lower total relative abundance of the Nitrogen metabolizing bacterial group. Previous studies have shown that soil physical conditions can affect microbial diversity [45]. A relatively low irrigation amount (50% of SAW) resulted in frequent soil wet/dry alternations, thereby disrupting soil aggregates [46], reducing soil porosity [47], increasing the activation of nutrients in the soil that are difficult to mineralize [48]; these phenomena could promote the growth of bacteria that have no beneficial effects on plant growth and thus reduce the relative abundance of beneficial microbes in the rhizosphere (e.g., Nitrogen metabolizing bacteria). Therefore, ADI with a relatively low irrigation amount might cause transitory nutrient activation events in the soil, although these events would be unfavorable to steady soil nutrient activation. This result is further demonstrated by the urease activity, phosphatase activity, and available N and P contents in the soils in the A50 treatment being significantly lower than those in the A60 and A70 treatments (Table 2).

4.3. The Relatively Low Soil Wet/Dry Alternating Frequency by ADI Increased Soil-Root-Bacterium Interactions

As the lower limit of the irrigation amount increased, the SMC increased, and the air permeability of the soil decreased. The growth of N-fixing bacteria is aerobic and requires a relatively high SMC [49]. As the lower limit of the irrigation amount increased from 50% to 60% of SAW, the abundance of N fixation-related genes increased, possibly because the moderate level of SMC and the soil wet/dry frequency created a beneficial soil environment. When the lower limit of the irrigation amount reached 70% of SAW, the SMC peaked, and the soil air permeability decreased further. In addition, the soil wet/dry conditions also alternated at a relatively low frequency, and the internal fine structure of the soil fluctuated less frequently. A more stable soil structure could also promote soil microbial growth. The results of the present experiment do not reveal a significant difference in copy numbers of TN metabolism-related genes, P metabolism-related genes or N fixation-related genes between the A60 and A70 treatments; however, only in the A70 treatment did the rhizosphere soil present both high available N and P contents (Table 2). Hinsinger reported that the formation of root forks was triggered by interactions with plant growth-promoting microorganisms [50]; in contrast, increased root forks could increase plant-soil-microorganism interactions and the absorption of both P and N by plants [51]. In the present study, the A70 treatment not only presented high root activity but also contained many root forks (Table 5), consequently increasing soil-root-bacterium interactions (Table 3) and thereby promoting soil nutrient activation in the rhizosphere [52].

4.4. ADI with a Relatively Adequate Irrigation Amount Improved Soil Nutrient Absorption by Tomato Plants

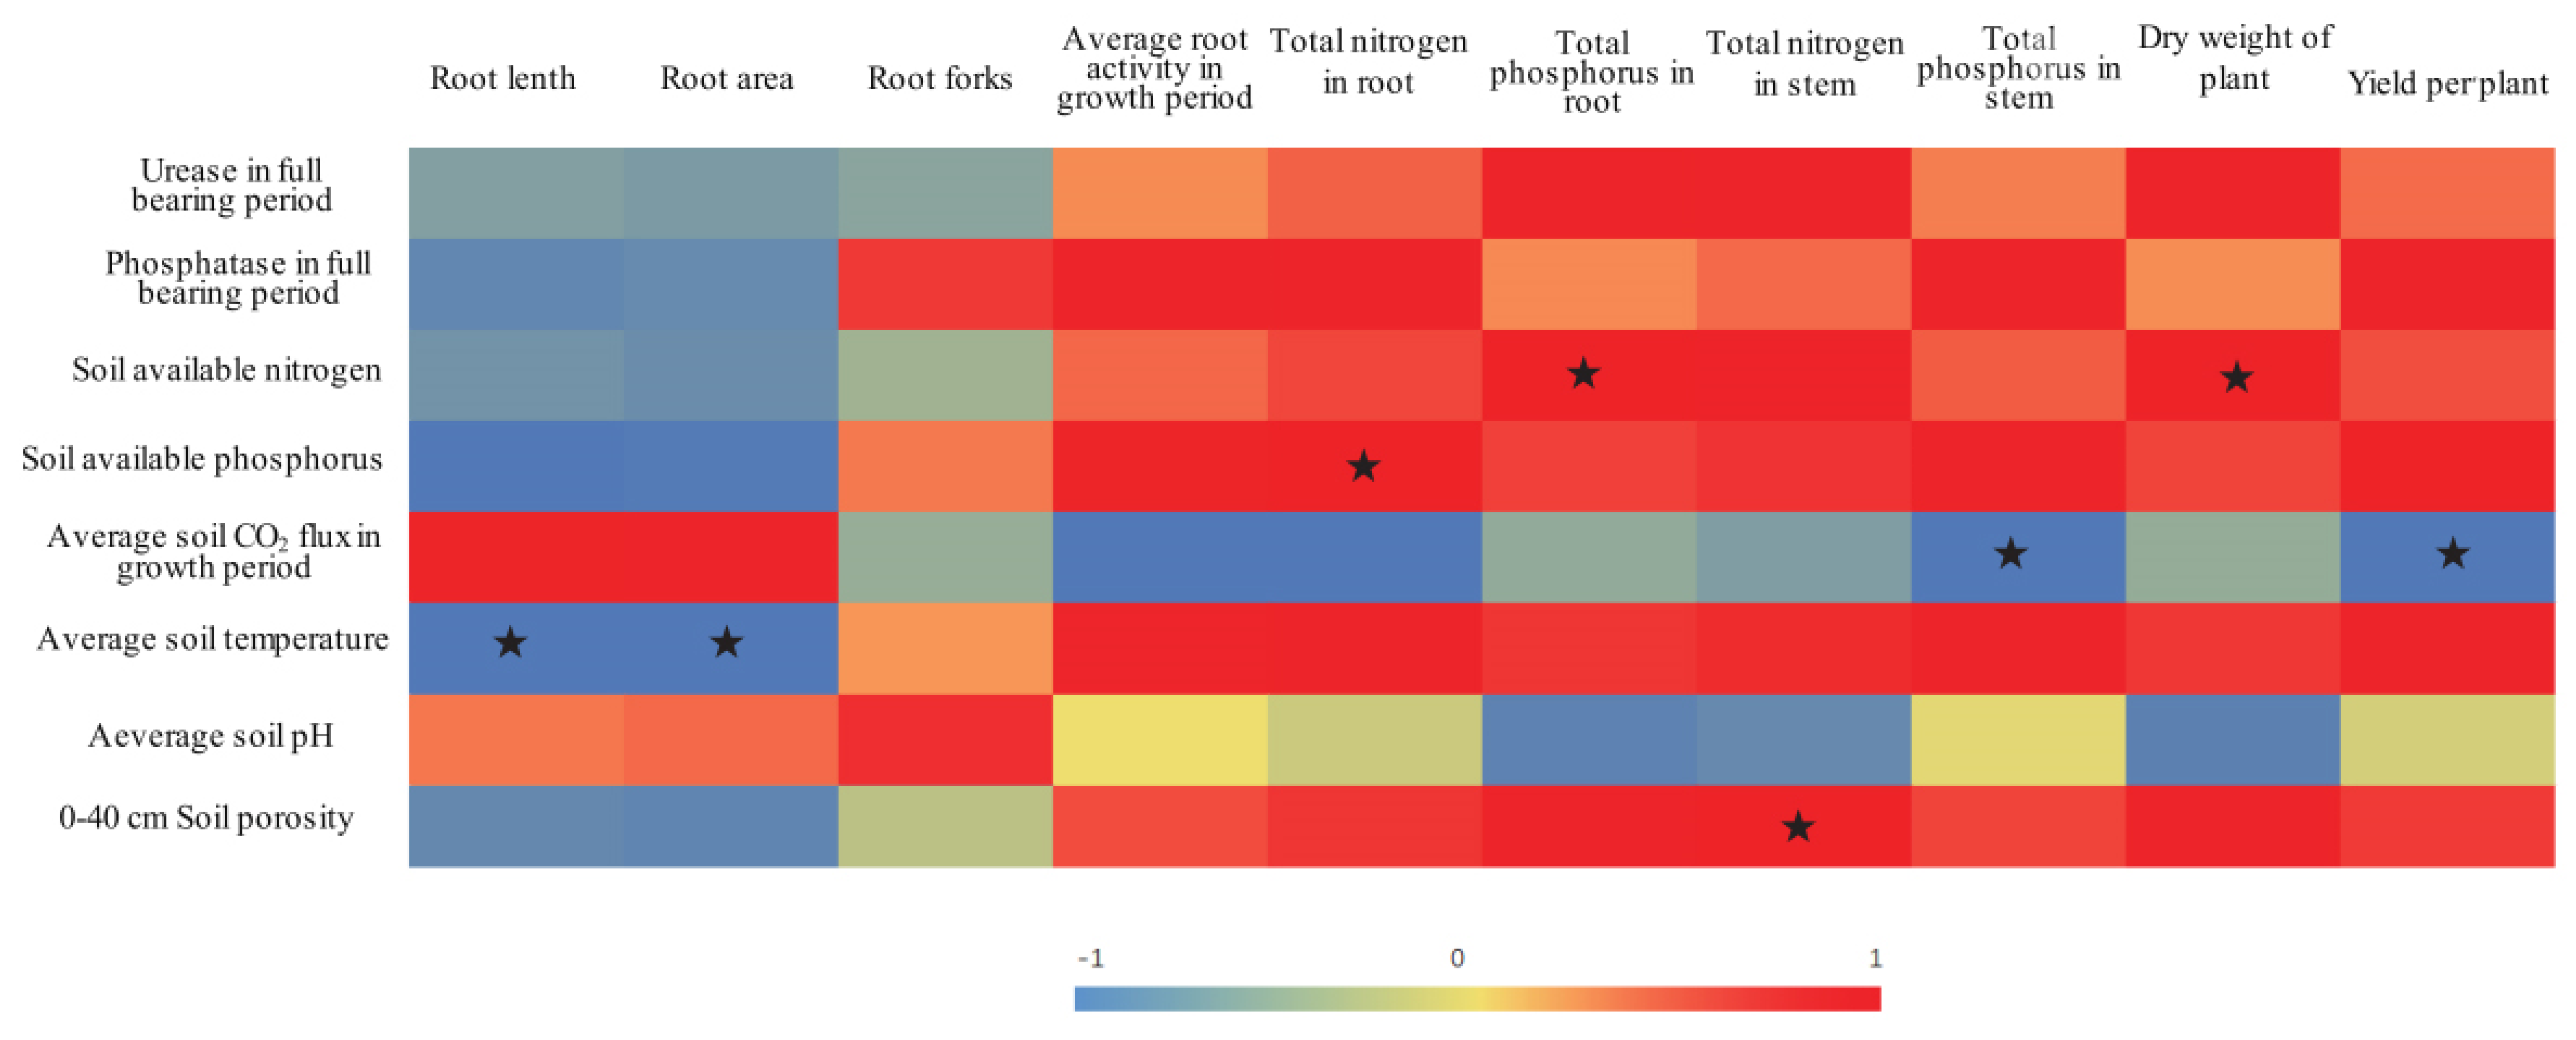
The heterogeneous conditions of the soil environment within the rhizosphere resulting from ADI treatment with various irrigation amounts further affected the soil nutrient absorption by the tomato plants [13]. The average soil porosity of the 0–40-cm soil layer was significantly and positively correlated with the TN content in the stems of the tomato plants (Figure 3). Furthermore, the growth status of the stems (which are important channels of nutrients) affects the absorption of nutrients by other organs in the plant. The results of the present study showed that the soil porosity of the 0–40-cm layer in the A50 treatment was significantly lower than the soil porosity in the A60 and A70 treatments. Accordingly, the results showed that the TN and TP contents in both the tomato stems and roots in the A50 treatment were significantly lower than those in the A60 and A70 treatments, respectively (Table 2).
However, the results of the present study also revealed no significant differences in the root area or the number of root forks between the A50 and A70 treatments, but the A50 treatment presented the longest roots (Table 5). Therefore, both soil drought stress and sufficient moisture promoted some root indices. One study demonstrated that, under certain soil drought stress conditions, the hydrotropic conditions cause roots to increase in terms of both length and area and in terms of numbers of root forks [53], all of which would help roots absorb water and nutrients from deeper and thicker soil layers [54]. Although the A50 treatment promoted root growth and although the experimental results also showed a positive correlation between soil nutrient levels and root fork number, root activity, and plant growth (Figure 3), the soil nutrient activation and nutrient absorption by the tomato plants in the A50 treatment were significantly lower than those in the A70 treatment (which involved a greater irrigation amount). This effect is due to relative water deficiency limiting soil nutrient activation and transport, eventually limiting the capacity of tomato plants to both absorb and use soil nutrients.
In contrast, relatively sufficient water conditions help roots absorb activated soil nutrients and increase root activity and root fork numbers, which could strengthen the dynamic nutrient content gradient formed within the rhizosphere, thereby further promoting soil nutrient migration and absorption. N and P metabolism work synergistically in the soil [55,56]. Additionally, increasing soil available P contents could significantly increase N contents in roots; similarly, increasing soil available N contents could also significantly increase P contents in the roots (Figure 3). Accordingly, the results of this study showed that the relatively adequate ADI irrigation level (A70) not only increased the root fork number and root activity but also promoted the soil available P content, the TN content in the roots, and the TP content in the stems.
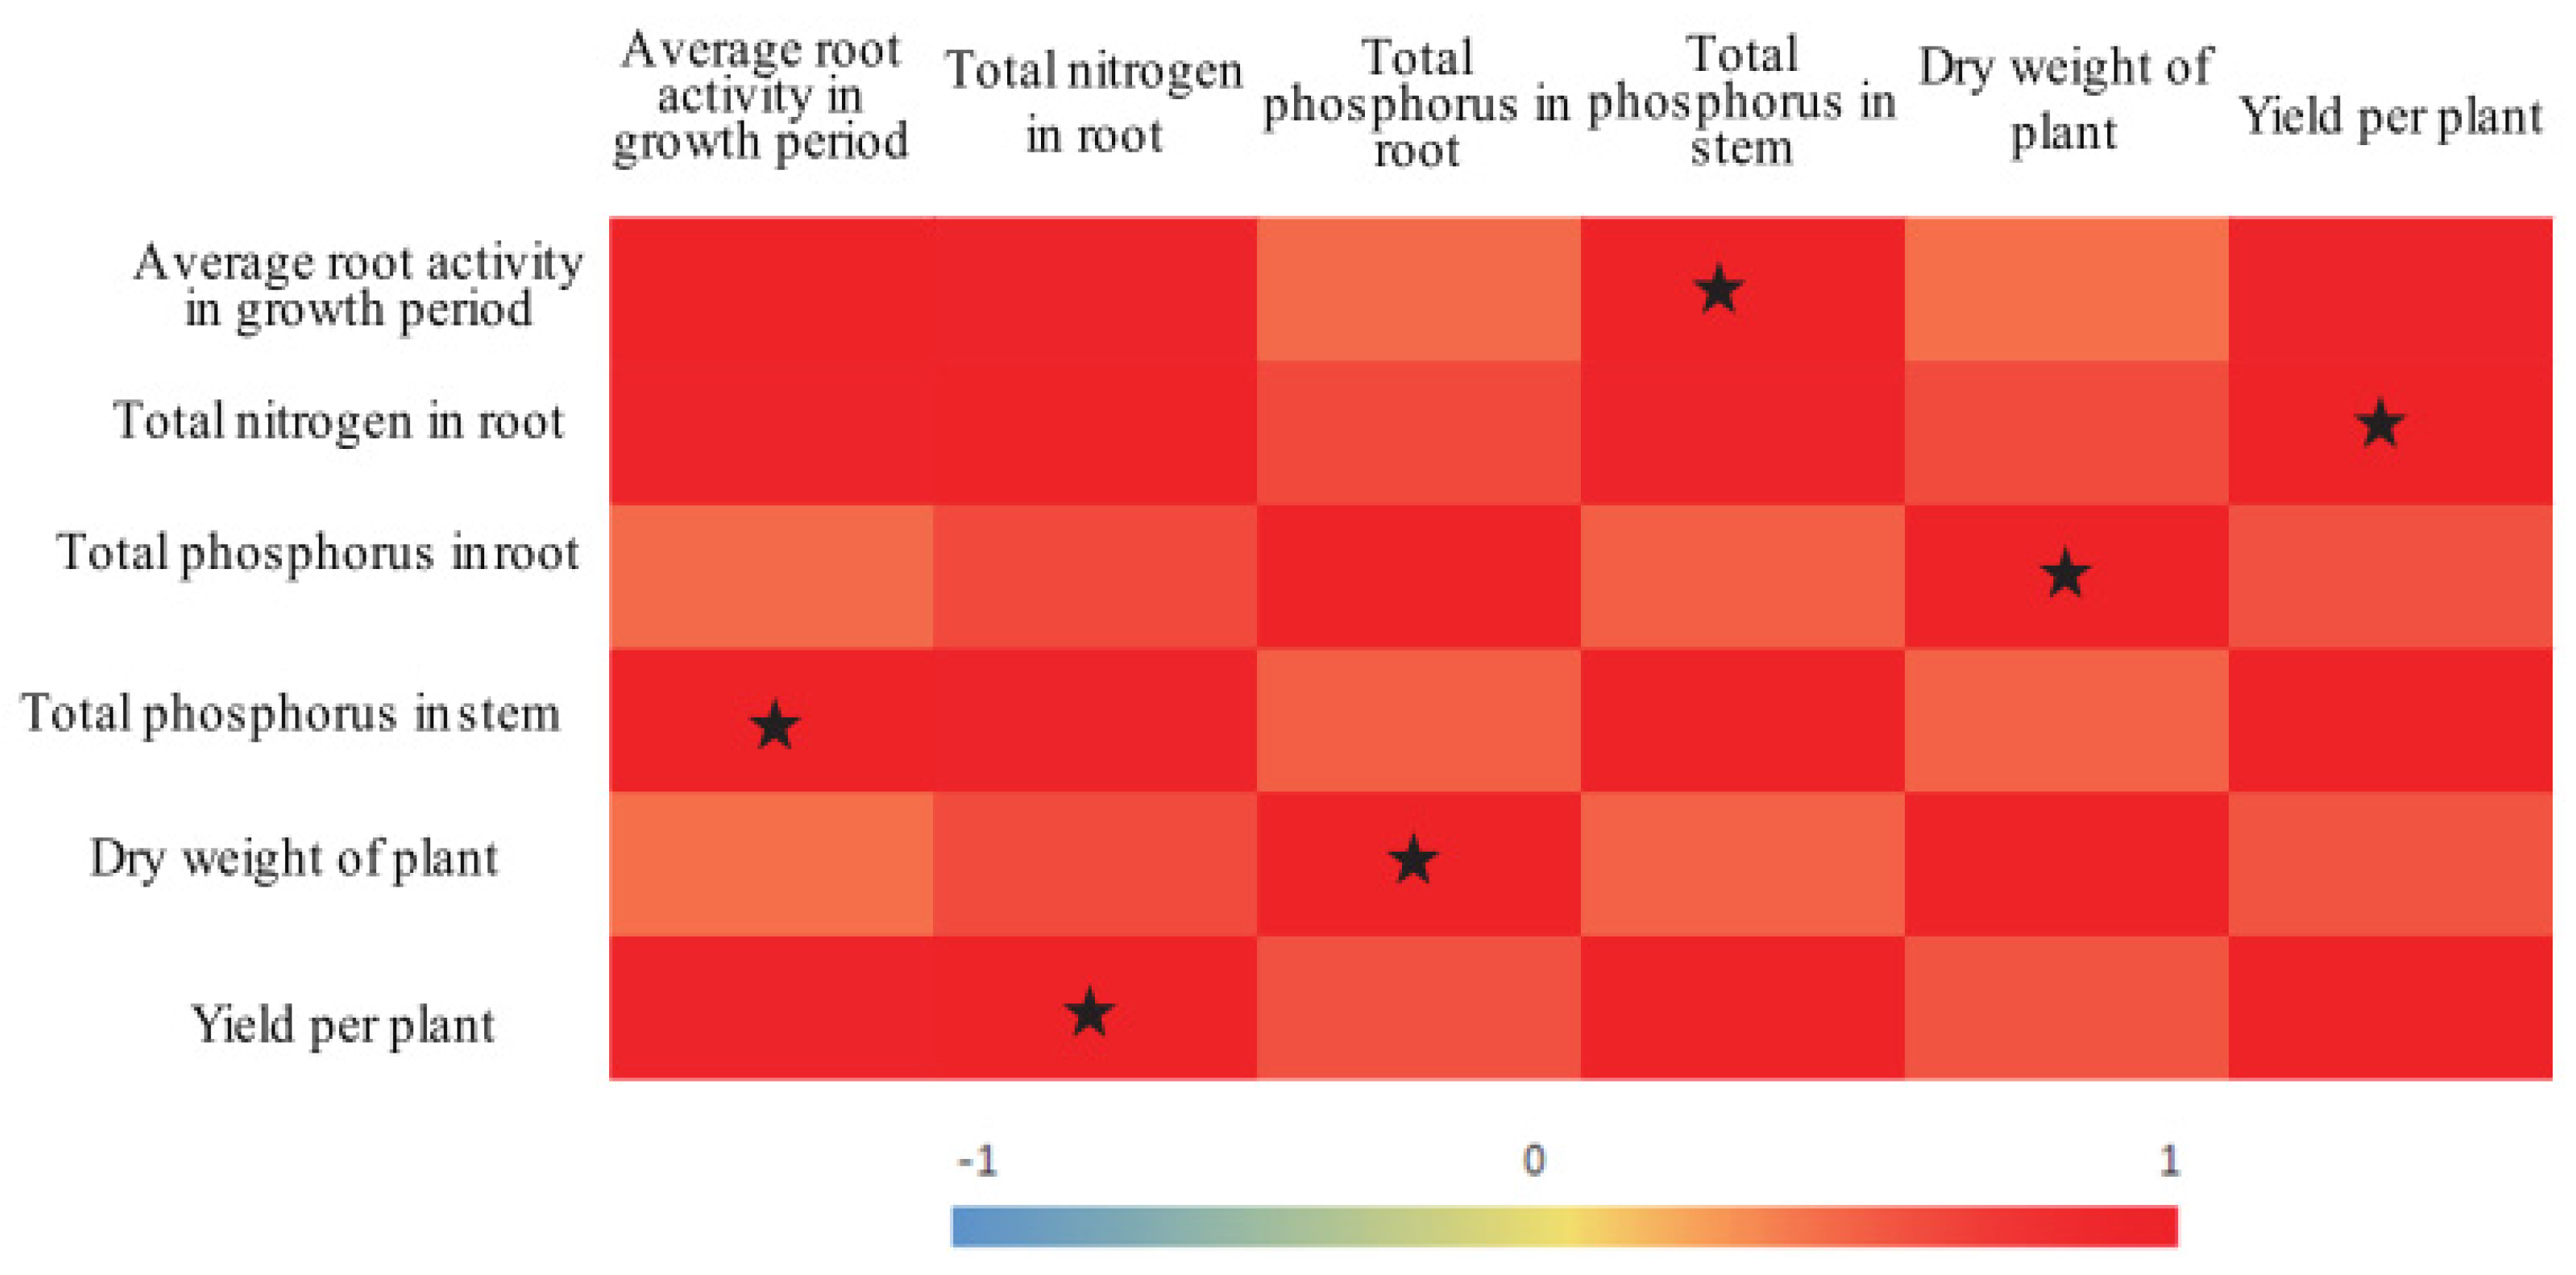
Increased yield is the main target of agricultural production. The results of the present study showed that tomato yields were significantly and positively correlated with the TN content in the roots, that the plant dry matter mass was significantly and positively correlated with the TP content in the roots, and that root activity was significantly and positively correlated with the TP content in the stems (Figure 4). Treatment A70 resulted in relatively high root activity, relatively high TN contents in the roots, relatively high TP contents in the stems, and the greatest yield. In addition, compared with that in the CK treatment, the IWUE in the A70 treatment increased by 17.05% (Table 4). Therefore, it is recommended that 70% of field capacity be the lower limit of irrigation when ADI is implemented.

5. Conclusions

Compared with that under DI-PFM, the rhizosphere of tomato plants under ADI presented an optimized bacterial community structure and soil N and P metabolism. The results showed that ADI with relatively high lower limits (60% and 70% of field capacity) increased the N and P availability in the soil and stimulated the tomato roots to absorb both N and P. Furthermore, when the lower limit was 70% of SAW, compared with DI-PFM, ADI not only promoted beneficial soil-root-bacterium interactions in the tomato rhizosphere, improved the soil nutrient activation and the absorption of both N and P by tomato plants, and led to the greatest tomato yield but also increased the IWUE by 17.05%. Therefore, 70% of SAW is recommended when ADI is implemented.

Author Contributions

J.W. and W.N. conceived the hypothesis of this study. J.W. and Y.L. carried out the research. All authors approved the final manuscript. All authors have read and agreed to the published version of the manuscript.

Funding

This study was jointly supported by the National Key Research Project of China “13th Five Year Plan” (2016YFC0400202), the Natural Science Foundation of China (No.51679205) and the Water Science and Technology Research and Extension Projects of Shanxi Province in China (TZ2019021).

Conflicts of Interest

The authors declare no conflict of interest.

References

  1. Ju, X.T.; Kou, C.L.; Christie, P.; Dou, Z.X.; Zhang, F.S. Changes in the soil environment from excessive application of fertilizers and manures to two contrasting intensive cropping systems on the North China Plain. Environ. Pollut. 2007, 145, 497–506. [Google Scholar] [CrossRef] [PubMed] [Green Version]
  2. Kong, X.; Zhang, F.; Wei, Q.; Xu, Y.; Hu, J. Influence of land use change on soil nutrients in an intensive agricultural region of north china. Soil Till. Res. 2006, 88, 85–94. [Google Scholar] [CrossRef]
  3. Moreno, M.T.; Carmona, E.; de Santiago, A.; Ordovás, J.; Delgado, A. Olive husk compost improves the quality of intensively cultivated agricultural soils. Land Degrad. Dev. 2016, 27, 449–459. [Google Scholar] [CrossRef]
  4. Lal, R. Soil quality changes under continuous cropping for seventeen seasons of an alfisol in western Nigeria. Land Degrad. Dev. 1998, 9, 259–274. [Google Scholar] [CrossRef]
  5. Davies, W.J.; Zhang, J.; Yang, J.; Dodd, I.C. Novel crop science to improve yield and resource use efficiency in water-limited agriculture. J. Agric. Sci. 2011, 149, 123–131. [Google Scholar] [CrossRef]
  6. Ahmadi, S.H.; Andersen, M.N.; Plauborg, F.; Poulsen, R.T.; Jensen, C.R.; Sepaskhah, A.R.; Hansen, S. Effects of irrigation strategies and soils on field grown potatoes: Gas exchange and xylem [ABA]. Agric. Water Manag. 2010, 97, 1486–1494. [Google Scholar] [CrossRef]
  7. Wang, Z.; Kang, S.; Jensen, C.R.; Liu, F. Alternate partial root-zone irrigation reduces bundle-sheath cell leakage to CO2 and enhances photosynthetic capacity in maize leaves. J. Exp. Bot. 2012, 63, 1145–1153. [Google Scholar] [CrossRef] [Green Version]
  8. Du, S.; Kang, S.; Li, F.; Du, T. Water use efficiency is improved by alternate partial root-zone irrigation of apple in arid northwest China. Agric. Water Manag. 2017, 179, 184–192. [Google Scholar] [CrossRef]
  9. Liang, H.; Li, F.; Nong, M. Effects of alternate partial root-zone irrigation on yield and water use of sticky maize with fertigation. Agric. Water Manag. 2013, 116, 242–247. [Google Scholar] [CrossRef]
  10. Songsri, P.; Jogloy, S.; Vorasoot, N.; Akkasaeng, C.; Patanothai, A.; Holbrook, C.C. Root distributionof drought-resistant peanut genotypes in response to drought. J. Agron. Crop. Sci. 2008, 194, 92–103. [Google Scholar] [CrossRef]
  11. Chen, C.; Xu, F.; Zhu, J.R.; Xu, W.W. Nitrogen forms affect root growth, photosynthesis, and yield of tomato under alternate partial root-zone irrigation. J. Plant Nutr. Soil Sci. 2016, 179, 104–112. [Google Scholar] [CrossRef]
  12. Lima, R.S.N.D.; Assis-Figueiredo, F.A.M.M.; Martins, A.; Deus, B.C.D.S.D.; Ferraz, T.M.; Assis-Gomes, M.M.A.; Sousa, E.F.; Glenn, D.M.; Campostrini, E. Partial rootzone drying (PRD) and regulated deficit irrigation (RDI) effects on stomatal conductance, growth, photosynthetic capacity, and water-use efficiency of papaya. Sci. Hortic. 2015, 183, 13–22. [Google Scholar] [CrossRef]
  13. Shao, G.C.; Zhang, Z.Y.; Liu, N.; Yu, S.E.; Xing, W.G. Comparative effects of deficit irrigation (DI) and partial rootzone drying (PRD) on soil water distribution, water use, growth and yield in greenhouse grown hot Pepper. Sci. Hortic. 2008, 119, 11–16. [Google Scholar] [CrossRef]
  14. Wang, H.; Liu, F.; Andersen, M.N.; Jensen, C.R. Comparative effects of partial root-zone drying and deficitirrigation on nitrogen uptake in potatoes (Solanum tuberosum L.). Irrig. Sci. 2009, 27, 443–447. [Google Scholar] [CrossRef]
  15. Zhang, Q.; Wu, S.; Chen, C.; Shu, L.Z.; Zhou, X.J.; Zhu, S.N. Regulation of nitrogen forms on growth of eggplant under partial root-zone irrigation. Agric. Water Manag. 2014, 142, 56–65. [Google Scholar] [CrossRef]
  16. Doran, J.W.; Zeiss, M.R. Soil health and sustainability: Managing the biotic component of soil quality. Appl. Soil Ecol. 2000, 15, 3–11. [Google Scholar] [CrossRef] [Green Version]
  17. Santos, L.N.S.D.; Matsura, E.E.; Gonçalves, I.Z.; Barbosa, E.A.A.; Nazário, A.A.; Tuta, N.F.; Elaiuy, M.C.L.; Feitosa, D.R.C. Water storage in the soil profile under subsurface drip irrigation: Evaluating two installation depths of emitters and two water qualities. Agric. Water Manag. 2015, 170, 91–98. [Google Scholar] [CrossRef]
  18. Adesemoye, A.O.; Torbert, H.A.; Kloepper, J.W. Plant growth-promoting rhizobacteria allow reduced applicationrates of chem-ical fertilizers. Microb. Ecol. 2009, 58, 921–929. [Google Scholar] [CrossRef]
  19. Hernandez, M.; Chailloux, M. Las micorrizas arbusculares y lasbacterias rizosfericas como alternativa a la nutricion mineral deltomate. Cultiv. Trop. 2004, 25, 5–16. [Google Scholar]
  20. Cheung, M.K.; Au, C.H.; Chu, K.H.; Kwan, H.S.; Wong, C.K. Composition and genetic diversity of picoeukaryotes in subtropical coastal waters as revealed by 454 pyrosequencing. Int. Soc. Microb. Ecol. J. 2010, 4, 1053–1059. [Google Scholar] [CrossRef]
  21. Zhang, H.H.; Feng, J.; Chen, S.N.; Zhao, Z.F.; Li, B.Q.; Wang, Y.; Jia, J.Y.; Li, S.L.; Wang, Y.; Yan, M.M.; et al. Geographical patterns of nirS gene abundance and nirS-type denitrifying bacterial community associated with activated sludge from different wastewater treatment plants. Microb. Ecol. 2019, 77, 304–316. [Google Scholar] [CrossRef]
  22. Griffiths, R.I.; Thomson, B.C.; James, P.; Bell, T.; Bailey, M.; Whiteley, A.S. The bacterial biogeography of British soils. Environ. Microbiol. 2011, 13, 1642–1654. [Google Scholar] [CrossRef] [PubMed]
  23. Hayat, R.; Ali, S.; Amara, U.; Khalid, R.; Ahmed, I. Soil beneficial bacteria and their role in plant growth promotion: A review. Ann. Microbiol. 2010, 60, 579–598. [Google Scholar] [CrossRef]
  24. Tabatabai, M. Soil enzymes. In Methods of Soil Analyses, Part 2, Microbiological and Biochemical Properties; Weaver, R.W., Angle, J.S., Bottomly, P.S., Eds.; Soil Science Society of America: Madison, WI, USA, 1994; pp. 775–833. [Google Scholar]
  25. Franzluebbers, A.J.; Hons, F.M.; Zuberer, D.A. Tillage and crop effects on seasonal dynamics of soil CO2 evolution, water content, temperature, and bulk density. Appl. Soil Ecol. 1995, 2, 95–109. [Google Scholar] [CrossRef]
  26. Caporaso, J.G.; Kuczynski, J.; Stombaugh, J.; Bittinger, K.; Bushman, F.D.; Costello, E.K.; Fierer, N.; Peña, A.G.; Goodrich, J.K.; Gordon, J.I.; et al. QIIME allows analysis of high-throughput community sequencing data. Nat. Methods 2010, 7, 335–336. [Google Scholar] [CrossRef] [Green Version]
  27. Yan, M.M.; Chen, S.N.; Huang, T.L.; Li, B.Q.; Li, N.; Li, K.W.; Zong, R.R.; Miao, Y.T.; Huang, X. Community compositions of phytoplankton and eukaryotes during the mixing periods of a drinking water reservoir: Dynamics and interactions. Int. J. Environ. Res. Public Health 2020, 17, 1128. [Google Scholar] [CrossRef] [Green Version]
  28. Caporaso, J.G.; Bittinger, K.; Bushman, F.D.; Desantis, T.Z.; Andersen, G.L.; Knight, R. Pynast: A flexible tool for aligning sequences to a template alignment. Bioinformatics 2010, 26, 266–267. [Google Scholar] [CrossRef] [Green Version]
  29. Price, M.N.; Dehal, P.S.; Arkin, A.P. Fasttree 2-approximately maximum-likelihood trees for large alignments. PLoS ONE 2010, 5, e9490. [Google Scholar] [CrossRef]
  30. Wang, Q.; Garrity, G.M.; Tiedje, J.M.; Cole, J.R. Naive Bayesian classifier for rapid assignment of rRNA sequences into the new bacterial taxonomy. Appl. Environ. Microb. 2007, 73, 5261–5267. [Google Scholar] [CrossRef] [Green Version]
  31. Quast, C.; Pruesse, E.; Yilmaz, P.; Gerken, J.; Schweer, T.; Yarza, P.; Peplies, J.; Glöckner, F.O. The silva ribosomal rna gene database project: Improved data processing and web-based tools. Nucleic Acids Res. 2013, 41, 590–596. [Google Scholar] [CrossRef]
  32. Langille, M.G.; Zaneveld, J.; Caporaso, J.G.; Mcdonald, D.; Knights, D.; Reyes, J.A.; Clemente, J.C.; Burkepile, D.E.; Thurber, R.L.V.; Knight, R.; et al. Predictive functional profiling of microbial communities using 16s rrna marker gene sequences. Nat. Biotechnol. 2013, 31, 814–821. [Google Scholar] [CrossRef] [PubMed]
  33. Kanehisa, M.; Goto, S. KEGG: Kyoto encyclopedia of genes and genomes. Nucleic Acids Res. 2000, 28, 27–30. [Google Scholar] [CrossRef] [PubMed]
  34. Bray, J.R.; Curtis, J.T. An ordination of upland forest communities of southern Wisconsin. Ecol. Monogr. 1957, 27, 325–349. [Google Scholar] [CrossRef]
  35. R Core Team. R: A language and environment for statistical computing. R foundation for statistical computing, vienna, austria. Computing 2013, 14, 12–21. [Google Scholar]
  36. Oksanen, J.; Blanchet, F.G.; Kindt, R.; Legendre, P.; Minchin, P.R.; Hara, R.B.O.; Simpson, G.L.; Solymos, P.; Stevens, M.H.H.; Wagner, H.H. Vegan: Community ecology package. R package version. 2.0–10. J. Stat. Softw. 2013, 48, 1–21. [Google Scholar]
  37. Jones, D.L.; Oburger, E. Solubilization of phosphorus by soil microorganisms. In Phosphorus in Action; Springer: Berlin/Heidelberg, Germany, 2010; pp. 169–198. [Google Scholar]
  38. Hutton, R.J.; Loveys, B.R. A partial root zone drying irrigation strategy for citrus-effects on water use efficiency and fruit characteristics. Agric. Water Manag. 2011, 98, 1485–1496. [Google Scholar] [CrossRef]
  39. Bronick, C.J.; Lal, R. Soil structure and management: A review. Geoderma 2005, 124, 3–22. [Google Scholar] [CrossRef]
  40. Taylor, A.E.; Zeglin, L.H.; Dooley, S.; Myrold, D.D.; Bottomley, P.J. Evidence for different contributions of archaeaand bacteria to the ammonia-oxidizing potential ofdiverse Oregon soils. Appl. Environ. Microb. 2010, 76, 7691–7698. [Google Scholar] [CrossRef] [Green Version]
  41. Shahnazari, A.; Ahmadi, S.H.; Laerke, P.E.; Liu, F.L.; Plauborg, F.; Jacobsen, S.E.; Jensen, C.R.; Andersen, M.N. Nitrogen dynamics in the soil-plant system under deficit and partial root-zone drying irrigation strategies in potatoes. Eur. J. Agron. 2008, 28, 65–73. [Google Scholar] [CrossRef]
  42. Chaparro, J.M.; Sheflin, A.M.; Manter, D.K.; Vivanco, J.M. Manipulating the soil microbiome to increase soil health and plant fertility. Biol. Fert. Soils 2012, 48, 489–499. [Google Scholar] [CrossRef]
  43. Raine, S.R.; Meyer, W.S.; Rassam, D.W.; Hutson, J.L.; Cook, F.J. Soil-water and solute movement under precision irrigation: Knowledge gaps for managing sustainable root zones. Irrig. Sci. 2007, 26, 91–100. [Google Scholar] [CrossRef]
  44. Williams, M.A.; Rice, C.W. Seven years of enhanced water availability influences the physiological, structural, and functional attributes of a soil microbial community. Appl. Soil Ecol. 2006, 35, 535–545. [Google Scholar] [CrossRef]
  45. Torsvik, V.; Øvreås, L. Microbial diversity and function in soil: From genes to ecosystems. Curr. Opin. Microbiol. 2002, 5, 240–245. [Google Scholar] [CrossRef]
  46. Adu, J.K.; Oades, J.M. Physical factors influencing decomposition of organic materials in soil aggregates. Soil Biol. Biochem. 1978, 10, 109–115. [Google Scholar] [CrossRef]
  47. Kemper, W.D.; Rosenau, R.; Nelson, S. Gas displacement and aggregate stability of soil. Soil. Sci. Soc. Am. J. 1985, 49, 25–28. [Google Scholar] [CrossRef] [Green Version]
  48. Wu, J.; Brookes, P.C. The proportional mineralisation of microbial biomass and organic matter caused by air-drying and rewetting of a grassland soil. Soil Biol. Biochem. 2005, 37, 507–515. [Google Scholar] [CrossRef]
  49. González, E.M.; Larrainzar, E.; Marino, D.; Wienkoop, S.; Gil-Quintana, E.; Arrese-lgor, C. Physiological responses of N2-fixing legumes to water limitation. In Legume Nitrogen Fixation in a Changing Environment; Springer International Publishing: Cham, Switzerland, 2015; pp. 5–33. [Google Scholar]
  50. Hinsinger, P.; Herrmann, L.; Lesueur, D.; Robin, A.; Trap, J.; Waithaisong, K.; Plassard, C. Impact of roots, microorganisms and microfauna on the fate of soil phosphorus in the rhizosphere. Annual Plant Rev. Online 2018, 48, 377–407. [Google Scholar]
  51. Nardi, S.; Pizzeghello, D.; Schiavon, M.; Ertani, A. Plant biostimulants: Physiological responses induced by protein hydrolyzed-based products and humic substances in plant metabolism. Sci. Agric. 2016, 73, 18–23. [Google Scholar] [CrossRef] [Green Version]
  52. Pugliese, M.; Liu, B.P.; Gullino, M.L.; Garibaldi, A. Microbial enrichment of compost with biological control agents to enhance suppressiveness to four soil-borne diseases in greenhouse. J. Plant Dis. Protect. 2011, 118, 45–50. [Google Scholar] [CrossRef]
  53. North, G.B.; Nobel, P.S. Changes in hydraulic conductivity and anatomy caused by drying and rewetting roots of Agave desert (Agavaceae). Am. J. Bot. 1991, 78, 906–915. [Google Scholar] [CrossRef]
  54. Gregory, P.J. Roots, rhizosphere and soil: The route to a better understanding of soil science? Eur. J. Soil Sci. 2006, 57, 2–12. [Google Scholar] [CrossRef]
  55. Azcón, R.; Rodríguez, R.; Amora-Lazcano, E.; Ambrosano, E. Uptake and metabolism of nitrate in mycorrhizal plants as affected by water availability and N concentration in soil. Eur. J. Soil Sci. 2008, 59, 131–138. [Google Scholar] [CrossRef]
  56. Güsewell, S. N: P ratios in terrestrial plants: Variation and functional significance. New Phytol. 2004, 164, 243–266. [Google Scholar] [CrossRef]
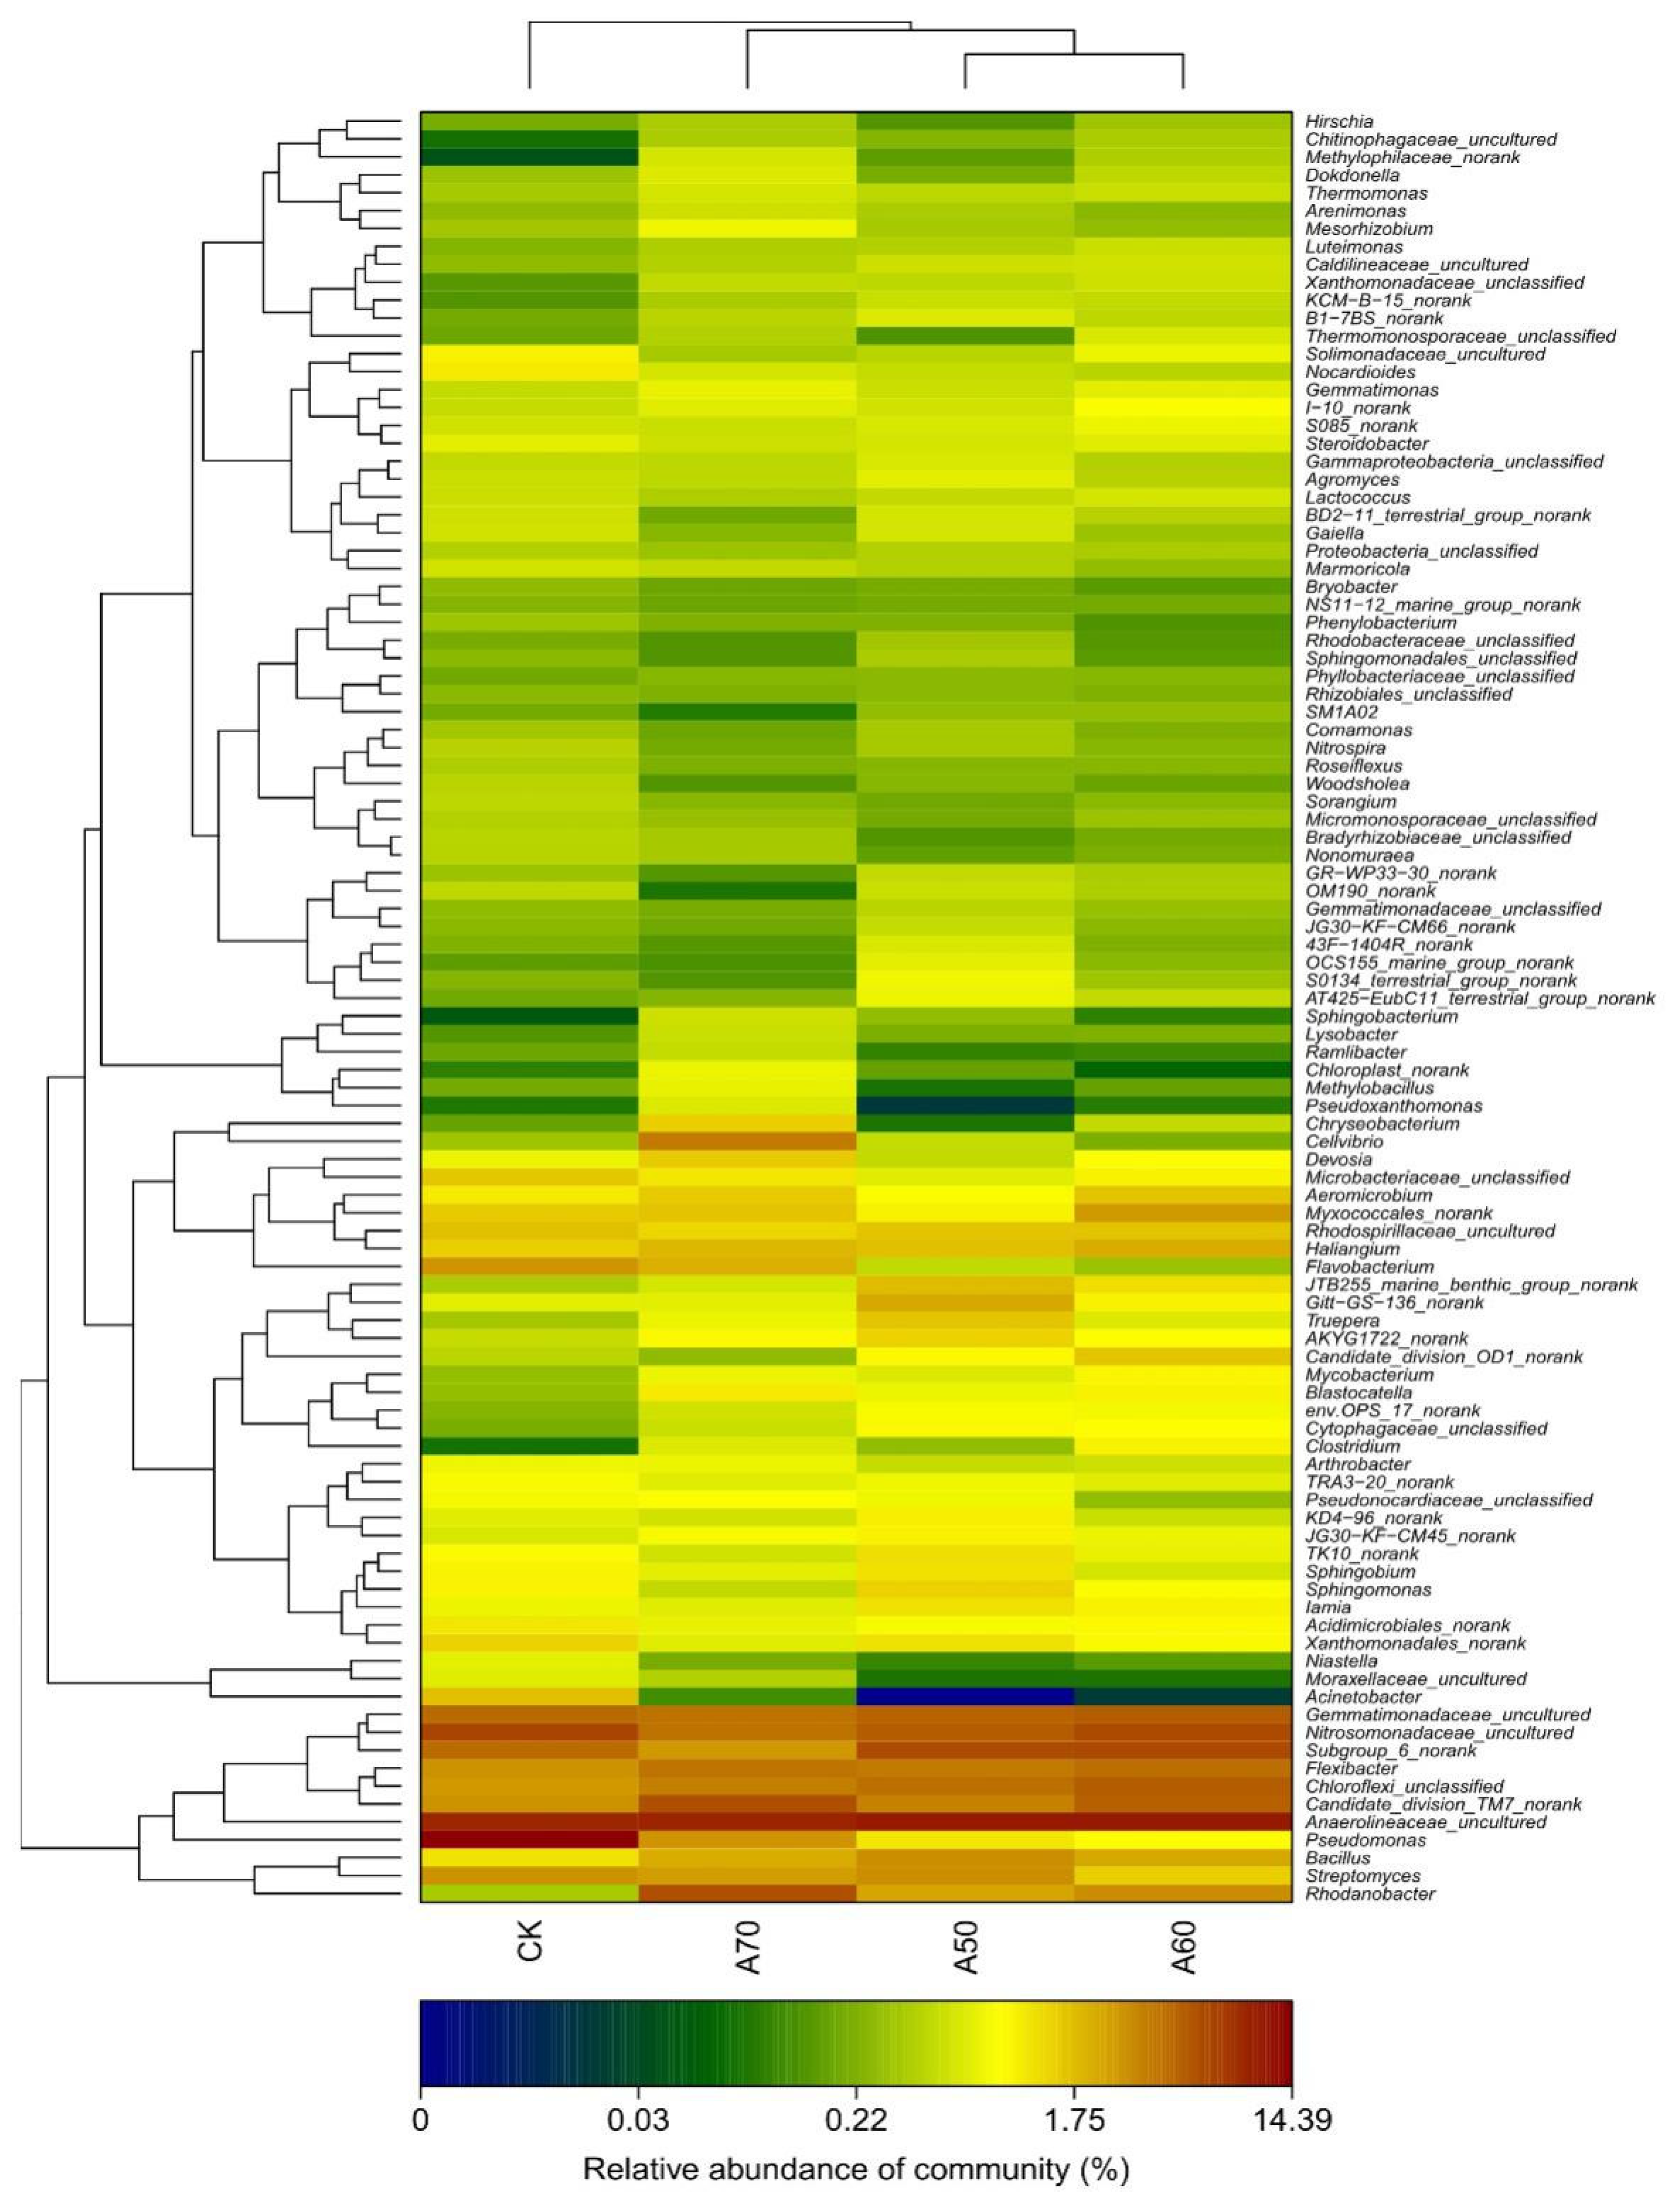
Figure 1. The bacterial community structure by genus classification level in soils receiving subjected to different treatments. Note: CK represents surface drip irrigation with plastic film mulching; A50, A60, and A70 represent alternate drip irrigation methods with lower limits of 50%, 60%, and 70% of field capacity, respectively. The different lowercase letters indicate significant differences among the different results (p < 0.05). The different colors represent the relative abundance of different bacterial classifications. The same is true for the figures below.
Agronomy 10 00315 g001
Figure 2. Redundancy analyses (RDA) of the soil bacterial community. Note: Ordination plot of the RDA results generated from the top 30 bacterial genera and the three most significant soil-related factors (soil CO2 flux, root length, and root activity). The bacteria are shown as different “+” symbols; the soil-related factors are shown as red arrows.
Agronomy 10 00315 g002
Figure 3. Correlations between soil indices and tomato growth. Note: The different color depths indicate differences in the strength of the correlation; the correlation values are indicated by a number from −1 to 1. The stars indicate significant correlations (p < 0.05).
Agronomy 10 00315 g003
Figure 4. Correlations between tomato growth indices. Note: The different color depths indicate differences in the strength of the correlation; the correlation values are indicated by a number from −1 to 1. The stars indicate significant correlations (p < 0.05).
Agronomy 10 00315 g004
Table 1. Predicted copy numbers of genes related to N and P metabolism on the basis of Kyoto Encyclopedia of Genes and Genomes (KEGG) analysis.
MetabolismCKA50A60A70Related Genes
Nitrogen metabolismNitrogen fixation2793 c3493 b3881 a3783 aK02586 nifD; K02591 nifK;
K02588 nifH; K00531 anfG
Nitrification3521 a3211 b3339 c3056 cK10944 pmoA-amoA;
K10945 pmoB-amoB;
K10946 pmoC-amoC;
K10535 hao;
K00370 narG, narZ, nxrA;
K00371 narH, narY, nxrB
Denitrification9229 c9841 b10,829 a11,285 aK00370 narG, narZ, nxrA;
K00371 narH, narY, nxrB;
K00374 narI, narV;
K02567 napA; K02568 napB;
K00368 nirK; K04561 norB;
K02305 norC; K00376 nosZ
Total15,543 c16,545 b18,049 a18,124 a
Phosphorus metabolism112,683 b117,388 a117,897 a118,024 aK00325 pntB; K05946 phoU;
K00655 plsC; K01514 ppX1;
K06189 corC; K09459 EC4.1.1.82;
K02043 phnF; K06162 phnM;
K06163 phnJ; K06164 phnI;
K02037 pstC; K02038 pstA;
K06165 phnH; K01077 phoA;
K07042 ybeY; K05781 phnK;
K05306 phnX; K06080 RcsF;
K07660 phoP; K03820 Lnt;
K06217 phoH; K09994 phnO;
K06193 phnA; K03430 phnW;
K02221 yggT; K02036 pstB;
K03306 Pit; K07221 oprO_P;
K01507 ppa; K04750 phnB;
K00937 ppk; K06019 ppaX;
K07657 phoB; K07637 phoQ;
K07636 phoR
Note: K02586 nifD, K02586 represents the KEGG orthology number of a gene, and nifD is the gene name. The different lowercase letters indicate significant differences among the different treatments (p < 0.05).
Table 2. Soil nutrient and tomato growth indices.
TreatmentUrease during the Peak Fruiting Period (µmol NH3·g−1·h−1)Phosphatase during the Peak Fruiting Period (µmol pNP·g−1·h−1)Soil Available Nitrogen (mg·kg−1)Soil Available Phosphorus (mg·kg−1)Total Nitrogen in the Roots (%)Total Phosphorus in the Roots (%)Total Nitrogen in the Stems (%)Total Phosphorus in the Stems (%)Yield Per Plant (kg)
CK8.35 a27.01 a46.91 d94.43 c1.688 c0.186 c1.580 c0.089 d2.27 b
A506.24 b3.36 c69.27 c140.75 b1.676 c0.198 b1.377 d0.092 c2.33 b
A609.34 a8.33 b102.55 a155.71 b1.804 b0.361 a1.913 a0.156 b2.56 b
A708.41 a24.95 a89.61 a274.54 a1.923 a0.295 a1.767 b0.253 a2.82 a
Note: The different lowercase letters indicate significant differences among the different treatments (p < 0.05). The same is true for the tables below.
Table 3. Correlation analysis between copies of N and P metabolism-related genes, root indices, and soil nutrient and tomato growth indices.
Nitrogen Fixation-Related Gene Copy NumberNitrification-Related Gene Copy NumberDenitrification-Related Gene Copy NumberTotal Nitrogen Metabolism-Related Gene Copy NumberTotal phoSphorus Metabolism-Related Gene Copy NumberRoot ActivityRoot ForksSoil Available NitrogenSoil Available PhosphorusYieldTotal Dry Matter
Nitrogen
Fixation-related gene copy number
1−0.730.900.95 *0.97 *0.99 *0.870.97 *0.450.800.98 *
Nitrification-related
gene copy number
−0.721−0.75−0.69−0.82−0.79−0.95−0.56−0.45−0.53−0.60
Denitrification-related
gene copy number
0.90−0.7510.98 *0.830.950.770.910.790.850.89
Total nitrogen metabolism-related gene copy number0.95 *−0.690.98 *10.870.97 *0.770.97 *0.670.95 *0.96 *
Total phosphorus metabolism-related gene copy number0.97 *−0.820.830.8710.96 *0.95 *0.870.310.660.91
Note: The data show correlation index values; * p < 0.05.
Table 4. Tomato irrigation amount and Irrigation Water-Use Efficiency (IWUE).
TreatmentIrrigation Amount/mmIWUE/(kg·m−3)
CK291.17 ab44.16 c
A50204.78 c64.38 a
A60274.42 b52.79 b
A70309.89 a51.69 b
Table 5. Soil and root growth characteristics.
TreatmentSoil pHAverage Soil Temperature T (°C)0–40-cm Soil Porosity (%)CO2 Flux (mg·m−2·min−1)Root Activity (mg TTC·g−1·h−1)Root Length (cm)Root Area (cm2)Root Forks
CK7.835 a16.20 ab39.90 b3.36 a12.53 c1473.69 d720.99 b3969.00 c
A508.219 a15.44 b40.27 b4.56 a16.22 b2524.88 a1044.55 a10307 ab
A607.697 a16.61 ab49.04 a4.36 a18.27 a2080.02 b959.31 a8979 b
A708.115 a17.18 a46.91 a4.11 a18.62 a1869.25 c929.81 a11371 a