Article

Effect of Magnesium Supply and Storage Time on Anti-Nutritive Compounds in Potato Tubers

by
Elżbieta Wszelaczyńska
1,
Jarosław Pobereżny
1,*,
Wojciech Kozera
2,
Tomasz Knapowski
2,
Elke Pawelzik
3 and
Ewa Spychaj-Fabisiak
2
1
Institute of Microbiology and Food Technology, University of Science and Technology, Kaliskiego 7 str., 85-796 Bydgoszcz, Poland
2
Department of Agricultural Chemistry, University of Science and Technology, Seminaryjna 5 str., 85-326 Bydgoszcz, Poland
3
Division Quality of Plant Products, Department of Crop Sciences, Faculty of Agricultural Sciences, Georg-August-University of Göttingen, 37073 Göttingen, Germany
*
Author to whom correspondence should be addressed.
Agronomy 2020, 10(3), 339; https://doi.org/10.3390/agronomy10030339
Submission received: 1 February 2020 / Revised: 24 February 2020 / Accepted: 26 February 2020 / Published: 2 March 2020

Abstract

:
The nutritional quality of potato tubers is cultivar-specific and depends on climate-soil conditions and agrotechnical practices, as well as the conditions during long-term storage. Studies were performed from 2009–2011 to determine the effects of magnesium fertilisation and storage duration on the contents of the anti-nutritive compound nitrates, nitrites and total glycoalkaloids (TGA) in potato tubers of mid-early cultivar “Bila” (Solanum tuberosum L.). Magnesium (Mg) was applied in doses of 0, 20, 40, 60, 80 and 100 kg MgO ha−1, respectively, in the form of kieserite–magnesium sulphate (26% MgO). Potato quality after harvest and after three and six months of storage was determined. The content of nitrates in tubers after harvest ranged from 303 to 356 mg kg−1 FW and nitrites from 1.59 to 1.67 mg kg−1 FW. Increasing magnesium fertilisation reduced the nitrate and nitrite content of tubers but increased TGA content. Possible explanations for the TGA increase after Mg supply are discussed. Tubers that contained less TGA after harvest also had less glycoalkaloids after storage. However, physical damage during harvest or transportation, exposure to light and bad storage conditions increase the concentrations of glycoalkaloids in tubers. The consumption of cultivar “Bila” would not exceed the acceptable daily intake of harmful substances.

1. Introduction

Besides wheat, maize and rice, potato is one of the world’s main food crops, being cultivated in over 80% of countries [1]. Potatoes, in addition to compounds with high nutritive value, like other vegetables, also contain substances which are undesirable in human nutrition. They are the so-called “anti-nutritive compounds”, such as nitrates, nitrites and glycoalkaloids [1,2]. In the human diet, vegetables including potatoes provide more than 90% of the total amount of harmful compounds in daily food intake and constitute their major source [3,4]. The current legal standards of Ministry of Health Regulation of 13 January 2003 (M.H.) define the maximum level of contamination with nitrates for various vegetables. According to the FAO/WHO guidelines, the acceptable daily intake (ADI) by an adult with a body weight (BW) of 70 kg should not exceed 260 mg of nitrates and 4.9 mg of nitrites [5,6]. It is known that nitrates can participate in the production of carcinogenic nitrosamines [5,6,7]. Potato tubers have a low tendency to accumulate nitrates [3,6,8].
Potato tubers have a genetically-determined low level of glycoalkaloids, and the reasons for the considerable accumulation are mostly inadequate post-harvest and agrotechnical practices [9,10,11,12]. The acceptable limit of total glycoalkaloid (TGA) content for human consumption in tubers is 200 mg kg−1 fresh weight (FW) or 1 mg kg−1 BW. The highest glycoalkaloid levels are found in plant parts with high metabolic activity. The over-accumulation of these substances in potato tubers is cultivar-specific but depends on the climate-soil conditions, agrotechnical practices and the conditions during long-term storage [10,13,14]. The natural substances (Table 1) which occur in potato tubers include glycoalkaloids (α- and β-solanine, chaconine and leptin) [15,16,17], showing a protective effect against plant pathogens [18,19]. Ninety-five percent of the total glycoalkaloids in potato tubers consists of α-chaconine (solanidine-glucose-rhamnose-rhamnose) and α-solanine (solanidine-galactose-glucose-rhamnose) [16]. The TGA content in tubers above 100 mg kg−1 of fresh weight leads to a bitter taste, and a concentration above 200 mg could have a negative effect on human health [8,15,20].
Magnesium (Mg) plays a role in the metabolism of carbohydrates and in protein synthesis and also improves the resistance of plants to stress. It is the main component of chlorophyll and activates metabolic reactions of plants. The rate of crop plant growth is modified by nitrogen application, and its use may depend to a large extent on the supply of magnesium and sulfur to plants [22,23,24].
Mg is the basic nutrient supporting nitrogen uptake, and it also controls many of the processes involved in photosynthesis and assimilates production and partitioning among plant parts [25,26,27]. Based on the physiological functions of Mg, it is possible that a shortage of Mg could lower the photosynthetic activity of leaves, the rate of dry matter and nitrogen remobilization from vegetative plant parts and the rate of transportation to developing edible plant parts [28,29]. Therefore, because of the significance of Mg in photosynthesis and assimilate translocation, a strong effect on the quality of potatoes is hypothesised, especially for the food industry (starch and sugars content) [22]. A previous field experiment by Pobereżny and Wszelaczyńska [24] using two mid-early cultivars, found that increasing the Mg supply (0–100 kg ha−1 as MgSO4) consistently increased dry matter and starch concentration. The aim of the present field experiment was to determine the effect of increasing Mg rates on the content of anti-nutritive compounds, the nitrates, nitrites and TGA in tubers after harvest and three and six months of storage.

2. Materials and Methods

2.1. Field Experiment

A field experiment, in which cereals constituted the pre-crop, was carried out at the Experimental Station of the Faculty of Agriculture and Biotechnology (53°13′ N, 17°52′ E) in the Kuyavia-Pomerania region of North-Central Poland from 2009, 2010 and 2011. According to the IUSS Working Group WRB [30], the soil used in the experiment was predominantly luvisol (LV), which had a fine sandy loam texture. The topsoil had a high content of available phosphorus (190–210 mg kg−1), a medium content of potassium (105–150 mg kg−1) (both determined with the Egner-Riehm method), a low content of magnesium (21.5–25.0 mg kg−1) (determined with the Schatschabel method) and was slightly acidic (pH in 1M KCL 5.7). The total sulphur content (0.32 g kg−1) and S-SO4 (15.7 mg kg−1) in the LV were at a medium level—measured with the nephelometric method. The organic carbon content (7.55–7.80 g kg−1) and total nitrogen (0.69–0.75 g kg−1) in the soil were rather low. The mid-early cultivar “Bila” was planted mechanically in three replications in the third decade of April using a row spacing of 0.75 × 0.35 m and a single plot size of 35 m2. This research work covers the application of randomised completely block design to the fertiliser proportion taken as the design treatment and the date of determination taken as the block.
The experiment involved five magnesium doses: 0, 20, 40, 60, 80 and 100 kg MgO ha−1, respectively, using kieserite (ESTA® Kieserit, K+S, Poland)–magnesium sulphate (26% MgO). Other mineral fertilisers were also added to the soil before planting at the following rates: nitrogen—100 kg N ha−1 as ammonium nitrate (34%), phosphorus—100 kg P2O5 ha−1 using triple superphosphate (46%) and potassium—160 kg K2O ha−1 as potassium sulphate (50%).
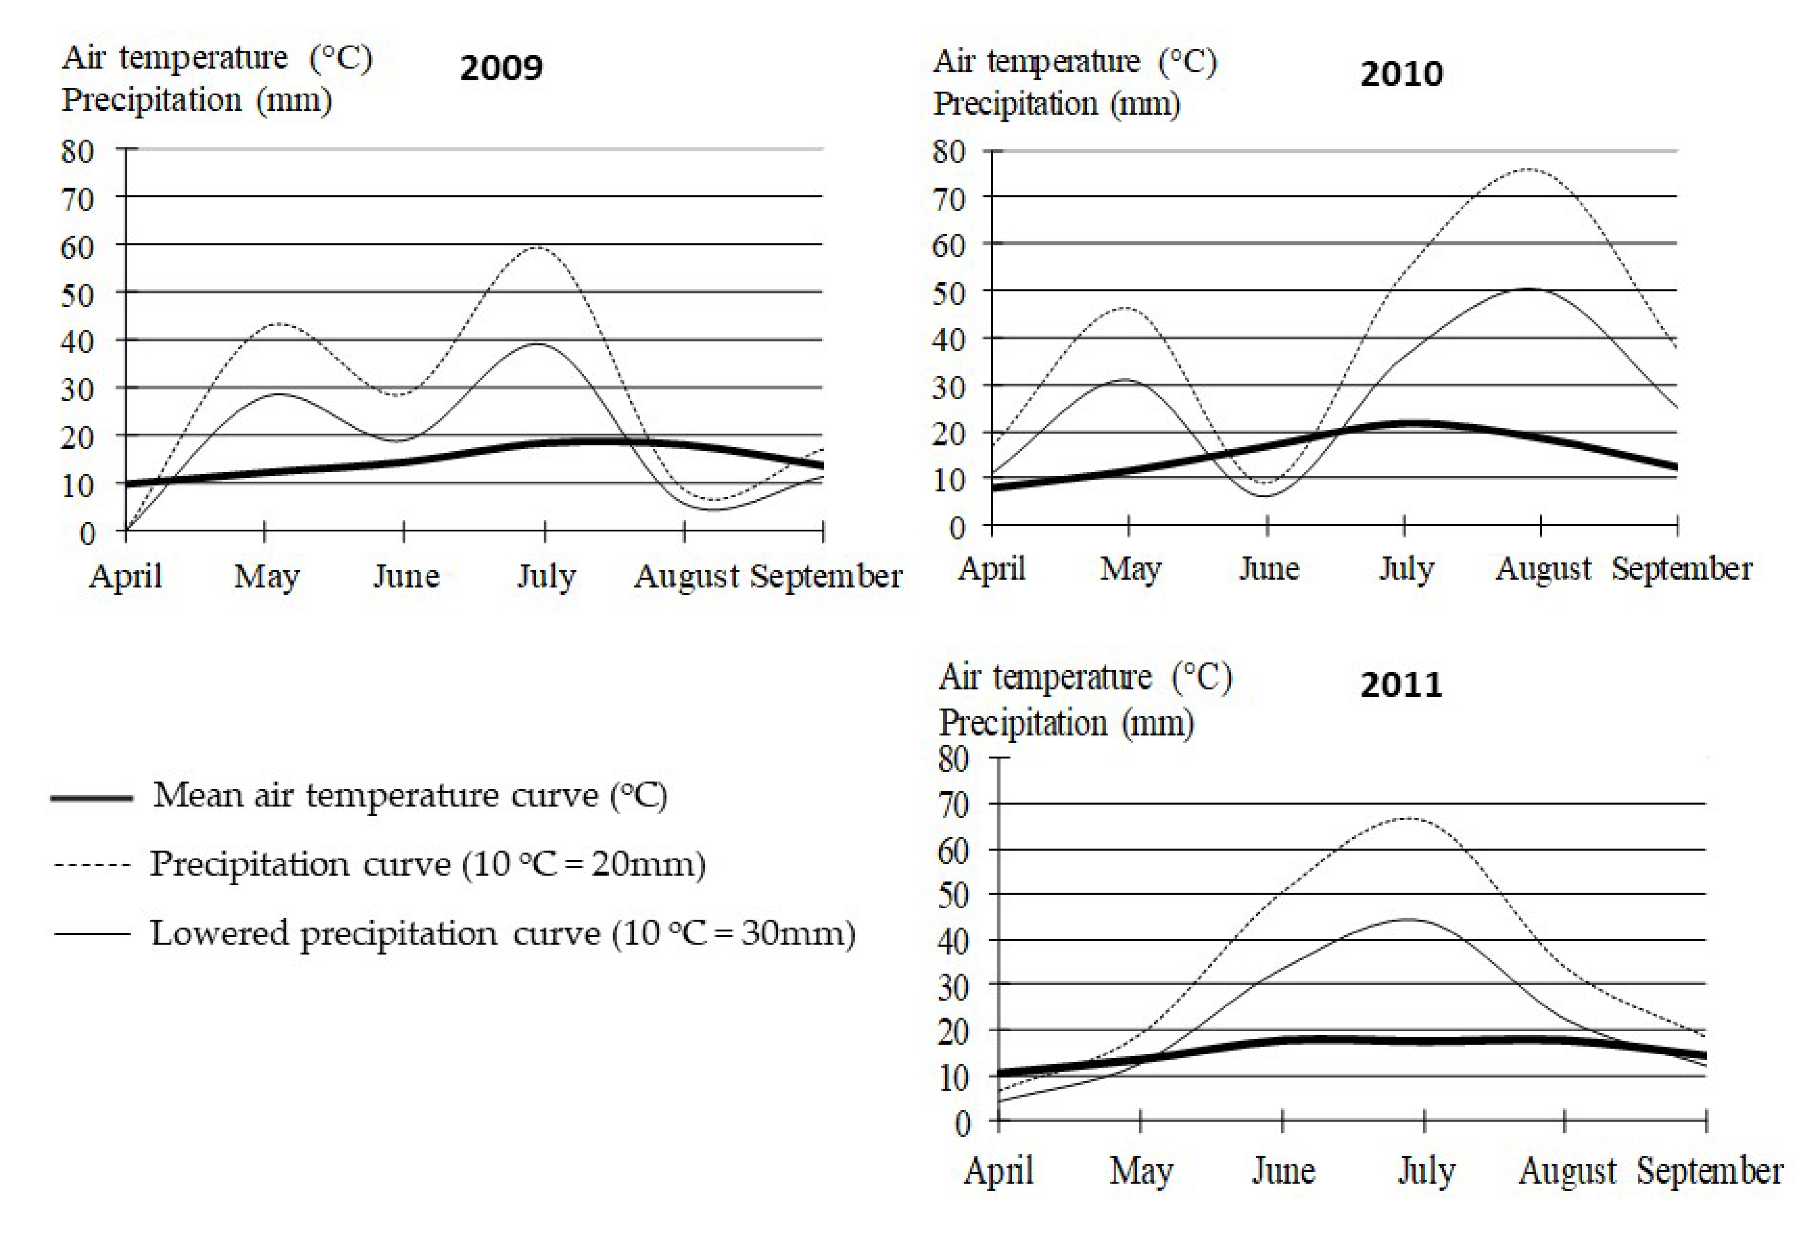
The weather conditions are presented in Figure 1. While the assessment of stress on the individual years is shown in Figure 2. The climate conditions pattern during the vegetation period was defined with the use of the mean air temperature curve (°C), rainfall curve (10 °C = 20 mm) and a lowered rainfall curve (10 °C = 30 mm) according to Gregorczyk et al. [31]. The values falling within the area defined by the rainfall curve below the temperature curve stand for the period of drought. Area determined by the lowered precipitation curve below the temperature curve—period of semi-drought. In 2009 and 2011 were unfavourable growth in the initial and final growth periods, whereas in 2010, there were unfavourable conditions for potato growth and development during tuberization. Starting from the third week of April to mid-June, semi-drought and drought occurred; the average total rainfall at that time was much lower than the multi-year mean. Furthermore, in 2010, the air temperatures in July and August were much higher as compared with the multi-year mean.

2.2. Storage Conditions

The harvest was conducted at full physiological potato maturity, and samples were taken for storage (10 kg) from each plot. The tubers were then stored in chambers in the Institute of Food Technology of the University Technology and Life Sciences in Bydgoszcz, Poland. A constant temperature and relative air humidity were then maintained over both three and six months of storage, according to the requirements of potatoes. The tubers were stored at 4 °C with a relative air humidity (Rh) of 95%.

2.3. Laboratory Analysis Procedure

The plant material was purified and foreign substances (which included soil and dust particles) removed before tubers samples were sliced to 0.5 to 1.0 cm to ensure uniformity. Raw tubers were then cut into 1-cm-thick slices and freeze-dried (CHRIST ALPHA 1–4 LSC, Osterode am Harz, Germany) in order to achieve a constant weight. Freeze-dried samples were then ground into a powder using an electric grinder (CHEMLAND, Type FW 177, Stargard Szczeciński, Poland) and stored in sealed plastic bags at −20 °C until analysis. The contents of nitrates and nitrites were then determined after harvest and again after three and six months of storage.
Nitrates (and nitrites) were extracted using a KAl(SO4)2 (Merck, Darmstadt, Germany) solution as follows. Two grams of freeze-dried potatoes and 50 mL 1% of KAl(SO4)2 extracting solution were mixed and shaken (IKA KS 130 BASIC, Warsaw, Poland) for one hour. Subsequently, 10 mL Al2(SO4)3 was added (Acros Organics, Morris Plains, NJ, USA) to it and shaken immediately before the test was conducted. Standard solutions were all prepared in the 0.025 M Al2(SO4)3 background solution, and de-ionised water was also used in the analytical research at each stage of the analysis. Nitrate concentration was determined potentiometrically by the ion-selective method of Baker and Thompson [32], as recommended by the Polish Accreditation Body. A multipurpose Elmetron CX-721 computer was used, which was equipped with a nitrate electrode, double-junction reference electrode (fill outer chamber with 0.02 M (NH4)2SO4 solution; Merck, Darmstadt, Germany), specific ion meter and a pH/millivolt (mV) meter with a 0.1 mV readability. The determination limit was established at 30 mg kg−1, and the measurement error was around 15%, depending on the sample matrix that was measured.
The total content of NO2−1 ions was determined after oxidation to NO3−1 in a previously-prepared sample of this extract according to the method described above. For this purpose, one ml of 30% H2O2 (Merck, Darmstadt, Germany) was added, and the ion-metric potential was measured after five minutes.
Glycoalkaloid concentration determination:
Potato tissue was extracted using the Bergers [33] technique, in which 500 mg of ground lyophilized material was completely dissolved in 0.5 mL of 7% (v/v) phosphoric acid and stored at −20 °C until analysis. To quantify the total TGA content, 200 µL of extract was then added to 1 mL of 0.03% (w/v) paraformaldehyde in concentrated phosphoric acid. After color development, which took 20 min, the absorption at 600 nm (SHIMADZU UV-1800, UV Spectrophotometer system, Kyoto, Japan) was measured and the TGA concentration determined based on the α-solanine and α-chaconine (Sigma-Aldrich, St. Louis, MO, USA) standard curves. The results were expressed on a dry weight basis.
In this research, the food consumption data obtained from the Board of Statistics [34] were used to calculate the average intake of the entire population. The amounts of consumed potato tubers were reduced by 20% (mean) to allow for the total combined effect of peeling, cleaning and removal of nonedible parts. Nitrate accumulation was adjusted for cooking loss, as well as from washing and peeling. Moreover, it was observed in research that a significant reduction in the nitrate and glycoalkaloid contents by 12% to 50% in potatoes were blanched in one up to three minutes [12,17]. The calculations take into account the results of daily consumption losses of 20%.

2.4. Statistical Analysis of the Results

The three-year research results were statistically verified by analysis of variance. The significance of differences was evaluated using the Tukey multiple confidence intervals for the significance level of α = 0.05. The analysis of data variance was calculated using Statistica® software, and the main effects were tested by ANOVA.
To determine a relation between doses of Mg and antinutrients also between chemicals compounds in tubers were estimated by calculating linear Pearson’s correlation coefficients and regression analysis equations. The correlation coefficient was determined for the assessment of relation between doses of Mg and antinutrients also between chemicals compounds in tubers.

3. Results and Discussion

The mean potato yield varied depended on mineral magnesium nutrition (Table 2). The Mg fertilisation has had statistically significant impact on potato tuber yields. The yield from the nonfertilised Mg field ranged from 31.5 to 35.9 t ha−1 FW, while that from the fertilised Mg field was averaged at 34.5–38.1 t ha−1 FW. Average potato tuber yields recorded in the study (particularly in the variant with Mg) were higher than the average yield in Poland [35,36].
Results from studies carried out by other authors [22,37,38] suggest that much higher yields of this crop are attainable. The results of our study indicate that a dose of 60 kg MgO ha−1 is optimal for potato cultivation (the mean yield reached 36.2 t ha−1), although similar potato tuber yields were achieved in plots with intensive mineral fertilisation of MgO: 80 and 100 kg ha−1. Orlovius and McHoul [39] obtained the mean increase in tuber yield of all trials resulting from an application of 60 kg Mg ha−1 that amounted to 3.3 t ha−1 compared to the control. While, according by Zengin et al. [40] (2008), the highest tuber yield was obtained by fertilisers that were given 40 kg MgO per ha, and the tuber yields increased changing ratios between 2.4 and 132.9%. However, there is sufficient evidence that statistically significant responses do occasionally occur in soils with small Mg indices, and this still warrants an application of c. 50 kg Mg ha−1 [41].
High significant differences were observed between years (Table 2). In 2011, which was characterised by good climatic conditions for potato cultivation (Figure 2), the yields were the highest mean, 39, 1 t ha−1 FW. These results confirm the findings by Zengin et al. [40], who verified the influence of weather conditions on potato yield volumes. These authors obtained the mean total potato tubers yield of 56, 6 t ha−1 FW in 2005, favorable for potato cultivation, and just 46,7 t ha−1 FW in less favourable 2004.

3.1. Nitrates and Nitrites Content

The research found that the content of nitrates in potatoes ranged from 303 to 356 mg kg−1 FW (Table 3). Similar results were reported by Rytel [17] and Ierna [42], who found that the content of nitrates is especially affected by fertilisation of the mineral and cultivar.
As reported by Ciećko et al. [4], supplying magnesium in the amount of 7.5 and 15 kg Mg kg−1 in the form of a foliar application received the nitrates content of 200–500 mg kg−1 FW. On the other hand, Hmelak et al. [6] and Wadas et al. [43] found a much lower nitrate content of 81.1 mg kg−1 FW on average for eleven cultivars, but they used other production systems, locations, potato cultivars and kinds of mineral fertilisation, namely HydroComplex multinutrient complex fertilisers and single-nutrient fertilisers, including Mg.
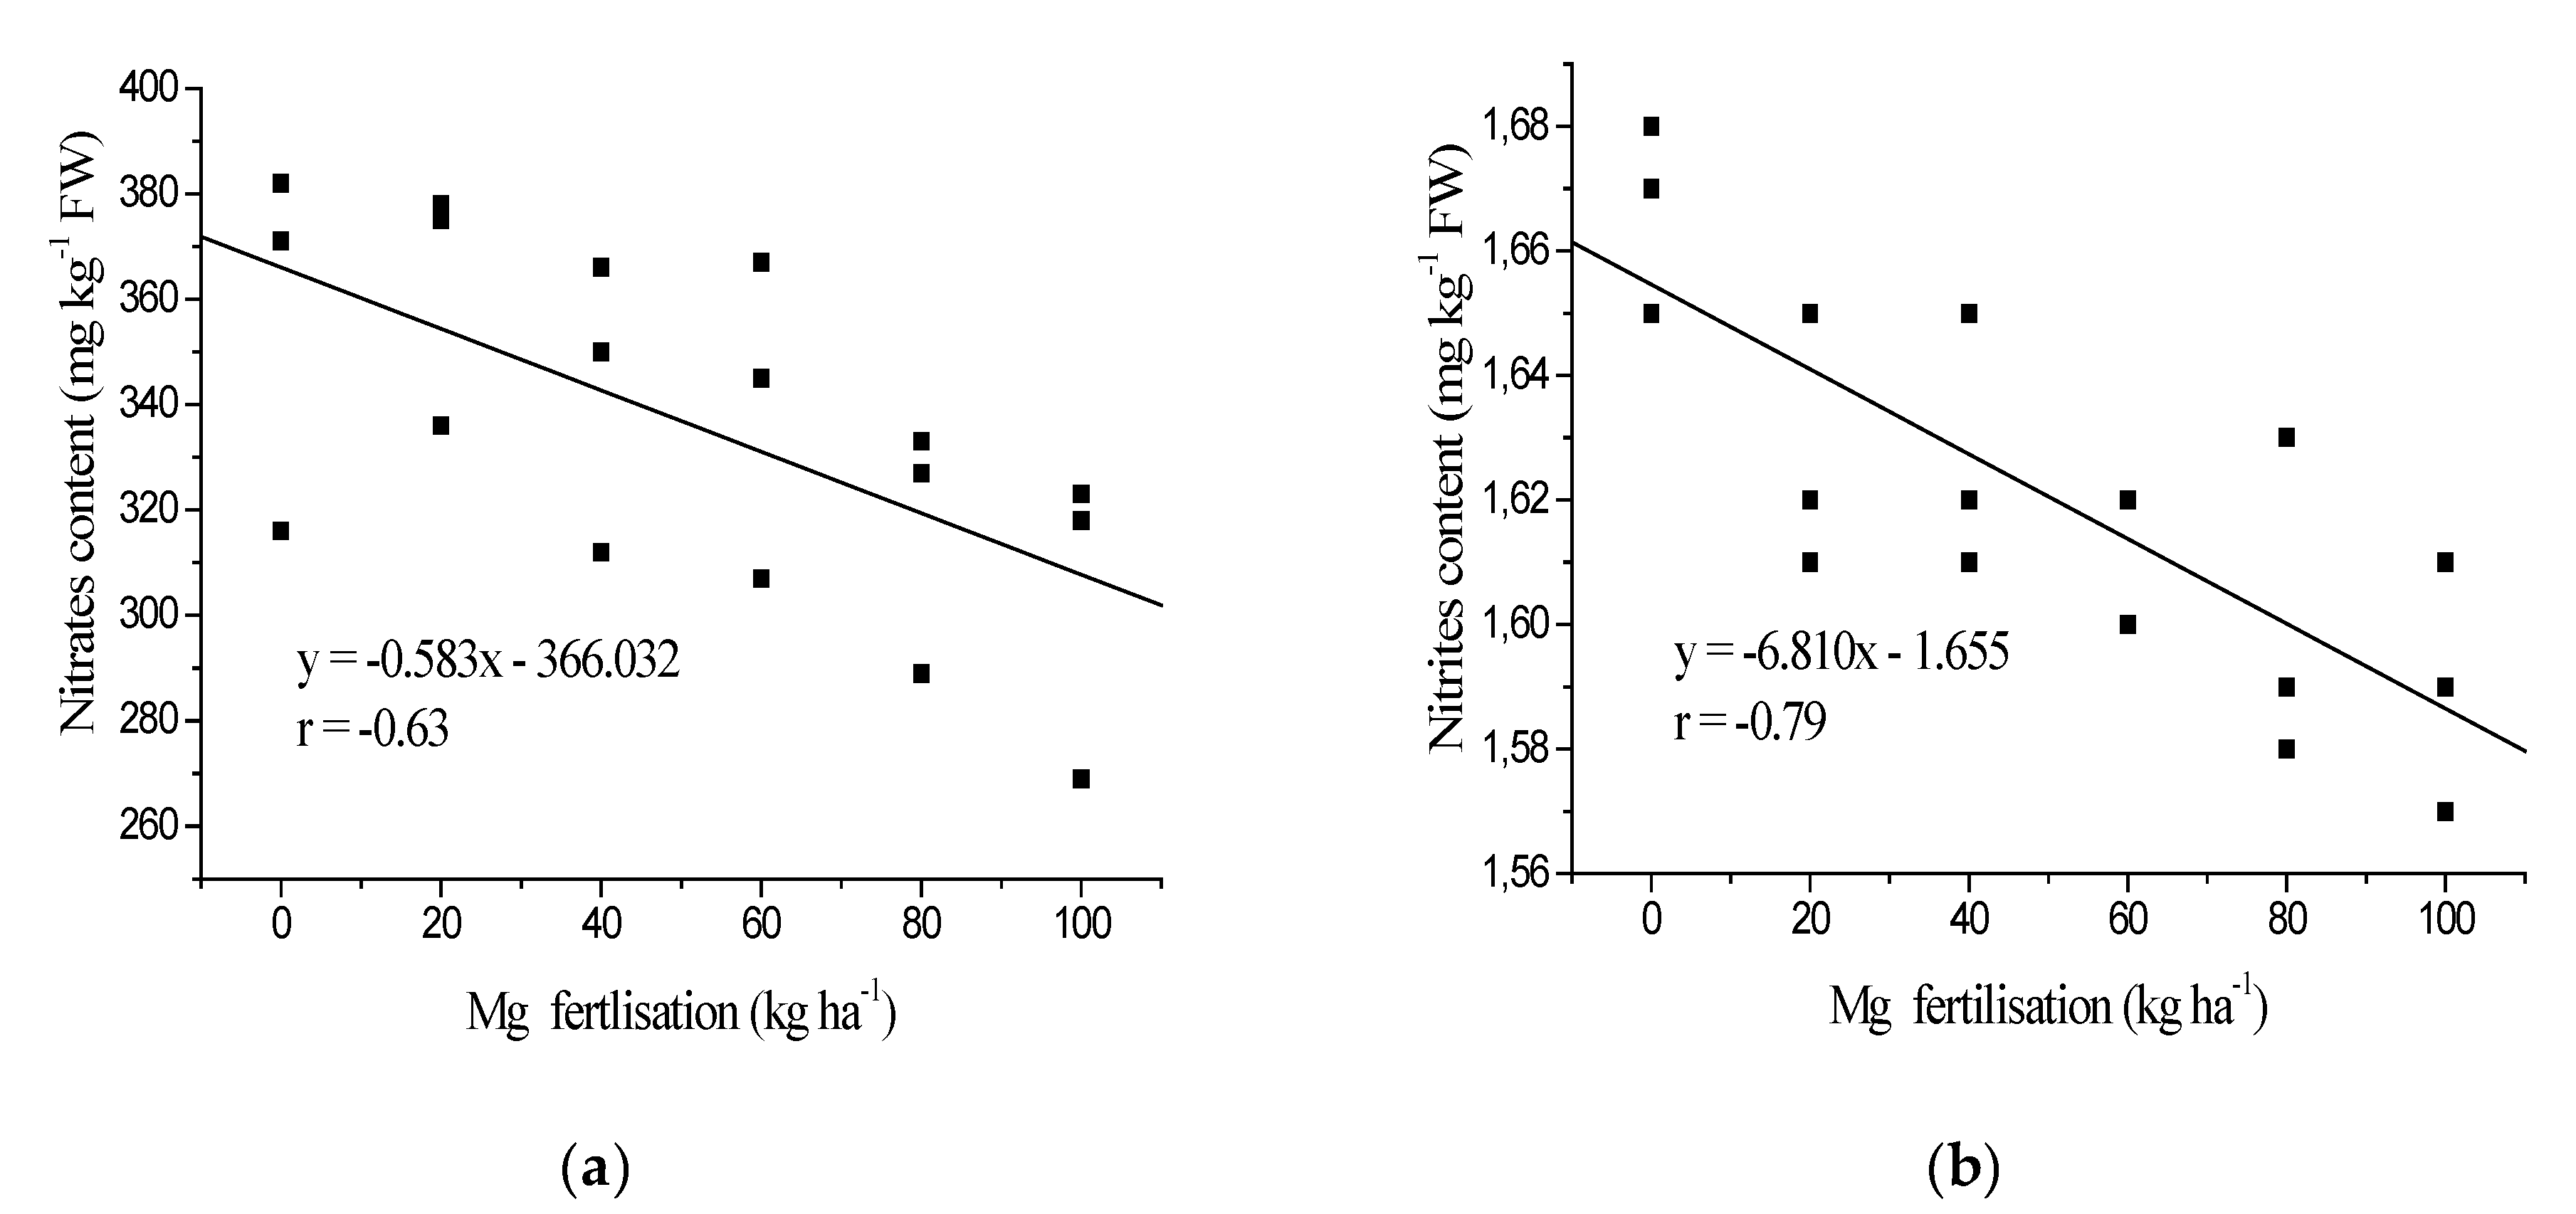
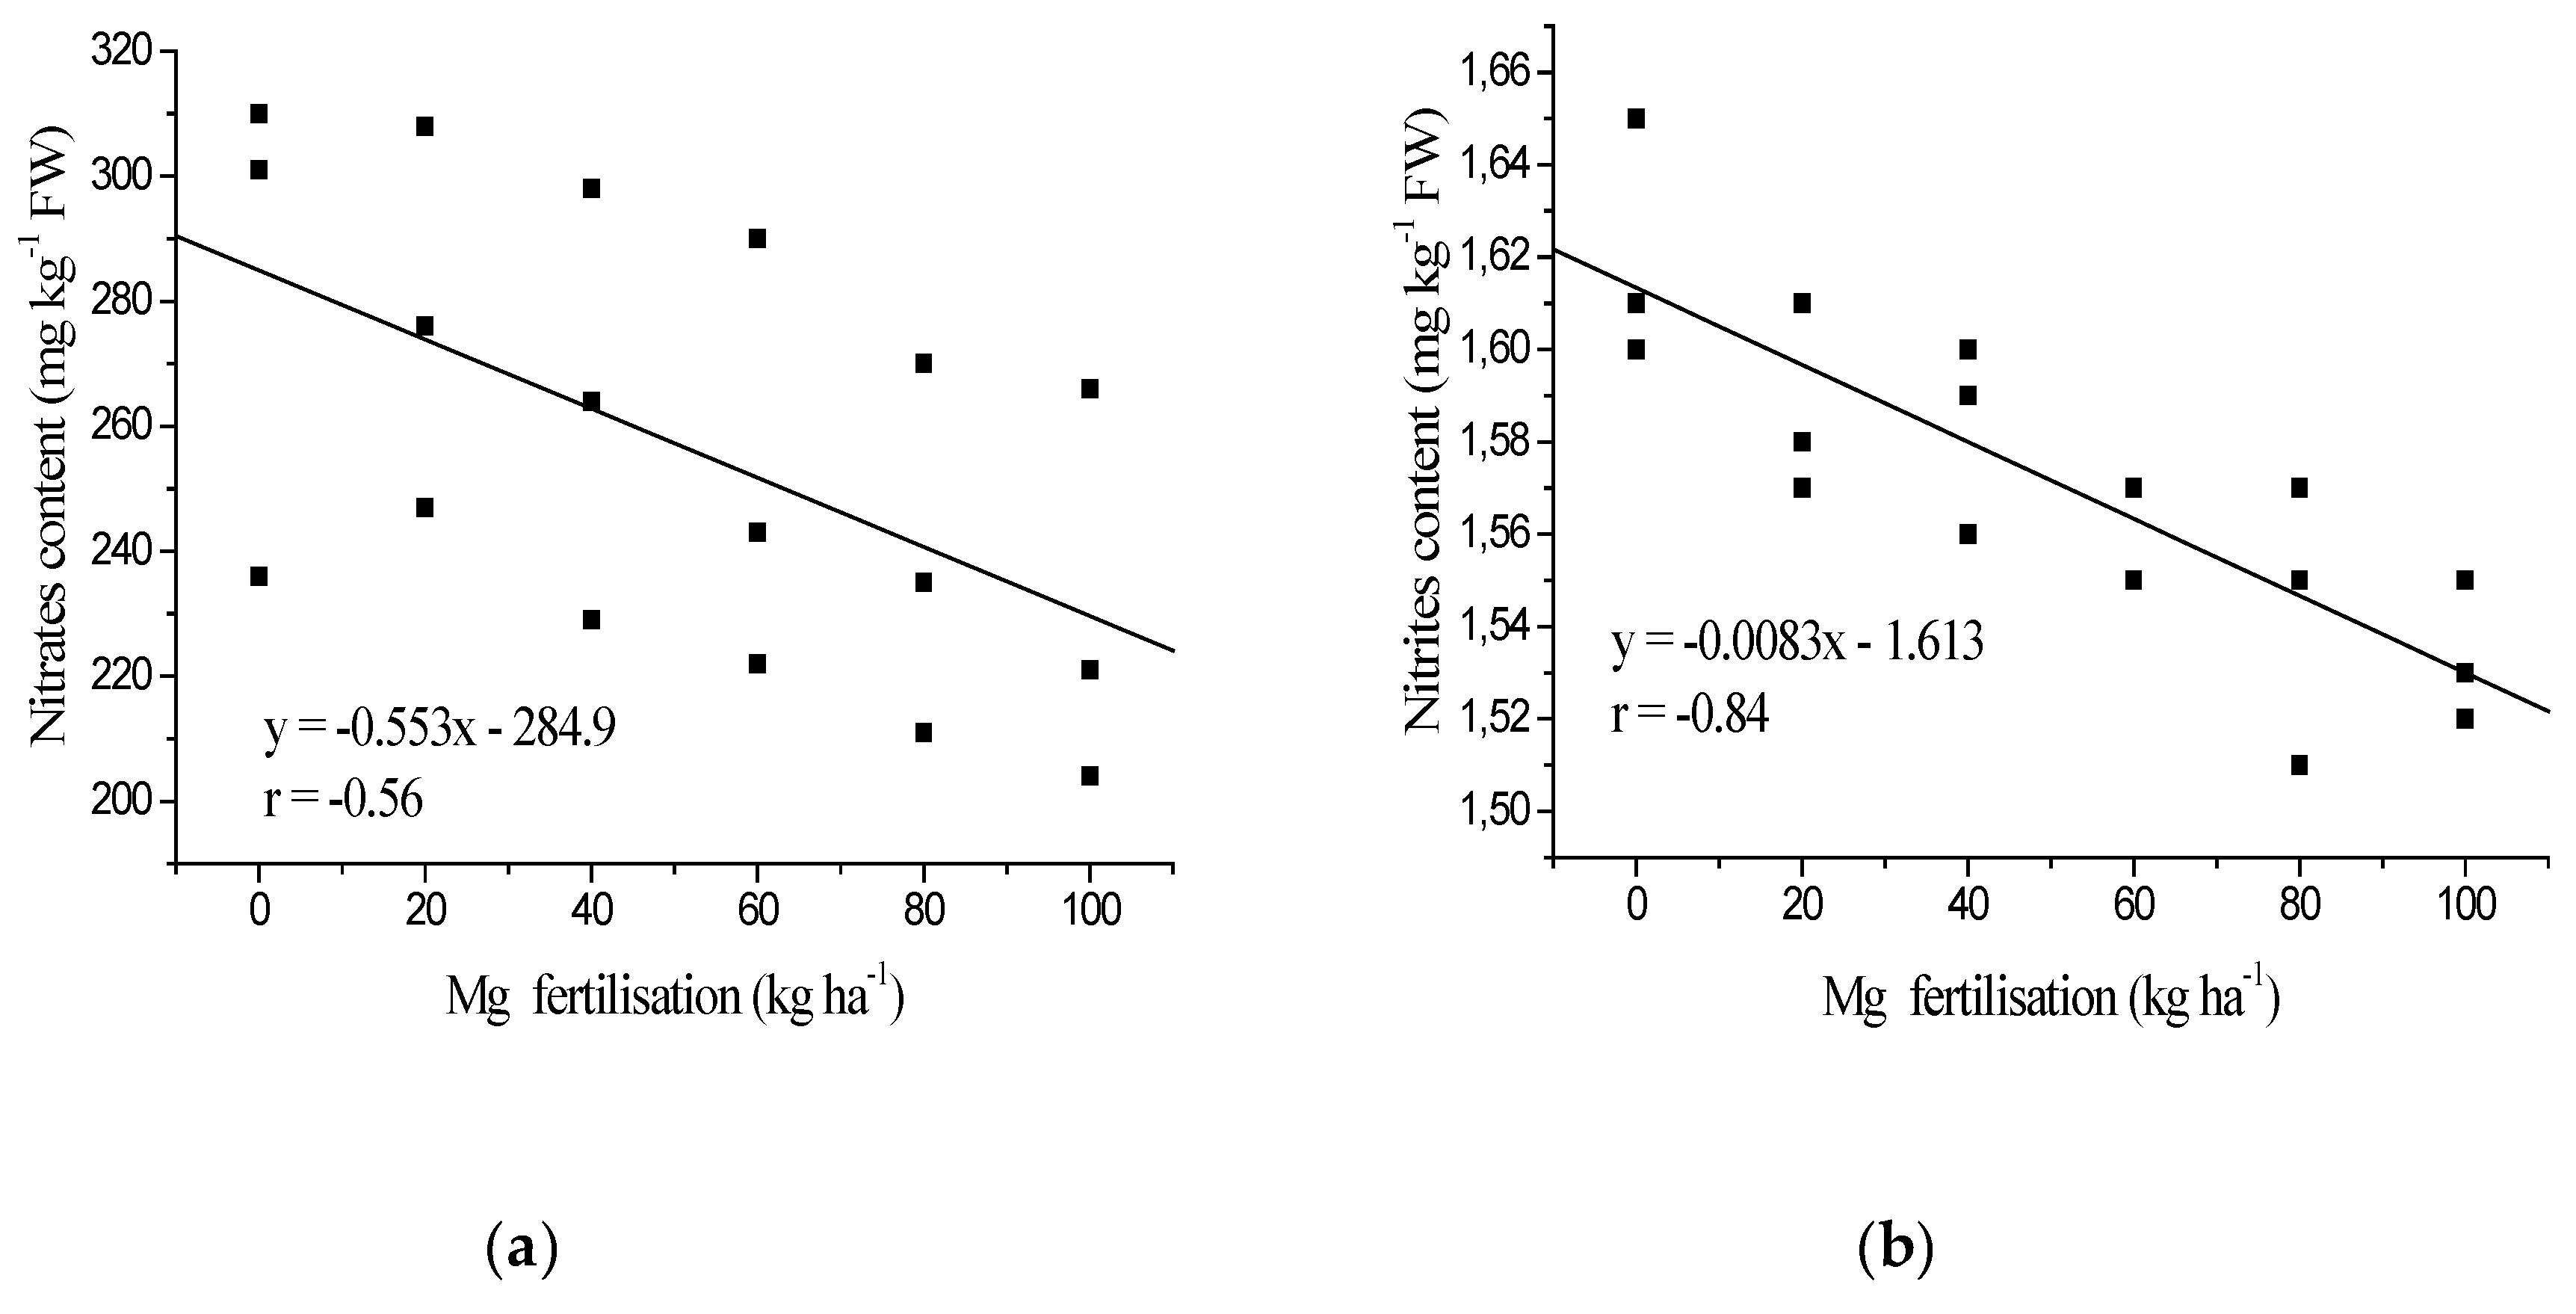
The Mg rates applied in the present research in 20 kg MgO ha−1 increments significantly decreased the accumulation of nitrates. The lowest amount of NO3−1 was in the tubers fertilised with a maximum rate of 100 kg MgO ha−1, which contributed to the significantly negative value of the correlation coefficient between the rate used and the content of nitrates in tubers (r = −0.63) (Figure 3). The results were verified with an analysis of linear regression. The dependences for which the coefficient of determination was higher than 20% are given in Figure 3, Figure 4, Figure 5, Figure 6, Figure 7 and Figure 8. Opposite results were reported by Ciećko et al. [4], applying Mg to the soil and, thus, enhancing the content of NO3−1. The same author recorded a decrease in the content of nitrates in potato tubers by supplying Mg in the form of a foliar application. Nitrogen sprayed over leaves is assimilated by plants 50%–100% more efficiently than nitrogen introduced to soil, and other fertilisers, including magnesium, used in conjunction with nitrogen improve the efficiency of fertilisation treatments. Considering the above aspects, it seems useful to design such a growing technology that would take into account not only yield volumes but also yield quality, including concentrations of particular forms of nitrogen [4,22,26]. This is slightly different from are the results reported by Rogozinska et al. [44], who discovered that, besides nitrogen fertilisation, applications of larger quantities of magnesium also led to lowered total nitrogen contents in potato tubers.
Wadas et al. [43] reported that the HydroComplex was the only one among the four compound fertilisers applied with high amounts of Mg, resulting in a significant increase in the content of nitrates in tubers, on average by 4.0 mg kg−1 FW. Lachman and Hamouz [45] showed that the highest contents of NO3−1 were found on the level 183.4 mg kg−1 FW but the lowest was found 82.4 mg kg−1 FW.
The period of vegetation in 2010 was characterised by a higher air temperature with the period of “drought”, which was stressful to the potato (Figure 2). In 2010, the content of nitrates and nitrites in potato tubers was considerably higher in comparison to other years and amounted on average 356 and 1.63 mg kg−1 FW, respectively. A similar dependence in the content of nitrates and nitrites in potato tubers on the temperature and precipitations along the whole period of vegetation were there obtained in [42,46,47]. However, Zarzecka et al. [48] showed that the highest amount of nitrates in tubers was found in 2004 year, which was the coldest of all the seasons, when precipitation was unevenly distributed and the amount of precipitation presented as 116.6% of the multi-year mean total precipitation. The content of nitrates in “Bila” analysed right after harvest considerably exceeded the maximum acceptable level of 200 mg kg−1 FW (M.H.). Murawa et al. [49] reported on a study performed for two years with potatoes from 20 different sales outlets, where up to 30% of the samples in the first year and 72% samples in the second year and in 18% of all samples [6] exceeded the acceptable norm, respectively. With that in mind, the information reported by Rytel [17] seems essential; the process of peeling and cooking decreased the NO3−1 content by 20%–70%. The present research demonstrated that the period of long-term tuber storage also decreases the content of nitrates in tubers; after three and six months by 13% and 24%, respectively (Figure 5 and Figure 7). However, unfavourable storage conditions (increased temperature and insufficient oxygen access) have been reported to increase the content of NO3−1 in vegetables [4,42,46,50]. In later months of storage, the content of nitrates in tubers continued to rise. This increase was due to relatively large water transpiration from the surfaces of tubers and the enzymatic activity of tubers, which increased at the end of the storage period. Transpiration caused some kind of “concentration” of nitrates (V) in tubers. According to Ciećko et al. [4] and Rogozińska et al. [44], in March (at the termination of storage), it was found out that the lowest quantities of this form of nitrogen appeared in tubers collected from the fertilisation treatments which did not receive foliar nitrogen fertilisation.
Zgórska and Sowa-Niedziałkowska [8] stored 15 cultivars and also recorded a decrease in the content of nitrates by 6.7% after three months, although after eight months, the content increased by 6.1% compared to contents before storage. Ciećko et al. [4] reported on a six-month storage period resulting in a considerable increase in the content of nitrates in tubers. This increase was due to intensive water transpiration from the surfaces of tubers and the enzymatic activity of tubers, which increased at the end of the storage period. It should also be noted that, irrespective of the experimental factors, even short-term storage decreased the daily amounts of nitrates in fresh vegetables [13].
In the present research, the content of nitrites in tubers after harvest ranged from 1.59 to 1.67 mg kg−1 FW, with an average of 1.62 (Table 4). Each of the Mg fertilisation rates applied significantly decreased the content of NO2−1, as did the storage period. The highest losses of nitrites occurred in the initial storage period (after three months). After each of the Mg rates of 20 kg ha−1 were applied, the content of NO3−1 and NO2−1 decreased significantly by 9, 8 and 11, 1 mg kg−1 FW for nitrates and 0, 18 and 0, 17 mg kg−1 FW for nitrites after both three and six months of storage, respectively (Figure 5 and Figure 7). What is noteworthy is the negative correlation between the increasing Mg fertilisation rates and the content of NO3−1 in tubers after harvest (r = −0.63) and after storage, both after three (r = −0.46) and after six (r = −0.56) months (Figure 3, Figure 5 and Figure 7). This is probably due to the fact that Mg supplies significantly increase the content of Mg in tubers [22,43].
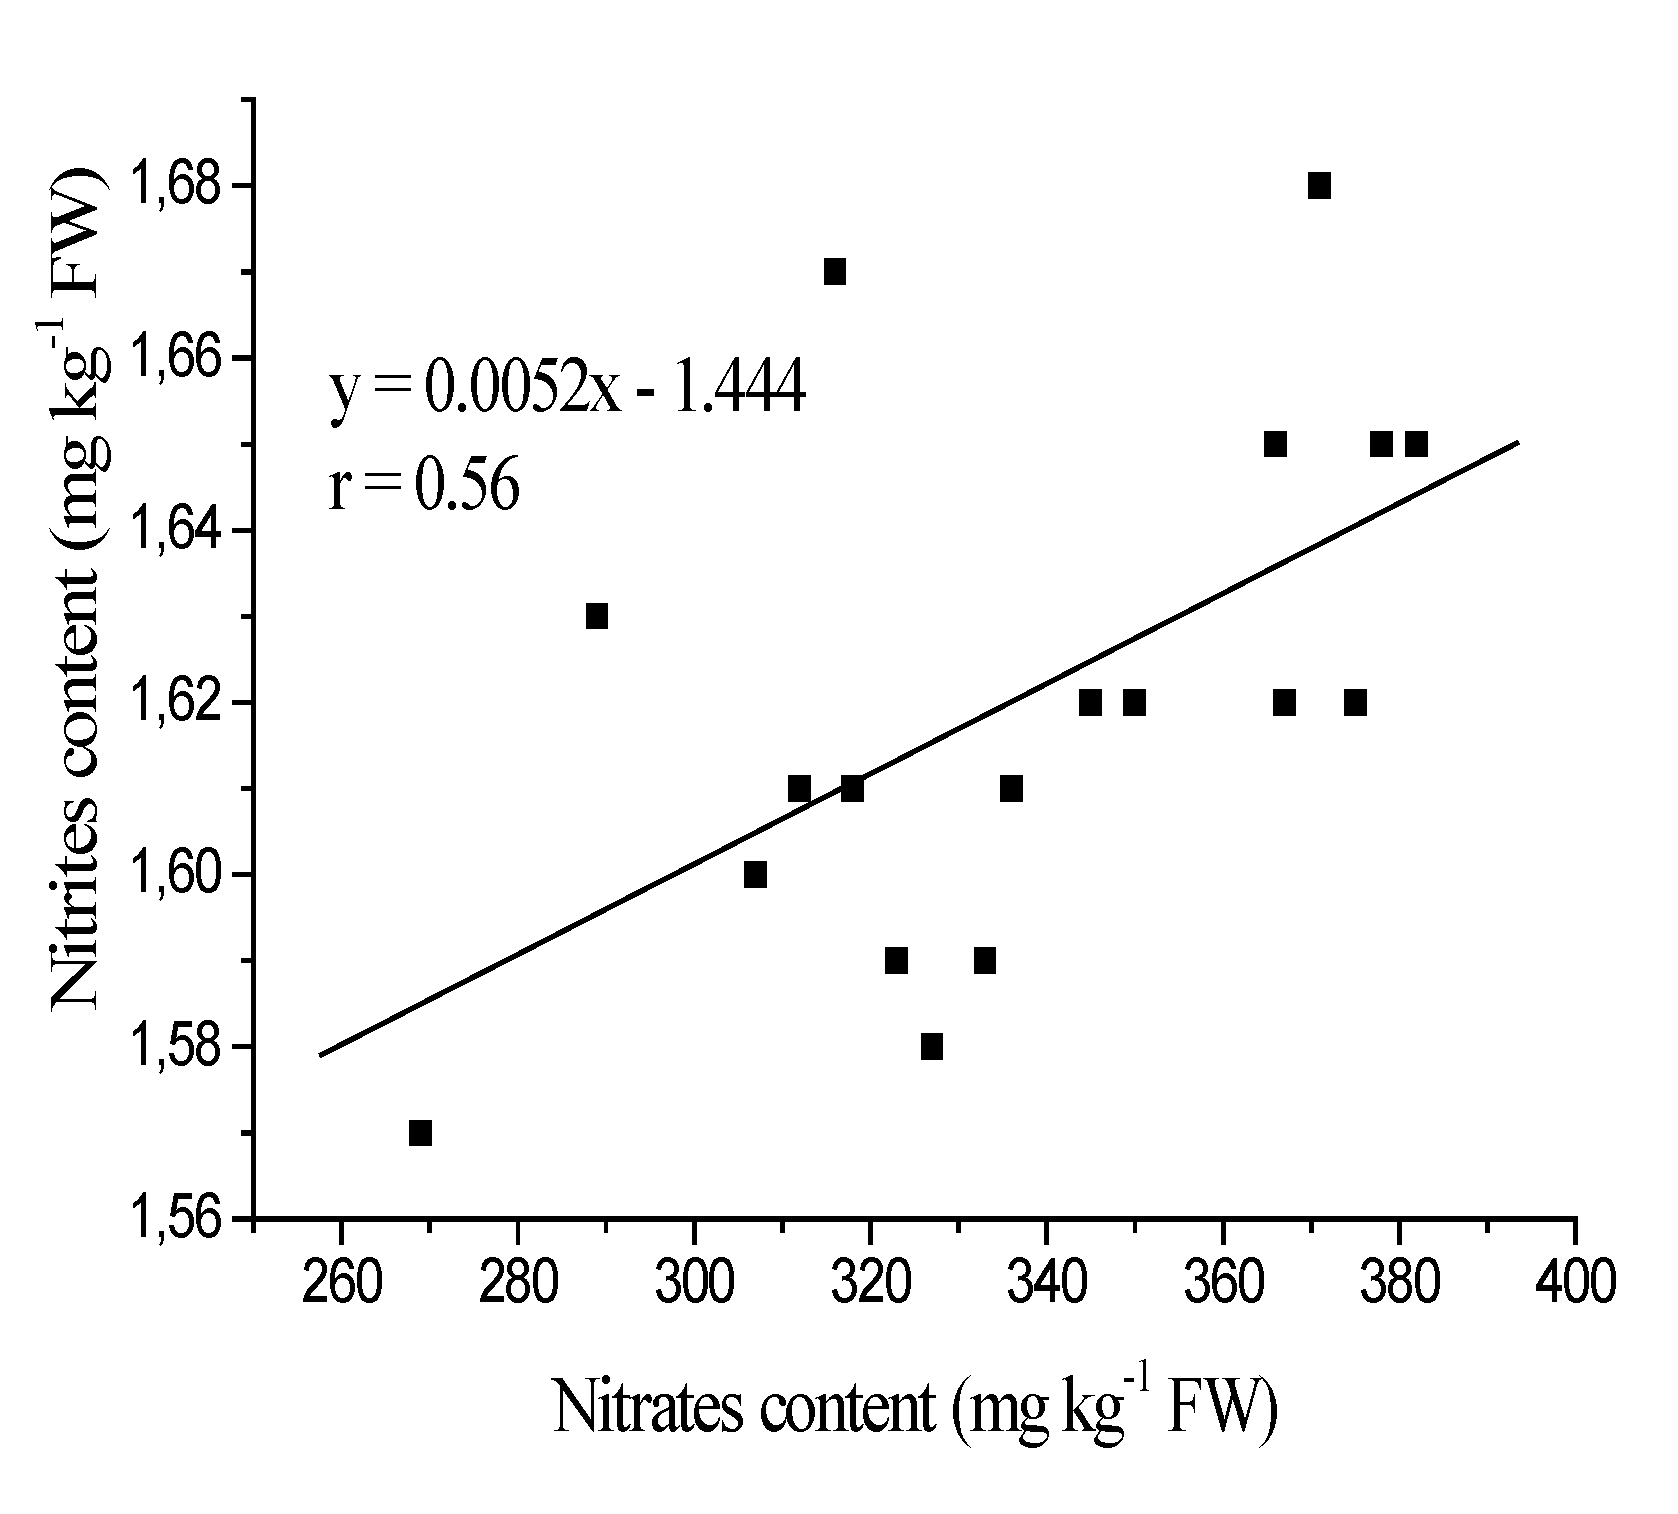
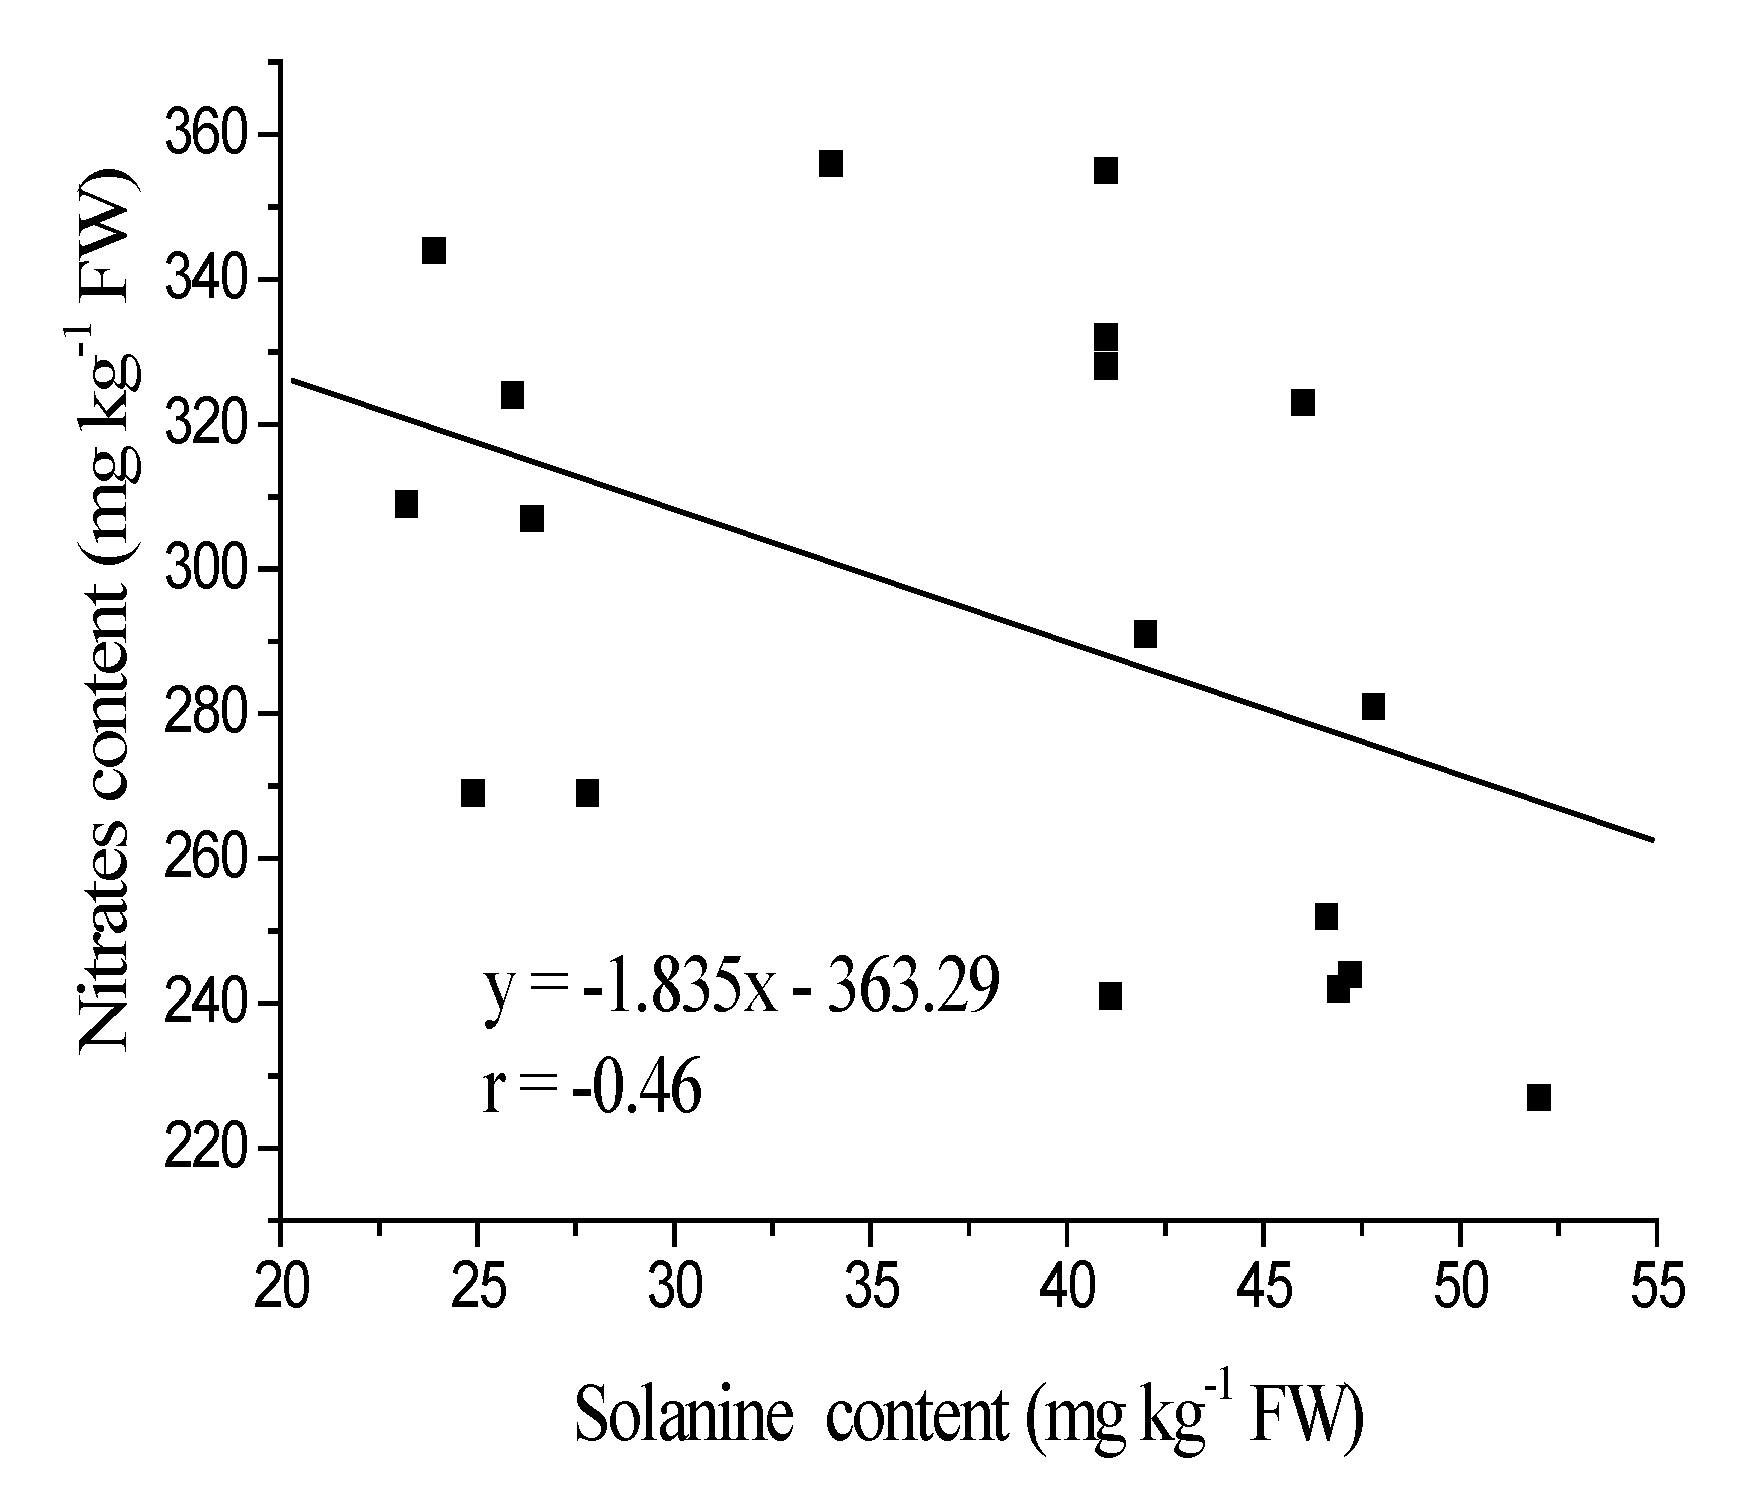
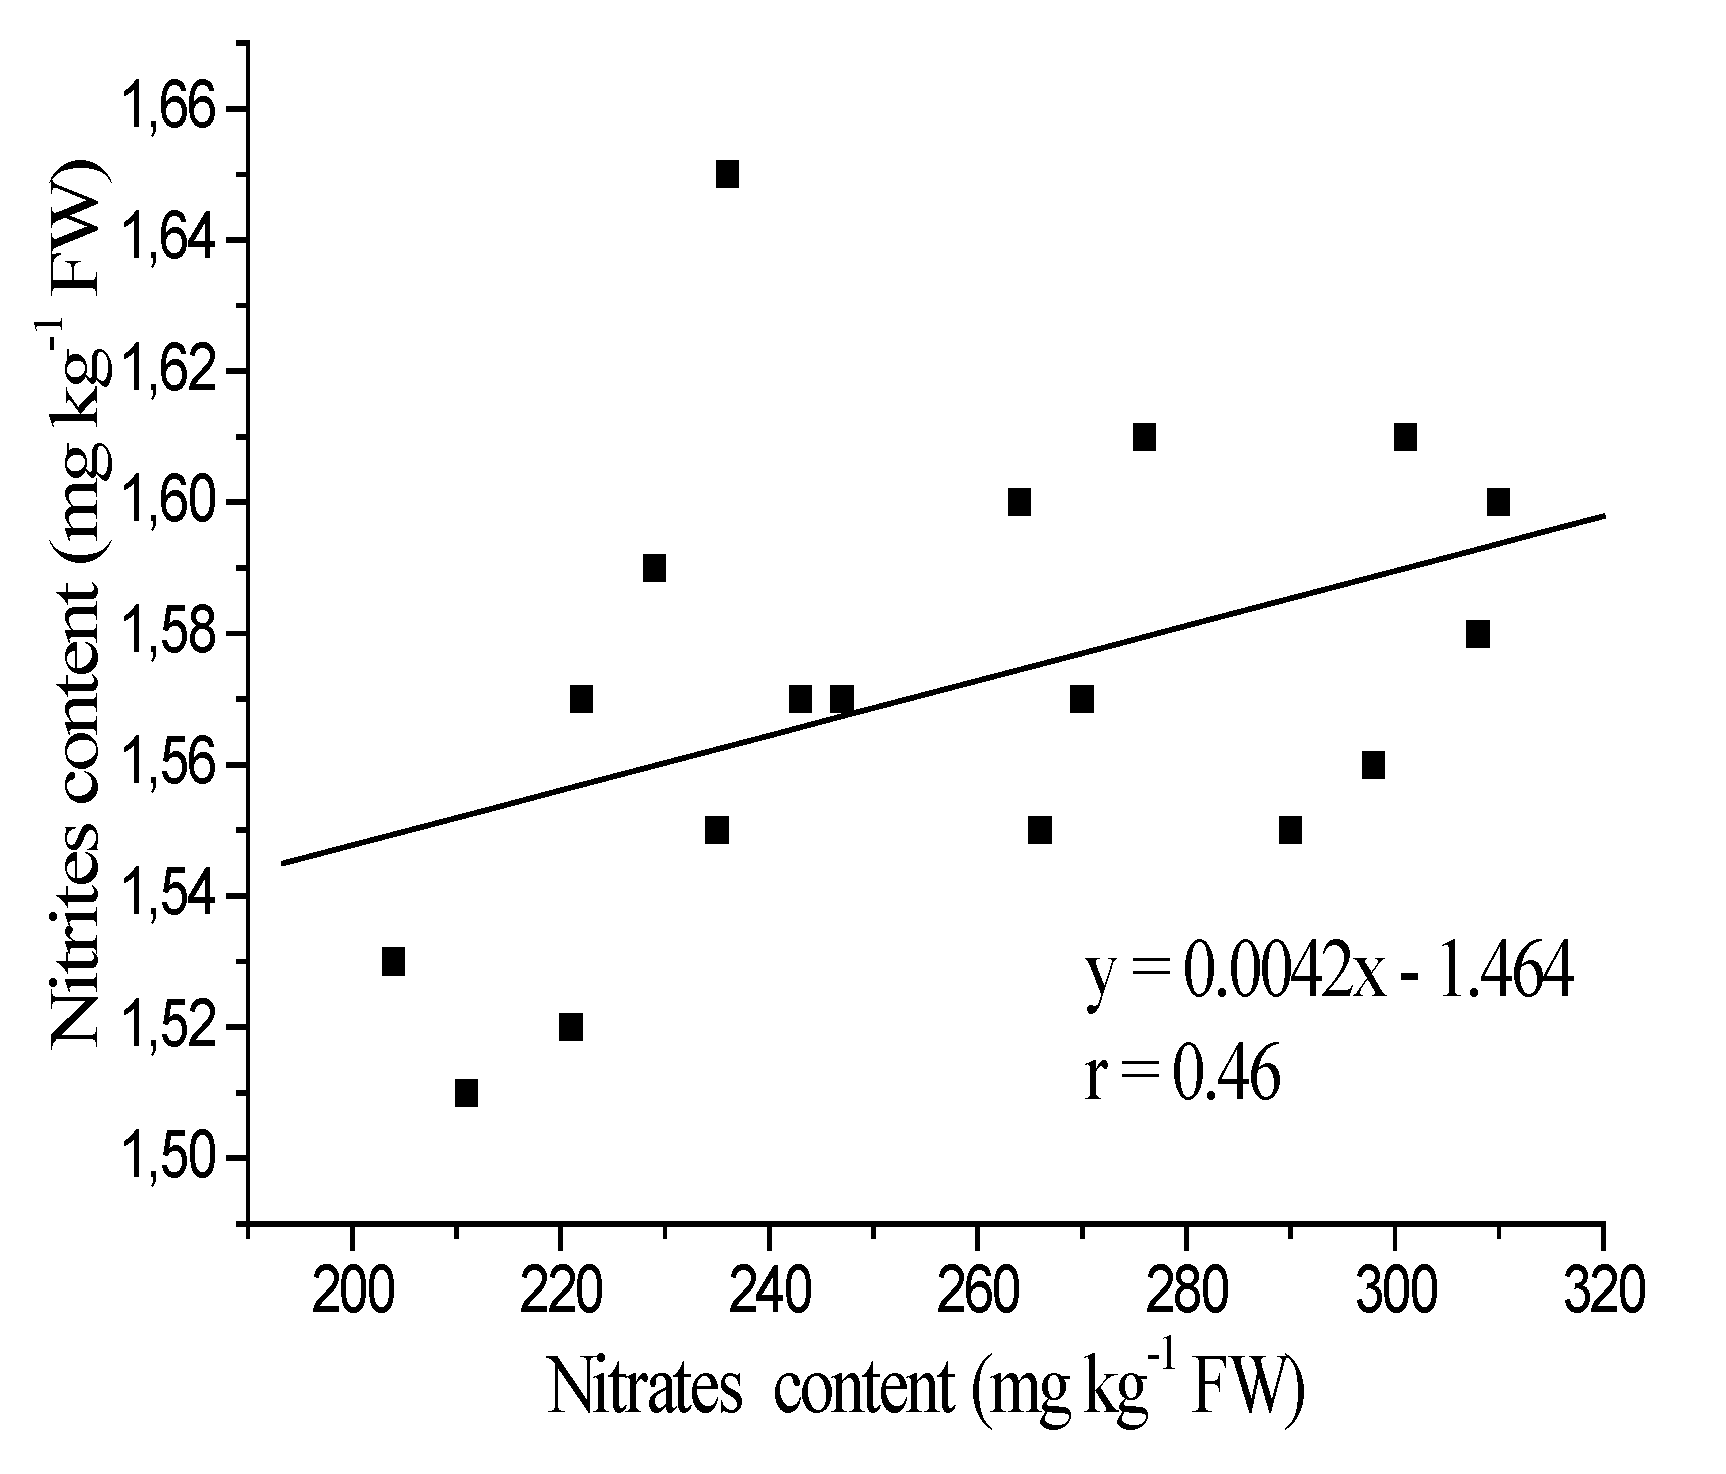
Similar relationships were recorded between NO3−1 and NO2−1, after harvest (r = 0.56), after six months of storage (r = 0.46) and between nitrates and TGA and after three months of storage (r = −0.46) (Figure 4, Figure 6 and Figure 8). In most reported cases, the nitrite contents in vegetables and fruits did not exceed 1 mg kg−1 FW [51], with the exception of potato tubers [47]. In the studies conducted by Murawa et al. [49], investigating 24 potato samples (2003 and 2004) over two years taken from random sales outlets, they reported an average content of nitrites at a level similar to that recorded in the present research, i.e., 1.70 mg kg−1 FW.
However, one should note that, in 2004, the highest content was as much as 2.60 mg kg−1 FW. Nitrite in vegetables is formed as a result of bacterial or enzyme (nitrate reductase) actions. When the fresh vegetables are pureed, the broken vegetable cells will release the enzyme for nitrite formation [52].

3.2. TGA Content

The results of our research since the content of TGA after harvest ranged from 28.9 mg kg−1 to 32.8 mg kg−1 with an average of 30.8 mg kg−1 FW (Table 5). Wroniak [3], Friedman [53] and Zarzyńska [54] reported on table potato cultivars showing, in general, a genetically conditioned low level of glycoalkaloids between 20–100 mg kg−1 FW. Table potato tubers should have a TGA content of less than 50 mg kg−1 FW [1,11,54]. Zgórska and Sowa-Niedziałkowska [8], investigating 15 table potato cultivars, reported a much higher TGA content; it ranged in fresh weight from 21.0 to 81.0 mg kg−1 with an average of 43.0 mg. In the study, a higher TGA content depended on the genetic condition of the potato.
Weather conditions during the study years differentiated the level of glycoalkaloids in potato tubers. The highest content of glycoalkaloids—average of 35.2 mg kg−1 FW—were found in 2010 with the highest average air temperature of 15.2 °C and were higher than in the long-term average of 0.6 °C. This year was characterised by the lowest precipitation −236 mm, lower by 97 mm from the multiannual sum. The stress in potato production alters glycoalkaloid levels [55,56], and the expression of genes associated with glycoalkaloid synthesis are elevated by wounding or light [57]. According to Bejarano et al. [55], a significant increase in TGA concentration was observed under drought stress conditions in most potato varieties (average concentration increases of 47%). These authors [10,57] showed the tuber TGA level is lower but can be increased several-fold by certain stresses and environmental conditions, such as mechanical damage and light exposure, and that not only is the basal TGA level varying between potato cultivars, but also the tendency for increased TGA upon wounding or light exposure. TGA accumulation in potato tubers during wounding and light exposure is associated with a coordinated expression of a small number of key genes in isoprenoid and steroid metabolism and suggests that this expression also underlies cultivar differences in TGA levels.
Our research demonstrated that each dose of 20 kg ha−1 of Mg fertilisation increased the TGA content in tubers after harvest (Table 5). Interestingly, a significant increase in the content of TGA was recorded in the tubers fertilised with the highest dose of Mg (Table 5). An explanation for the TGA increase after Mg supply could be an accelerated intensity of photosynthesis and a subsequent increase in the content of nitrogenous compounds in the tubers [28,29].
The correlation coefficients for the dependencies between the content of nitrites and the Mg rate and its concentrations were as follows: after harvest (r = −0.79), after three (r = −0.89) and after six (r = −0.84) months of storage (Figure 3, Figure 5 and Figure 7). The glycoalkaloids are nitrogen-containing steroidal glycosides, derivatives of aglycone solanidine with major constituents known as α-solanine and α-chaconine [20]. In the present research, an increase in the concentration of sulphate anions in potato tubers supplied with that fertiliser may have contributed to the accumulation of nitrogen compounds in plants. The increase in glycoalkaloid concentration in tubers is due to a stimulation of sugar metabolism and/or an increase in amino acid production. This effect may result from increased chlorophyll synthesis by magnesium biofortification of plants. This theory is supported, as Mg applications increased both the total N and the protein concentration. The TGA decreases considerably once the tubers have been peeled, since the compounds are mostly located in the outer layer, i.e., the skin and flesh right under it (0–3 mm) [3]. According to Zrúst et al. [58], as well as Zarzecka and Gugała [59], peeling decreased the content of glycoalkaloids in tubers: from 52.3% to 55.3% and from 51.5% to 55.1%, respectively, and, according to other authors [59,60], the decrease was up to 95%.
In the present study, the content of TGA increased significantly both after three months (by 22%) and six months (by 38%) of storage (Table 5). Similar results were reported by Zgórska and Sowa-Niedziałkowska [8], although a significant increase was found only after eight months of storage (a 34.9% increase at a storage temperature of +4 °C and 69.8% at +8 °C).
The mean total intake of nitrate per person in Europe ranges between 50 and 140 mg day−1, and in the USA, it is about 40 to 100 mg day−1 [61,62]. During storing, the contents of toxic substances, such as glycoalkaloids, nitrates and nitrites, changes. According to many authors, inadequate storage conditions (e.g., increased temperature and no oxygen access) increase the content of harmful chemicals in vegetables [11,13,16].
Moreover, under certain storage conditions, nitrate can be converted into nitrite in vegetables. Nitrite tends to increase dramatically via the microbiological reduction of nitrate in vegetables, and nitrate content decreases during a period of storage at ambient temperatures [13]. However, physical damage during harvest or transportation, exposure to light and bad storage conditions may cause the concentrations of glycoalkaloids to increase in tubers, and they are considered to be part of the plant’s defence mechanism [63,64].

4. Conclusions

The Mg fertilisation resulted in a decrease in the content of nitrates and nitrites in potato tubers, whereas the content of TGA increased. Tuber storage decreased the contents of NO3−1 and NO2−1 and increased the content of TGA. Each dose of 20 kg ha−1 of Mg fertilisation increased the TGA content but decreased NO2−1 in tubers after harvest. The daily consumption of harmful compounds indicates a good nutritive value of the cultivar, and Mg fertilisation increases that value.

Author Contributions

Conceptualization, J.P., E.W.; Methodology, J.P., E.W.; Formal Analysis, J.P., E.W., W.K., T.K.; Investigation, J.P., E.W., E.P., E.S.-F.; Data Curation, J.P., E.W., W.K., T.K. Writing—Original Draft Preparation, J.P., E.W., E.P., E.S.-F.; Writing—Review & Editing, J.P., E.W.; Visualization, J.P., E.W., W.K., T.K.; Supervision, J.P., E.W.; Project Administration, J.P., E.W.; Funding Acquisition, J.P., E.W. All authors have read and agreed to the published version of the manuscript.

Funding

This research received no external funding.

Acknowledgments

The authors wish to thank the mediums and sitters who volunteered their time for this study. Publication was carried out with the use of instruments bought in the framework of the programme “Development of Stage 2 of Regional Centre for Innovativeness” of the European Fund for Regional Development in the framework of the Regional Operation Programme of Kuyavian-Pomeranian for 2007–2013, Bydgoszcz, Poland.

Conflicts of Interest

The authors declare no conflicts of interest.

References

  1. Leszczyński, W. The quality of table potato. Żywność Suppl. 2000, 4, 5–27. (In Polish) [Google Scholar]
  2. Hamouz, K.; Lachman, J.; Dvorak, P.; Pivec, V. The effect of ecological growing on the potatoes yield and quality. Plant Soil Environ. 2005, 51, 397–402. [Google Scholar] [CrossRef] [Green Version]
  3. Wroniak, J. Nutrition qualities of edible potato. Ziemn. Pol. 2006, 6, 17–20. (In Polish) [Google Scholar]
  4. Ciećko, Z.; Żołnowski, A.; Mierzejewska, A. Effect of foliar nitrogen and magnesium fertilization on the total, protein nitrogen and nitrates(V) content in potato tubers. Ecol. Chem. Eng. 2010, 17, 593–600. [Google Scholar]
  5. Santamaria, P. Nitrate in vegetables: Toxicity, content, intake and EC regulation. J. Sci. Food Agric. 2006, 86, 10–17. [Google Scholar] [CrossRef]
  6. Hmelak, G.A.; Urih, G.; Langerholc, T.; Kristil, J. Nitrate content in potatoes cultivated in contaminated groundwater areas. J. Food Res. 2014, 3, 18–27. [Google Scholar] [CrossRef] [Green Version]
  7. Bottex, B.; Lou, J.; Dorne, C.M.; Carlander, D.; Bedford, D.; Przyrembel, H.; Heppner, C.; Kleiner, J.; Cockburn, A. Risk—Benefit health assessment of food—Food fortification and nitrate in vegetables. Trends Food Sci. Tech. 2008, 19, 109–115. [Google Scholar] [CrossRef]
  8. Zgórska, K.; Sowa-Niedziałkowska, G. Effect of the thermal and cultivar—Specific factors on qualitative changes in potato tubers during their long-term storage. Pam. Puł. 2005, 139, 327–336. [Google Scholar]
  9. Haddadin, M.S.Y.; Humeid, M.A.; Quaroot, F.A.; Robinson, R.K. Effect of exposure to light on the solanine content of two varieties of potato (Solanum tuberosum) popular in Jordan. Food Chem. 2001, 73, 205–208. [Google Scholar] [CrossRef]
  10. Machado, R.M.D.; Toledo, M.C.F.; Garcia, L.C. Effect of light and temperature on the formation of glycoalkaloids in potato tubers. Food Control 2007, 18, 503–508. [Google Scholar] [CrossRef]
  11. Şengül, M.; Keleş, F.; Keleş, M.S. The effect of storage conditions (temperature, light, time) and variety on the glycoalkaloid content of potato tubers and sprouts. Food Control 2004, 15, 281–286. [Google Scholar] [CrossRef]
  12. Tajner-Czopek, A.; Jarych-Szyszka, M.; Lisińska, G. Changes in glycoalkaloids content of potatoes destined for consumption. Food Chem. 2008, 106, 706–711. [Google Scholar] [CrossRef]
  13. Chung, J.C.; Chou, S.S.; Hwang, D.F. Changes in nitrate and nitrite content of four vegetables during storage at refrigerated and ambient temperatures. Food Addit. Contam. 2004, 21, 317–322. [Google Scholar] [CrossRef] [PubMed]
  14. Rezaee, M.; Almasi, M.; Majdabadi, F.A.; Minaei, S.; Khodadadi, M. Potato sprout inhibition and tuber quality after post-harvest treatment with gamma irradiation on different dates. J. Agric. Sci. Tech. 2011, 13, 829–842. Available online: http://journals.modares.ac.ir/article-23-2714-en.html (accessed on 24 February 2020).
  15. Ginzberg, I.; Tokuhisa, J.G.; Veilleux, R.E. Potato steroidal glycoalkaloids: Biosynthesis and genetic manipulation. Potato Res. 2009, 52, 1–15. [Google Scholar] [CrossRef]
  16. Haase, N.U. Glycoalkaloid concentration in potato tubers related to storage and consumer offer. Potato Res. 2010, 53, 297–307. [Google Scholar] [CrossRef]
  17. Rytel, E. Changes in the levels of glycoalkaloids and nitrates after the dehydration of cooked potatoes. Am. J. Potato Res. 2012, 89, 501–507. [Google Scholar] [CrossRef] [Green Version]
  18. Lachman, J.; Hamouz, K.; Orsak, M.; Pivec, V. Potato glycoalkaloids and their significance in plant protection and human nutrition—Review. Rostl. Vyroba UZPI 2001, 47, 181–191. [Google Scholar]
  19. Smith, D.B.; Roddick, J.G.; Jones, J.L. Synergism between the potato alkaloids α-chaconine and α-solanine in inhibition of snail feeding. Phytochemistry 2001, 57, 229–234. [Google Scholar] [CrossRef]
  20. Friedman, M.; McDonald, G.M. Potato glycoalkaloids: Chemistry, analysis, safety and plant physiology. Crit. Rev. Plant Sci. 1997, 16, 55–132. [Google Scholar] [CrossRef]
  21. Muthumani, P.; Meera, R.; Sweetlin, D.P. Phyto Chemical Investigation and Determination of Crude Alkaloidal Content (Solasodine) in Solanum Leave Dunal (Dry and Fresh Berries). Int. J. Pharm. Biol. Arch. 2010, 1, 350–354. [Google Scholar]
  22. Gerendás, J.; Führs, H. The significance of magnesium for crop quality. Plant Soil. 2013, 368, 101–128. [Google Scholar] [CrossRef] [Green Version]
  23. Pasternak, K.; Kocot, J.; Horecka, A. Biochemistry of magnesium. J. Elem. 2010, 15, 601–616. [Google Scholar] [CrossRef]
  24. Pobereżny, J.; Wszelaczyńska, E. Effect of bioelements (N, K, Mg) and long-term storage of potato tubers on quantitative and qualitative losses Part II. Content of dry matter and starch. J. Elem. 2011, 16, 237–246. [Google Scholar] [CrossRef]
  25. Cakmak, I.; Yazici, A.M. Magnesium: A forgotten element in crop production. Better Crops 2010, 94, 23–25. [Google Scholar]
  26. Pawelzik, E.; Möller, K. Sustainable potato production worldwide: The challenge to assess conventional and organic production systems. Potato Res. 2014, 57, 273–290. [Google Scholar] [CrossRef]
  27. Senbayram, M.; Gransee, A.; Wahle, V.; Thiel, H. Role of magnesium fertilisers in agriculture: Plant–soil continuum. Crop Pasture Sci. 2015, 66, 1219–1229. [Google Scholar] [CrossRef]
  28. Cakmak, I.; Kirkby, E. Role of magnesium in carbon partitioning and alleviating photo-oxidative damage. Physiol. Plant. 2008, 133, 692–704. [Google Scholar] [CrossRef]
  29. Shaul, O. Magnesium transport and function in plants: The tip of the iceberg. Biometals 2002, 15, 309–323. [Google Scholar] [CrossRef]
  30. IUSS Working Group WRB. World Reference Base for Soil Resources 2006, First Update 2007; World Soil Resources Reports No. 103; FAO: Rome, Italy, 2007; p. 116. [Google Scholar]
  31. Gregorczyk, A.; Wróbel, J.; Mikiciuk, M. The modification of Walter and Lieth climatic diagrams. Zesz. Nauk. AR Szczec. 2005, 1, 33–40. (In Polish) [Google Scholar]
  32. Baker, W.H.; Thompson, T.L. Determination of nitrate nitrogen in plant samples by selective ion electrode. Plant Anal. Ref. Proc. S. US 1992, 368, 13–16. [Google Scholar]
  33. Bergers, W.W.A. A rapid quantitative assay for solanidine glycoalkaloids in potatoes and industrial potato protein. Potato Res. 1980, 23, 105–110. [Google Scholar] [CrossRef]
  34. Walker, T.; Thiele, G.; Suarez, V.; Crissman, C. Hindsight and Foresight about Potato Production and Consumption; Social Sciences Working Paper No. 2011–5; International Potato Center (CIP): Lima, Peru, 2011. [Google Scholar]
  35. Szulc, W.; Rutkowska, B. Diagnostics of boron deficiency for plants in reference to boron concentration in the soil solution. Plant Soil Environ. 2013, 59, 372–377. [Google Scholar] [CrossRef] [Green Version]
  36. GUS 2019. Statistical Yearbook of Agriculture 2018; GUS: Warsaw, Poland, 2018; p. 149. ISSN 2080-8798. (Publication available on website: stat.gov.pl). [Google Scholar]
  37. Kołodziejczyk, M. Influence of rainfall and thermal conditions on the yielding of medium late and late cultivars of edible potato. Ann. Univ. Mariae Curie Skłodowska Sect. E Agric. 2013, 68, 1–10. (In Polish) [Google Scholar]
  38. Camargo, D.C.; Montoya, F.; Córcoles, J.I.; Ortega, J.F. Modeling the impacts of irrigation treatments on potato growth and development. Agric. Water Manag. 2015, 150, 119–128. [Google Scholar] [CrossRef]
  39. Orlovius, K.; McHoul, J. Effect of two magnesium fertilizers on leaf magnesium concentration, yield, and quality of potato and sugar beet. J. Plant Nutr. 2015, 38, 2044–2054. [Google Scholar] [CrossRef]
  40. Zengin, M.; Gökmen, F.; Gezgin, S.; Cakmak, I. Effects of different fertilizers with potassium and magnesium on the yield and quality of potato. Asian J. Chem. 2008, 20, 663–676. [Google Scholar]
  41. Allison, M.F.; Fowler, J.H.; Allen, E.J. Factors affecting the magnesium nutrition of potatoes (Solanum tuberosum). J. Agric. Sci. 2001, 137, 397–409. [Google Scholar] [CrossRef]
  42. Ierna, A. Influence of harvest date on nitrate contents of three potato varieties for off-season production. J. Food Compos. Anal. 2009, 22, 551–555. [Google Scholar] [CrossRef]
  43. Wadas, W.; Łęczycka, T.; Borsiak-Marciniak, I. Effect of fertilization with multinutrient complex fertilizers on tuber quality of very early potato cultivars. Acta Sci. Pol. Hortorum Cultus 2012, 11, 27–41. [Google Scholar]
  44. Rogozińska, I.; Pawelzik, E.; Poberezny, J.; Delgado, E. The effect of different factors on the content of nitrate in some potato varieties. Potato Res. 2005, 48, 167–180. [Google Scholar] [CrossRef]
  45. Lachman, J.; Hamouz, K. The effect of selected factors on the content of protein and nitrates in potato tubers. Plant Soil Environ. 2005, 51, 431–438. [Google Scholar] [CrossRef]
  46. Amr, A.; Hadidi, N. Effect of cultivar and harvest date on nitrate and nitrite content of selected vegetables grown under open field and greenhouse conditions in Jordan. J. Food Compos. Anal. 2001, 14, 59–67. [Google Scholar] [CrossRef]
  47. Sušin, J.; Kmeckl, V.; Gregorčič, A. A survey of nitrate and nitrite content of fruit and vegetables grown in Slovenia during 1996–2002. Food Addit. Contam. 2006, 23, 385–390. [Google Scholar] [CrossRef] [PubMed]
  48. Zarzecka, K.; Gugała, M.; Mystkowska, I. Herbicide Residues and Nitrate Concentration in Tubers of Table Potatoes. J. Toxicol. Environ. Health Part A 2010, 73, 1244–1249. [Google Scholar] [CrossRef] [PubMed]
  49. Murawa, D.; Banaszkiewicz, T.; Majewska, E.; Błaszczuk, B.; Wiśniewska, J. Nitrate and nitrite content in selected vegetables and potatoes commercially available in Olsztyn. Bromatol. Chem. Toksykol. 2008, 41, 67. [Google Scholar]
  50. Tamme, T.; Reinik, M.; Roasto, M.; Juhkam, K.; Tenno, T.; Kiis, A. Nitrates and nitrites in vegetables and vegetable-based products and their intakes by the Estonian population. Food Addit. Contam. 2006, 23, 355–361. [Google Scholar] [CrossRef]
  51. Walters, C.L. Nitrate and nitrate in foods. In Series in Food Science, Technology and Nutrition, 2nd ed.; Hill, M., Ed.; Woodhead Publishing: Cambridge, UK, 1996; pp. 93–112. [Google Scholar] [CrossRef]
  52. Hord, N.G.; Tang, Y.; Bryan, N.S. Food sources of nitrates and nitrites: The physiological context for potential health benefits. Am. J. Clin. Nutr. 2009, 90, 1–10. [Google Scholar] [CrossRef]
  53. Friedman, M. Potato glycoalkaloids and metabolites: Roles in the plant and in the diet. J. Agric. Food Chem. 2006, 54, 8655–8681. [Google Scholar] [CrossRef]
  54. Zarzyńska, K. Chemical composition of potato tubers in relation to crop production system and environmental conditions. J. Agric. Sci. Technol. B 2013, 3, 689–695. [Google Scholar]
  55. Bejarano, L.; Mignolet, E.; Devaux, A.; Espinola, N.; Carrasco, E.; Larondelle, Y. Glycoalkaloids in potato tubers: The effect of variety and drought stress on the α-solanine and α-chaconine contents of potatoes. J. Sci. Food Agric. 2000, 80, 2096–2100. [Google Scholar] [CrossRef]
  56. Mystkowska, I. Reduction of glycoalkaloids in potato under the influence of biostimulators. Appl. Ecol. Environ. Res. 2019, 17, 3567–3574. [Google Scholar] [CrossRef]
  57. Nahar, N.; Westerberg, E.; Arif, U.; Huchelmann, A.; Olarte Guasca, A.; Beste, L.; Dalman, K.; Dutta, P.C.; Jonsson, L.; Sitbon, F. Transcript profiling of two potato cultivars during glycoalkaloid-inducing treatments shows differential expression of genes in sterol and glycoalkaloid metabolism. Sci. Rep. 2017, 7, 43268. [Google Scholar] [CrossRef] [PubMed]
  58. Zrúst, J.; Haráćková, V.; Přichystalová, V.; Rejlková, M. Content of alpha-chaconine and alpha-solanine in groups of potato varieties listed in the National Book of Varieties of the Czech Republic. Rostl. Vyroba UZPI 2000, 46, 481–486. [Google Scholar]
  59. Zarzecka, K.; Gugała, M. Changes in the content of glycoalkaloids in potato tubers according to soil tillage and weed control methods. Plant Soil Environ. 2007, 53, 247–251. [Google Scholar] [CrossRef] [Green Version]
  60. Ostry, V.; Ruprich, J.; Skarkova, J. Glycoalkaloids in potato tubers: The effect of peeling and cooking in salted water. Acta Aliment. 2010, 39, 130–135. [Google Scholar] [CrossRef]
  61. Mensinga, T.T.G.; Speijers, J.A.; Meulenbelt, J. Health implications of exposure to environmental nitrogenous compounds. Toxicol. Rev. 2003, 22, 41–51. [Google Scholar] [CrossRef]
  62. Ysart, G.; Miller, P.; Barrett, G.; Farrington, D.; Lawrance, P.; Harrison, N. Dietary exposures to nitrate in UK. Food Addit. Contam. 1999, 16, 521–532. [Google Scholar] [CrossRef]
  63. Edwards, E.J.; Cobb, A.H. Effect of Temperature on Glycoalkaloid and Chlorophyll Accumulation in Potatoes (Solanum tuberosum L. Cv. King Edward) Stored at Low Photon Flux Density, Including Preliminary Modeling Using an Artificial Neural Network. J. Agric. Food Chem. 1997, 45, 1032–1038. [Google Scholar] [CrossRef]
  64. Väänänen, T. Glycoalkaloid Content and Starch Structure in Solanum Species and Interspecific Somatic Potato Hybrids. Ph.D. Thesis, University of Helsinki, Helsinki, Finland, 2007. [Google Scholar]
Figure 1. Weather conditions during vegetation seasons, 2009–2011, (a) average air temperature in months, (b) total rainfall in months.
Agronomy 10 00339 g001aAgronomy 10 00339 g001b
Figure 2. Meteorological conditions in 2009–2011, according to Gregorczyk et al. [31].
Agronomy 10 00339 g002
Figure 3. The significant relationship between the dose of magnesium fertilisation and NO3−1 (a) and NO2−1 (b) contents in the potato tubers after harvest. R: p ≤ 0.05.
Agronomy 10 00339 g003
Figure 4. The significant relationship between nitrates and nitrites content in the potato tubers after harvest. R: p ≤ 0.05.
Agronomy 10 00339 g004
Figure 5. The significant relationship between the dose of magnesium fertilisation and NO3−1 (a) and NO2−1 (b) contents in the potato tubers after 3 months of storage. R: p ≤ 0.05.
Agronomy 10 00339 g005
Figure 6. The significant relationship between the total glycoalkaloid (TGA) content and nitrates contents in the potato tubers after 3 months of storage. R: p ≤ 0.05.
Agronomy 10 00339 g006
Figure 7. The significant relationship between the dose of magnesium fertilisation and NO3−1 (a), NO2−1 (b) contents in the potato tubers after 6 months of storage. R—p ≤ 0.05.
Agronomy 10 00339 g007
Figure 8. The significant relationship between nitrates content and nitrites contents in the potato tubers after 6 months of storage. R: p ≤ 0.05.
Agronomy 10 00339 g008
Table 1. Solanum glycoalkaloids.
Total glycoalkaloids (TGA) *
α-Solanine
β-Solanine
γ-Solanine
α-Chaconine
β-Chaconine
γ-Chaconine
Leptine
Solacauline
Tetroside from S. acaulia
Demissine
Solasonine
Solamargine
Solasodamine
Tomatine
Trioside from S. polyadenium
α, β and γ-Soladulcine
* [15,21].
Table 2. The total yield of potato tubers (t ha−1 FW) depending on Mg fertilisation.
Fertilisation Dose MgO (kg ha−1)200920102011Mean
032.0531.4535.9133.14 ± 2.94 *
2032.2833.0338.0834.46 ± 3.03
4034.3033.5938.9135.60 ± 3.46
6035.0633.9339.5936.19 ± 3.82
8035.7935.1540.6937.21 ± 3.78
10036.7536.2041.4538.14 ± 3.64
mean34.3733.8939.1135.79 ± 4.07
LSD0.05Rates MgO—3.34
* Mean ± standard deviation and LSD—least significant difference.
Table 3. The nitrate contents in potato tubers (mg kg−1 FW) depending on Mg fertilization and date of study.
Fertilisation Dose MgO (kg ha−1)
(B)
Date Determination (A)Mean **
After Harvest
(Control)
After Storage
Three MonthsSix Months
200920102011Mean200920102011Mean200920102011Mean
0371382316356 ± 35.4 *309356241302 ± 57.8301310236282 ± 40.4314 ± 51.6
20375378336363 ± 23.4344355281327 ± 39.9276308247277 ± 30.5322 ± 46.5
40350366312343 ± 27.7324328242298 ± 48.5264298229264 ± 34.5301 ± 47.5
60345367307340 ± 30.4307332252297 ± 40.9243290222252 ± 34.8296 ± 49.0
80333327289316 ± 23.9269323244279 ± 40.4235270211239 ± 29.7278 ± 43.6
100323318269303 ± 29.8269291227262 ± 32.5221266204230 ± 32.0265 ± 41.8
mean350356305337 ± 28.0304331248294 ± 42.3257290225257 ± 32.8296 ± 45.8
LSD0.05 NO3−1: A—27.9; B—31.1; A × B—n.s.
* Mean ± standard deviation, LSD: least significant difference and n.s.—no significant differences. ** Mean for all dates.
Table 4. The nitrite contents in potato tubers (mg kg−1 FM0 depending on the Mg fertilisation and date of study.
Fertilization Dose MgO (kg ha−1) (B)Date Determination (A)Mean **
After Harvest (Control)After Storage
Three MonthsSix Months
200920102011Mean200920102011Mean200920102011Mean
01.681.651.671.67 ± 0.02 *1.611.651.621.63 ± 0.021.611.601.651.62 ± 0.031.64 ± 0.03
201.621.651.611.63 ± 0.021.601.621.611.61 ± 0.011.611.581.571.59 ± 0.021.61 ± 0.02
401.621.651.611.63 ± 0.021.581.591.561.58 ± 0.021.601.561.591.58 ± 0.021.60 ± 0.03
601.621.621.601.61 ± 0.011.561.551.601.57 ± 0.031.571.551.571.56 ± 0.011.58 ± 0.03
801.591.581.631.60 ± 0.031.551.561.541.55 ± 0.011.551.571.511.54 ± 0.031.56 ± 0.03
1001.591.611.571.59 ± 0.021.521.541.561.54 ± 0.021.521.551.531.53 ± 0.021.55 ± 0.03
mean1.621.631.621.62 ± 0.011.571.591.581.58 ± 0.011.581.571.571.57 ± 0.041.59 ± 0.02
LSD0.05 NO3−1: A—0.021; B—0.030; A × B—n.s.
* Mean ± standard deviation, LSD—least significant difference and n.s.—no significant differences. ** Mean for all dates.
Table 5. The TGA content in potato tubers (mg kg−1 FW) depending on Mg fertilization and date of study.
Fertilization Dose MgO (kg ha−1)
(B)
Date Determination (A)Mean **
After Harvest (Control)After Storage
Three MonthsSix Months
200920102011Mean200920102011Mean200920102011Mean
025.033.028.828.9 ± 4.0 *23.241.134.032.8 ± 9.034.541.144.039.9 ± 4.933.9 ± 7.3
2025.837.029.330.7 ± 5.723.947.841.037.6 ± 12.339.441.943.041.4 ± 1.836.6 ± 8.3
4026.236.028.030.1 ± 5.225.946.941.037.9 ± 10.835.246.645.042.2 ± 6.236.8 ± 8.6
6027.234.033.531.6 ± 3.826.446.641.038.0 ± 10.433.748.549.043.7 ± 8.737.8 ± 8.8
8029.235.027.930.7 ± 3.824.947.246.039.4 ± 12.535.350.045.043.4 ± 7.537.8 ± 9.4
10030.636.031.932.8 ± 2.827.852.042.040.6 ± 12.235.851.546.044.4 ± 8.039.3 ± 9.0
mean27.335.229.930.8 ± 4.025.446.940.837.7 ± 11.135.746.645.342.5 ± 6.037.0 ± 8.4
LSD0.05 NO3−1: A—27.9; B—31.1; A × B—n.s.
* Mean ± standard deviation, LSD—least significant difference and n.s.—no significant differences. ** Mean for all dates.