Organic Vegetable Cultivation Reduces Resource and Environmental Costs While Increasing Farmers’ Income in the North China Plain


Abstract
:1. Introduction
2. Materials and Methods
2.1. System Description
2.1.1. Study Area and Experimental Design
2.1.2. Sampling and Laboratory Analysis
2.2. Economic Analysis (ECA)
2.3. Emergy Analysis (EMA)
2.4. Lifecycle Assessment (LCA)
3. Results
3.1. Economic Performance
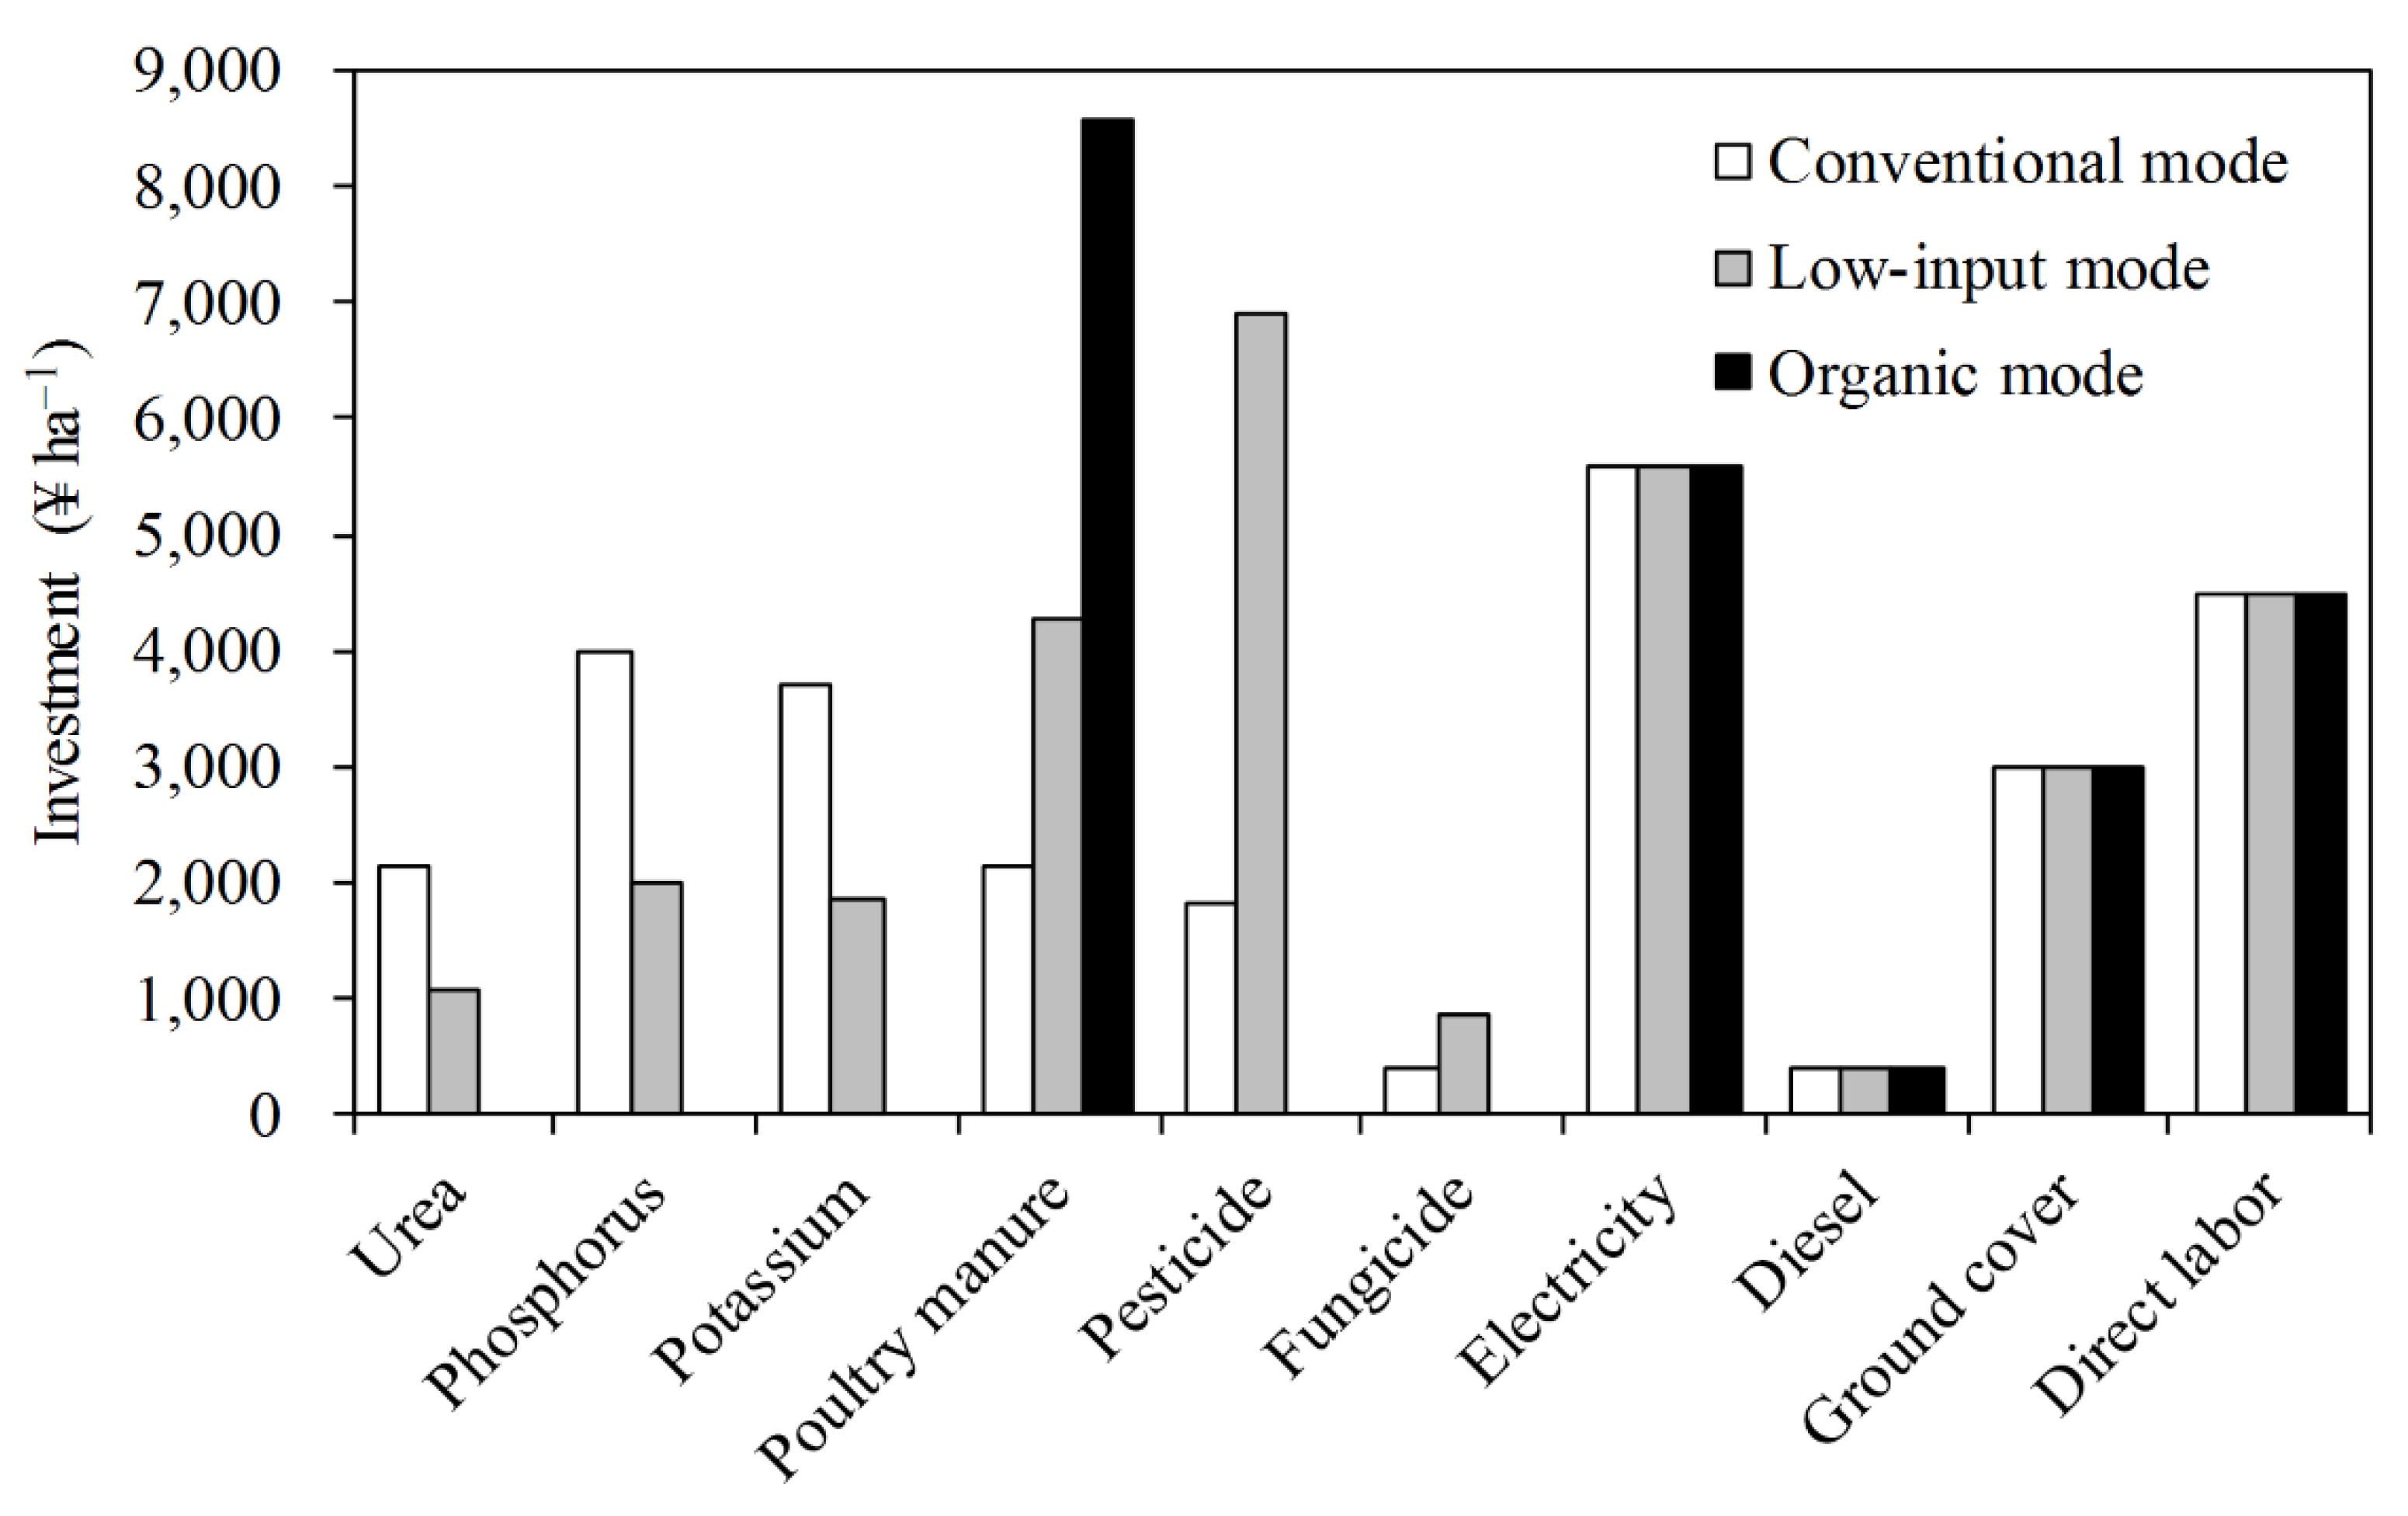
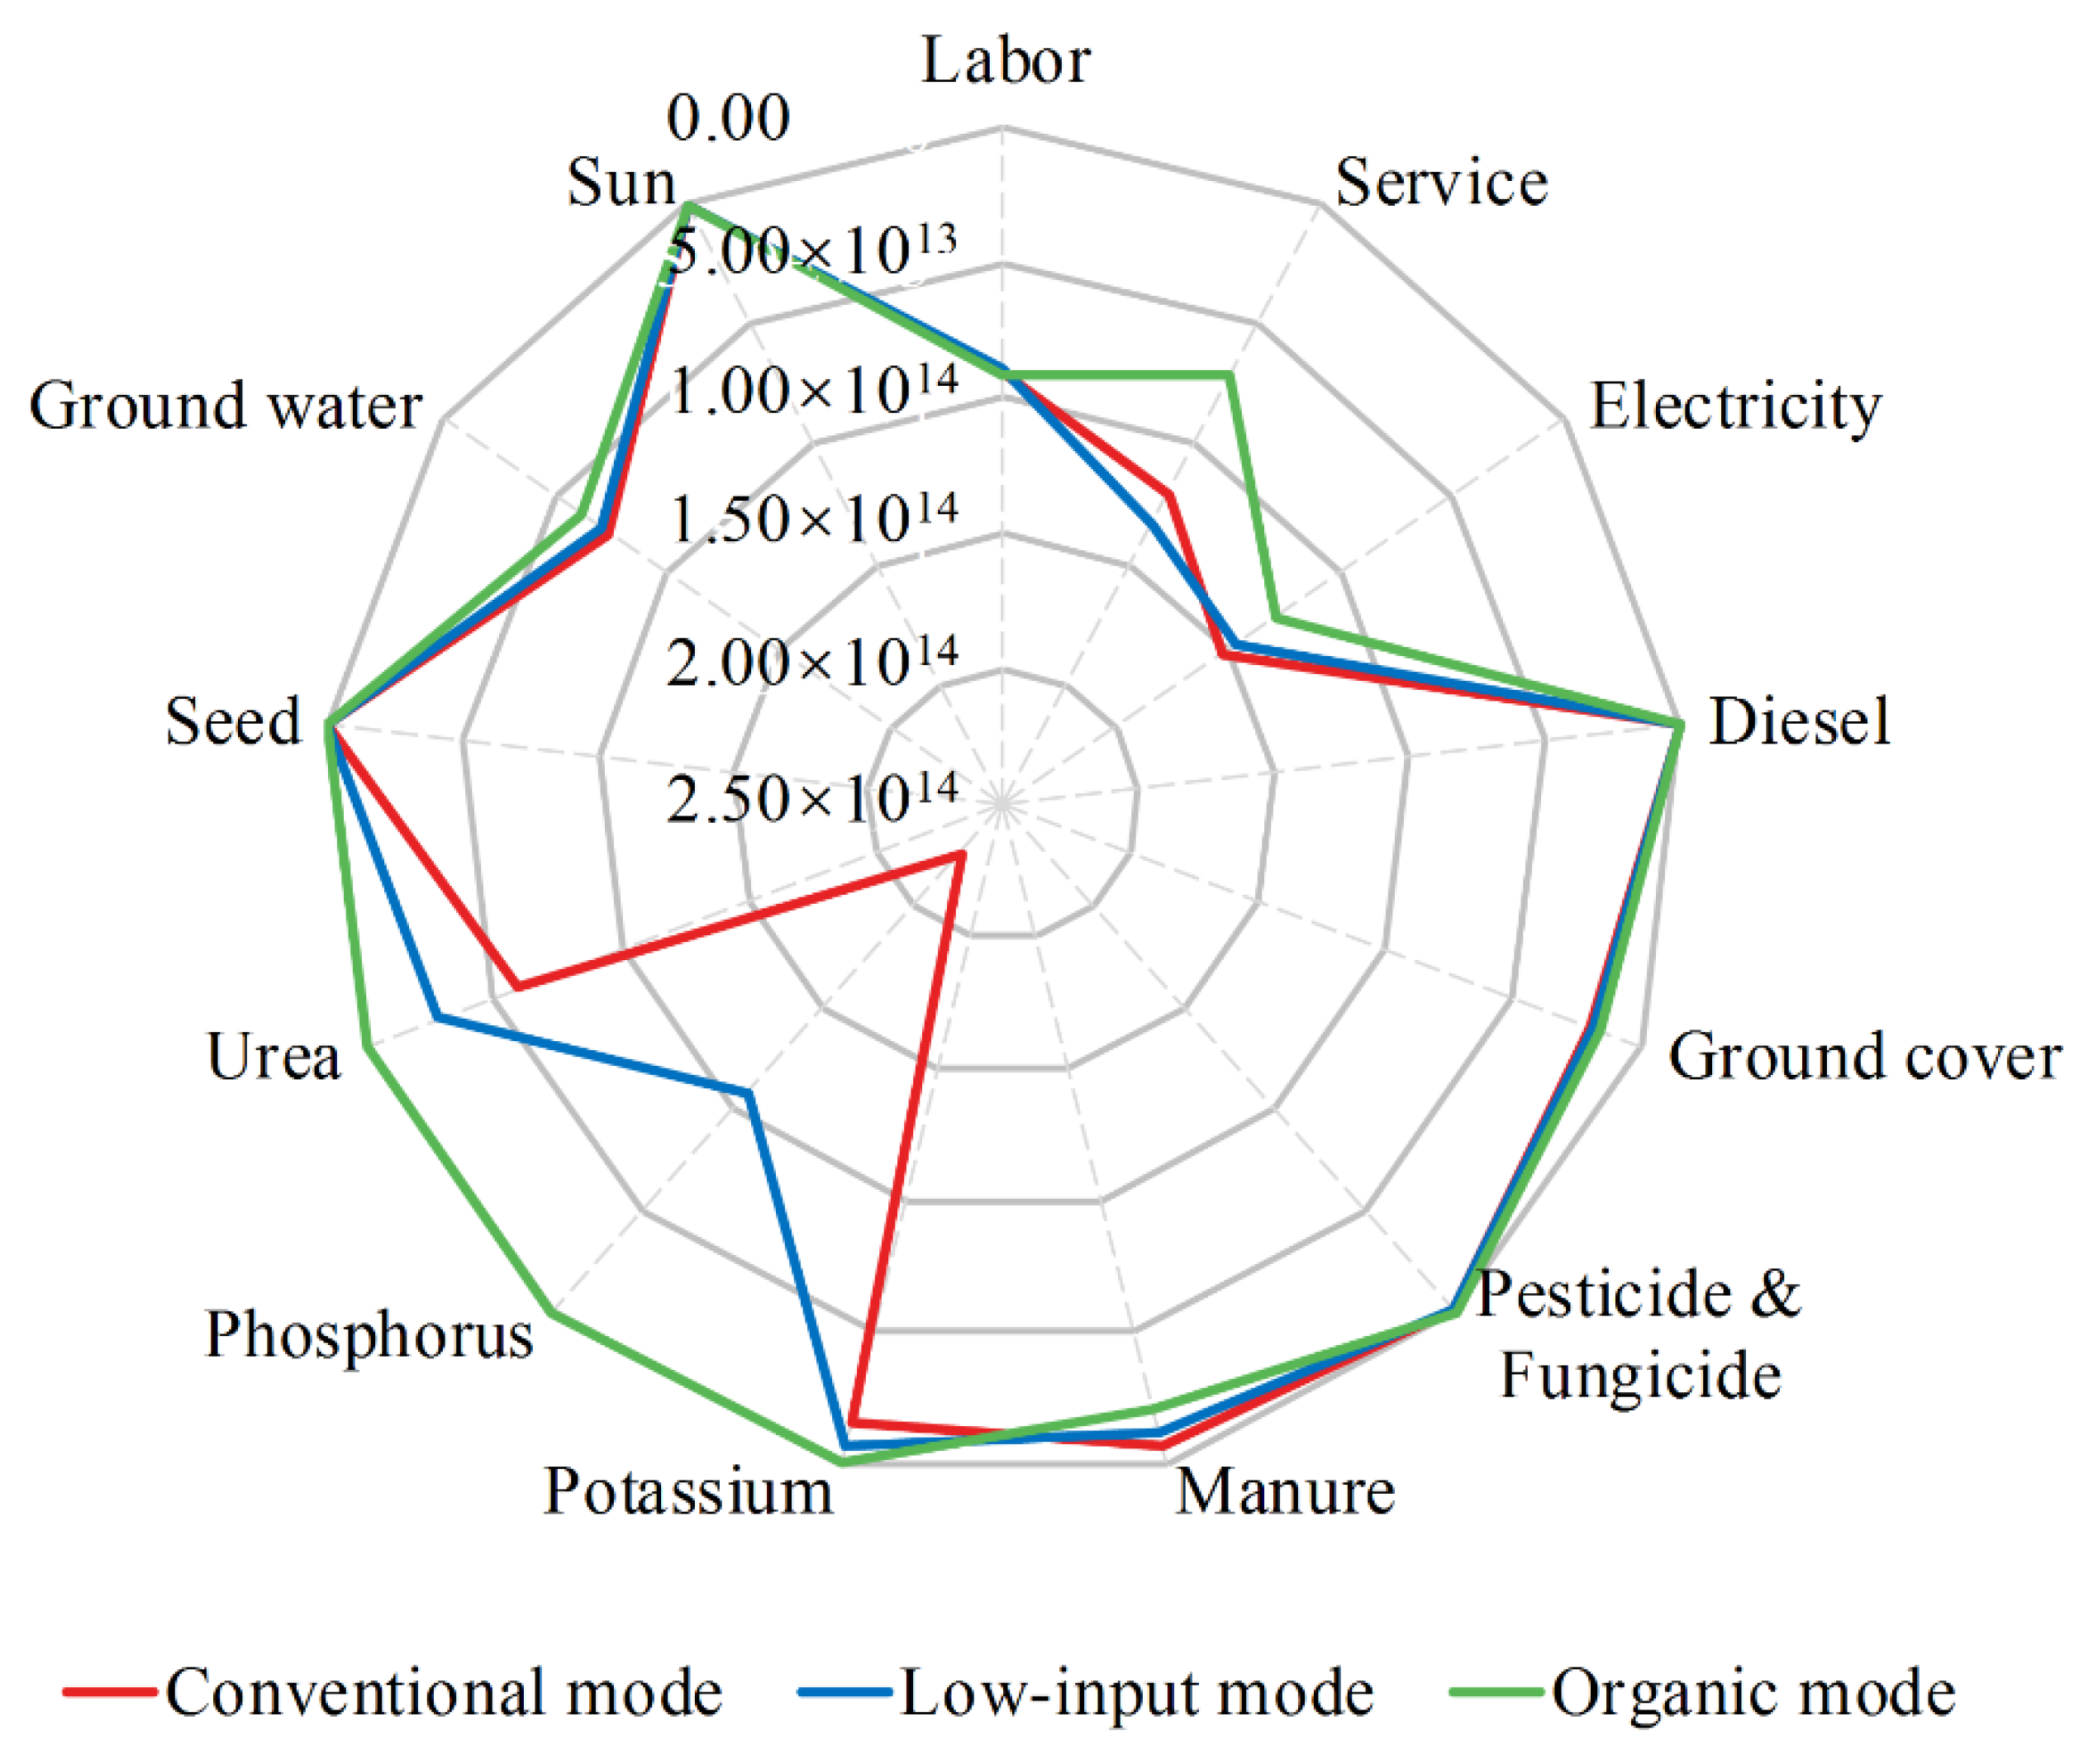
3.2. Resource Use
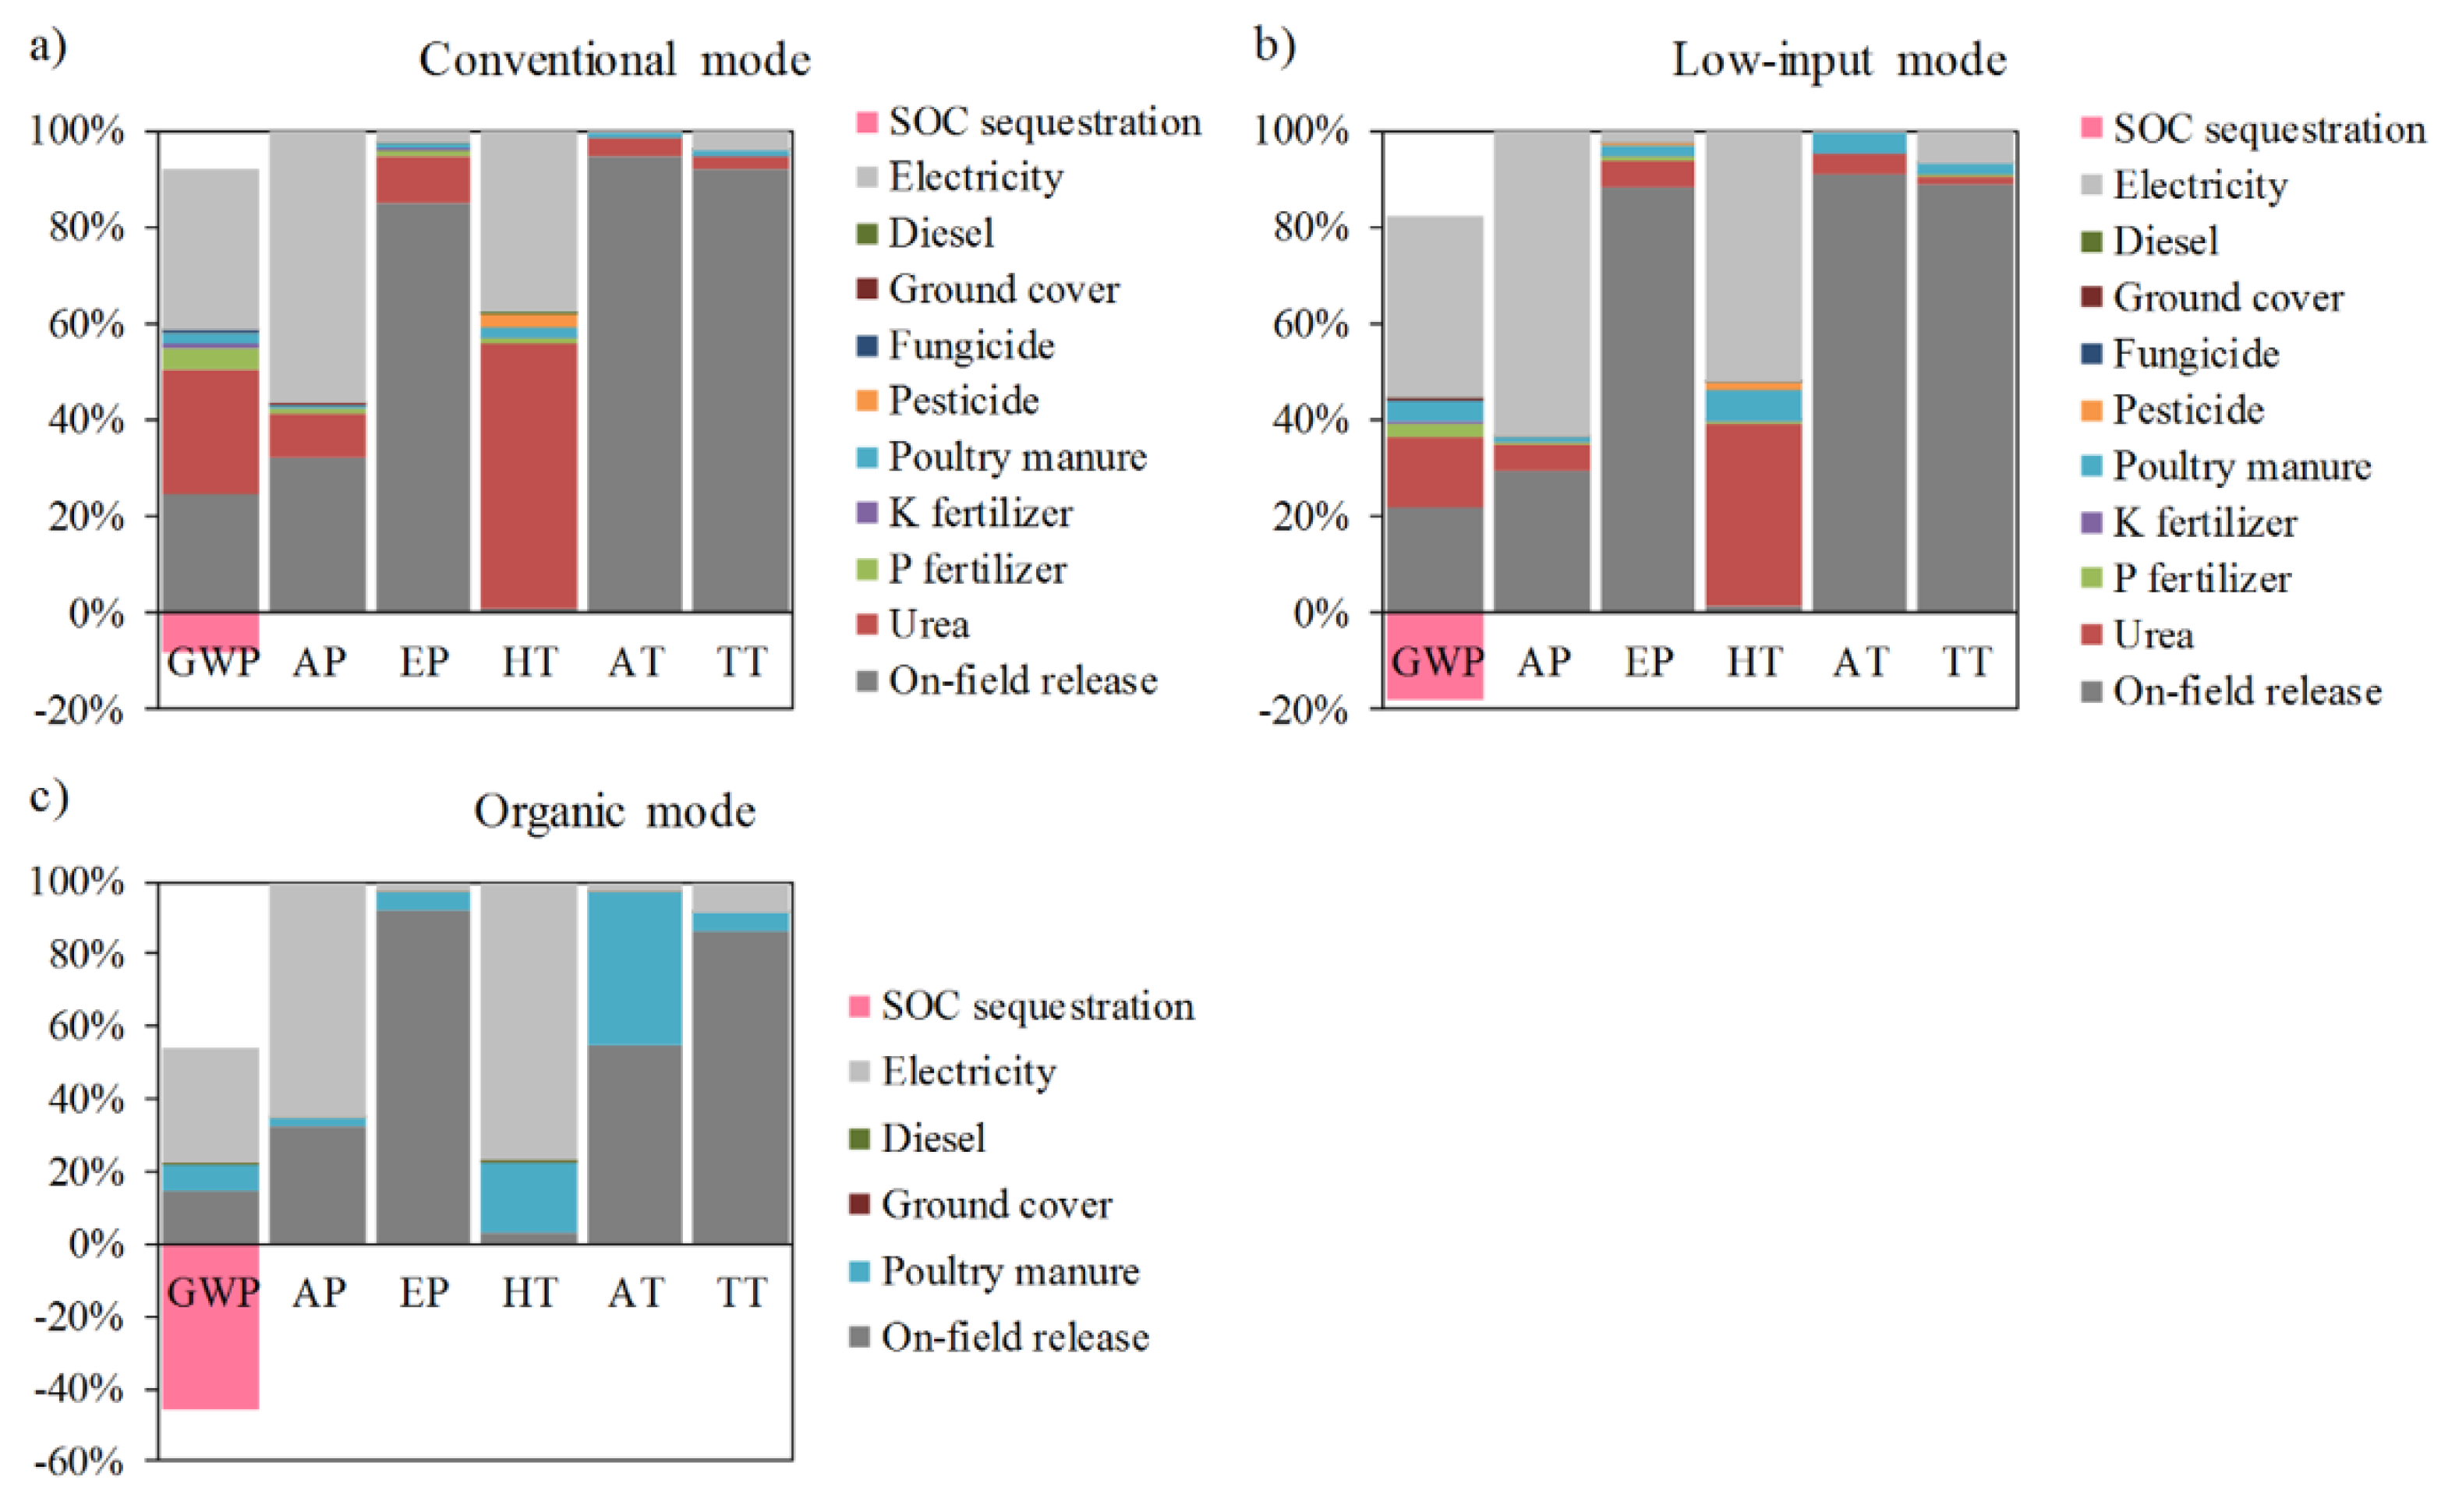
3.3. Environmental Impacts
4. Discussion
4.1. Economic Analysis of Cultivation Shifting from Conventional to Organic Mode
4.2. Sustainability Evaluation of Cultivation Shifting from Conventional to Organic Mode
5. Conclusions
Author Contributions
Funding
Acknowledgments
Conflicts of Interest
References
- Boeing, H.; Bechthold, A.; Bub, A.; Ellinger, S.; Haller, D.; Kroke, A.; Leschik-Bonnet, E.; Müller, M.J.; Oberritter, H.; Schulze, M.; et al. Critical review: Vegetables and fruit in the prevention of chronic diseases. Eur. J. Nutr. 2012, 51, 637–663. [Google Scholar] [CrossRef] [PubMed] [Green Version]
- Han, H. Study on Key Microbial Communities of Nitrogen Transformation in Soil Nitrogen Balance under Organic Planting Mode. Ph.D. Thesis, China Agricultural University, Beijing, China, 2017. [Google Scholar]
- Chinese Ministry of Agriculture and Rural Affairs. China Agriculture Yearbook 2017; China Agriculture Press: Beijing, China, 2017. [Google Scholar]
- Wang, X.; Liu, B.; Wu, G.; Sun, Y.; Guo, X.; Jin, Z.; Xu, W.; Zhao, Y.; Zhang, F.; Zou, C.; et al. Environmental costs and mitigation potential in plastic-greenhouse pepper production system in China: A life cycle assessment. Agric. Syst. 2018, 167, 186–194. [Google Scholar] [CrossRef]
- Wang, X.; Zou, C.; Gao, X.; Guan, X.; Zhang, W.; Zhang, Y.; Shi, X.; Chen, X. Nitrous oxide emissions in Chinese vegetable systems: A meta-analysis. Environ. Pollut. 2018, 239, 375–383. [Google Scholar] [CrossRef]
- Xie, Y.; Li, J.; Yang, H. Quality of vegetables in different cultivation patterns in greenhouse. Chin. J. Soil Sci. 2007, 4, 718–721, (In Chinese with English abstract). [Google Scholar]
- Li, Y.; Li, J.; Zheng, C.; Cao, Z. Effects of organic, low input, conventional management practices on soil nematode community under greenhouse conditions. Acta Agric. Scand. Sect. B Soil Plant Sci. 2014, 64, 360–371. [Google Scholar] [CrossRef]
- Diao, T.; Xie, L.; Guo, L.; Yan, H.; Lin, M.; Zhang, H.; Lin, J.; Lin, E. Measurements of N2O emissions from different vegetable fields on the North China Plain. Atmos. Environ. 2013, 72, 70–76. [Google Scholar] [CrossRef]
- Han, H.; Ding, G.; Li, X.; Hu, K.; Yang, H.; Xu, T.; Li, J. Erratum to “Organic vegetable cultivation reduces N leaching while increasing the relative soil N budget”. Agric. Water Manag. 2019, 223, 105607. [Google Scholar] [CrossRef]
- Notice of the Ministry of Agriculture on Printing and Distributing the Action Plan for Zero Growth of Fertilizer Use by 2020 and the Action Plan for Zero Growth of Pesticide Use by 2020. Ministry of Agriculture and Rural Affairs. 2015. Available online: http://www.moa.gov.cn/nybgb/2015/san/201711/t20171129_5923401.htm (accessed on 3 March 2020). (In Chinese)
- Yang, X.; Sui, P.; Shen, Y.; Gerber, J.; Wang, D.; Wang, X.; Dai, H.; Chen, Y. Sustainability Evaluation of the Maize–Soybean Intercropping System and Maize Monocropping System in the North China Plain Based on Field Experiments. Agronomy 2018, 8, 268. [Google Scholar] [CrossRef] [Green Version]
- Lu, H.; Bai, Y.; Ren, H.; Campbell, D.E. Integrated emergy, energy and economic evaluation of rice and vegetable production systems in alluvial paddy fields: Implications for agricultural policy in China. J. Environ. Manag. 2010, 91, 2727–2735. [Google Scholar] [CrossRef]
- Amaral, L.P.; Martins, N.; Gouveia, J.B. A review of emergy theory, its application and latest developments. Renew. Sustain. Energy Rev. 2016, 54, 882–888. [Google Scholar] [CrossRef]
- Ragasová, L.; Kopta, T.; Winkler, J.; Pokluda, R. The Current Stage of Greening Vegetation in Selected Wine-Regions of South Moravian Region (Czech Republic). Agronomy 2019, 9, 541. [Google Scholar] [CrossRef] [Green Version]
- Torrellas, M.; Antón, A.; López, J.C.; Baeza, E.J.; Parra, J.P.; Muñoz, P.; Montero, J.I. LCA of a tomato crop in a multi-Tunnel greenhouse in Almeria. Int. J. Life Cycle Assess. 2012, 17, 863–875. [Google Scholar] [CrossRef]
- Xiao, X.; Zhu, Z.; Fu, Z.; Mu, W.; Zhang, X. Carbon footprint constrained profit maximization of table grapes cold chain. Agronomy 2018, 8, 125. [Google Scholar] [CrossRef] [Green Version]
- Ulgiati, S.; Bargigli, S.; Raugei, M. An emergy evaluation of complexity, information and technology, towards maximum power and zero emissions. J. Clean. Prod. 2007, 15, 1359–1372. [Google Scholar] [CrossRef]
- Pizzigallo, A.C.I.; Granai, C.; Borsa, S. The joint use of LCA and emergy evaluation for the analysis of two Italian wine farms. J. Environ. Manag. 2008, 86, 396–406. [Google Scholar] [CrossRef] [PubMed]
- Cui, J.; Yan, P.; Wang, X.; Yang, J.; Li, Z.; Yang, X.; Sui, P.; Chen, Y. Integrated assessment of economic and environmental consequences of shifting cropping system from wheat-maize to monocropped maize in the North China Plain. J. Clean. Prod. 2018, 193, 524–532. [Google Scholar] [CrossRef]
- Wang, X.; Dadouma, A.; Chen, Y.; Sui, P.; Gao, W.; Jia, L. Sustainability evaluation of the large-scale pig farming system in North China: An emergy analysis based on life cycle assessment. J. Clean. Prod. 2015, 102, 144–164. [Google Scholar] [CrossRef]
- Nelson, D.W.; Sommers, L.E. Total carbon, organic carbon and organic matter. Methods Soil Anal. 1982, 9, 961–1010. [Google Scholar]
- Wang, Z.; Liu, X.; Ju, X.; Zhang, F. Field in situ determination of ammonia volatilization from soil: Venting method. J. Plant Nutr. Ferti 2002, 8, 205–209, (In Chinese with English abstract). [Google Scholar]
- Wang, Y.; Hu, Y.; Ji, B.; Liu, G.; Xue, M. An Investigation on the Relationship Between Emission/Uptake of Greenhouse Gases and Environmental Factors in Serniarid Grassland. Adv. Atmos. Sci. 2003, 20, 119–127. [Google Scholar] [CrossRef]
- Han, H.; Teng, Y.; Yang, H.; Li, J. Effects of Long-Term Use of Compost on N2O and CO2 Fluxes in Greenhouse Vegetable Systems. Compost Sci. Util. 2017, 25, S61–S69. [Google Scholar] [CrossRef]
- Xu, Q.; Wang, X.; Xiao, B.; Hu, K. Rice-crab coculture to sustain cleaner food production in Liaohe River Basin, China: An economic and environmental assessment. J. Clean. Prod. 2019, 208, 188–198. [Google Scholar] [CrossRef]
- Odum, H.T. Environmental Accounting: Emergy and Environmental Decision Making; Wiley: New York, NY, USA, 1996. [Google Scholar]
- Luo, S. Agricultural Ecology; China Agricultural Press: Beijing, China, 2001. [Google Scholar]
- Brown, M.T.; Ulgiati, S. Emergy assessment of global renewable sources. Ecol. Model. 2016, 339, 148–156. [Google Scholar] [CrossRef] [Green Version]
- Liang, L. Environmental Impact Assessment of Circular Agriculture Based on Life Cycle Assessment: Methods and Case Study. Ph.D. Thesis, China Agricultural University, Beijing, China, 2009. [Google Scholar]
- Wang, X.; Chen, Y.; Sui, P.; Yan, P.; Yang, X.; Gao, W. Preliminary analysis on economic and environmental consequences of grain production on different farm sizes in North China Plain. Agric. Syst. 2017, 153, 181–189. [Google Scholar] [CrossRef]
- Van Calker, K.J.; Berentsen, P.B.M.; de Boer, I.M.J.; Giesen, G.W.J.; Huirne, R.B.M. An LP-model to analyse economic and ecological sustainability on Dutch dairy farms: Model presentation and application for experimental farm “de Marke. Agric. Syst. 2004, 82, 139–160. [Google Scholar] [CrossRef]
- The International Standards Organisation. Environmental Management–Life Cycle Assessment–Principles and Framework; ISO 14040; International Organization for Standardization: Geneva, Switzerland, 2006. [Google Scholar]
- International Standard in: Environmental Management–Life Cycle Assessment-Requirements and Guidelines; ISO 14044; International Organization for Standardization: Geneva, Switzerland, 2006.
- Guinée, J.B. Life Cycle Assessment: An Operational Guide to the ISO Standards. Ministry of Housing; Spatial Planning and Environment (VROM): Den Haag, The Netherlands; Centre of Environmental Science (CML): Leiden, The Netherlands, 2001. [Google Scholar]
- Sleeswijk, A.W.; van Oers, L.F.C.M.; Guinée, J.B.; Struijs, J.; Huijbregts, M.A.J. Normalisation in product life cycle assessment: An LCA of the global and European economic systems in the year 2000. Sci. Total Environ. 2008, 390, 227–240. [Google Scholar] [CrossRef] [PubMed]
- Wang, M.; Wu, W.; Liu, W.; Bao, Y. Life cycle assessment of the winter wheat-summer maize production system on the North China Plain. Int. J. Sustain. Dev. World Ecol. 2007, 14, 400–407. [Google Scholar] [CrossRef]
- He, X.; Qiao, Y.; Liang, L.; Knudsen, M.T.; Martin, F. Environmental life cycle assessment of long-term organic rice production in subtropical China. J. Clean. Prod. 2018, 176, 880–888. [Google Scholar] [CrossRef]
- Knudsen, M.T.; Yu-Hui, Q.; Yan, L.; Halberg, N. Environmental assessment of organic soybean (Glycine max.) imported from China to Denmark: A case study. J. Clean. Prod. 2010, 18, 1431–1439. [Google Scholar] [CrossRef]
- He, X.; Qiao, Y.; Liu, Y.; Dendler, L.; Yin, C.; Martin, F. Environmental impact assessment of organic and conventional tomato production in urban greenhouses of Beijing city, China. J. Clean. Prod. 2016, 134, 251–258. [Google Scholar] [CrossRef]
- Zhang, W.-F.; Dou, Z.-X.; He, P.; Ju, X.-T.; Powlson, D.; Chadwick, D.; Norse, D.; Lu, Y.-L.; Zhang, Y.; Wu, L.; et al. New technologies reduce greenhouse gas emissions from nitrogenous fertilizer in China. Proc. Natl. Acad. Sci. USA 2013, 110, 8375–8380. [Google Scholar] [CrossRef] [PubMed] [Green Version]
- Stolze, M.; Piorr, A.; Häring, A.M.; Dabbert, S. Environmental Impacts of Organic Farming in Europe, Organic Farming in Europe: Economics and Policy; Universität Stuttgart-Hohenheim: Stuttgart-Hohenheim, Germany, 2000; Volume 6. [Google Scholar]
 indicates system boundary;
  indicates energy source; indicates;
  indicates producer;
  indicates heat sink;
  indicates storage tank.
indicates system boundary; indicates energy source; indicates; indicates producer; indicates heat sink; indicates storage tank.
indicates storage tank.
indicates system boundary; indicates energy source; indicates; indicates producer; indicates heat sink; indicates storage tank.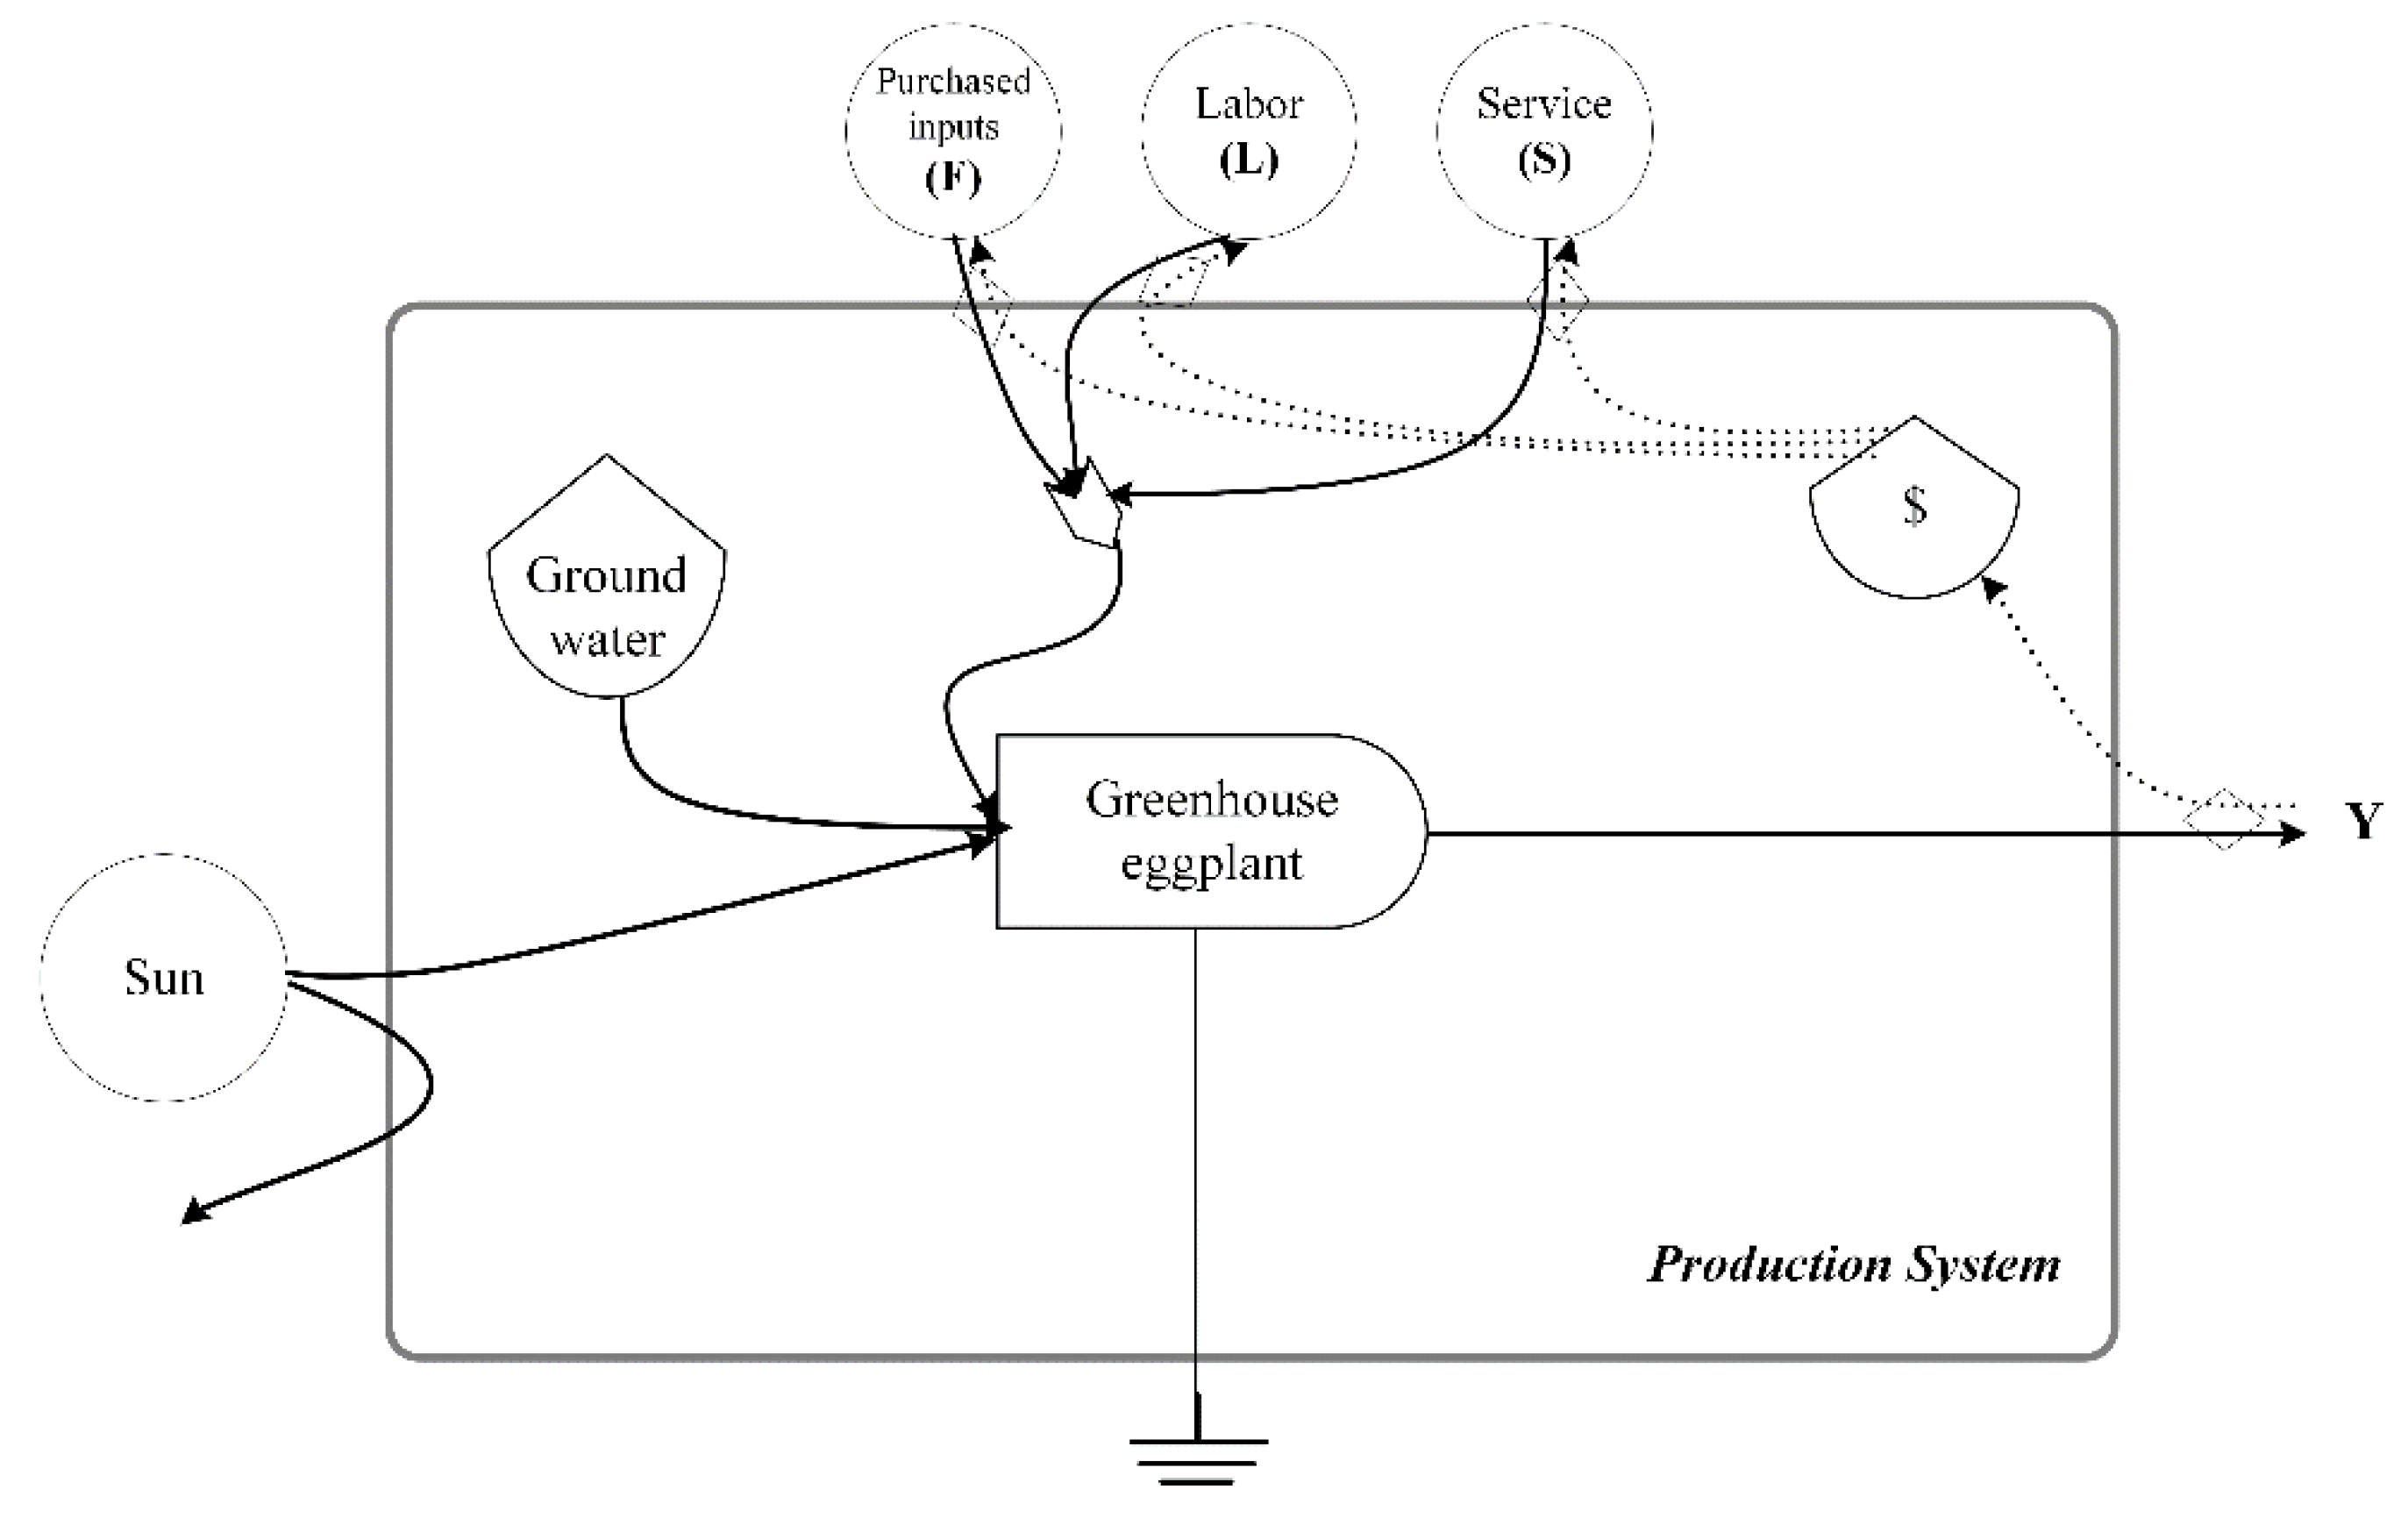

| Item | Unit | CON | LOW | ORG |
|---|---|---|---|---|
| Nutrition | ||||
| Urea | kg N ha−1 | 661.1 ± 234.95 | 330.5 ± 117.5 | – |
| P fertilizer | kg P2O5 ha−1 | 758.4 ± 0.0 | 379.2 ± 0.0 | – |
| K fertilizer | kg K2O ha−1 | 630.4 ± 0.0 | 315.2 ± 0.0 | – |
| Poultry manure | kg N ha−1 | 182.6 ± 33.4 | 366.5 ± 65.3 | 732.9 ± 130.6 |
| Pesticide | kg ha−1 | 9.1 ± 4.0 | 3.8 ± 7.0 | – |
| Fungicide | kg ha−1 | 2.1 | 2.1 | – |
| Plastic ground cover | kg ha−1 | 41.7 | 41.7 | 41.7 |
| Diesel | kg ha−1 | 50.1 | 50.1 | 50.1 |
| Irrigation | m3 ha−1 | 9425.0 | 9425.0 | 9425.0 |
| Electricity | kW h ha−1 | 6597.5 | 6597.5 | 6597.5 |
| SOC sequestration | kg CO2 ha−1 | 2024.0 | 3960.0 | 12,037.7 |
| Yield | t ha−1 | 117.2 | 122.1 | 139.3 |
| Environmental Medium | Unit | Items | CON | LOW | ORG |
|---|---|---|---|---|---|
| Air | kg ha−1 | N2O | 20.97 | 16.52 | 12.84 |
| kg ha−1 | NH3 | 105.46 | 87.13 | 91.61 | |
| Water | kg ha−1 | NO3− | 248.09 | 205.61 | 218.03 |
| kg ha−1 | Ptotal | 1.96 | 1.65 | 1.78 | |
| Soil | kg ha−1 | Cd | 0.004 | 0.009 | 0.017 |
| kg ha−1 | Pb | 0.060 | 0.121 | 0.242 | |
| kg ha−1 | Cu | 0.443 | 0.890 | 1.780 | |
| kg ha−1 | Zn | 1.573 | 3.157 | 6.314 |
| Indices | Units | Expression b | Explanation |
|---|---|---|---|
| Economic analysis | |||
| Economic profits | ¥ ha−1 | Income-cost | Economic benefits of product on unit land |
| Value to cost Ratio (VCR) | NA | Income/cost | Economic benefits of vegetable production system |
| Emergy analysis | |||
| Unit emergy value (UEV) | sej J−1 | U/Y | The unit emergy value of the production system. |
| Renewable fraction (%R) | % | 100 × (LR + FR)/U | The ratio of renewable resources to total resources in a production system |
| Emergy yield ratio (EYR) | NA | U/F | The ability of the system to make available local resources by investing outside resources |
| Environmental loading ratio (ELR) | NA | (LN + FN)/(LR + FR) | Environmental pressure resulting from the system |
| Emergy sustainability index (ESI) | NA | EYR/ELR | Sustainability of the system |
| Life cycle assessment a | |||
| Potential environmental impact index | NA | ∑Ep(x)/S(2000)Wx | Environmental impacts on unit area |
| Item | Unit | CON | LOW | ORG |
|---|---|---|---|---|
| Cost | 103 ¥ha−1 | 23.2 | 26.0 | 17.6 |
| Income | 103 ¥ha−1 | 703.2 | 732.6 | 835.8 |
| Economic profit | 103 ¥ha−1 | 679.9 | 706.6 | 818.2 |
| Value to cost ratio (VCR) | – | 30.3 | 28.2 | 47.6 |
| No. | Items | Units | Raw Data | RNF | UEV (sej unit−1) | Emergy (sej) | ||||
|---|---|---|---|---|---|---|---|---|---|---|
| CON | LOW | ORG | CON | LOW | ORG | |||||
| Inputs | ||||||||||
| 1 | Sun | J | 1.60 × 10¹¹ | 1.53 × 10¹¹ | 1.34 × 10¹¹ | 1.00 | 1.00 | 1.60 × 10¹¹ | 1.53 × 10¹¹ | 1.34 × 10¹¹ |
| 2 | Ground water | J | 3.97 × 10⁸ | 3.81 × 10⁸ | 3.34 × 10⁸ | 0.10 | 1.86 × 10⁵ | 7.38 × 10¹³ | 7.08 × 10¹³ | 6.21 × 10¹³ |
| 3 | Seed | J | 1.34 × 10⁵ | 1.28 × 10⁵ | 1.12 × 10⁵ | 1.00 | 8.41 × 10⁴ | 1.12 × 10¹⁰ | 1.08 × 10¹⁰ | 9.45 × 10⁹ |
| 4 | Urea | g | 1.22 × 10⁴ | 5.86 × 10³ | 0.00 | 0.00 | 4.84 × 10⁹ | 5.91 × 10¹³ | 2.83 × 10¹³ | 0.00 |
| 5 | Phosphorus | g | 4.56 × 10⁴ | 2.19 × 10⁴ | 0.00 | 0.00 | 4.97 × 10⁹ | 2.26 × 10¹⁴ | 1.09 × 10¹⁴ | 0.00 |
| 6 | Potassium | g | 1.05 × 10⁴ | 5.06 × 10³ | 0.00 | 0.00 | 1.40 × 10⁹ | 1.48 × 10¹³ | 7.10 × 10¹² | 0.00 |
| 7 | Manure | J | 2.99 × 10⁸ | 5.75 × 10⁸ | 1.01 × 10⁹ | 0.68 | 2.05 × 10⁴ | 6.12 × 10¹² | 1.18 × 10¹³ | 2.07 × 10¹³ |
| 8 | Pesticide & Fungicide | g | 9.56 × 101 | 4.83 × 101 | 0.00 | 0.00 | 1.89 × 10¹⁰ | 1.81 × 10¹² | 9.13 × 10¹¹ | 0.00 |
| 9 | Ground cover | ¥ | 2.56 × 101 | 2.46 × 101 | 2.15 × 101 | 0.00 | 7.54 × 10¹¹ | 1.93 × 10¹³ | 1.85 × 10¹³ | 1.62 × 10¹³ |
| 10 | Diesel | g | 4.27 × 10² | 4.10 × 10² | 3.60 × 10² | 0.05 | 8.41 × 10⁴ | 3.60 × 10⁷ | 3.45 × 10⁷ | 3.02 × 10⁷ |
| 11 | Electricity | J | 7.04 × 10⁸ | 6.75 × 10⁸ | 5.92 × 10⁸ | 0.81 | 2.18 × 10⁵ | 1.53 × 10¹⁴ | 1.47 × 10¹⁴ | 1.29 × 10¹⁴ |
| 12 | Service | ¥ | 1.60 × 10² | 1.76 × 10² | 9.39 × 101 | 0.05 | 7.54 × 10¹¹ | 1.21 × 10¹⁴ | 1.33 × 10¹⁴ | 7.08 × 10¹³ |
| 13 | Labor | J | 1.58 × 10⁷ | 1.55 × 10⁷ | 1.59 × 10⁷ | 0.10 | 5.73 × 10⁶ | 9.04 × 10¹³ | 8.87 × 10¹³ | 9.13 × 10¹³ |
| Total | 7.22 × 10¹⁴ | 5.39 × 10¹⁴ | 3.66 × 10¹⁴ | |||||||
| Outputs | ||||||||||
| 14 | Eggplant yield | g | 1.00 × 10⁶ | 1.00 × 10⁶ | 1.00 × 10⁶ | 7.65 × 10⁸ | 6.15 × 10⁸ | 3.90 × 10⁸ | ||
| 15 | Eggplant yield | J | 1.05 × 10⁶ | 1.05 × 10⁶ | 1.05 × 10⁶ | 7.29 × 10⁸ | 5.85 × 10⁸ | 3.71 × 10⁸ | ||
| Aggregate Emergy Flows | CON | % | LOW | % | ORG | % |
|---|---|---|---|---|---|---|
| Local natural resources (L) | 7.39 × 10¹³ | 10.2% | 7.10 × 10¹³ | 13.2% | 6.22 × 10¹³ | 17.0% |
| Local renewable natural resources (LR) | 7.54 × 10¹² | 1.0% | 7.23 × 10¹² | 1.3% | 6.34 × 10¹² | 1.7% |
| Local nonrenewable natural resources (LN) | 6.64 × 10¹³ | 9.2% | 6.37 × 10¹³ | 11.8% | 5.59 × 10¹³ | 15.3% |
| Economic imported resources (F) | 6.91 × 10¹⁴ | 89.8% | 5.44 × 10¹⁴ | 86.8% | 3.28 × 10¹⁴ | 83.0% |
| Renewable economic imported resources (FR) | 1.43 × 10¹⁴ | 19.5% | 1.43 × 10¹⁴ | 25.8% | 1.31 × 10¹⁴ | 35.5% |
| Nonrenewable economic imported resources (FN) | 5.48 × 10¹⁴ | 70.2% | 4.01 × 10¹⁴ | 61.1% | 1.97 × 10¹⁴ | 47.5% |
| Renewable emergy flows (LR+FR) | 1.51 × 10¹⁴ | 20.6% | 1.50 × 10¹⁴ | 27.1% | 1.37 × 10¹⁴ | 37.2% |
| Nonrenewable emergy flows (LN+FN) | 6.15 × 10¹⁴ | 79.4% | 4.65 × 10¹⁴ | 72.9% | 2.53 × 10¹⁴ | 62.8% |
| Total emergy input (U) | 7.65 × 10¹⁴ | 100% | 6.15 × 10¹⁴ | 100% | 3.90 × 10¹⁴ | 100% |
| Emergy | Unit | CON | LOW | ORG |
|---|---|---|---|---|
| Unit emergy value (UEV) | 10 × 107 sej J−1 | 7.29 | 5.85 | 3.71 |
| Renewable fraction (%R) | % | 20 | 24 | 35 |
| Emergy yield ratio (EYR) | – | 1.11 | 1.13 | 1.19 |
| Environmental loading ratio (ELR) | – | 4.08 | 3.10 | 1.84 |
| Emergy sustainability index (ESI) | – | 0.27 | 0.36 | 0.65 |
| Categories | Unit | Characterization Results | Normalization Results | Weighted Evaluation Results | ||||||
|---|---|---|---|---|---|---|---|---|---|---|
| CON | LOW | ORG | CON | LOW | ORG | CON | LOW | ORG | ||
| GWP | kg CO2-eq | 179.7 | 117.1 | 15.1 | 0.0262 | 0.0170 | 0.0022 | 0.0031 | 0.0020 | 0.0003 |
| AP | kg SO2-eq | 4.5 | 3.8 | 3.3 | 0.0854 | 0.0735 | 0.0624 | 0.0120 | 0.0103 | 0.0087 |
| EP | kg PO4-eq | 0.7 | 0.6 | 0.5 | 0.3674 | 0.3024 | 0.2431 | 0.0441 | 0.0363 | 0.0292 |
| HT | kg 1,4-DCB-eq | 51.7 | 36.2 | 21.4 | 0.2620 | 0.1835 | 0.1084 | 0.0367 | 0.0257 | 0.0152 |
| AT | kg 1,4-DCB-eq | 222.7 | 103.1 | 17.9 | 46.1138 | 21.3407 | 3.7043 | 5.0725 | 2.3475 | 0.4075 |
| TT | kg 1,4-DCB-eq | 3.5 | 2.2 | 1.6 | 0.5780 | 0.3558 | 0.2615 | 0.0520 | 0.0320 | 0.0235 |
| Total | 5.22 | 2.45 | 0.48 | |||||||
© 2020 by the authors. Licensee MDPI, Basel, Switzerland. This article is an open access article distributed under the terms and conditions of the Creative Commons Attribution (CC BY) license (http://creativecommons.org/licenses/by/4.0/).
Share and Cite
Xu, Q.; Hu, K.; Zhang, H.; Han, H.; Li, J. Organic Vegetable Cultivation Reduces Resource and Environmental Costs While Increasing Farmers’ Income in the North China Plain. Agronomy 2020, 10, 361. https://doi.org/10.3390/agronomy10030361
Xu Q, Hu K, Zhang H, Han H, Li J. Organic Vegetable Cultivation Reduces Resource and Environmental Costs While Increasing Farmers’ Income in the North China Plain. Agronomy. 2020; 10(3):361. https://doi.org/10.3390/agronomy10030361
Chicago/Turabian StyleXu, Qiang, Kelin Hu, Hongyuan Zhang, Hui Han, and Ji Li. 2020. "Organic Vegetable Cultivation Reduces Resource and Environmental Costs While Increasing Farmers’ Income in the North China Plain" Agronomy 10, no. 3: 361. https://doi.org/10.3390/agronomy10030361