Transcriptome Analysis Reveals Important Transcription Factor Families and Reproductive Biological Processes of Flower Development in Celery (Apium graveolens L.)

 , , , , , , and
Abstract
:1. Introduction
2. Materials and Methods
2.1. Plant Materials
2.2. Cytological Study on Anthers of Celery
2.3. RNA Extraction and Transcriptome Sequencing
2.4. De Novo Assembly
2.5. Functional Annotation
2.6. Analysis of Transcript Abundance and Selection of Differentially Expressed Genes
2.7. Analysis of Transcription Factors for Differentially Expressed Genes
2.8. Verifying Gene Expression Levels by qPCR
3. Results
3.1. Characteristics of Anther Development in Celery
3.2. Transcriptome Sequencing and Data Assembly
3.3. Functional Annotation for Unigenes
3.4. Identification and Selection of the Differentially Expressed Genes (DEG)
3.5. Functional Annotation of Differentially Expressed Genes
3.6. Analysis of Transcription Factors Regulated by the DEGs
3.7. Verifying Gene Expression Levels by qPCR
4. Discussion
4.1. Characteristics of Changes during Anther Development
4.2. Genes that Regulate Physiological and Biochemical Processes during Flower Development
4.3. Transcription Factor Families Show Different Regulation of Flower Development
5. Conclusions
Supplementary Materials
Author Contributions
Funding
Conflicts of Interest
References
- Parish, R.W.; Li, S.F. Death of a tapetum: A programme of developmental altruism. Plant Sci. 2010, 178, 73–89. [Google Scholar] [CrossRef]
- Chen, L.; Liu, Y.-G. Male Sterility and Fertility Restoration in Crops. Annu. Rev. Plant Boil. 2014, 65, 579–606. [Google Scholar] [CrossRef] [PubMed]
- Tester, M.; Langridge, P. Breeding Technologies to Increase Crop Production in a Changing World. Science 2010, 327, 818–822. [Google Scholar] [CrossRef] [PubMed]
- Zhou, X.; Liu, Z.; Ji, R.; Feng, H. Comparative transcript profiling of fertile and sterile flower buds from multiple-allele-inherited male sterility in Chinese cabbage (Brassica campestris L. ssp. pekinensis). Mol. Genet. Genom. 2017, 292, 967–990. [Google Scholar] [CrossRef]
- Müller, M.; Katsov, K.; Schick, M. A New Mechanism of Model Membrane Fusion Determined from Monte Carlo Simulation. Biophys. J. 2003, 85, 1611–1623. [Google Scholar] [CrossRef] [Green Version]
- Tang, H.; Xie, Y.; Liu, Y.-G.; Chen, L. Advances in understanding the molecular mechanisms of cytoplasmic male sterility and restoration in rice. Plant Reprod. 2017, 30, 179–184. [Google Scholar] [CrossRef]
- Huang, X.; Yue, Y.; Sun, J.; Peng, H.; Yang, Z.; Bao, M.; Hu, H. Characterization of a fertility-related SANT/MYB gene (PhRL) from petunia. Sci. Hortic. 2015, 183, 152–159. [Google Scholar] [CrossRef]
- Meng, N.; He, M.; Bai, Y.; Xu, H.; Dandekar, A.M.; Fei, Z.; Cheng, L. Decreased sorbitol synthesis leads to abnormal stamen development and reduced pollen tube growth via an MYB transcription factor, MdMYB39L, in apple (Malus domestica). New Phytol. 2017, 217, 641–656. [Google Scholar] [CrossRef] [Green Version]
- Wang, T.; Ping, X.; Cao, Y.; Jian, H.; Gao, Y.; Wang, J.; Tan, Y.; Xu, X.; Lu, K.; Li, J.; et al. Genome-wide exploration and characterization of miR172/euAP2 genes in Brassica napus L. for likely role in flower organ development. BMC Plant Boil. 2019, 19, 336. [Google Scholar] [CrossRef] [Green Version]
- Yu, Y.; Liu, Z.; Wang, L.; Kim, S.-G.; Seo, P.J.; Qiao, M.; Wang, N.; Li, S.; Cao, X.; Park, C.-M.; et al. WRKY71 accelerates flowering via the direct activation ofFLOWERING LOCUS TandLEAFYinArabidopsis thaliana. Plant J. 2015, 85, 96–106. [Google Scholar] [CrossRef] [Green Version]
- Liu, H.; Sun, M.; Du, N.; Pan, H.; Cheng, T.; Wang, J.; Zhang, Q. Whole-Transcriptome Analysis of Differentially Expressed Genes in the Vegetative Buds, Floral Buds and Buds of Chrysanthemum morifolium. PLoS ONE 2015, 10, e0128009. [Google Scholar] [CrossRef] [PubMed]
- Noor, S.H.; Ushijima, K.; Murata, A.; Yoshida, K.; Tanabe, M.; Tanigawa, T.; Kubo, Y.; Nakano, R. Double flower formation induced by silencing of C-class MADS-box genes and its variation among petunia Cultivars. Sci. Hortic. 2014, 178, 1–7. [Google Scholar] [CrossRef]
- Chen, Z.-S.; Liu, X.-F.; Wang, D.-H.; Chen, R.; Zhang, X.-L.; Xu, Z.-H.; Bai, S.-N. Transcription Factor OsTGA10 Is a Target of the MADS Protein OsMADS8 and Is Required for Tapetum Development. Plant Physiol. 2017, 176, 819–835. [Google Scholar] [CrossRef] [PubMed] [Green Version]
- Dinneny, J.R.; Weigel, D.; Yanofsky, M.F. NUBBIN and JAGGED define stamen and carpel shape in Arabidopsis. Development 2006, 133, 1645–1655. [Google Scholar] [CrossRef] [Green Version]
- Li, M.-Y.; Feng, K.; Hou, X.-L.; Jiang, Q.; Xu, Z.-S.; Wang, G.-L.; Liu, J.-X.; Wang, F.; Xiong, A.-S. The genome sequence of celery (Apium graveolens L.), an important leaf vegetable crop rich in apigenin in the Apiaceae family. Hortic. Res. 2020, 7, 1–10. [Google Scholar] [CrossRef] [Green Version]
- Li, M.-Y.; Wang, F.; Jiang, Q.; Wang, G.-L.; Tian, C.; Xiong, A.-S. Validation and Comparison of Reference Genes for qPCR Normalization of Celery (Apium graveolens) at Different Development Stages. Front. Plant Sci. 2016, 7, 5245. [Google Scholar] [CrossRef] [Green Version]
- Kooti, W.; Aliakbari, S.; Asadi-Samani, M.; Ghadery, H.; Ashtary-larky, D. A review on medicinal plant of Apium graveolens. Adv. Herb. Med. 2015, 1, 48–59. [Google Scholar]
- Nagella, P.; Ahmad, A.; Kim, S.-J.; Chung, I.-M. Chemical composition, antioxidant activity and larvicidal effects of essential oil from leaves of Apium graveolens. Immunopharmacol. Immunotoxicol. 2011, 34, 205–209. [Google Scholar] [CrossRef]
- Bruznican, S.; De Clercq, H.; Eeckhaut, T.; Van Huylenbroeck, J.; Geelen, D. Celery and Celeriac: A Critical View on Present and Future Breeding. Front. Plant Sci. 2020, 10, 1699. [Google Scholar] [CrossRef]
- Li, M.-Y.; Hou, X.; Wang, F.; Tan, G.-F.; Xiong, A.-S.; Xiong, A.-S. Advances in the research of celery, an important Apiaceae vegetable crop. Crit. Rev. Biotechnol. 2017, 38, 172–183. [Google Scholar] [CrossRef]
- Quiros, C.F.; Rugama, A.; Dong, Y.Y.; Orton, T.J. Cytological and genetical studies of a male sterile celery. Euphytica 1986, 35, 867–875. [Google Scholar] [CrossRef]
- Gao, G.; Jin, L.; Lu, F.; Lu, Z.; Ren, Z.; Yu, H. Genetic Characters of 01-3A Male Sterile Celery. J. Changjiang Veg. 2009, 21–23. [Google Scholar] [CrossRef]
- Jia, X.-L.; Wang, G.-L.; Xiong, F.; Yu, X.-R.; Xu, Z.-S.; Wang, F.; Xiong, A.-S. De novo assembly, transcriptome characterization, lignin accumulation and anatomic characteristics: Novel insights into lignin biosynthesis during celery leaf development. Sci. Rep. 2015, 5, 8259. [Google Scholar] [CrossRef] [Green Version]
- Grabherr, M.; Mauceli, E.; Ma, L.-J. Genome Sequencing and Assembly. Adv. Struct. Saf. Stud. 2011, 722, 1–9. [Google Scholar]
- Davidson, N.; Oshlack, A. Corset: Enabling differential gene expression analysis for. Genome Boil. 2014, 15, 410. [Google Scholar] [CrossRef] [Green Version]
- I Love, M.; Huber, W.; Anders, S. Moderated estimation of fold change and dispersion for RNA-seq data with DESeq2. Genome Biol. 2014, 15, 002832. [Google Scholar] [CrossRef] [PubMed] [Green Version]
- Jin, J.; He, K.; Tang, X.; Li, Z.; Lv, L.; Zhao, Y.; Luo, J.; Gao, G. An Arabidopsis Transcriptional Regulatory Map Reveals Distinct Functional and Evolutionary Features of Novel Transcription Factors. Mol. Boil. Evol. 2015, 32, 1767–1773. [Google Scholar] [CrossRef] [PubMed] [Green Version]
- Pfaffl, M. A new mathematical model for relative quantification in real-time RT-PCR. Nucleic Acids Res. 2001, 29, 45. [Google Scholar] [CrossRef] [PubMed]
- Goldberg, R.B.; Beals, T.P.; Sanders, P.M. Anther development: Basic principles and practical applications. Plant Cell 1993, 5, 1217–1229. [Google Scholar] [CrossRef] [PubMed] [Green Version]
- Trapalis, M.; Li, S.F.; Parish, R.W. The Arabidopsis GASA10 gene encodes a cell wall protein strongly expressed in developing anthers and seeds. Plant Sci. 2017, 260, 71–79. [Google Scholar] [CrossRef]
- Wu, H.-M.; Cheung, A.Y. Programmed cell death in plant reproduction. Plant Mol. Boil. 2000, 44, 267–281. [Google Scholar] [CrossRef] [PubMed]
- Song, L.; Zhou, Z.; Tang, S.; Zhang, Z.; Xia, S.; Qin, M.; Li, B.; Wen, J.; Yi, B.; Shen, J.; et al. Ectopic Expression ofBnaC.CP20.1Results in Premature Tapetal Programmed Cell Death in Arabidopsis. Plant Cell Physiol. 2016, 57, 1972–1984. [Google Scholar] [CrossRef] [PubMed]
- Browne, R.; Iacuone, S.; Li, S.F.; Dolferus, R.; Parish, R.W. Anther Morphological Development and Stage Determination in Triticum aestivum. Front. Plant Sci. 2018, 9, 228. [Google Scholar] [CrossRef] [PubMed] [Green Version]
- Zhou, J.M.; Sun, L.F.; Feng, Y.; Lian, C.; Hong, R.; Zhang, Y.; Guo, Q.R. Observation on anther development of Phyllostachys edulis. Guihaia 2016, 36, 231–235. [Google Scholar] [CrossRef]
- Lou, Y.; Zhou, H.; Han, Y.; Zeng, Q.; Zhu, J.; Yang, Z.-N. Positive regulation of AMS by TDF1 and the formation of a TDF1-AMS complex are required for anther development in Arabidopsis thaliana. New Phytol. 2017, 217, 378–391. [Google Scholar] [CrossRef] [Green Version]
- Lee, S.J.; Lee, B.H.; Jung, J.H.; Park, S.K.; Song, J.T.; Kim, J.H. GROWTH-REGULATING FACTOR and GRF-INTERACTING FACTOR Specify Meristematic Cells of Gynoecia and Anthers. Plant Physiol. 2017, 176, 717–729. [Google Scholar] [CrossRef] [Green Version]
- Xu, Y.; Liu, S.; Ling, S.; Chen, C.; Yao, J. HOTHEAD-Like HTH1 is Involved in Anther Cutin Biosynthesis and is Required for Pollen Fertility in Rice. Plant Cell Physiol. 2017, 58, 1238–1248. [Google Scholar] [CrossRef] [Green Version]
- Ono, S.; Liu, H.; Tsuda, K.; Fukai, E.; Tanaka, K.; Sasaki, T.; Nonomura, K.-I. EAT1 transcription factor, a non-cell-autonomous regulator of pollen production, activates meiotic small RNA biogenesis in rice anther tapetum. PLoS Genet. 2018, 14, e1007238. [Google Scholar] [CrossRef]
- Mao, J.J.; Wang, Q.; Shi, S.J.; Zhang, G.; Xu, D.Z.; Li, S.G.; Liu, H.B. Cloning and functional analysis of NsylCBL10 promoter in Nicotiana sylvestris. Acta Tab. Sin. 2017, 23, 97–105, 120. [Google Scholar] [CrossRef]
- Dickinson, H.G.; Bell, P.R. The Changes in the Tapetum of Pinus banksiana Accompanying Formation and Maturation of the Pollen. Ann. Bot. 1976, 40, 1101–1109. [Google Scholar] [CrossRef]
- Yue, Y.; Tian, S.; Wang, Y.; Ma, H.; Liu, S.; Wang, Y.; Hu, H. Transcriptomic and GC-MS Metabolomic Analyses Reveal the Sink Strength Changes during Petunia Anther Development. Int. J. Mol. Sci. 2018, 19, 955. [Google Scholar] [CrossRef] [PubMed] [Green Version]
- Stasolla, C.; Katahira, R.; Thorpe, T.A.; Ashihara, H. Purine and pyrimidine nucleotide metabolism in higher plants. J. Plant Physiol. 2003, 160, 1271–1295. [Google Scholar] [CrossRef] [PubMed]
- Nguyen, T.D.; Moon, S.; Nguyen, V.N.T.; Gho, Y.; Chandran, A.K.N.; Soh, M.-S.; Song, J.T.; An, G.; Oh, S.A.; Park, S.K.; et al. Genome-wide identification and analysis of rice genes preferentially expressed in pollen at an early developmental stage. Plant Mol. Boil. 2016, 92, 71–88. [Google Scholar] [CrossRef] [PubMed]
- Huang, X.-Y.; Niu, J.; Sun, M.-X.; Zhu, J.; Gao, J.-F.; Yang, J.; Zhou, Q.; Yang, Z.-N. CYCLIN-DEPENDENT KINASE G1 is associated with the spliceosome to regulate CALLOSE SYNTHASE5 splicing and pollen wall formation in Arabidopsis. Plant Cell 2013, 25, 637–648. [Google Scholar] [CrossRef] [Green Version]
- Krogan, N.T.; Hogan, K.; Long, J.A. APETALA2 negatively regulates multiple floral organ identity genes in Arabidopsis by recruiting the co-repressor TOPLESS and the histone deacetylase HDA19. Development 2012, 139, 4180–4190. [Google Scholar] [CrossRef] [Green Version]
- Kunst, L.; Klenz, J.E.; Martinez-Zapater, J.; Haughn, G.W. AP2 Gene Determines the Identity of Perianth Organs in Flowers of Arabidopsis thaliana. Plant Cell 1989, 1, 1195–1208. [Google Scholar] [CrossRef]
- Dou, L.; Zhang, X.; Pang, C.; Song, M.; Wei, H.; Fan, S.; Yu, J. Genome-wide analysis of the WRKY gene family in cotton. Mol. Genet. Genom. 2014, 289, 1103–1121. [Google Scholar] [CrossRef]
- Ma, J.; Wei, H.; Liu, J.; Song, M.; Pang, C.; Wang, L.; Zhang, W.; Fan, S.; Yu, J. Selection and Characterization of a Novel Photoperiod-Sensitive Male Sterile Line in Upland Cotton. J. Integr. Plant Boil. 2013, 55, 608–618. [Google Scholar] [CrossRef] [Green Version]
- Murmu, J.; Bush, M.J.; Delong, C.; Li, S.; Xu, M.; Khan, M.; Malcolmson, C.; Fobert, P.R.; Zachgo, S.; Hepworth, S.R. Arabidopsis basic leucine-zipper transcription factors TGA9 and TGA10 interact with floral glutaredoxins ROXY1 and ROXY2 and are redundantly required for anther development. Plant Physiol. 2010, 154, 1492–1504. [Google Scholar] [CrossRef] [Green Version]
- Tiwari, S.; Spielman, M.; Schulz, R.; Oakey, R.; Kelsey, G.; Salazar, A.; Zhang, K.; Pennell, R.; Scott, R.J. Transcriptional profiles underlying parent-of-origin effects in seeds of Arabidopsis thaliana. BMC Plant Boil. 2010, 10, 72. [Google Scholar] [CrossRef] [Green Version]
- Walia, H.; Josefsson, C.; Dilkes, B.P.; Kirkbride, R.; Harada, J.; Comai, L. Dosage-dependent deregulation of an AGAMOUS-LIKE gene cluster contributes to interspecific incompatibility. Curr. Boil. 2009, 19, 1128–1132. [Google Scholar] [CrossRef] [PubMed] [Green Version]
- Day, R.C.; Herridge, R.P.; Ambrose, B.A.; Macknight, R. Transcriptome Analysis of Proliferating Arabidopsis Endosperm Reveals Biological Implications for the Control of Syncytial Division, Cytokinin Signaling, and Gene Expression Regulation[C][W][OA]. Plant Physiol. 2008, 148, 1964–1984. [Google Scholar] [CrossRef] [Green Version]
- Portereiko, M.F.; Lloyd, A.; Steffen, J.G.; Punwani, J.A.; Otsuga, D.; Drews, G.N. AGL80 Is Required for Central Cell and Endosperm Development in Arabidopsis[W]. Plant Cell 2006, 18, 1862–1872. [Google Scholar] [CrossRef] [PubMed] [Green Version]
- Masiero, S.; Colombo, L.; Grini, P.; Schnittger, A.; Kater, M. The Emerging Importance of Type I MADS Box Transcription Factors for Plant Reproduction. Plant Cell 2011, 23, 865–872. [Google Scholar] [CrossRef] [PubMed] [Green Version]
- Colombo, M.; Masiero, S.; Vanzulli, S.; Lardelli, P.; Kater, M.; Colombo, L. AGL23, a type I MADS-box gene that controls female gametophyte and embryo development in Arabidopsis. Plant J. 2008, 54, 1037–1048. [Google Scholar] [CrossRef] [PubMed]
- Kapoor, S.; Kobayashi, A.; Takatsuji, H. Silencing of the Tapetum-Specific Zinc Finger Gene TAZ1 Causes Premature Degeneration of Tapetum and Pollen Abortion in Petunia. Plant Cell 2002, 14, 2353–2367. [Google Scholar] [CrossRef] [PubMed] [Green Version]
- Ito, T.; Sakai, H.; Meyerowitz, E.M. Whorl-Specific Expression of the SUPERMAN Gene of Arabidopsis Is Mediated by cis Elements in the Transcribed Region. Curr. Boil. 2003, 13, 1524–1530. [Google Scholar] [CrossRef] [Green Version]
- Higginson, T.; Li, S.F.; Parish, R.W. AtMYB103 regulates tapetum and trichome development in Arabidopsis thaliana. Plant J. 2003, 35, 177–192. [Google Scholar] [CrossRef]


| Morphological Characteristics of Flower | Anther Stage | Development Stage of Anther | Development Characteristics of Anther Wall and Pollen |
|---|---|---|---|
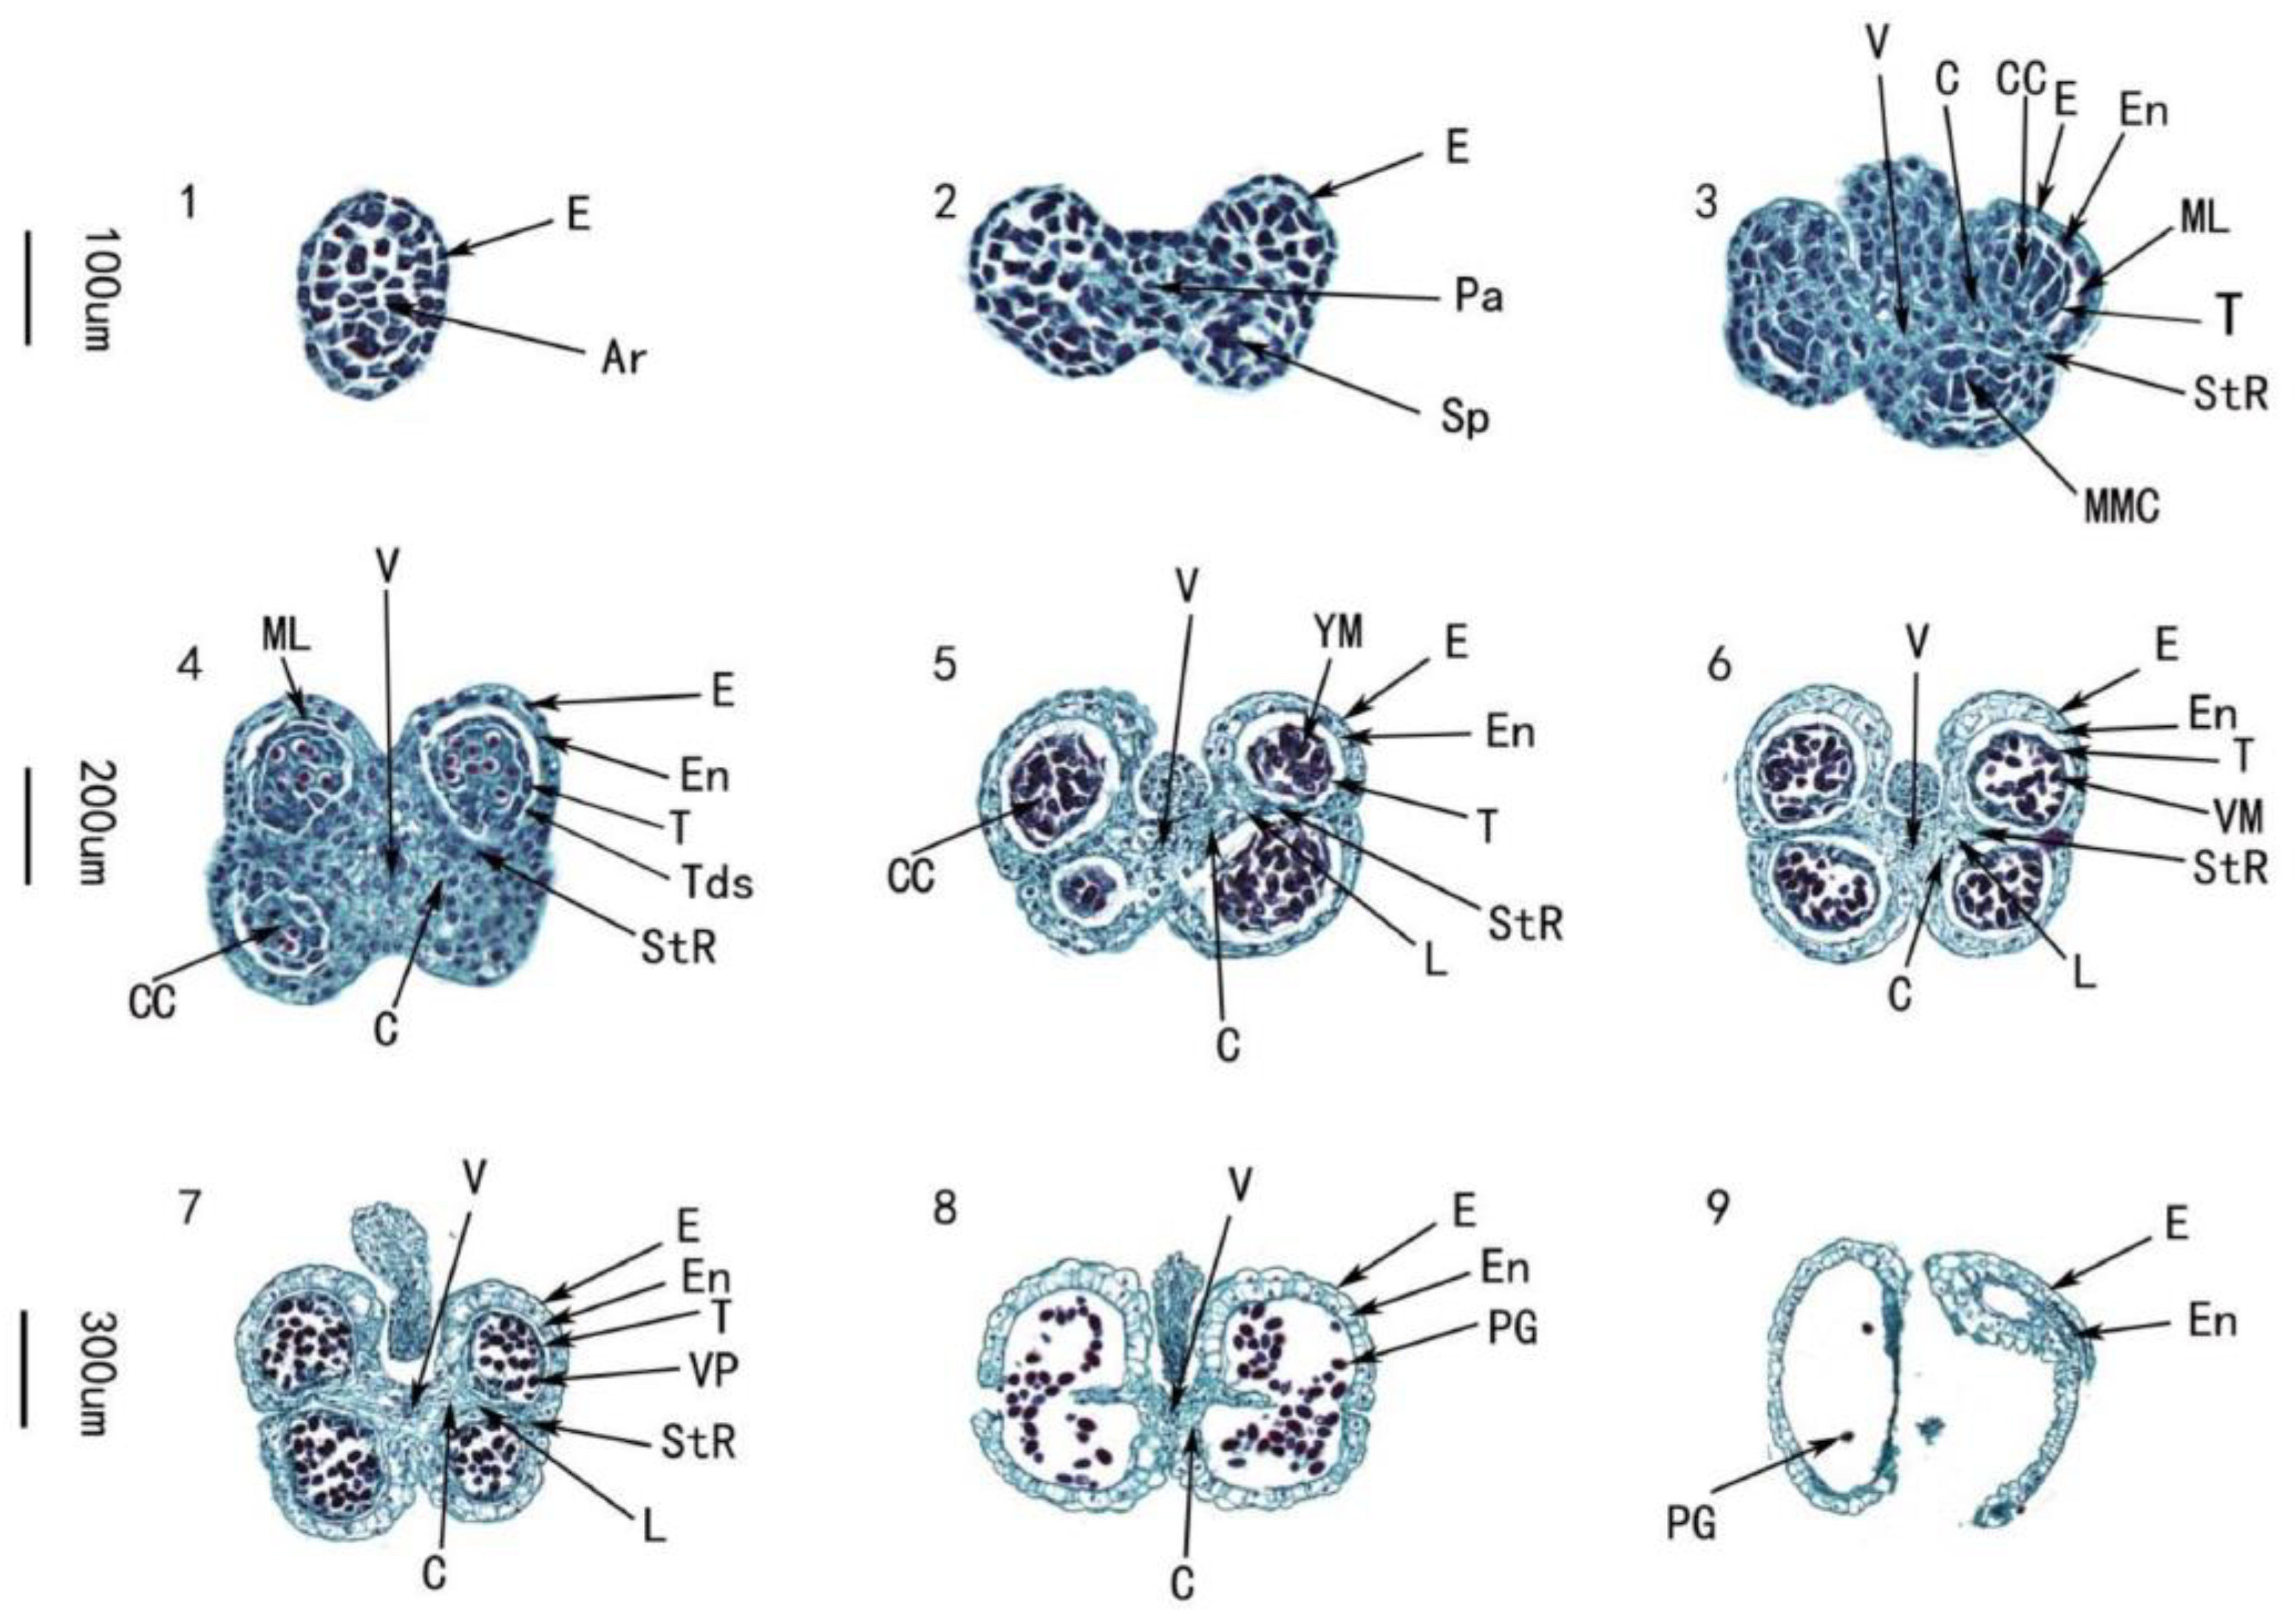
| The buds are tender yellow and uncracked. The length of the petals is 0.05–0.1 mm | 1 | Archesporial stage | The shape of the anther was oval, and the epidermis has formed. |
| The buds are tender yellow and uncracked. The length of the petals is 0.07–0.1 mm | 2 | Sporogenous cell stage | The anther epidermis gradually differentiated into 4 anther chambers, the archesporial cells differentiated into primary parietal cells and primary sporophytic cells. |
| The buds are yellow-green and uncracked. The length of the petals is 0.13–0.16 mm | 3 | Microspore mother cell stage | From the surface layer of the anther, the tapetum, middle layer, fiber layer, and epidermis can be clearly seen from the inside to the outside. As the microspore mother cell develops, thick callose wall on the surface of the cell continued to thicken and the original cellulose wall gradually degraded. |
| The buds are turquoise and uncracked. The length of the petals is 0.17–0.20 mm | 4 | Dyad and tetrad stage | Microspore mother cells underwent meiosis to form dyads and tetrads. The middle cells were squeezed by the tapetum and outer layers and gradually disappeared. The tapetum cells were the largest and most active. |
| The buds are pale green and uncracked. The length of the petals is 0.18–0.20 mm | 5 | Mononuclear microspore stage | The callose wall around the tetrad degraded, and the microspores are freed out and their nucleus is centered with their nuclei centered. The middle layer cells were almost absent. |
| The buds are pale green and uncracked. The length of the petals is 0.20–0.22 mm | 6 | Late uninucleate microspores stage | The vacuoles in the microspore cells gradually increased to form larger vacuoles which pushed the nucleus to the edge of the cell. The tapetum gradually disintegrated. |
| The buds are half-cracked, the petals are pale white and the length is 0.22–0.25 mm | 7 | Binuclear cell stage | The nucleus on the side divided into two nuclei by mitosis and formed two daughter cells of different sizes. The larger cells were vegetative cells and the smaller germ cells. The tapetum continued to decompose and this was the peak of tapetum decomposition. |
| The bud is fully open, the petals are white and the length is 0.27–0.29 mm | 8 | Mature pollen stage | The germ cells of the microspore formed a trinuclear pollen containing one vegetative cell and two sperm cells through mitosis. The space between the upper and lower chambers deteriorates, forming two chambers. The tapetum was very small or disappears completely. |
| The bud is fully open, the petals are white and the length is 0.27–0.29 mm | 9 | Dehiscence stage | The epidermal cells in the stomata area degenerated and the cells opened causing mature pollen grains to be released. |
| Length | Transcript | Unigene | ||
|---|---|---|---|---|
| Number | Percentage | Number | Percentage | |
| 300 bp–500 bp | 41,825 | 24.16% | 26,560 | 32.30% |
| 500 bp–1000 bp | 43,695 | 25.24% | 23,665 | 28.78% |
| 1000 bp–2000 bp | 52,309 | 30.22% | 19,301 | 23.47% |
| >2000 bp | 35,265 | 20.37% | 12,699 | 15.44% |
| Total | 173,094 | 82,225 | ||
| Min length (bp) | 301 | 301 | ||
| Mean length (bp) | 1309 | 1117 | ||
| Median length (bp) | 1016 | 736 | ||
| Max length (bp) | 11,982 | 11,982 | ||
| N50 (bp) | 1864 | 1679 | ||
© 2020 by the authors. Licensee MDPI, Basel, Switzerland. This article is an open access article distributed under the terms and conditions of the Creative Commons Attribution (CC BY) license (http://creativecommons.org/licenses/by/4.0/).
Share and Cite
Li, M.; Tan, S.; Tan, G.; Luo, Y.; Sun, B.; Zhang, Y.; Chen, Q.; Wang, Y.; Zhang, F.; Zhang, Y.; et al. Transcriptome Analysis Reveals Important Transcription Factor Families and Reproductive Biological Processes of Flower Development in Celery (Apium graveolens L.). Agronomy 2020, 10, 653. https://doi.org/10.3390/agronomy10050653
Li M, Tan S, Tan G, Luo Y, Sun B, Zhang Y, Chen Q, Wang Y, Zhang F, Zhang Y, et al. Transcriptome Analysis Reveals Important Transcription Factor Families and Reproductive Biological Processes of Flower Development in Celery (Apium graveolens L.). Agronomy. 2020; 10(5):653. https://doi.org/10.3390/agronomy10050653
Chicago/Turabian StyleLi, Mengyao, Shanshan Tan, Guofei Tan, Ya Luo, Bo Sun, Yong Zhang, Qing Chen, Yan Wang, Fen Zhang, Yunting Zhang, and et al. 2020. "Transcriptome Analysis Reveals Important Transcription Factor Families and Reproductive Biological Processes of Flower Development in Celery (Apium graveolens L.)" Agronomy 10, no. 5: 653. https://doi.org/10.3390/agronomy10050653