Article

Genetic Analysis of Leaf Traits in Small-Flower Chrysanthemum (Chrysanthemum × morifolium Ramat.)

1
National Engineering Research Center for Floriculture, Beijing Advanced Innovation Center for Tree Breeding by Molecular Design, Beijing Key Laboratory of Ornamental Plants Germplasm Innovation & Molecular Breeding, Beijing Laboratory of Urban and Rural Ecological Environment, College of Landscape Architecture, Beijing Forestry University, Beijing 100083, China
2
College of Landscape Architecture and Forestry, Qingdao Agricultural University, Qingdao 266109, China
*
Author to whom correspondence should be addressed.
These authors contributed equally.
Agronomy 2020, 10(5), 697; https://doi.org/10.3390/agronomy10050697
Submission received: 21 April 2020 / Revised: 11 May 2020 / Accepted: 11 May 2020 / Published: 13 May 2020

Abstract

:
Leaf shape is an important quality trait of agronomic crops, and to control the law of genetic variation of leaf shape is of practical significance for improving the early identification and selection of agronomic crops. Variations in the leaf morphology of chrysanthemum cultivars are abundant, and previous studies have quantitatively defined and classified the leaf morphology of chrysanthemum; however, the genetic architecture of chrysanthemum leaves has not been elucidated to date. In this study, two pairs of F1 hybrid populations were constructed by using small-flower chrysanthemum varieties with differences in leaf traits, and the genetic variation rules of these important quantitative traits were further discussed based on the major gene and polygene mixed inheritance analyses. The results showed that the leaves in blade shape (LBS), leaf length/width is controlled by two pairs of additive-dominant major genes (B-1), the widest part length/leaf length is controlled by two completely dominant genes (B-5); in leaf lobe shape (LLS), the lobe length/vein length is controlled by one pair of additive dominant major genes (A-1); and the lobe length/lobe width is controlled by two pairs of additive dominant major genes (B-2). The heritability of major genes was greater than 30%. For the leaf petiole shape (LPS), the petiole length is controlled by a pair of additive-dominant major genes (A-1). The results showed that the leaf traits were mainly controlled by genetic factors. In addition, based on the high-density genetic map of one F1 hybrid population, it was found that 51 quantitative trait loci (QTL) were used to control the leaf traits, including two QTLs that controlled the LBS. There were 18 QTLs that controlled LLS. Moreover, the primary QTLs that controlled leaf width and lobe length were obtained. The results of this study may establish a theoretical foundation for the in-depth exploration of leaf-shape-related genes in chrysanthemum and may provide a reference for future research investigating leaf-shape genetics in other agronomic crops.

1. Introduction

Chrysanthemum (Chrysanthemum × morifolium Ramat.) is a well-known flower originating from China. This flower is an important ornamental crop worldwide with the highest output value and output, and it also plays an important role in landscaping. After spreading to all parts of the world, chrysanthemum has been widely planted and cultivated, becoming one of the most famous flowers with the most variety among ornamental plants. For flower gardening, the abundance of phenotypic variation in chrysanthemums is the highest among the world’s ornamental crops [1,2]. At present, there are three main categories of ornamental chrysanthemum cultivars in horticultural production: small-flower chrysanthemum, cut chrysanthemum and potted chrysanthemum. The small-flower chrysanthemum is a kind of open cultivation chrysanthemum cultivar group because its cultivation management is relatively simple, and it presents dense flowers, bright colors, and beautiful leaves and has become an important flower in urban landscaping. Our previous studies have found that in small-flower plants, among phenotypic traits, leaf form is one of the most abundant traits, and leaf shape can be considered an auxiliary trait of chrysanthemum cultivars, especially before anthesis or other plant cultivation characters emerge. This trait can be used for early identification of performance and is of great significance for chrysanthemum seedling production. The study of the genetic architecture of leaf morphological characteristics of small-flower chrysanthemum can provide help for the early identification of seedlings in production and has important reference value for the genetic study of leaf morphological variation in other plants.
Leaves are important vegetative organs of plants. Through the study of leaf phenotype, genetic variation and heterosis, early identification and preselection can be performed [3,4,5,6]. At the same time, leaf morphology is an important factor affecting the ornamental quality, growth and development of plants. Changes in leaf shape will affect the photosynthetic capacity of plants and then affect the nutrient biomass and sugar content, and they also have an impact on the cultivation quality of plants [7]. The basic shape of leaf often shows morphological diversity due to the morphological differences in overall leaf shape, leaf margin, leaf base, leaf tip, leaf lobe and leaf veins distribution. Although the leaves are affected by environmental conditions and other variations, each species has its relatively stable leaf characteristics, which is the basis for cultivar identification and determining the range and genetic architecture of variation [8,9,10,11,12,13,14,15], especially in closely related taxa. Thus, the accurate identification of leaf morphology and its genetic architecture are of great significance for cultivar identification and breed selection [16,17,18,19,20,21,22]. The morphological variation of leaves under species of compositae is highly abundant with a variety of leaf morphological variations, such as oblong ovate, ovoid, rhomboid, and spatulate [23,24,25]. Therefore, the morphological characteristics of leaves are among the important bases for the accurate identification of compositae. As the leaves of chrysanthemum cultivars have abundant morphological variations [26], leaf shape is often regarded as an important character in the identification of chrysanthemum varieties. Li [27] found that leaf characters are an important index for evaluating the characteristics in the breeding of new chrysanthemum varieties. Wang et al. [28] analyzed 40 chrysanthemum varieties with 20 leaf morphological traits and found that identifying chrysanthemum varieties with the help of leaves could significantly improve the identification efficiency for conducting early identification and reducing identification costs. The leaf traits of chrysanthemum have a high variety specificity and are not completely related to the floral features, which provides a new variety identification feature for chrysanthemum variety identification and early selection, and it is completely feasible to make use of the morphological characteristics of chrysanthemum leaves for variety identification [29]. Chrysanthemum has rich diversity of leaves, although the definition and classification of the leaves of Chinese traditional chrysanthemum were studied by predecessors based on their experience. For example, the cultivars population blade can be divided into straight leaf, deep cracked straight leaf, long leaf, long deep cracked leaves, round leaves, reverse leaves and serrate leaves [30]. Song et al. [31] observed and defined 37 leaf morphological traits of 436 Chinese traditional chrysanthemum varieties, including the basic leaf morphology, leaf base, leaf margin, leaf lobes and petiole and quantitatively classified the leaf morphology of 436 Chinese traditional chrysanthemum varieties by means of probability classification and multivariate statistical analysis. These studies have established a foundation for the genetic analysis of leaf traits in chrysanthemum cultivars. On this basis, the present study explored the genetic variation and heterosis of leaf shape in small-flower chrysanthemum to provide an important basis for early selection of superior hybrid offspring and a reference for the genetic study of leaf shape variation in other plants.
At present, the methods of plant genetic architecture analysis mainly include the genetic analysis of hybrid populations based on target traits and quantitative trait loci (QTL) analysis based on high-density genetic map. The quantitative trait genetic analysis method is currently one of the most popular ways to analyze plant phenotypic traits. Quantitative traits are the main trait type in plant genetic research because they generally present a continuous distribution. Moreover, generations cannot be directly separated based on the parents’ phenotype classification. Genetic research of quantitative traits of plants is based on the theory of multiplicity of microeffects, which was first developed on the basis of the multiplicity hypothesis. The genes controlling quantitative traits are called microeffect genes [32], and these microeffect genes also follow the Mendelian genetic rule for generations [33]. Since the genes controlling the inheritance of quantitative traits have great differences in effect, there may be major genes, which may be controlled by multiple genes, or both; therefore, the hybrid genetic regulation mode of major genes and multiple genes is shown. This genetic pattern was first widely used in humans and animals. In 1973, Elston and Stewart [34] proposed the genetic model of major genes and polygenes or minor genes for quantitative traits in genetic analyses of human pedigree data. Later, this model was further improved by Morton and MacLean, which was called the Mixed model [35]. The single gene–polygene genetic model for quantitative trait genetic analysis was developed by Elkind and Cahaner [36]. Mo et al. [37,38], Loisel et al. [39] and Jiang et al. [40] proposed some improved methods for this model and took the inheritance of plant height traits in barley and rice as an example for verification [41]. Gai et al. [33] systematically studied the major gene and polygene inheritance of quantitative traits and formed a relatively complete system, which was called the separation analysis method of the major gene and polygene mixed inheritance model of plant quantitative traits inheritance system. In subsequent years, this method has been widely used in the genetic study of quantitative traits of plants, and it has greatly promoted the genetic analysis of agronomic traits and the improvement of crop quality traits. In chrysanthemums, many quantitative traits conform to the major gene and multigene genetic model. Zhang et al. [42,43,44] and Xu et al. [45] used the above method through the hybrid model of major genes and multigenes for plant quantitative traits, and the genetic rules of traits, flowering period and salt tolerance of cultivated chrysanthemum were analyzed; it was found that the studied traits all conformed to the genetic model of major genes and multigenes. Peng et al. [46] analyzed the branching traits of chrysanthemum in cut flowers and found that the major gene and polygene genetic effect also existed in the branching traits. Tang et al. [47] used the same method and carried out mixed genetic analyses on the characteristics of anemone-type chrysanthemum floral organs and reached the same conclusion. Song et al. [48] used the hybrid genetic analysis method to conduct genetic analyses on the morphology of the ray flower in chrysanthemum, and the results showed that the heredity of the degree of union at the base of the ray flower was controlled by two pairs of additive-dominant major genes while the relative number of ray flowers was controlled by two pairs of additive-dominant major genes.
The genetic patterns and effects of quantitative traits can be determined by genetic analyses, but the key genes cannot be accurately located. In addition to plant quantitative trait hybrid genetic analysis, high-density genetic linkage mapping on the basis of quantitative trait loci analysis and plant complex quantitative trait genetic gene location are important methods of parsing genetic information and of great significance for quantitative trait localization and genetic improvement of plants [49,50,51,52]. Since Paterson et al. [53] first used RFLP markers for QTL mapping in tomatoes, a large number of QTL studies have been reported on the control of important agronomic traits. In-depth research of certain crops, such as wheat, rice and maize, has focused on QTL analyses of yield, quality, disease resistance and other relevant important traits [54,55,56,57]. Rice is one of the plants with the largest numbers of localized QTLs, with over 8000 being reported (Gramene database, http://www.gramene.org), and some controlled yields have been cloned based on QTL analysis [58,59] and flowering period [60,61,62], which strongly promoted the genetic improvement of rice. In ornamental plants, QTL analysis was mainly focused on ornamental traits, including floral traits, such as petal number, flower color and corolla tube length, as well as some important traits related to leaf traits and disease resistance. In 1999, the first QTL analysis of Chinese rose was carried out, and the QTL sites controlling the number of petals and flower color and other related traits were found [63]. Subsequently, a QTL analysis was carried out on several quantitative traits of Chinese rose, such as flowering period, inflorescence and other related traits, which established a foundation for further gene cloning in Chinese rose. Important QTLs in other species, such as alstroemeria and petunia, have been found for quantitative traits, such as flower diameter, corolla tube length, petal length and width, flower sparsity and stamen length. In chrysanthemum, on the basis of the genetic map of chrysanthemum, predecessors found some QTLs, such as for flower diameter, heart diameter, number of ray flowers, number of tubular flowers, length of ray flowers, width of ray flowers, length of tubular flowers, width of tubular flowers, flower color, flowering period and greenness of disc flowers [64,65,66]. Song et al. [31] used the high-density genetic map of chrysanthemum to analyze the QTL of floral traits and preliminarily located the QTLs of the corolla tube merged degree and the relative number of ray flowers. However, QTL analyses have not been performed for chrysanthemum leaf traits; therefore, the genetic rules of these traits cannot be determined. Using the existing high-density genetic map, further QTL analysis of leaf traits will establish a foundation for research on molecular marker-assisted selection of chrysanthemum leaf shape, gene mapping, cloning and comparative genomics.
In this study, based on the established quantitative definition and classification system of leaf morphology of chrysanthemum varieties, genetic analyses and QTL mapping were used to analyze the leaf traits of chrysanthemum. The F1 population was constructed by sexual hybridization, and a genetic analysis was carried out on this population to identify its genetic model and genetic effect of genes. A QTL analysis of leaf morphology was conducted by means of the high-density genetic map. Subsequently, the genetic mechanism of leaf shape was discussed, which provided an important reference for the in-depth exploration of leaf-shape-related genes in chrysanthemum and provided references for the study of leaf-shape genetics in other agronomic crops.

2. Materials and Methods

2.1. Plant Material

In this study, two groups of small-flower chrysanthemum cultivars with leaf morphological differences were found in the chrysanthemum germplasm resource nursery of Beijing Forestry University, Beijing, China. According to the results, a sexual hybridization test was designed in 2014. In cross I, the female parent “388q-76” was obovate with the medium cracked type, and the male parent “Hong chi” was ovate with the deep cracked type; 142 hybrid offspring were obtained. In cross II, the female parent “Candy” was broad ovate with the medium cracked type, and the male parent “225” was long ovate with the shallow cracked type (Figure 1); 319 strains of hybrid offspring were obtained [31]. “388q-76”, “Hong chi” and “225” were from Dadongliu nursery in Beijing, China, and ‘Candy” was from Brandkamp, Germany. Two consecutive years of asexual culture were observed. In early April, healthy, disease-free, 7–8 cm cuttage was cut from the female parent and planted in the nutrition pot in a mixed matrix of peat and perlite (volume ratio: 3:1), and 25 days later, the rooting seedlings were taken into the basin (diameter: 21 cm). Proper water and fertilizer control and pest control were performed throughout the growing season.

2.2. Phenotyping

Leaf characters of parents and F1 population were observed during flowering in autumn of 2015 and 2016. The tested traits are shown in Table 1. The specific measurement method refers to the quantitative definition and classification system of leaf morphology of Chinese traditional varieties [31]. Three individuals in good growth condition were selected for each strain, leaves from the top to the bottom 1/3 of the stem were collected uniformly during the flowering period, and three leaves were selected for each strain for measurement.

2.3. Statistical Analysis and Heterosis Analysis

The maximum value, mean value, standard deviation and coefficient of variation (C.V.%) of each character in 2.2 were calculated. The specificity and consistency of different characters in different lines were discussed based on two-factor analysis of variance. The heterosis of leaf traits was measured by the mid-parent heterosis, the ratio of mid-parent heterosis and the ratio of heterobeltiosis, among which the mid-parent heterosis (Hm) was the difference between the average of F1 offspring and the average of parents, and the average of parents was the middle parent’s value (MPV). Heterobeltiosis (Hb) is the difference between the average and optimal parental phenotype values. The formula is as follows: mid-parent heterosis:
Hm = F1 − (P1 + P2)/2
ratio of mid-parent heterosis:
RHm = (F1 − MP)/MP × 100%
heterobeltiosis: ratio of heterobeltiosis:
Hb = F1 − HP
RHb% = (F1 − HP)/HP × 100%
MP is the pro-median value; HP is a high-value parental phenotype value [48]. The above data analysis was calculated using Microsoft EXCEL 2010 and IBM SPSS Statistics 20.0 software [48].

2.4. Mixed Inheritance Analyses and QTL Analyses

The F1 chrysanthemum population was considered a pseudo-F2 population for genetic analysis in accordance with the double-pseudo-testcross strategy. A single-generation segregation analysis as described by Gai et al. [33] was used to analyze the mixed inheritance model of chrysanthemum leaf traits, including major gene model, polygene model and mixed model. This analysis method divided the phenotypic traits of parents and F1 into different distribution intervals and counted the distribution times in each interval. The above distribution data were matched with the different models [33]. A total of 11 kinds of genetic models were used to analyze the chrysanthemum F1 leaf morphological data and calculate the various properties of genetic parameter values, and then according to the AIC value (Akaike information criterion) minimum standards (the AIC value is the smallest genetic model as an alternative model). The selected model was then evaluated by a goodness-of-fit test based on 5 statistical parameters, including Uniformity tests (U12, U22, U32), Smirnov’s statistics (nW2) and Kolmogorov’s statistics (Dn). After the parameters corresponding to the optimal genetic model are determined, major gene variance, phenotypic variance and other relevant parameters can be further estimated through the least square method of distributed parameters [33]. Finally, the major gene heritability h2mg = σ2mg2p2mg means major gene variance, σ2p means phenotypic variance) were calculated. The analysis software (SEgregation Analysis [SEA]) was provided by Professor Yuan-ming Zhang, National Key Laboratory of Crop Genetics and Germplasm Enhancement, Soybean Research Institute, Nanjing Agricultural University, Nanjing, China. In this study, QTL was studied based on the existing high-density genetic map of cross I. Using specific-locus amplified fragment sequencing (SLAF-seq) technology, we previously constructed a high-density genetic linkage map with an average map distance of 0.76 cM [31]. Using MapQTL® 6 software (https://www.kyazma.nl/index.php/MapQTL) [67], a QTL analysis was carried out on the leaf quantitative traits of cross I. The specific analysis is as follows: first, the LOD threshold of significance (p < 0.05) was selected through the PT (permutation test) test for 1000 tests. The LOD threshold of significance (p < 0.05) was not reached for some traits, and the LOD was manually reduced to 3.0 for analysis. Interval mapping (IM) was used to scan QTLS on each chain group at intervals of 1 cM and calculate the contribution rate.

3. Results

3.1. Statistical Analysis of Leaf Characters of Hybrid Offspring

All leaf traits exhibited highly significant differences between F1 strains, indicating that leaf morphological traits demonstrated significant genetic segregation. For eight traits (LBS, WLL, LPS, LLW-RUL, LCD-RUL, LLW-RLL, LCD-RLL and LLS-RLL), differences within F1 strains were non-significant (p > 0.05), indicating that the environment has minimal influence on these traits. For nine other leaf traits (LBL, LBW, LWL, LPL, LVL-RUL, LLL-RUL, LLS-RUL, LVL-RLL and LLL-RLL), differences within F1 strains were significant indicating that environment had a stronger influence on these traits (Table 2). The analysis of the coefficient of variation showed that these quantitative traits were clearly separated in hybrid offspring, and the coefficient of variation ranged from 12.99% to 62.39%. The variation coefficient of the WLL was the smallest (12.99%) followed by LPL and LPS. The variation coefficients of six leaf traits, namely, LLL-RLL, LLL-RUL, LLS-RLL, LLW-RLL, LVL-RLL and LCD-RLL, were all greater than 40%. The largest to the smallest variation coefficients belonged to the following seven leaf-shape structural parameters as follows: LLS-RLL, LCD-RLL, LLS-RUL, LCD-RUL, LBS, LPS, WLL. It can be seen that the LLS (leaf lobe shape) of cultivated chrysanthemum is abundant and the variation degree of RLL (right lower lobe) is higher than that of RUL (right upper lobe). Therefore, the RLL was used to represent the LLS (leaf lobe shape) in the subsequent analysis, and the 17 quantitative traits were simplified to 12 quantitative traits for analysis.

3.2. Classification of Leaf Morphology of Hybrid Offspring

The classification of the leaf morphology of the hybrid offspring was based on the Chinese traditional large chrysanthemum leaf shape classification standard [31], and the results showed that the leaf basic shape can be divided into four types: broad ovate, ovate, obovate and long ovate, with ovate leaves exhibiting the greatest distribution followed by long ovate, broad ovate and obovate. The results are consistent with those of the Chinese traditional large chrysanthemum classification [31]. Leaf lobes can be divided into four types: shallow with wide lobes, medium with wide lobes, deep with wide lobes and deep with narrow lobes. The distribution of medium with wide lobes was the highest, and the distribution of deep with wide lobes and deep with narrow lobes was the lowest (Figure 2). Petioles can be divided into short petioles (2.58%), medium petioles (68.17%) and long petioles (29.25%).

3.3. Heterosis of Chrysanthemum Leaf Characters

The groups in Table 3 show that in the cross I F1, for the LBL, LBW, LWL, WLL, LPL, LPS, LLL-RLL, LCD-RLL and LLS-RLL, the ratio of mid-parent heterosis in RHm% is greater than 0, thereby showing a positive advantage; however, the LBS, LVL-RLL and LLW-RLL showed negative dominance, and the RHm% was less than 0, indicating that there was a dominant genetic effect in the heterosis of these three leaf traits. For in the cross II F1 population, for the LBS, LWL, WLL, LPL, LPS, LCD-RLL and LLS-RLL, the mid-parent heterosis rate is positive, thereby showing a positive advantage; however, for the LBL, LBW, LVL-RLL, LLL-RLL and LLW-RLL, negative dominance was observed, indicating that there was a dominant genetic effect in the heterosis of these five traits. In cross I and cross II, for the WLL, LWL, LPL, LPS, LCD-RLL, LLS-RLL, heterobeltiosis is positive; thus, these traits tend to be high-value parental phenotypes in hybrids. The phenotypic values of 12 leaf traits all exceeded (positive or negative) those of the parents, which indicated that the hybrid offspring generally showed transgressive separation; however, the average value of the 12 traits was between that of the parents, indicating that there was no transgressive advantage. At the same time, the heterosis of each character was different between the two hybrid combinations.

3.4. The Major Gene and Polygene Mixed Genetic Model for Leaf Traits

Figure 3 and Figure 4 show the separation of 12 leaf traits in two F1 populations. According to the frequency distribution diagram in the figure, the 12 traits showed good continuity of the multipeak distribution or skewed distribution. This finding further indicates that these 12 traits are in line with quantitative genetic characteristics.
By means of AIC value and fitness test for 11 genetic models of 12 leaf traits (Supplementary Table S1 and Supplementary Table S2), the optimal genetic model of these 12 leaf traits was finally determined (Table 4). The results showed that the optimal genetic models of LBL, LBW, LWL and LPS were all A-0, indicating that the inheritance of these four traits was controlled by polygenes. The optimal genetic models of LPL, LLL-RLL, LLW-RLL and LCD-RLL were all A-1, indicating that the inheritance of these four traits was controlled by a pair of additive-dominant major genes. The optimal genetic model for LBS is B-1, which is controlled by two pairs of additive-dominant-epistatic major genes. The optimal genetic model of LLS-RLL is B-2, which is controlled by two pairs of additive-dominant major genes. The genetic model of WLL and the LVL-RLL was different between the two hybrid combinations. Since the number of groups in cross II is 2 times that of cross I, the results of cross II shall prevail. The optimal genetic model for WLL was B-5, and the inheritance of this trait was controlled by 2 pairs of fully dominant major genes. The optimal genetic models of the LVL-RLL were all A-1, and the inheritance of this trait was controlled by a pair of additive–dominant major genes (Table 4).

3.5. The Estimation of Genetic Parameters of the Optimal Genetic Model for Leaf Traits

3.5.1. The Estimation of Genetic Parameters of Optimal Genetic Model of Leaf Basic Shape

In cross I, the heredity of LBS was controlled by two pairs of additive, dominant and epistatic major genes. The da and db of the two pairs of genes were 0.35, and db = da. The ha and hb of the genes were 0.17 and 0.35, respectively, and interactions between the two were determined by the gene additive effect (I), which was 0.35. Two pairs of additive and dominant genetic interactions (jab and jba) were 0.35 and 0.17, respectively, and the interactions between the two pairs of dominant effect genes (l) was 0.17. The two pairs of genes ha/da and hb/db were 0.49 and 0.99, respectively. To illustrate that the two pairs of genes were partly dominant, the major gene heritability was 40.13%. The WLL was affected by two pairs of additive-dominant-epistatic major genes. The da and db of both genes were 0.06, and db = da. The ha and hb of the genes were 0.03 and 0.02, respectively, and interactions between the two presented a gene additive effect (I) of 0.06. The two pairs of genes between the additive and dominant interactions (jab and jba) were 0.02 and 0.03, respectively, and the interactions between the two pairs of dominant effect genes (l) was 0.01. The two pairs of genes ha/da and hb/db were 0.49 and 0.32, respectively, and to illustrate that the two pairs of genes are partly dominant, the major-gene heritability was 50.50% (Supplementary Table S3, Table 5). In cross II, the LBS was controlled by two additive-dominant-epistatic genes. The two pairs of genes were all negative hyperdominant, and the heritability of the major gene was 33.75%. The WLL was controlled by two pairs of fully dominant genes. The additive effects of two pairs of major genes were 0.09 and 0.02, and the heritability of the major genes was 53.48% (Supplementary Table S3, Table 5). In summary, the heredity of the LBS was controlled by two pairs of additive-dominant-epistatic major genes, with an average heritability of 36.94%. The WLL was controlled by two pairs of complete dominant genes with an average heritability of 52.12%.

3.5.2. The Estimation of Genetic Parameters in an Optimal Genetic Model of Leaf Lobe Shape

In cross I, the LCD-RLL inheritance was controlled by one pair of additive-dominant major genes, the additive effect was 0.08, the dominant effect was −0.07, and the dominant degree (ha/da) was −1.05, indicating that the genes were negative hyperdominant and the heritability of major genes was 49.5%. The LLS-RLL inheritance was controlled by two pairs of additive-dominant major genes. The da and db of the two pairs were 0.28 and 0.23, respectively, and da > db. The ha and hb of the two pairs of genes were −0.40 and −0.13, respectively, and ha/da and hb/db were −1.41 and −0.59, respectively, indicating that the dominant genes of the first and second pairs were negative hyperdominant and negative partial dominant, respectively, and the heritability of the dominant genes was 67.74%. The LVL-RLL was greatly affected by the environment, and its inheritance may be affected by polygenes. The inheritance of LLL-RLL and LLW-RLL was controlled by two pairs of additive dominant major genes, both of which were negative hyperdominant, and the heritability of major genes were 40.39% and 56.63%, respectively (Supplementary Table S3, Table 5). In cross II, the LCD-RLL inheritance was controlled by one pair of additive-dominant major genes, the major gene was negative hyperdominant, and the major gene inheritance rate was 56.55%. The heredity of LLS-RLL was controlled by two pairs of additive-dominant major genes, the first pair and the second pair of major genes were negative hyperdominant and negative partial dominant, respectively, and the heritability of major genes was 45.70%. The heredity of the LVL-RLL, LLL-RLL and LLW-RLL were all controlled by one pair of additive dominant major genes, all of which were negative complete dominant, and the heritability of the major genes were 37.23%, 51.03% and 39.47%, respectively (Supplementary Table S3, Table 5). In summary, the LCD-RLL inheritance was controlled by one pair of additive dominant major genes, all of which were negative hyperdominant, and the average heritability of major genes was 53.03%. The heredity of LLS-RLL was controlled by two pairs of additive-dominant major genes, which were negative hyperdominant and negative partial dominant, respectively. The average heritability of major genes was 56.72%.

3.5.3. The Estimation of Genetic Parameters in an Optimal Genetic Model of Leaf Petiole Shape

In cross I, the heredity of LPL was controlled by 1one pair of additive-dominant major genes, the additive effect of the major gene was 0.35, the dominant effect was −0.34, the dominant degree (ha/da) was −0.97, the dominant gene was negative partial dominant, and the heritability of the major gene was 50.20%. In cross II, the heredity of LPL was controlled by one pair of additive-dominant major genes, with the degree of dominance of −1.00 and the dominant gene of negative partial dominance, and the heritability of the dominant gene was 34.24% (Supplementary Table S3, Table 5). In summary, the inheritance of LPL was controlled by one pair of additive-dominant major genes, the major genes were negatively dominant, and the average heritability of the major genes was 42.22%.

3.6. QTL Analysis of Leaf Traits

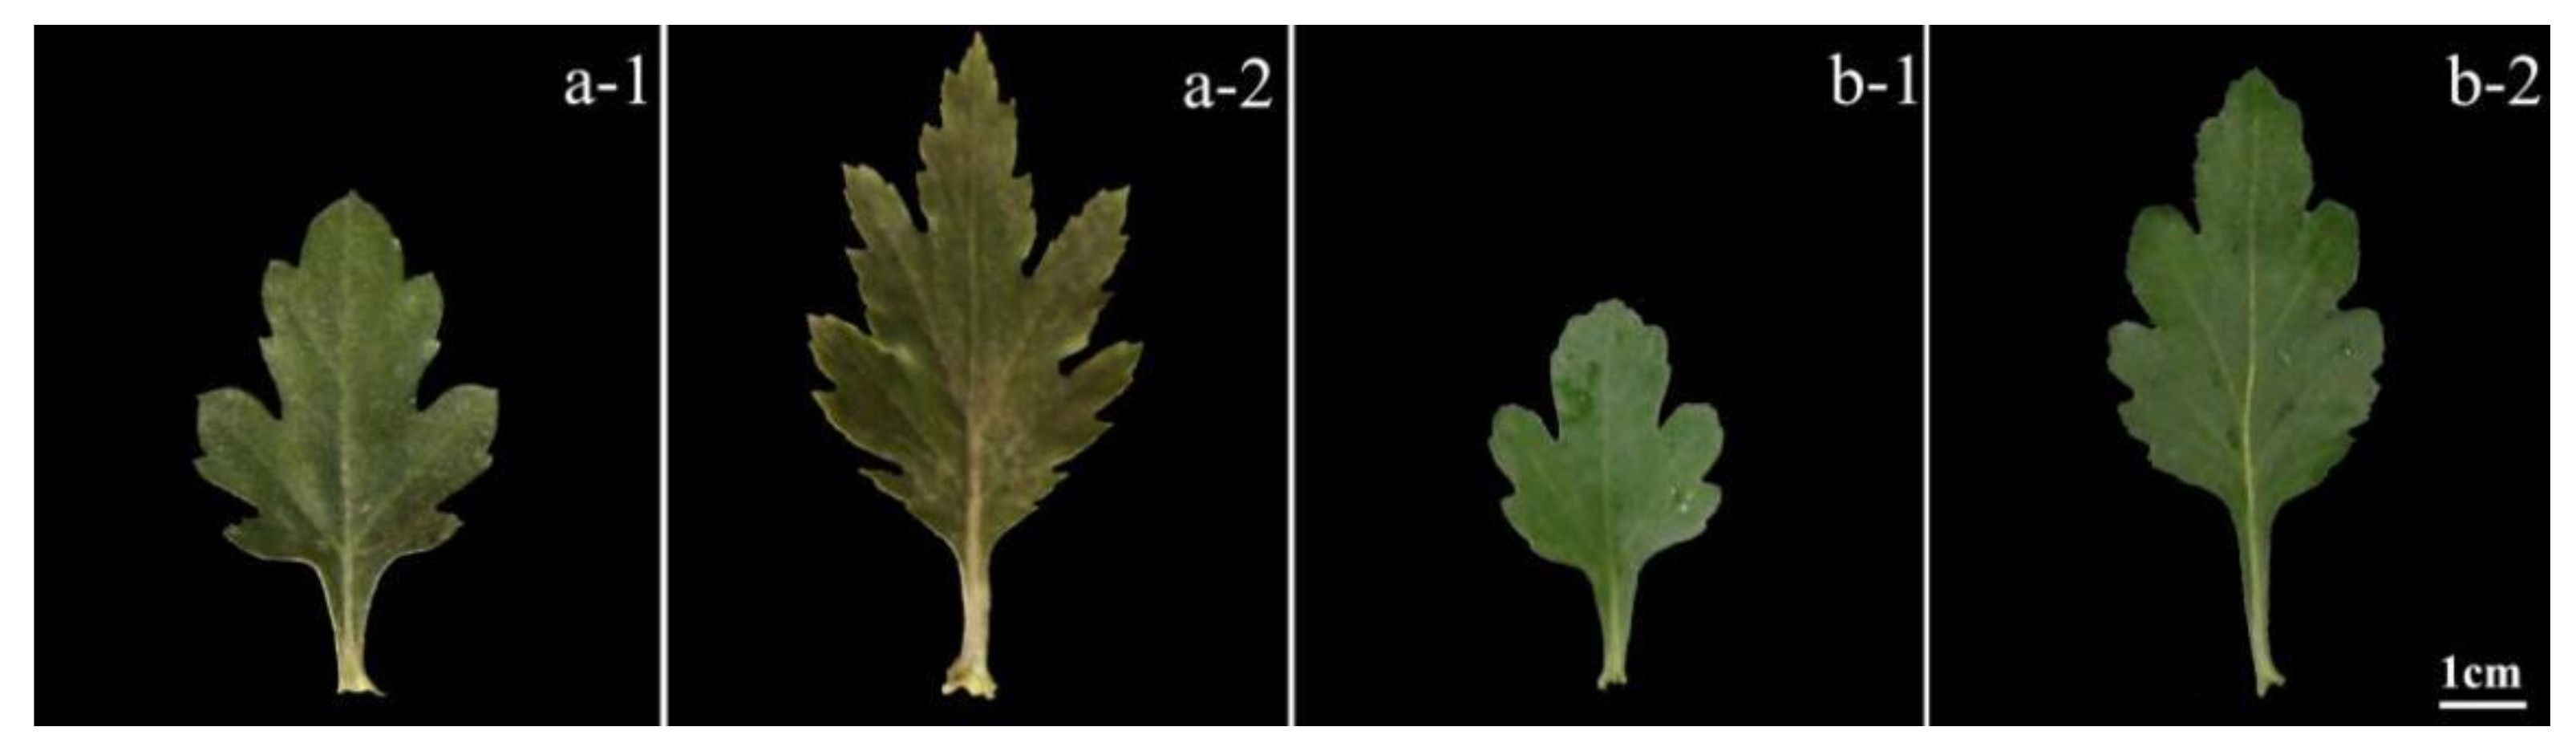
3.6.1. Variation of Leaf Traits in Chrysanthemum

The variation analysis results of leaf traits are shown in Table 2. These traits can be used for the QTL analysis.

3.6.2. QTLs Related to Leaf Traits Located Based on Genetic Map

In this study, the rice character QTL naming method by McCouch [68] was adopted, which is shown as follows: “q” + “target trait (uppercase English letter)” + “−” + “chromosome number or linkage group code” + “QTL number”. The full name of the QTL is usually expressed in italics. A total of 51 QTLs and 284 linkage markers were detected in 10 leaf traits in the control chrysanthemum.
The results of the leaf trait QTL analysis are as follows (Table 6 and Supplementary Table S4): there is only one QTL that controls LBL, which is located in the LG22 (95.87–96.20 cM) linkage group, there are four closely related markers, the corresponding LOD value is 3.21, and it can explain 4.90% of the phenotypic variation. There are three QTLs that control the LBW, which are located in the LG1 (183.42–188.58 cM) and LG18 (18.54–19.20 cM) linkage groups, there are six closely related markers with corresponding LOD values from 3.00 to 3.23, and they can explain 4.40–12.00% of the phenotypic variation. Two QTLs were detected in the LG18 linkage group, and only one QTL was detected in the LG1 linkage group. There were two QTLs that controlled the LBS, they were located in the LG20 (87.70–90.45 cM) linkage group, there were three closely related markers, with corresponding LOD values ranging from 3.14–3.93, and they could explain 5.80–7.10% of the phenotypic variation. There was only one QTL that controlled the LPL, which was located in the LG6 (98.48 cM) linkage group, with only one closely related marker, the corresponding LOD value was 4.55, and it could explain 6.80% of the phenotype variation. There were eight QTLs that controlled the LPS, which were located on the LG4 (49.09–49.42 cM), LG6 (72.06–113.25 cM), LG7 (67.42–79.85 cM), LG23 (85.35–86.01 cM) and LG25 (79.73 cM) linkage groups. There were 74 closely related markers with corresponding LOD values that ranged from 3.01–3.95, and they could explain 4.50–5.80% of the phenotypic variation. Among these QTLs, three were detected in the LG6 linkage group, two were detected in the LG23 linkage group, and only one was detected in the other linkage group. There were 13 QTLs that controlled the LLL-RLL, which were located on the chain group LG11 (80.51–85.72 cM), LG14 (112.88 cM) and LG20 (83.28–113.04 cM), respectively. There were 78 closely linked markers, corresponding LOD values ranged from 3.03 to 4.33, and they could explain 5.00% to 54.00% of the phenotypic variation. Among these loci, eight QTLs were detected on LG20 chain group, while only one QTL was detected on another chain group. There was only one QTL that controlled the LLW-RLL located in the LG27 (97.84 cM) linkage group, there was only one closely related marker with a corresponding LOD value of 4.40, and they could explain 7.50% of the phenotype variation. There were four QTLs that controlled the LVL-RLL, which were located in the chain groups LG2 (134.62 cM), LG11 (0.66 cM), LG17 (166.93–167.59 cM) and LG20 (113.24 cM). There were nine closely linked markers with corresponding LOD values ranging from 3.02 to 3.76, and they could explain 5.10–9.70% of the phenotypic variation. Only one QTL was detected in each chain group. There were six QTLs that controlled the LLS-RLL of the right lower lobe, and they were located in the LG2 (18.51–26.07 cM), LG10 (96.13–96.79 cM) and LG16 (14.35–20.98 cM) linkage groups, respectively. There were 55 closely related markers with corresponding LOD values that ranged from 3.11–3.99, and they could explain 5.00% to 6.30% of the phenotypic variation. Among these loci, four QTLs were detected on LG2 linkage group, while only one QTL was detected on another linkage group. There were a total of 12 QTLs controlling the LCD-RLL, which were located in the LG2 (18.14–21.67 cM), LG15 (9.28–31.16 cM), LG16 (1.67–31.79 cM) and LG20 (0–27.49 cM) linkage groups, respectively. Among them, five QTLs were detected on the LG16 chain group, three QTLs were detected on LG2 chain group, and two QTLs were detected on LG15 and LG20 chain group.
The annotation of traits abbreviation is as shown in Table 1.
In summary, two QTLs were found to control the LBS, both of which were located in the LG20 (87.70–90.45 cM) chain group. Six QTLs for LLS control (lobed length/lobed width) were found, and they were located in the LG2 (18.51–26.07 cM), LG10 (96.13–96.79 cM) and LG16 (14.35–20.98 cM) linkage groups. Twelve QTLs were found to control the LCD, which were located in the LG2 (18.14–21.67 cM), LG15 (9.28–31.16 cM), LG16 (1.67–31.79 cM) and LG20 (0.00–27.49 cM) linkage groups (Figure 5).

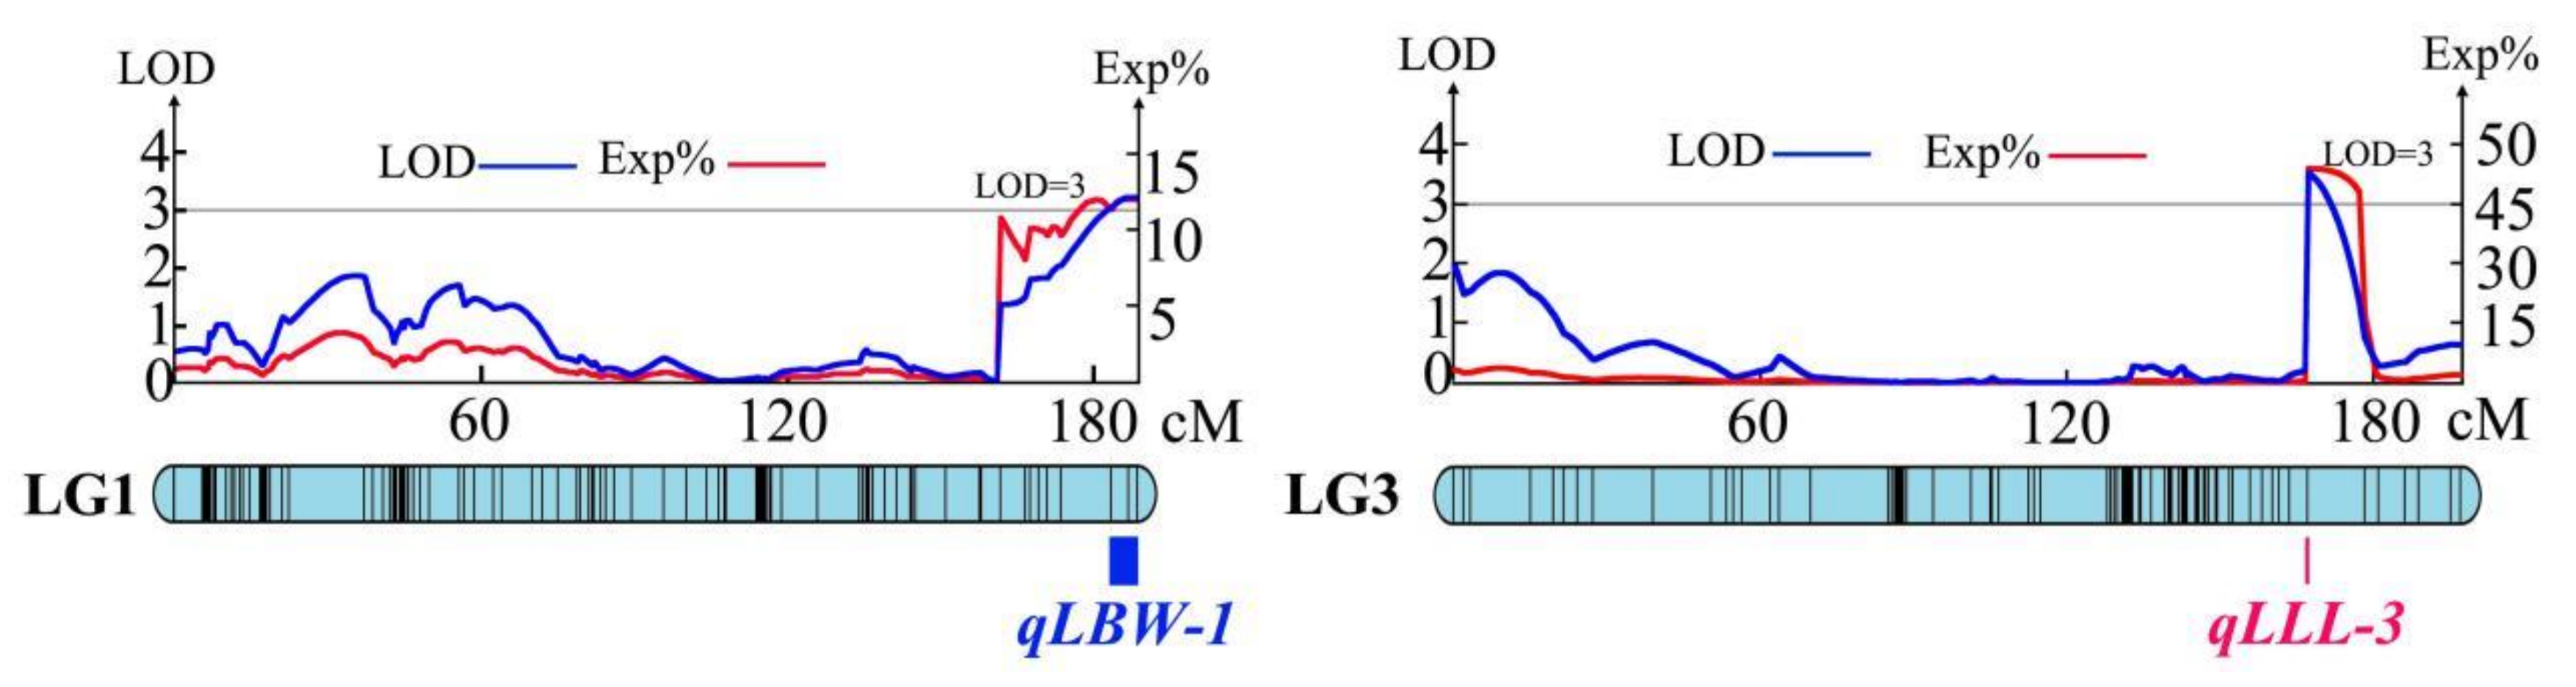
3.6.3. Major QTLs Related to Leaf Trait

The major QTLs that can explain phenotypic variation of more than 10.00% were analyzed to determine the dominant QTLs of each trait. A major QTL of LBW was found in LG1 (183.42 cM) and had a corresponding LOD value of 3.23, and it could explain 12.00% of the variation. The lateral makers were labeled as Marker 224635, Marker 224635 and Marker 216642. A primary QTL of LLL was found in LG3 (167.28 cM) with a corresponding LOD value of 3.53, and it could explain 54.00% of the phenotypic variation. The lateral molecular marker was Marker 24527 (Figure 6).

4. Discussion

Heterosis utilization is an important method for chrysanthemum hybrid breeding. In this study, two pairs of parents with large leaf morphological differences were used to construct hybrid populations, and a heterosis analysis was carried out on the selected 12 leaf quantitative traits. The results show that the heterosis phenomenon generally occurs for chrysanthemum leaf traits of hybrid offspring, and the results are largely identical to those obtained regarding chrysanthemum flower traits [23,44]. We found in different cross combinations that the heterosis of each character is different; therefore, the number of cross combinations should be expanded, and screening could obtain more obvious heterosis in hybrids. The results presented here and ray flower form genetic analysis results are largely identical [48]. In addition, in cross I and cross II, the LPL, LPS and LLS showed a positive transgressive advantage and tended to be high-value parent traits, while other traits tend to be low-value parent traits. This indicated that most of the leaf characters of chrysanthemum tended to be low-value parental traits, which also provided a theoretical reference for the early breeding of chrysanthemum.
Leaf traits are among the important targets in ornamental crops. In this study, the hybrid genetic model was used for the genetic analysis of chrysanthemum leaf characters, and it was found that the heredity of LBS was controlled by two pairs of additive-dominant-epistatic major genes. WLL was affected by two pairs of fully dominant genes. The LCD-RLL inheritance was controlled by one pair of additive-dominant major genes, LLS-RLL inheritance was controlled by two pairs of additive-dominant major genes, and the LPL inheritance was controlled by one pair of additive-dominant major genes. The results showed that most of the leaf structure parameters were quantitative characters controlled by major genes, and an analysis of the heritability found that WLL, LLS-RLL and LCD-RLL all have high heritability and are less strongly affected by the environment; thus, they can be selected in early generations in hybrid breeding. LBS and LPL are of moderate heritability and are greatly influenced by the environment. It can be seen that the heredity of leaf morphology is influenced by genetic factors and environmental factors; among these factors, the most important determinant is genetic factors. As shown in Table 2, the average C.V.% for the trait controlled by the major genes was 37.39%, while the average C.V.% for the trait controlled by polygenes was 27.83%. Therefore, traits controlled by major genes have a higher C.V.%. Similarly, as shown in Table 5, the traits controlled by the major genes had higher heritability of the major gene, with the average value greater than 30%. Finally, compared with traits controlled by polygenes, most of the traits controlled by major genes were not significantly different within the strain, which can be verified in Table 2. As shown in Table 3, the average absolute RHm% for the trait controlled by the major genes was 14.82%, while the average absolute RHm% for the trait controlled by polygenes was 7.38%. Therefore, traits controlled by major genes have a higher ratio of mid-parent heterosis. Similarly, the average absolute RHb% for the trait controlled by the major genes was 12.93%, while the average absolute RHb% for the trait controlled by polygenes was 8.24%. Therefore, traits controlled by major genes have a higher ratio of heterobeltiosis. Chrysanthemum leaf traits are mostly quantitative traits controlled by major genes or multiple genes. In this study, mixed inheritance analyses was used to predict the genetic model of leaf traits, and QTL analysis was used to preliminarily explore the gene localization. The results of mixed inheritance analyses showed that eight leaf traits (LBS, LPL, WLL, LVL-RLL, LLL-RLL, LLW-RLL, LCD-RLL and LLS-RLL) were controlled by major genes (Table 4). The results of the corresponding QTL analysis showed that, except for WLL, the corresponding QTL regions were found for the other seven traits, among which LLL-RLL found the major QTL region. The results of mixed inheritance analyses showed that four leaf traits (LBL, LBW, LWL and LPS) were controlled by polygenes (Table 4). The results of the corresponding QTL showed that, except for LWL, the corresponding QTL regions were found for the other three traits. The results of mixed inheritance analyses and QTL analysis are not completely consistent, which may be caused by several reasons. On the one hand, the leaf morphology of the hybrid parents could not cover all leaf character types due to the limited number of genetic population in this study. In the later studies, we need to construct a larger population for genetic analysis of leaf traits. On the other hand, leaf phenotypes are susceptible to environmental influences; therefore, certain errors will occur when conducting QTL analyses. Therefore, follow-up work should include increased observation data of leaf traits over many years and multiple sites, minimize the leaf morphological differences caused by different years and environmental conditions, and further improve the accuracy of leaf trait QTLs. However, whether there are any key genes controlling leaf shape in these QTL regions (either general QTL regions or major QTL regions) still needs to be further explored with reference genomic data.
The phenotypic values of 12 leaf traits all exceeded (positive or negative) that of the parents, which indicated that the hybrid offspring generally showed transgressive separation. At the same time, the heterosis of each character was different between the two hybrid combinations. These results provide a reference for the selection of parents in leaf shape breeding. In addition, the number of hybridization combinations should be appropriately increased to increase the probability of acquiring target traits. LBS, WLL, LCD and LLS were in line with the genetic models of B-1, B-5, A-1 and B-2, respectively, and the heritability of the major genes was all greater than 30%, indicating that the four leaf-shape structural parameters were all controlled by the major genes. These four traits have high heritability, great potential for improvement in breeding and good effect in early selection. Besides, a primary QTL was obtained for controlling LBW and LLL. According to these results, markers among major QTLs responsible for LBW and LLL may become important tightly linkage markers of LBW and LLL, and these markers can be developed for molecular-marker-assisted (MAS) breeding of LBW and LLL in chrysanthemum. This will provide a technical guidance for breeding chrysanthemum varieties with different leaf shapes and improve the early identification and selection of chrysanthemum.

5. Conclusions

To identify the genetic mechanism of chrysanthemum leaf morphology, this study used genetic analysis and QTL mapping to analyze leaf traits of chrysanthemum. Based on the quantitative definition and classification system of leaf characters, the factors and genetic mechanism affecting leaf morphological variation of small-flower chrysanthemum were discussed. Based on two pairs of genetic populations constructed by sexual hybridization, a multivariate statistical analysis and hybrid genetic analysis were performed on 17 key leaf traits. The variation coefficient analysis showed that leaf traits were more separated in hybrid offspring and the variation of LLS (leaf lobe shape) was greater than that of LBS (leaf blade shape) and LPS (leaf petiole shape). The LBS of the leaves of the hybrid chrysanthemum can be divided into fourcategories, and the LLS can be divided into four categories. The results of mixed genetic analysis showed that the heredity of LBL, LBW, LWL and LPS were all in keeping with the A-0 genetic model and were greatly influenced by the environment. LBS, WLL, LCD and LLS were in line with the genetic models of B-1, B-5, A-1 and B-2, respectively, and the heritability of the major genes was all greater than 30%, indicating that the four leaf-shape structural parameters were all controlled by the major genes. The results will lay a theoretical foundation for the study of leaf QTL mapping in chrysanthemum and provide a basis for the selection and breeding of chrysanthemum cultivars. In addition, based on the high-density genetic map, the interval mapping method was used to find a total of 51 QTLs controlling leaf traits, including two QTLs controlling LBS. There were 6 QTLs controlling the LLS-RLL, and 12 QTLs controlling the LCD-RLL. A primary QTL was obtained for controlling LBW and LLL. The genetic analysis of the morphological characteristics of chrysanthemum leaves in this study not only facilitates the early identification of seedlings in chrysanthemum production but also provides important reference value for the genetic study of leaf shape variation in other plants.

Supplementary Materials

The following are available online at https://www.mdpi.com/2073-4395/10/5/697/s1, Table S1: AIC values under various genetic models, Table S2: Test for fitness of genetic models on leaf traits derived from two crosses, Table S3: Estimates of genetic parameters of leaf traits, Table S4: The detailed result of QTLs test of all leaf traits.

Author Contributions

Designing experiments, K.G., X.S. and S.D.; Writing and editing manuscript, K.G. and X.S.; Conducting experiments, K.G. and X.S.; Conducting statistical analysis, K.G. and X.S.; Review and editing, K.G., X.S. and S.D.; Writing—Original draft and review, K.G., X.S. and D.K.; Funding acquisition, S.D. and K.G. All authors have read and agreed to the published version of the manuscript.

Funding

This research was funded by the National Natural Science Foundation of China (31530064), National key research and development program (2018YFD1000405), Beijing science and technology project (Z191100008519002) and Major research achievement cultivation project of Beijing Forestry University (2017CGP012).

Acknowledgments

We are particularly indebted to Beijing Dadongliu Nursery for providing test sites. We thank YuShan Ji and Shuo Wang for their guidance on plant material cultivation.

Conflicts of Interest

The authors declare no conflict of interest.

References

  1. Dai, S.L. Chinese chrysanthemums and world horticulture. J. Hebei Norm. Univ. Sci. Technol. 2004, 2, 1–5. (In Chinese) [Google Scholar]
  2. Dai, S.L.; Song, X.B.; Deng, C.Y.; Gao, K.; Li, M.L.; Ma, C.F.; Zhang, M.M. Comprehensive approach and molecular tools for breeding and production of ornamental crops. Acta Hortic. 2019, 1263, 1–16. [Google Scholar] [CrossRef]
  3. Zhang, X.C. Study on the Separation and Variation of Leaf Traits in F1 Generation of Hybrid Apple and Its Application in Early Selection. Master’s Thesis, Northwest Agriculture & Forestry University, Yang ling, China, 2009. [Google Scholar]
  4. Zhang, B.B.; Yu, M.L.; Cai, Z.X.; Xu, J.L.; Ma, R.J. Variation of leaf traits of hybrid offspring (F1) of narrow leaf peach and common leaf peach. Jiangsu J. Agric. Sci. 2011, 27, 848–852. (In Chinese) [Google Scholar]
  5. Diao, S.F.; Li, F.D.; Duan, W.; Han, W.J.; Sun, P.; Fu, J.M. Phenotypic genetic diversity of hybrid F1 leaves of persimmon. J. China Agric. Univ. 2017, 22, 32–44. (In Chinese) [Google Scholar]
  6. Jiang, X.B.; Zhang, P.S.; Yang, L.; Wu, Q.; Wu, C.L.; Wu, X.Y.; Gong, B.C.L.J.S. Study on leaf phenotype and genetic variation of Chinese chestnut and castanopsis chinensis interspecific hybrid F1 generation. Acta Hortic. Sin. 2019, 46, 2129–2142. (In Chinese) [Google Scholar]
  7. Rowland, S.D.; Zumstein, K.; Nakayama, H.; Cheng, Z.; Flores, A.M.; Chitwood, D.H.; Maloof, J.N.; Sinha, N.R. Leaf shape is a predictor of fruit quality and cultivar performance in tomato. N. Phytol. 2020, 226, 851–865. [Google Scholar] [CrossRef] [Green Version]
  8. Tracy, M. Geographic variation and plasticity of leaf shape and size in Begonia dregei and B. homonyma (Begoniaceae). Bot. J. Linnean Soc. 2000, 132, 79–95. [Google Scholar]
  9. Zhu, J.; Tian, X.J.; Chen, B.; Lu, J.Z. Computer recognition system of plant leaf shape. Bot. Bull. 2005, 22, 89–94. (In Chinese) [Google Scholar]
  10. Klingenberg, C.P. Evolution and development of shape: Integrating quantitative approaches. Nat. Rev. Genet. 2010, 11, 623–635. [Google Scholar] [CrossRef]
  11. Khadivi-khub, A.; Zamani, Z.; Fatahi, M.R. Multivariate analysis of Prunus subgen. Cerasus germplasm in Iran using morphological variables. Genet. Resour. Crop Evol. 2012, 59, 909–926. [Google Scholar] [CrossRef]
  12. Zhang, N.; Liu, W.P. Overview of plant leaf recognition technology based on image analysis. Comput. Appl. Res. 2011, 28, 4001–4007. (In Chinese) [Google Scholar]
  13. Tang, J.; Deng, L.M.; Chen, H.; Luan, T.; Ma, W.J. Feature recognition of transmitted image of maize leaves based on machine vision. Sci. Agric. Sin. 2014, 47, 431–440. (In Chinese) [Google Scholar]
  14. Wang, L.J.; Huai, Y.J.; Peng, Y.C. Species identification of foliage plants based on multi-feature fusion of leaf images. J. Beijing For. Univ. 2015, 37, 55–61. (In Chinese) [Google Scholar]
  15. Chen, M.S.; Jin, Z.X.; Ke, S.X. Determination and analysis of carpinus leaf shape changes in different light environments. For. Sci. 2008, 54, 54–63. (In Chinese) [Google Scholar]
  16. Chatrou, L. Studies in Annonaceae XXVII. Macromorphological variation of recent invaders in northern Central America: The case of Malmea (Annonaceae). Am. J. Bot. 1997, 84, 861–869. [Google Scholar] [CrossRef] [PubMed]
  17. Qi, D.L.; Zhou, Q.Y.; Liu, S.J.; Li, J. Numerical analysis of germplasm relationship of grape by leaf shape structure. Fruit Tree S. China 2005, 3, 64–66. (In Chinese) [Google Scholar]
  18. Zhang, C. Study on the Correlation between Leaf Shape Structure and Variety Identification of Grape. Master’s Thesis, Southwest University, Chong Qing, China, 2006. (In Chinese). [Google Scholar]
  19. Huang, W.J.; Li, Z.J.; Yang, Z.P.; Bai, G.Z. Structural characters and their relationship in heteromorphic leaves of euphratica populus. Acta Ecol. Sin. 2010, 30, 4636–4642. (In Chinese) [Google Scholar]
  20. Zuo, L.H.; Zhang, W.L.; Qiu, T.; Zhang, J.; Yang, M.S. Leaf shape variation of wild apple in xinjiang and its correlation with SSR markers. Acta Hortic. Sin. 2015, 42, 759–768. (In Chinese) [Google Scholar]
  21. Liu, W.Q.; Lu, Y.Y.; Kang, S.; Yan, H.; Wei, F.; Ma, S.C. Comparative study on leaf structure and identification method of different leaf shape mandala. J. Pharm. Anal. 2015, 35, 1092–1098. (In Chinese) [Google Scholar]
  22. He, J. Study on Morphological Characters and SCoT of Genetic Relationship of 40 Guava Germplasm Resources. Master’s Thesis, Guangxi University, Guangxi, China, 2017. [Google Scholar]
  23. Li, X.L.; Li, X.H.; Jiang, D.M.; Liu, Z.M.; Wang, H.M.; Ji, L.Z. Leaf morphology of 22 compositae herbaceous plants in horqin sandy land. J. Ecol. 2005, 12, 1397–1401. (In Chinese) [Google Scholar]
  24. He, W.Q. Taxonomic Study of Pterocypsela Shih (Compositae—Endive). Master’s Thesis, Zhengzhou University, Zhengzhou, China, 2012. (In Chinese). [Google Scholar]
  25. Zhen, L.P.; Yang, J.; Yu, N.J. Study on the characteristics of the lower leaf surface of wild chrysanthemum plants in anhui. Chin. J. Plant Sci. 2013, 31, 99–106. (In Chinese) [Google Scholar] [CrossRef]
  26. Zhang, S.L.; Dai, S.L. Chinese Chrysanthemum Book; China Forestry Press: Beijing, China, 2013; pp. 1–5. [Google Scholar]
  27. Li, N.N. Breeding New Cultivars of Chrysanthemum with Single Head. Master’s Thesis, Beijing Forestry University, Beijing, China, 2012. [Google Scholar]
  28. Wang, J.M.; Chen, F.D.; Fang, W.M.; Chen, S.M.; Guan, Z.Y.; Tang, H.Y. Identification of cut chrysanthemum based on leaf shape. Acta Bot. Sin. 2013, 48, 608–615. (In Chinese) [Google Scholar]
  29. Zhang, Y. Identification and Classification of Chinese Traditional Chrysanthemum Based on Three Markers. Ph.D. Thesis, Beijing Forestry University, Beijing, China, 2014. [Google Scholar]
  30. Xue, S.J. Chinese Chrysanthemum Atlas; China Forestry Press: Beijing, China, 2004; pp. 1–20. [Google Scholar]
  31. Song, X.B. Quantitative Definition and Genetic Analysis of Phenotypic Traits of Chrysanthemum Varieties. Ph.D. Thesis, Beijing Forestry University, Beijing, China, 2018. [Google Scholar]
  32. Richard, F. Introduction to quantitative genetics. Trends Genet. 1996, 12, 280. [Google Scholar]
  33. Gai, J.Y.; Zhang, Y.M. Genetic System of Quantitative Traits in Plants; Science Press: Beijing, China, 2003; pp. 1–20. (In Chinese) [Google Scholar]
  34. Elston, R.C.; Stewart, J. The analysis of quantitative traits for simple genetic models from parental, F1 and backcross data. Genetics 1973, 73, 695–711. [Google Scholar] [PubMed]
  35. Morton, N.E.; MacLean, C.J. Analysis of family resemblance 3 Complex segregation of quantitative traits. Am. J. Human Genet. 1974, 26, 489. (In Chinese) [Google Scholar]
  36. Elkind, Y.; Cahaner, A. A mixed model for the effects of single gene, polygenes and their interaction on quantitative traits. Theor. Appl. Genet. 1986, 72, 377–383. [Google Scholar] [CrossRef]
  37. Mo, H.D. The quantity and quality traits of genetic analysis I. Genetic composition and the major gene genotype identification. J. Crops 1993, 1, 1–6. (In Chinese) [Google Scholar]
  38. Mo, H.D. The quantity and quality traits of genetic analysis II. Generation mean and genetic variance. J. Crops 1993, 3, 193–200. (In Chinese) [Google Scholar]
  39. Loisel, P.; Goffinet, B.; Monod, H.; Montes, O.G. Detecting a major gene in an F2 population. Biometrics 1994, 50, 512–516. [Google Scholar] [CrossRef]
  40. Jiang, C.J.; Mo, H.D. Genetic analysis IV of quantitative traits and quantity traits. The application of the maximum likelihood method. J. Crops 1995, 6, 641–648. (In Chinese) [Google Scholar]
  41. Jiang, C.; Pan, X.; Gu, M. The use of mixture models to detect effects of major genes on quantitative characters in a plant breeding experiment. Genetics 1994, 136, 383–394. (In Chinese) [Google Scholar] [PubMed]
  42. Zhang, F.; Chen, F.D.; Fang, W.M.; Chen, S.M.; Li, F.T. Heterosis and hybrid genetic analysis of chrysanthemum floral organ traits. Sci. Agric. Sin. 2010, 43, 2953–2961. (In Chinese) [Google Scholar]
  43. Zhang, F.; Chen, F.D.; Fang, W.M.; Chen, S.M.; Li, F.T. Heterosis and hybrid genetic analysis of major gene and multi-gene in chrysanthemum nutritional traits. For. Sci. 2011, 47, 46–52. (In Chinese) [Google Scholar]
  44. Zhang, F.; Chen, F.D.; Fang, W.M.; Chen, S.M.; Liu, P.S.; Yin, D.M. Heterosis and hybrid genetic analysis of chrysanthemum flowering traits. J. Nanjing Agric. Univ. 2011, 34, 31–36. (In Chinese) [Google Scholar]
  45. Xu, L.L.; Chen, F.D.; Chen, S.M.; Fang, W.M.; Zhu, W.Y.; Wang, H.B.; Li, P.L. Genetic analysis of salt tolerance of hybrid progeny between chrysanthemum and genera. Acta Ecol. Sin. 2013, 33, 4902–4908. (In Chinese) [Google Scholar]
  46. Peng, H.; Chen, F.D.; Fang, W.M.; Jiang, J.F.; Chen, S.M.; Guan, Z.Y.; Liao, Y. Heterosis and genetic analysis of branching traits of chrysanthemum. Acta Hortic. Sin. 2013, 40, 1327–1336. [Google Scholar]
  47. Tang, H.Q.; Zhang, F.; Chen, F.D.; Fang, W.M.; Wang, C.C.; Chen, S.M. Heterosis and hybrid genetic analysis of characteristics of chrysanthemum floral organ of anemone type. Acta Hortic. Sin. 2015, 42, 907–916. [Google Scholar]
  48. Song, X.B.; Zhao, X.G.; Fan, G.X.; Gao, K.; Dai, S.L.; Zhang, M.M. Genetic analysis of the corolla tube merged degree and the relative number of ray florets in chrysanthemum (Chrysanthemum×morifolium Ramat.). Sci. Hortic. 2018, 242, 214–224. [Google Scholar] [CrossRef]
  49. Fazio, G.; Staub, J.E.; Stevens, M.R. Genetic mapping and QTL analysis of horticultural traits in cucumber (Cucumis sativus L.) using recombinant inbred lines. Theor. Appl. Genet. 2003, 107, 864–874. [Google Scholar] [CrossRef]
  50. Zhang, W.K.; Wang, Y.J.; Luo, G.Z.; Zhang, J.S.; He, C.Y.; Wu, X.L.; Gai, J.Y.; Chen, S.Y. QTL mapping of ten agronomic traits on the soybean (Glycine max L. Merr.) genetic map and their association with EST markers. Theor. Appl. Genet. 2004, 108, 1131–1139. [Google Scholar] [CrossRef]
  51. He, D.H.; Lin, Z.X.; Zhang, X.L.; Nie, Y.C.; Guo, X.P.; Zhang, Y.X.; Li, W. QTL mapping for economic traits based on a dense genetic map of cotton with PCR-based markers using the interspecific cross of Gossypium hirsutum× Gossypium barbadense. Euphytica 2007, 153, 181–197. [Google Scholar] [CrossRef]
  52. Fang, X.; Dong, K.; Wang, X.; Liu, T.; He, J.; Ren, R.; Zhang, L.; Liu, R.; Liu, X.; Li, M.; et al. A high density genetic map and QTL for agronomic and yield traits in Foxtail millet [Setaria italica (L.) P. Beauv.]. BMC Genom. 2016, 17, 336. [Google Scholar] [CrossRef] [PubMed] [Green Version]
  53. Paterson, A.H.; Lander, E.S.; Hewitt, J.D.; Peterson, S.; Lincoln, S.E.; Tanksley, S.D. Resolution of quantitative traits into Mendelian factors by using a complete linkage map of restriction fragment length polymorphisms. Nature 1988, 335, 721–726. [Google Scholar] [CrossRef]
  54. Simmonds, J.; Scott, P.; Leverington-Waite, M.; Turner, A.S.; Brinton, J.; Korzun, V.; Snape, J.; Uauy, C.J. Identification and independent validation of a stable yield and thousand grain weight QTL on chromosome 6A of hexaploid wheat (Triticum aestivum L.). BMC Plant Biol. 2014, 14, 191. [Google Scholar] [CrossRef] [PubMed] [Green Version]
  55. Jiang, N.F.; Shi, S.L.; Shi, H.; Khanzada, H.; Wassan, G.M.; Zhu, C.L.; Peng, X.S.; Yu, Q.Y.; Chen, X.R.; He, X.P.; et al. Mapping QTL for seed germinability under low temperature using a new high-density genetic map of rice. Front. Plant Sci. 2017, 8, 1223. [Google Scholar] [CrossRef] [PubMed] [Green Version]
  56. Zhang, X.H.; Huang, C.L.; Wu, D.; Qiao, F.; Li, W.Q.; Duan, L.F.; Wang, K.; Xiao, Y.J.; Chen, G.X.; Liu, Q.; et al. High-throughput phenotyping and QTL mapping reveals the genetic architecture of maize plant growth. Plant. Physiol. 2017, 173, 1554–1564. [Google Scholar] [CrossRef] [PubMed] [Green Version]
  57. Hussain, W.; Baenziger, P.S.; Belamkar, V.; Guttieri, M.J.; Venegas, J.P.; Easterly, A.; Sallam, A.; Poland, J. Genotyping-by-sequencing derived high-density linkage map and its application to QTL mapping of flag leaf traits in bread wheat. Sci. Rep. 2017, 7, 16394. [Google Scholar] [CrossRef]
  58. Murakami, N.; Hara, N.; Onodera, H.; Kashiwagi, T.; Ujiie, K.; Shimizu, B.; Onishi, A.; Miyagawa, H.; Katoh, E. Loss of function of the IAA-glucose hydrolase gene TGW6 enhances rice grain weight and increases yield. Nat. Genet. 2013, 45, 707–711. [Google Scholar]
  59. Wu, Y.; Wang, Y.; Mi, X.F.; Shan, J.X.; Li, X.M.; Xu, J.L.; Lin, H.X. The QTL GNP1 encodes GA20ox1, which increases grain number and yield by increasing cytokinin activity in rice panicle meristems. PLoS Genet. 2016, 12, e1006386. [Google Scholar] [CrossRef]
  60. Yano, M.; Katayose, Y.; Ashikari, M.; Yamanouchi, U.; Monna, L.; Fuse, T.; Baba, T.; Yamamoto, K.; Umehara, Y.; Nagamura, Y.; et al. Hd1, a major photoperiod sensitivity quantitative trait locus in rice, is closely related to the Arabidopsis flowering time gene CONSTANS. Plant Cell 2000, 12, 2473–2483. [Google Scholar] [CrossRef] [Green Version]
  61. Yan, W.H.; Wang, P.; Chen, H.X.; Zhou, H.J.; Li, Q.P.; Wang, C.R.; Ding, Z.H.; Zhang, Y.S.; Yu, S.B.; Xing, Y.Z.; et al. A major QTL, Ghd8, plays pleiotropic roles in regulating grain productivity, plant height, and heading date in rice. Mol. Plant 2011, 4, 319–330. [Google Scholar] [CrossRef] [PubMed]
  62. Gao, H.; Jin, M.N.; Zheng, X.M.; Chen, J.; Yuan, D.Y.; Xin, Y.Y.; Wang, M.Q.; Huang, D.Y.; Zhang, Z.; Zhou, K.N.; et al. Days to heading 7, a major quantitative locus determining photoperiod sensitivity and regional adaptation in rice. Proc. Natl. Acad. Sci. USA 2014, 111, 16337–16342. [Google Scholar] [CrossRef] [Green Version]
  63. Debener, T.; Mattiesch, L. Construction of a genetic linkage map for roses using RAPD and AFLP markers. Theor. Appl. Genet. 1999, 99, 891–899. [Google Scholar] [CrossRef]
  64. Zhang, F.; Chen, S.M.; Chen, F.D.; Fang, W.M.; Chen, Y.; Li, F.T. SRAP-based mapping and QTL detection for inflorescence-related traits in chrysanthemum (Dendranthema morifolium). Mol. Breed. 2011, 27, 11–23. [Google Scholar] [CrossRef]
  65. Tang, H.Q. Genetic Analysis and QTL Mapping of Floral Organ Traits in Chrysanthemum Flowers of Osmanthus Type. Master’s Thesis, Nanjing Agricultural University, Nanjing, China, 2014. [Google Scholar]
  66. Van, G.G.; Bourke, P.M.; Voorrips, R.E.; Marasek, A.; Liao, Y.L.; Post, A.; Van, M.U.; Visser, R.G.; Maliepaard, C.; Arens, P. An ultra-dense integrated linkage map for hexaploid chrysanthemum enables multi-allelic QTL analysis. Theor. Appl. Genet. 2017, 130, 2527–2541. [Google Scholar]
  67. Van, O.J.W. Multipoint maximum likelihood mapping in a full-sib family of an outbreeding species. Genet. Res. 2011, 93, 343–349. [Google Scholar]
  68. McCouch, S.R.; Chen, X.; Panaud, O.; Temnykh, S.; Xu, Y.; Cho, Y.G.; Huang, N.; Ishii, T.; Blair, M. Microsatellite marker development, mapping and applications in rice genetics and breeding. Plant Mol. Biol. 1997, 35, 89–99. [Google Scholar] [CrossRef]
Figure 1. Leaf morphology of two hybrid parents. (a-1) Female parent “388Q-76” of cross I; (a-2) male parent “Hongchi” of cross I; (b-1) female parent “Candy” of cross II; (b-2) male parent “225” of cross II. Scale is 1 cm.
Agronomy 10 00697 g001
Figure 2. The distribution of leaf morphology in the hybrids. (a) Distribution of leaf blade shape in hybrid progeny; (b) distribution of leaf lobe shape in hybrid progeny.
Agronomy 10 00697 g002
Figure 3. The frequency distribution for leaf traits in F1 population derived from the cross I. The annotation of traits abbreviation is as shown in Table 1. Female parent value (F), male parent value (M).
Agronomy 10 00697 g003
Figure 4. The frequency distribution for leaf traits in F1 population derived from the cross II. The annotation of traits abbreviation is as shown in Table 1. Female parent value (F), male parent value (M).
Agronomy 10 00697 g004
Figure 5. The quantitative trait loci (QTLs) test for the LBS (leaf blade shape), LLS (leaf lobe shape) and LCD (leaf crack depth). The left of each linkage group is the location of the QTL, and the unit is cM. The right side is the QTL name. The QTL naming method is shown as follows: "q" + "target trait (uppercase English letter)" + "−" + "chromosome number or linkage group code" + "QTL number". The full name of QTL is usually expressed in italics.
Agronomy 10 00697 g005
Figure 6. The major QTLs test for leaf traits. LBW: Leaf blade width; LLL: leaf lobe length. The complete description as in Figure 5.
Agronomy 10 00697 g006
Table 1. Abbreviations for 17 leaf measured traits.
AbbreviationLeaf Traits
LBLleaf blade length
LBWleaf blade width
LBSleaf blade shape (LBL/LBW)
LWLleaf at widest part length
WLLwidest part length/leaf length
LPLleaf petiole length
LPSleaf petiole shape (LPL/LBL)
LVL-RULleaf vein length of right upper lobe
LLL-RULleaf lobe length of right upper lobe
LLW-RULleaf lobe width of right upper lobe
LCD-RULleaf crack depth of right upper lobe
LLS-RULleaf lobe size of right upper lobe
LVL-RLLleaf vein length of right lower lobe
LLL-RLLleaf lobe length of right lower lobe
LLW-RLLleaf lobe width of right lower lobe
LCD-RLLleaf crack depth of right lower lobe
LLS-RLLleaf lobe size of right lower lobe
Table 2. The descriptive statistics of 17 quantitative traits.
TraitsMinimumMaximumMeanStandard DeviationC.V.%p-Value
Between the StrainIn the Strain
LBL1.048.293.971.1829.770.00 **0.00 **
LBW0.054.731.560.4931.200.00 **0.00 **
LBS0.927.502.930.8428.520.00 **0.26
LWL0.755.292.710.8732.020.00 **0.00 **
WLL0.380.920.680.0912.990.00 **0.63
LPL0.483.241.360.2115.350.00 **0.00 **
LPS0.010.740.280.0518.310.00 **0.73
LVL-RUL0.005.182.150.7233.570.00 **0.00 **
LLL-RUL0.002.610.670.3348.920.00 **0.02 *
LLW-RUL0.001.730.770.2532.700.00 **0.40
LCD-RUL0.000.710.300.1033.600.00 **0.30
LLS-RUL0.003.340.840.3237.580.00 **0.04 *
LVL-RLL0.004.541.780.7944.120.00 **0.00 **
LLL-RLL0.002.470.640.4062.390.00 **0.00 **
LLW-RLL0.001.830.670.3145.810.00 **0.30
LCD-RLL0.000.810.330.1441.930.00 **0.21
LLS-RLL0.005.390.890.4348.000.00 **0.29
* indicate significant difference at 0.05 probability level. ** indicate significant difference at 0.01 probability level. The annotation of traits abbreviation is as shown in Table 1.
Table 3. The basic statistical characteristics and heterosis of leaf traits in F1 generations from two crosses.
Cross
Number
TraitsP1
(F 1)
P2
(M 2)
Mid-Parents ValueSkewnessKurtosisHmRHm%RHb%
CrossILBL4.005.394.69−0.05−0.110.296.22−7.41
LBW3.133.373.250.270.540.3410.426.57
LBS1.291.611.450.28−0.18−0.04−2.92−12.63
LWL2.333.092.71−0.23−0.330.730.270.48
WLL0.400.760.58−1.173.100.110.180.17
LPL1.311.621.470.43−0.140.3725.5614.11
LPS0.250.230.240.521.270.0313.6710.00
LVL-RLL2.372.632.500.22−0.03−0.01−0.35−6.22
LLL-
RLL
0.721.100.910.520.300.1112.65−7.32
LLW-RLL1.030.971.000.47−0.15−0.10−10.24−13.74
LCD-RLL0.300.410.360.42−0.290.0513.57−2.41
LLS-
RLL
0.721.110.911.423.300.2628.004.74
CrossIILBL2.854.323.590.310.39−0.08−2.12−18.78
LBW2.602.862.730.280.36−0.10−3.58−7.93
LBS1.101.511.312.1914.600.042.95−11.20
LWL1.392.732.060.471.150.3315.88−12.60
WLL0.490.630.56−0.53−0.070.1221.817.70
LPL1.181.421.300.580.840.1410.941.50
LPS0.300.250.271.9216.750.026.86−2.11
LVL-RLL1.992.082.030.640.82−0.39−19.15−28.84
LLL-
RLL
0.680.540.610.690.33−0.07−11.75−29.33
LLW-RLL0.990.950.970.530.50−0.33−33.95−41.63
LCD-RLL0.340.260.300.14−0.370.028.08−13.65
LLS-
RLL
0.690.560.620.590.420.2235.0511.64
1 female (F), 2 male (M). The annotation of traits abbreviation is as shown in Table 1. The annotation of parameters is as shown in 2.4.
Table 4. The optimum genetic model for leaf traits.
TraitsModelOptimum Genetic Model
Cross ICross II
LBLA-0A-0A-0 (Polygenes)
LBWA-0A-0A-0 (Polygenes)
LBSB-1B-1B-1 (Two pairs of additive-dominant-epistatic major genes)
LWLA-0A-0A-0 (Polygenes)
WLLB-1B-5B-5 (Two pairs of fully dominant major genes)
LPLA-1A-1A-1 (A pair of additive-dominant major genes)
LPSA-0A-0A-0 (Polygenes)
LVL-RLLA-0A-1A-1 (A pair of additive-dominant major genes)
LLL-RLLA-1A-1A-1 (A pair of additive-dominant major genes)
LLW-RLLA-1A-1A-1 (A pair of additive-dominant major genes)
LCD-RLLA-1A-1A-1 (A pair of additive-dominant major genes)
LLS-RLLB-2B-2B-2 (Two pairs of additive-dominant major genes)
The annotation of traits abbreviation is as shown in Table 1.
Table 5. The major gene heritability of leaf traits.
TraitsCross Numberσ2mgh2mg(%)σ2p
LBSCross I0.0140.130.03
Cross II0.0133.750.04
LPLCross I0.0950.200.18
Cross II0.0634.240.17
WLLCross I0.00350.500.01
Cross II0.0153.480.01
LVL-RLLCross I
Cross II0.0637.230.16
LLL-RLLCross I0.0540.390.13
Cross II0.0251.030.05
LLW-RLLCross I0.0456.630.07
Cross II0.0139.470.03
LCD-RLLCross I0.0049.500.01
Cross II0.0056.550.01
LLS-RLLCross I0.0867.740.11
Cross II0.0345.700.06
σ2p: phenotypic variance; σ2mg: major-gene variance; h2mg: major-gene heritability. The annotation of traits abbreviation is as shown in Table 1.
Table 6. The QTLs test for 10 quantitative traits of leaf in chrysanthemum.
TraitsThe Number of QTLsLinkage GroupThe Number of QTL Associated MarkersLOD ThresholdExp%
LBL1LG2243.214.90
LBW3LG1, LG1863.00–3.234.40–12.00
LBS2LG2033.14–3.935.80–7.10
LPL1LG614.556.80
LPS8LG4, LG6, LG7,LG23, LG25743.01–3.954.50–5.80
LLL-RLL13LG2, LG3, LG10, LG16, LG20, LG22783.04–4.335.10–54.00
LLW-RLL1LG2714.407.50
LVL-RLL4LG2, LG11, LG17, LG2093.02–3.205.10–9.00
LLS-RLL6LG2, LG10, LG16553.11–3.995.00–6.30
LCD-RLL12LG2, LG15, LG16, LG20533.00–4.224.9 0–7.10

