Article

Simulation of Maize Lethal Necrosis (MLN) Damage Using the CERES-Maize Model

1
Biosystems Engineering Department, Auburn University, Auburn, AL 36849, USA
2
International Maize and Wheat Improvement Center (CIMMYT), World Agroforestry Centre (ICRAF), United Nations Avenue, Gigiri. P.O. Box 1041-00621, Nairobi, Kenya
3
Crop, Soil and Environmental Sciences Department, Auburn University, Auburn, AL 36849, USA
4
CIMMYT, Km 45 México-Veracruz, El Batán, 56237 Texcoco, Mexico
*
Authors to whom correspondence should be addressed.
Agronomy 2020, 10(5), 710; https://doi.org/10.3390/agronomy10050710
Submission received: 16 April 2020 / Revised: 12 May 2020 / Accepted: 13 May 2020 / Published: 15 May 2020
(This article belongs to the Section Pest and Disease Management)

Abstract

:
Maize lethal necrosis (MLN), maize streak virus (MSV), grey leaf spot (GLS) and turcicum leaf blight (TLB) are among the major diseases affecting maize grain yields in sub-Saharan Africa. Crop models allow researchers to estimate the impact of pest damage on yield under different management and environments. The CERES-Maize model distributed with DSSAT v4.7 has the capability to simulate the impact of major diseases on maize crop growth and yield. The purpose of this study was to develop and test a method to simulate the impact of MLN on maize growth and yield. A field experiment consisting of 17 maize hybrids with different levels of MLN tolerance was planted under MLN virus-inoculated and non-inoculated conditions in 2016 and 2018 at the MLN Screening Facility in Naivasha, Kenya. Time series disease progress scores were recorded and translated into daily damage, including leaf necrosis and death, as inputs in the crop model. The model genetic coefficients were calibrated for each hybrid using the 2016 non-inoculated treatment and evaluated using the 2016 and 2018 inoculated treatments. Overall, the model performed well in simulating the impact of MLN damage on maize grain yield. The model gave an R2 of 0.97 for simulated vs. observed yield for the calibration dataset and an R2 of 0.92 for the evaluation dataset. The simulation techniques developed in this study can be potentially used for other major diseases of maize. The key to simulating other diseases is to develop the appropriate relationship between disease severity scores, percent leaf chlorosis and dead leaf area.

1. Introduction

The spread of transboundary diseases and insect-pests has increased significantly in recent years, threatening the food security and livelihoods of several million smallholders, especially in sub-Saharan Africa. Maize lethal necrosis (MLN) has emerged as a major threat to maize producers in eastern Africa. The disease was reported in Kenya in 2011, and subsequently reported in several eastern Africa countries from 2012 to 2014 [1,2,3]. MLN is caused by the co-infection of maize plants with a combination of maize chlorotic mottle virus (MCMV; genus Machlomovirus, family Tombusviridae) [4], and any one of several viruses from the family Potyviridae, such as sugarcane mosaic virus (SCMV), maize dwarf mosaic virus (MDMV) or wheat streak mosaic virus (WSMV). MCMV was reported for the first time in eastern Africa in 2012, while SCMV has been prevalent worldwide for many decades.
MLN produces damage by systemically infecting the plant, resulting in dead leaf area and chlorosis, which consequently reduces the photosynthetic rate and grain yield. Severe levels of MLN can even lead to plant death and complete yield loss. The socio-economic impact of MLN has been estimated in Kenya [5,6]. DeGroote et al. (2016) estimated that the national maize losses due to MLN were 0.5 million metric tons valued at US $180 million. During 2012–2013, the estimated maize yield losses due to MLN in Kenya were reported as 23%–100% in the affected counties in the country. This disease continues to be a major threat to maize in SSA [7,8].
Modeling abiotic stresses has allowed researchers to quantify the biophysical and socioeconomic impacts of drought under current and future climates on maize production and food security in SSA [9]. This has enabled breeders to prioritize key regions and traits for breeding programs [10,11]. Diseases, such as MLN, maize streak virus (MSV), grey leaf spot (GLS) and turcicum leaf blight (TLB) are among the major biotic factors affecting grain yields in SSA [12]. Developing methods to simulate the impact of these diseases on maize growth can enhance breeding efforts for resistance. Intensive efforts are currently being made in breeding for resistance to these key diseases [7,13]. Several improved maize varieties with resistance to the aforementioned diseases have been released and commercialized in SSA [14,15].
The DSSAT family of crop growth models [16] simulates the daily growth and development of approximately 35 major crops, including maize, wheat, rice, soybean and peanuts. Inputs include daily weather data (maximum and minimum temperature, rainfall and solar radiation), management information (planting date, row spacing, irrigation and nitrogen rates and dates), soil properties and genetic information (specific for each crop). These models have been widely used around the world to simulate crop responses to management, environmental and nutrient stresses and climate change. Batchelor et al. (1993) [17] incorporated methods to simulate pest damage in the CROPGRO legume model distributed with DSSAT and demonstrated the ability of the model to simulate pest damage in the soybean [18]. Following the same approach, Batchelor et al. (unpublished) incorporated pest damage coupling points into the CERES-Maize model in the early 2000s. In this approach, coupling points were defined in the model source code to apply daily damage to selected model state and rate variables. State variables included leaf, stem, ear, grain and root weight, leaf area index and plant population. Reduction in daily photosynthetic rate due to chlorotic leaf area was also included in this work. Periodic observations of pest/disease damage or levels of incidence can be entered in the time series model input file, which is read by the model and converted into daily damage on user-defined state or rate variables. Using this approach, the CERES-Maize model can simulate the impact of pest/disease damage on crop growth and yield. However, there has been no research conducted to test the pest/disease damage coupling points in CERES-Maize [19].
The International Maize and Wheat Improvement Center (CIMMYT) has had major success in breeding for resistance to MSV ([13,20,21] and more recently, for resistance to MLN [7]. The objectives of the present study were to: (1) conduct field experiments to quantify the levels of MLN damage on selected maize hybrids with different levels of MLN tolerance/susceptibility; (2) develop genetic coefficients for CERES-Maize for each of 17 selected maize hybrids; (3) evaluate the model performance in simulating MLN damage. The results of this work will enable breeders to quantify the bioeconomic impact of breeding for resistance to MLN, a major disease of maize in eastern Africa [7].

2. Materials and Methods

2.1. Field Experiments

Field experiments were established at the MLN Screening Facility at the Kenya Agriculture and Livestock Research Organization (KALRO)-Naivasha, Kenya. A set of 17 selected CIMMYT maize hybrids with different levels of tolerance to MLN (Table 1) were planted on 3 September 2016 and 3 March 2018 in a randomized complete block design with two replications. Each hybrid was planted in 4-row plots, with each row 10-m long with a row-to-row spacing of 75 cm, and plant-to-plant spacing of 20 cm. Each hybrid in treatment 1 was artificially inoculated twice with MLN-causing viruses on January 21 and 27, 2017 and April 4 and 11, 2018, following a standard protocol [21] to ensure high and uniform MLN disease pressure. In 2016, a second treatment (treatment 2) was planted and was subjected to natural infection by MLN (non-inoculated). Plots were irrigated using drip irrigation to avoid water stress. Standard agronomic practices were followed, including fertilizer applications to avoid nutrient stress. MLN disease ratings were recorded four times during the crop season (February 10, February 24, March 10 and April 11, 2017; April 24, May 11, May 23, and June 8, 2018). Timing corresponded to the early vegetative stage, mid vegetative stage, flowering and mid grain filling. MLN disease severity was visually scored on each plot using an ordinal scale of 1 (highly resistant, with no disease symptoms) to 9 (highly susceptible, with severe necrosis and death). The total leaf number was recorded at flowering. The plant population was measured by counting plants in each plot at harvest. Grain weight and grain moisture content were measured at harvest from all plants in the middle two rows of each plot. Grain weight was adjusted to 0% moisture for model comparison.

2.2. MLN Inoculation Procedure

The viral isolates of maize chlorotic mottle virus (MCMV) and sugarcane mosaic virus (SCMV) were initially collected and isolated from the infected maize field in an MLN hotspot area in Bomet, Kenya, and maintained at the MLN screening facility, Naivasha, Kenya, for phenotyping (germplasm screening/indexing). Pure cultures of MCMV and SCMV were maintained on susceptible maize hybrids H614 and PHB30G19, respectively, in separate greenhouses at the MLN screening facility, and the inoculum purity was regularly verified using an enzyme-linked immunosorbent assay (ELISA). Healthy plants were raised in the greenhouses under strict quarantine to avoid any cross-contamination. The susceptible plants were inoculated at the 4–5-leaf stage, using the inoculum harvested from previously grown and inoculated plants, and were used as the mother culture. The inoculum production process for MCMV and SCMV and maize germplasm screening under combined infection of MCMV + SCMV were described earlier [1,21,22] ( http://mln.cimmyt.org).

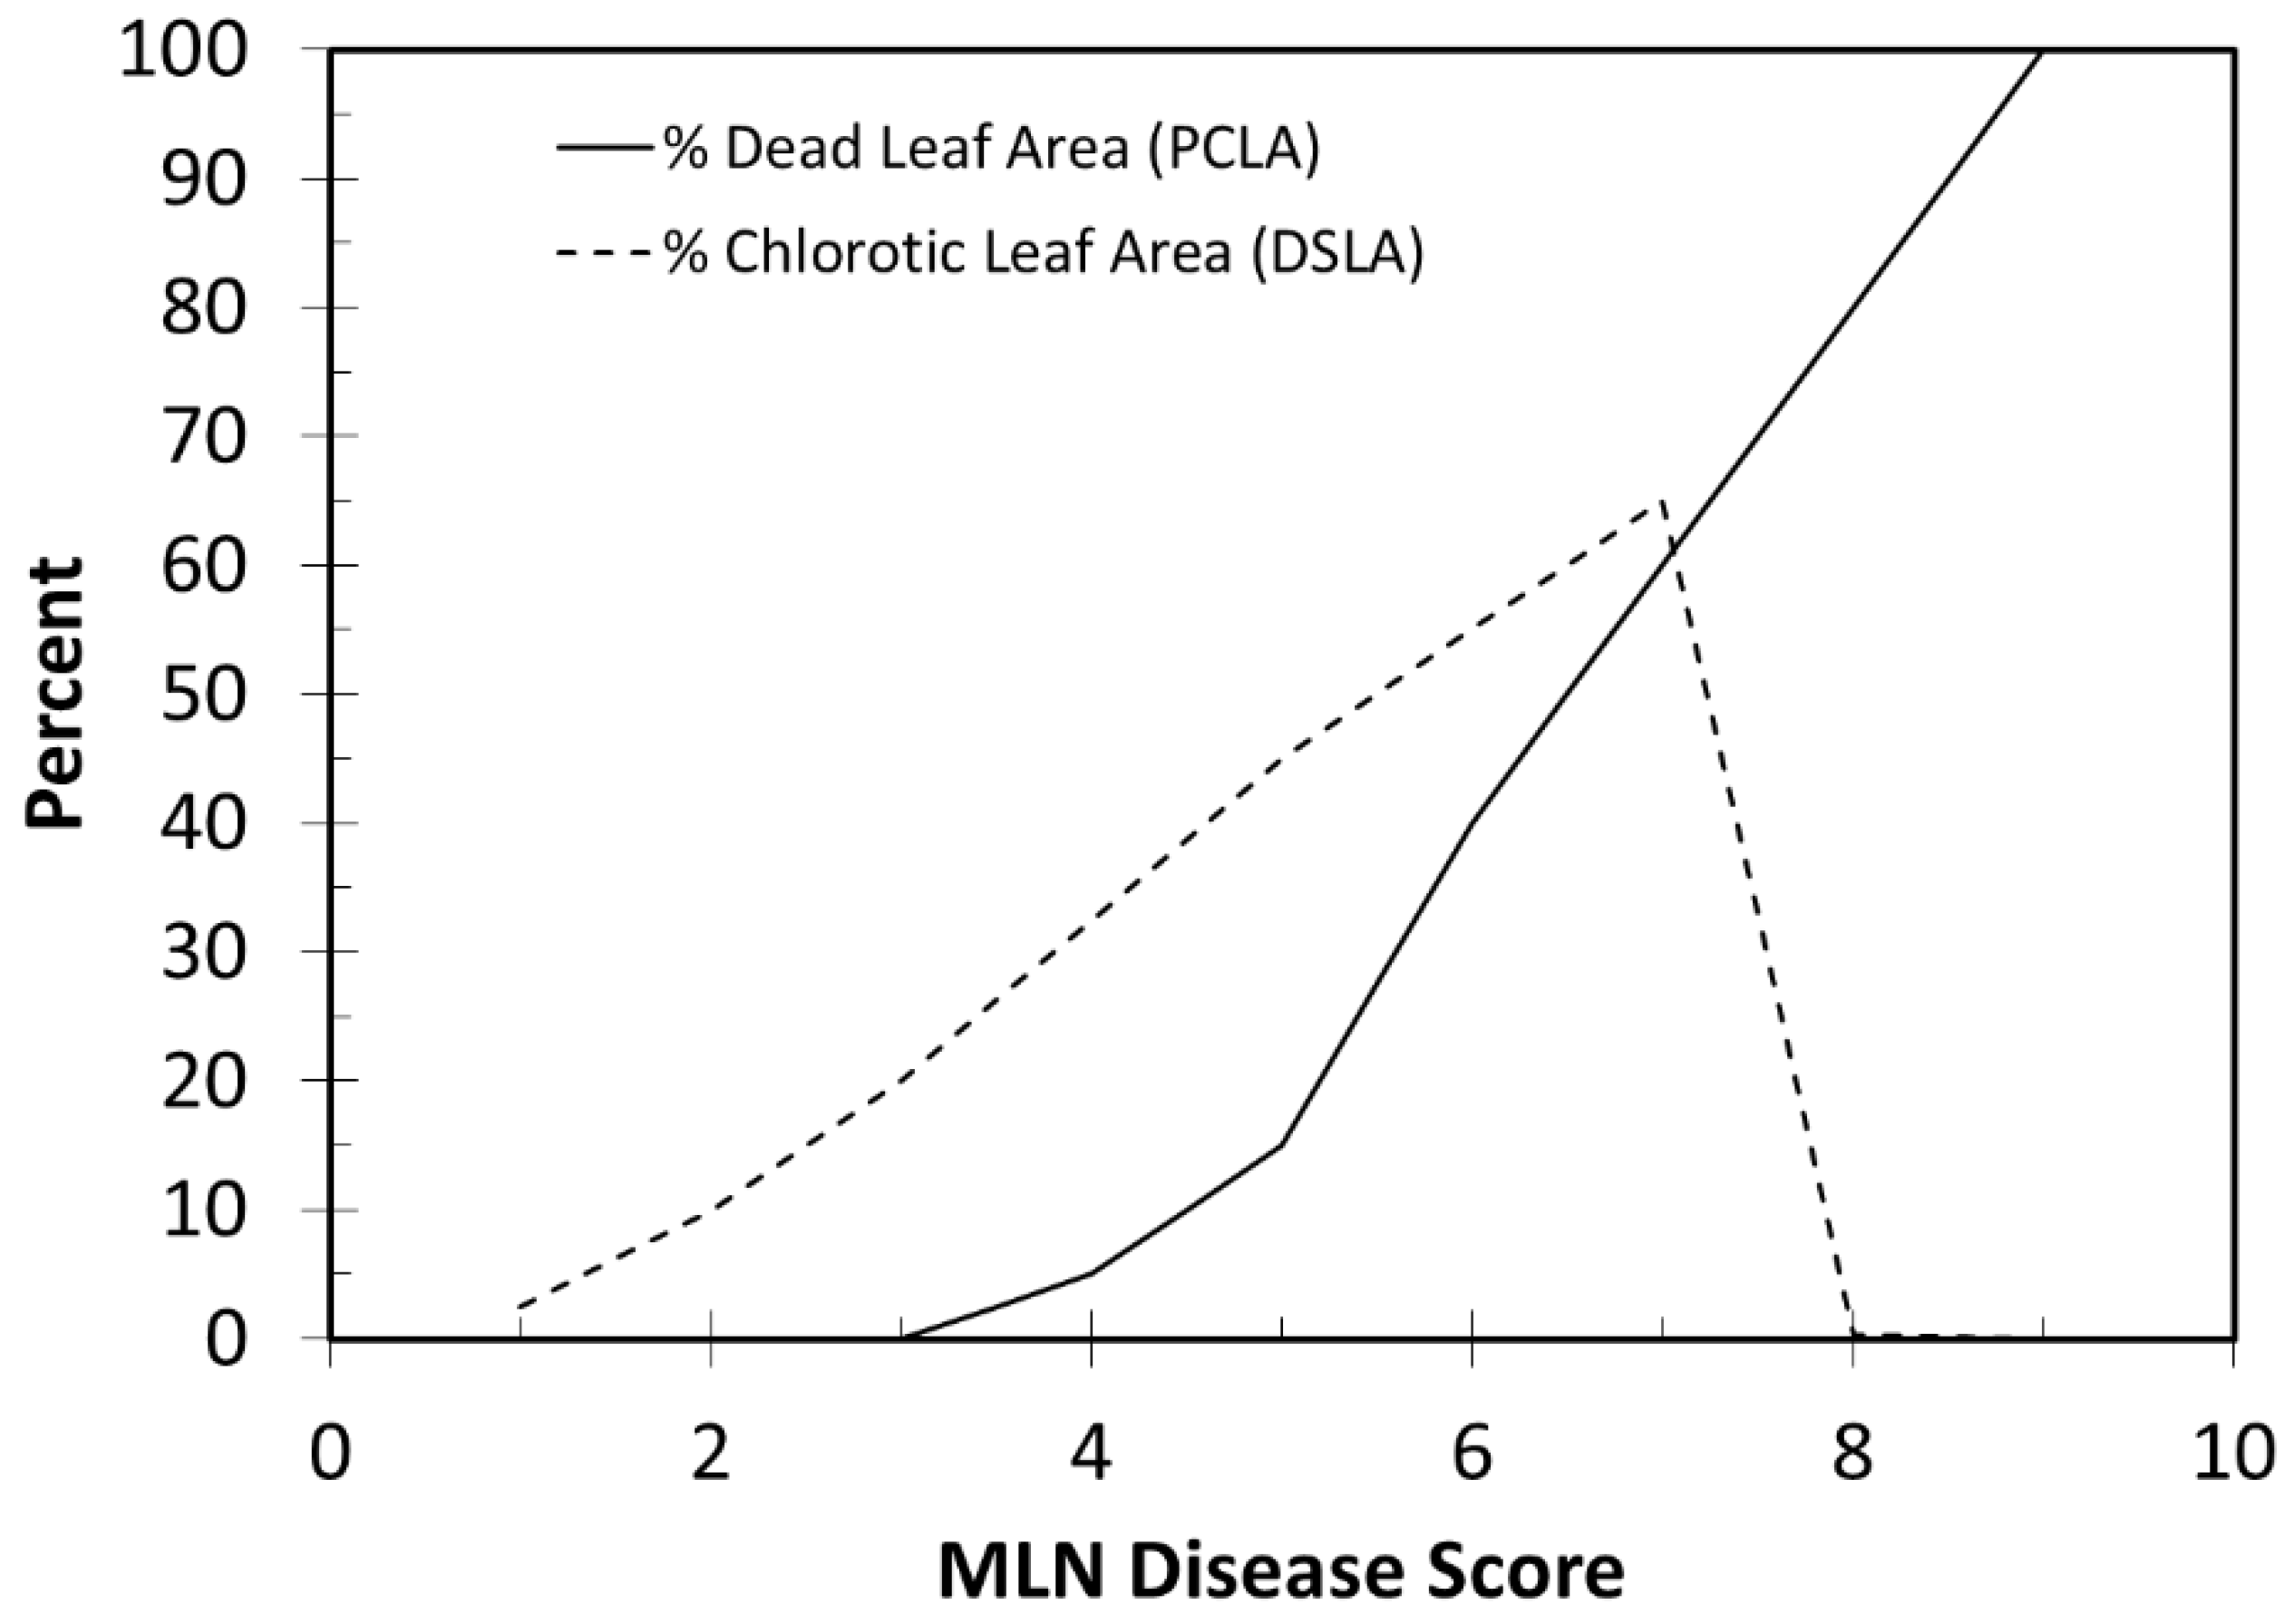
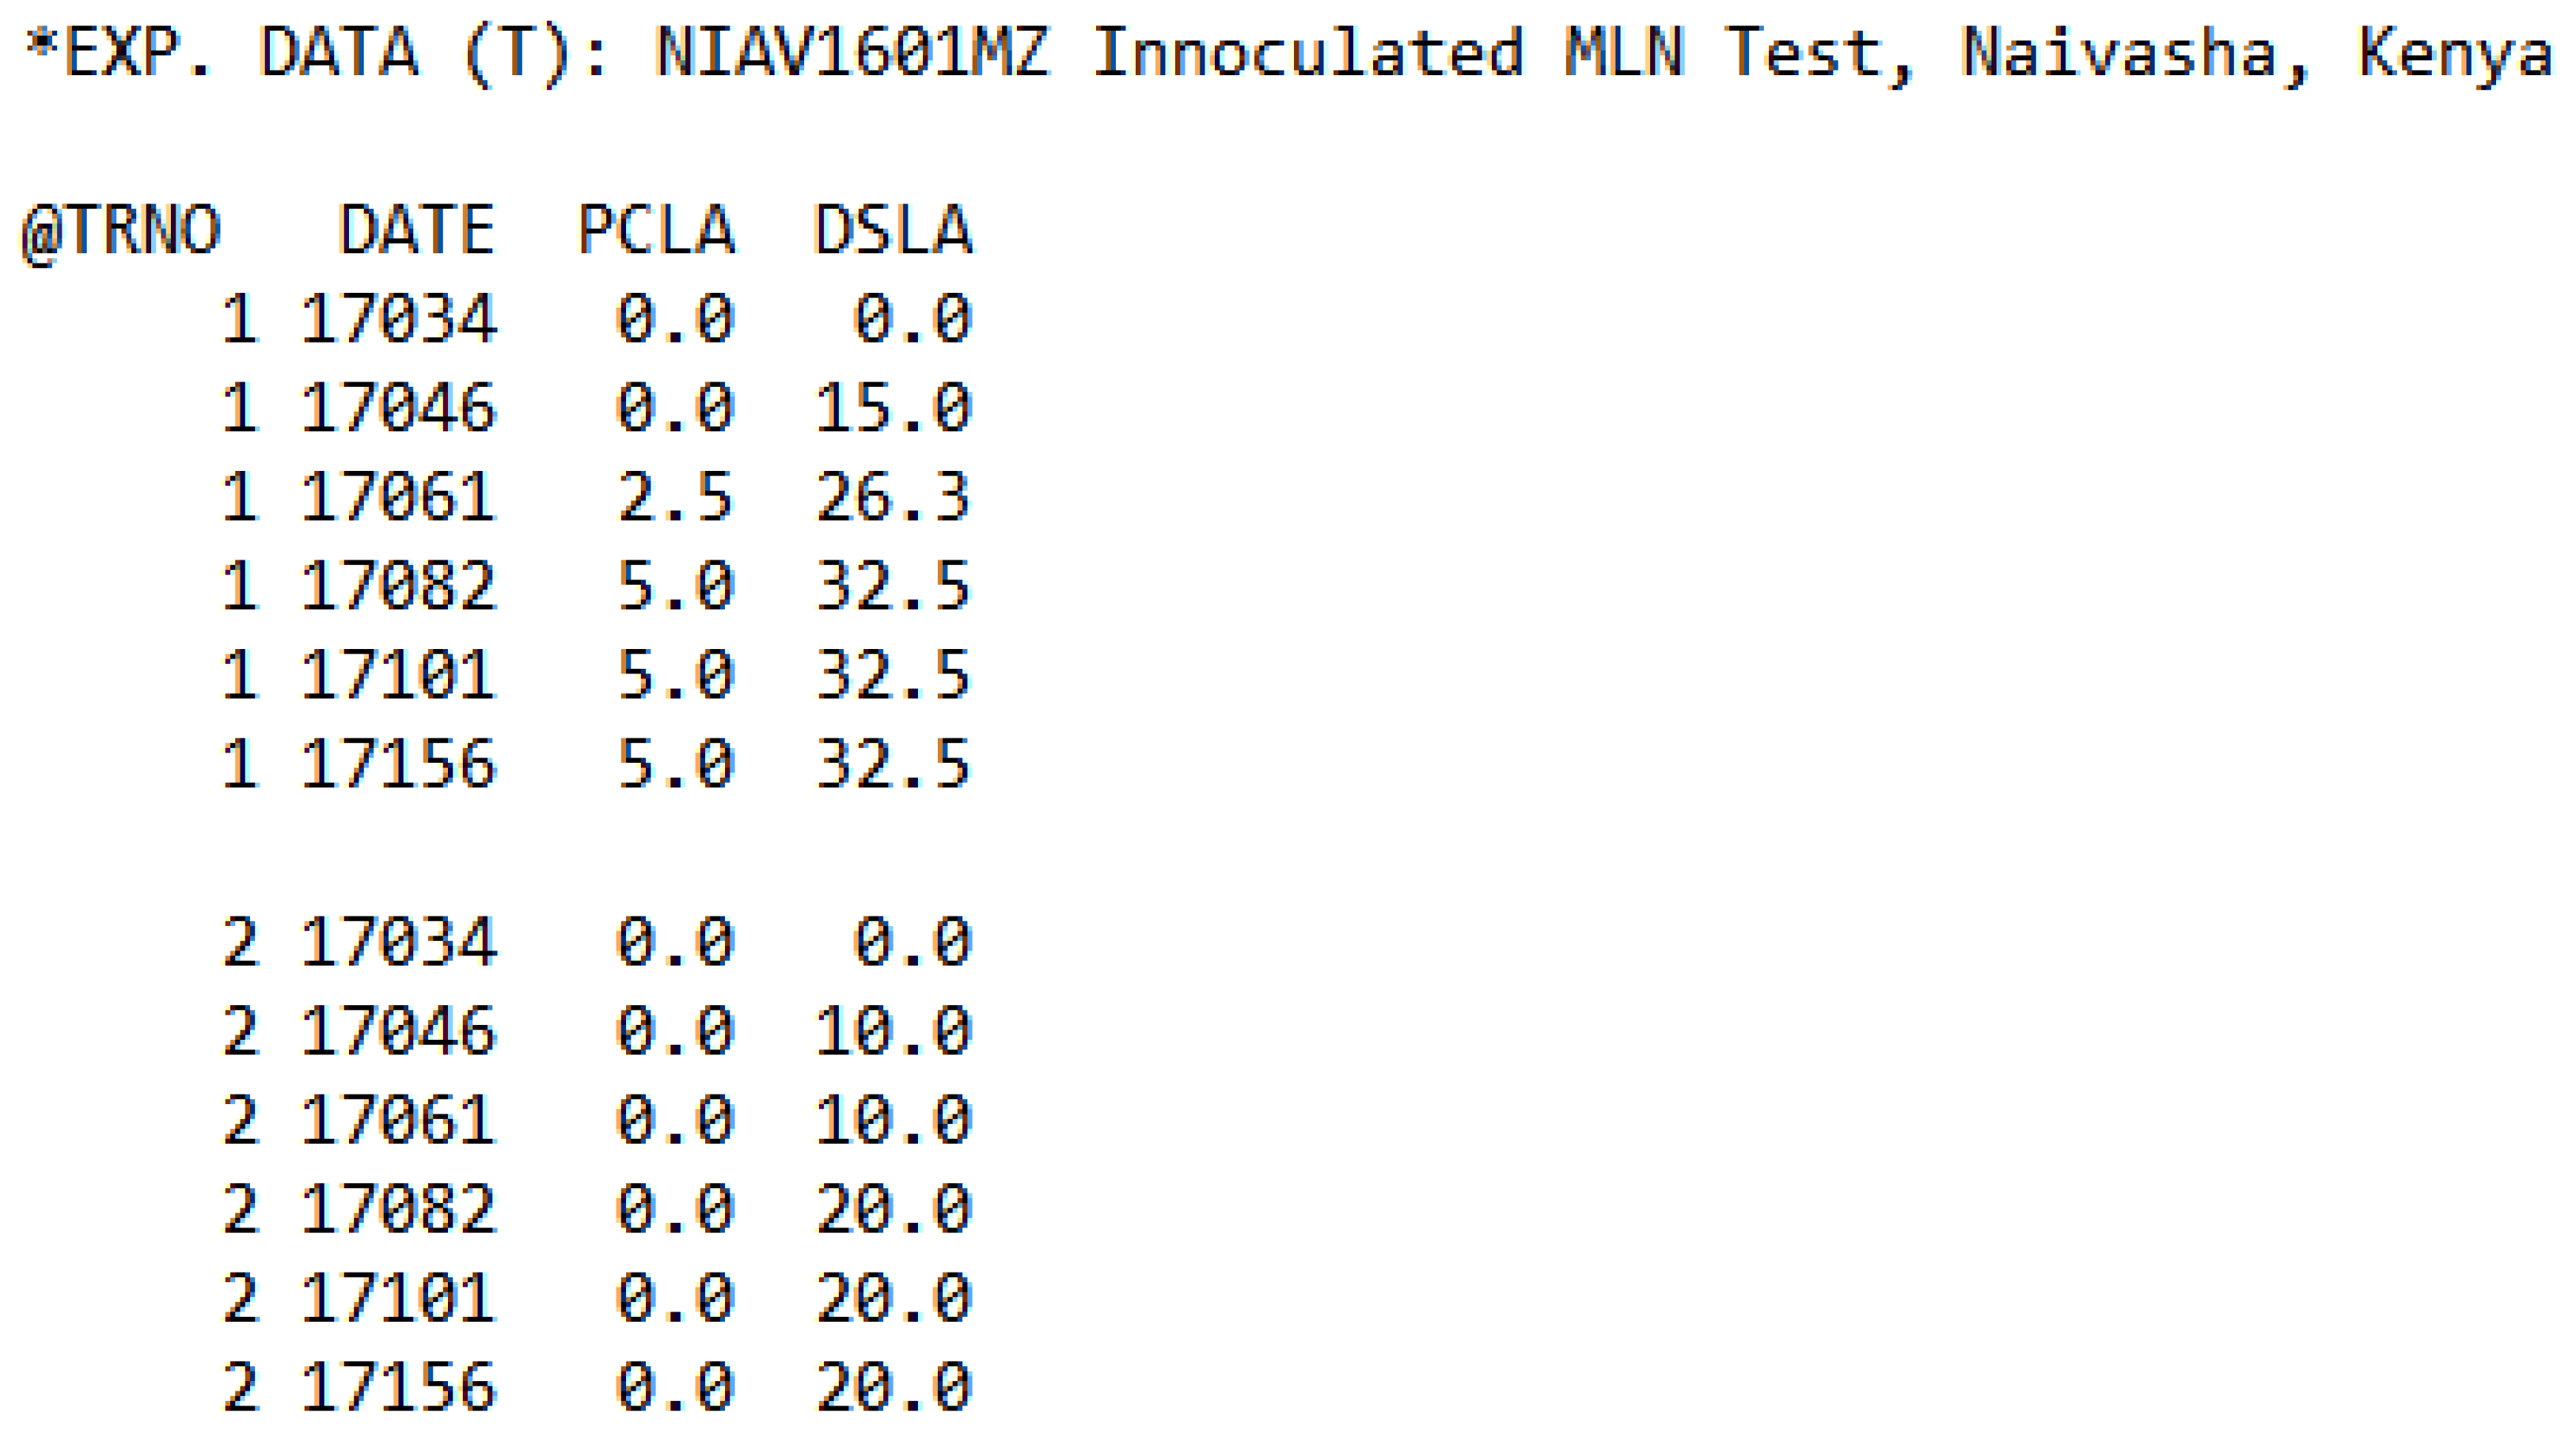
2.3. Converting Disease Scores to Percent Leaf Chlorosis and Percent Dead Leaf Area

The MLN disease score, on a scale of 1–9, is based on a combination of necrosis due to the disease, including dead leaf area. A mathematical relationship was developed to translate MLN disease scores into percent leaf chlorosis and percent dead leaf area (Figure 1). In this relationship, percent chlorotic leaf area increases linearly from 0% chlorosis at a disease score of 1.0 to 65% chlorosis at a disease score of 7.0. Percent chlorosis decreases to 0% above a disease score of 8.0 because, at that level, there is almost no green leaf area remaining on the plant. Percent dead leaf area increases from 0% at a disease score of 3.0 to 100% at a disease score of 9.0. This relationship is nonlinear between disease scores of 3.0–5.0, then follows a linear relationship from disease scores of 5.0–9.0. These relationships were used to convert observed disease scores into percent necrotic and/or dead leaf area to simulate disease damage in the crop model. These relationships are used to train technicians on how to score the disease severity.

2.4. Disease Damage Coupling Points

Pest damage coupling points were incorporated into the CERES-Maize model in the early 2000s and was made available in subsequent releases of DSSAT, including DSSATv4.7 [19] which was used in this research. Simulation of pest damage in CERES-Maize follows the same strategy used in the CROPGRO models outlined by Batchelor et al. [17]. Pest coupling points were defined for different types of damage that can reduce the daily rate and state variables in the model. Observed pest or disease damage levels are entered in the time series file (File T), which is read by the crop model, and converted into daily damage, which is applied each day to the desired state or rate variable. The model uses linear interpolation to compute daily damage rates between the observed damage dates entered in File T.
The percent cumulative leaf area damage (PCLA) type is defined in the pest definition file called MZCER470.PST. The time series observations of PCLA are entered in the DSSAT input time series file (File T) under the PCLA header (Figure 2). The value of PCLA on each observation date can be determined from the disease severity score in Figure 1. Each day during the season, the model reads pest damage from File T and determines how much chlorosis or necrosis to apply. Daily chlorosis or necrosis due to pest or disease damage (WLIDOT) is subtracted from the daily leaf area state variable (PLA) in the CERES-Maize model by:
P L A = P L A W L I D O T   P L A S E N L A L F W T P L T P O P
where PLA = plant leaf area, cm2 pl−1
  • WLIDOT = leaf loss due to pests or diseases, g m−2 d−1
  • SENLA = leaf senescence today, cm2 pl−1
  • LFWT = leaf weight, g pl−1
  • PLTPOP = plant population, no. m−2
The leaf weight state variable is adjusted in proportion to the amount of leaf area that is destroyed by:
L F W T = L F W T W L I D O T P L T P O P
Figure 1 also shows the relationship between observed MLN disease score and percent chlorosis. Daily percent chlorosis is defined in the CERES-Maize pest definition file as a daily percent reduction in photosynthesis, where percent chlorosis is applied as percent reduction in daily photosynthesis. Observed percent chlorosis is entered into the time series file using the DSLA (percent diseased leaf area) header (Figure 2). The model computes the diseased leaf area (DISLA, cm2 pl−1 d−1) based on DISLA and leaf area each day. Reduction in daily crop growth rate (CARBO) is computed by:
C A R B O = C A R B O [ 1 D I S L A P L A P L T P O P ]
where CARBO = daily biomass production, g pl−1 d−1
  • DISLA = reduction in photosynthesis due to pests, cm2 pl−1 d−1

2.5. Model Input Files

Daily weather data at the experimental site (Naivasha, Kenya) was not available. Daily temperature and solar radiation were obtained from the POWER database produced by NASA (www.larc.nasa.gov), which estimates daily maximum and minimum temperature and solar radiation on a 1° latitude and longitude grid around the world. Rainfall was not available in the POWER database, so daily rainfall data was obtained from the Weather Underground database (https://www.wunderground.com/). Potential error in rainfall was minimized because the experiment was well-irrigated. Soil data including lower limit, drained upper limit and saturated water holding capacity were obtained from the FAO world soil database. Management information including planting date, row spacing, population, and cultivars were available for each treatment. Model input files including soil, management and observed pest damage were created using data collected from the field experiment. Soil properties are shown in Table 2. MLN severity scores measured several times during the crop season were entered in the time series file for the model (Figure 2). Irrigation was set to automatic irrigation to eliminate water stress, which represented the strategy implemented in the field experiments. Nitrogen stress was turned off, representing sufficient N application to avoid N stress.

2.6. Model Calibration and Evaluation

Data from the non-inoculated treatment 2 in 2016 were used to estimate the genetic coefficients required for each of the 17 hybrids (Table 1). The coefficient P1 (thermal time from emergence to the end of the juvenile phase) and PHINT (degree days between successive leaf tip appearance) were calibrated to minimize error between simulated and observed leaf number and flowering date. The P5 coefficient (growing degree days from silking to maturity) was calibrated based on the estimated maturity date. Coefficients G2 (maximum possible kernels per plant) and G3 (kernel filling rate) were estimated to minimize the error between simulated and measured yield. Data from the 2016 and 2018 inoculated treatments (treatment 1) were used to evaluate the model.
Model performance for leaf number, flowering date and grain yield were evaluated using the correlation coefficient (R2), root mean square of error (RMSE), mean absolute error (MAE) and the Wilmott index of agreement (D-index).

3. Results

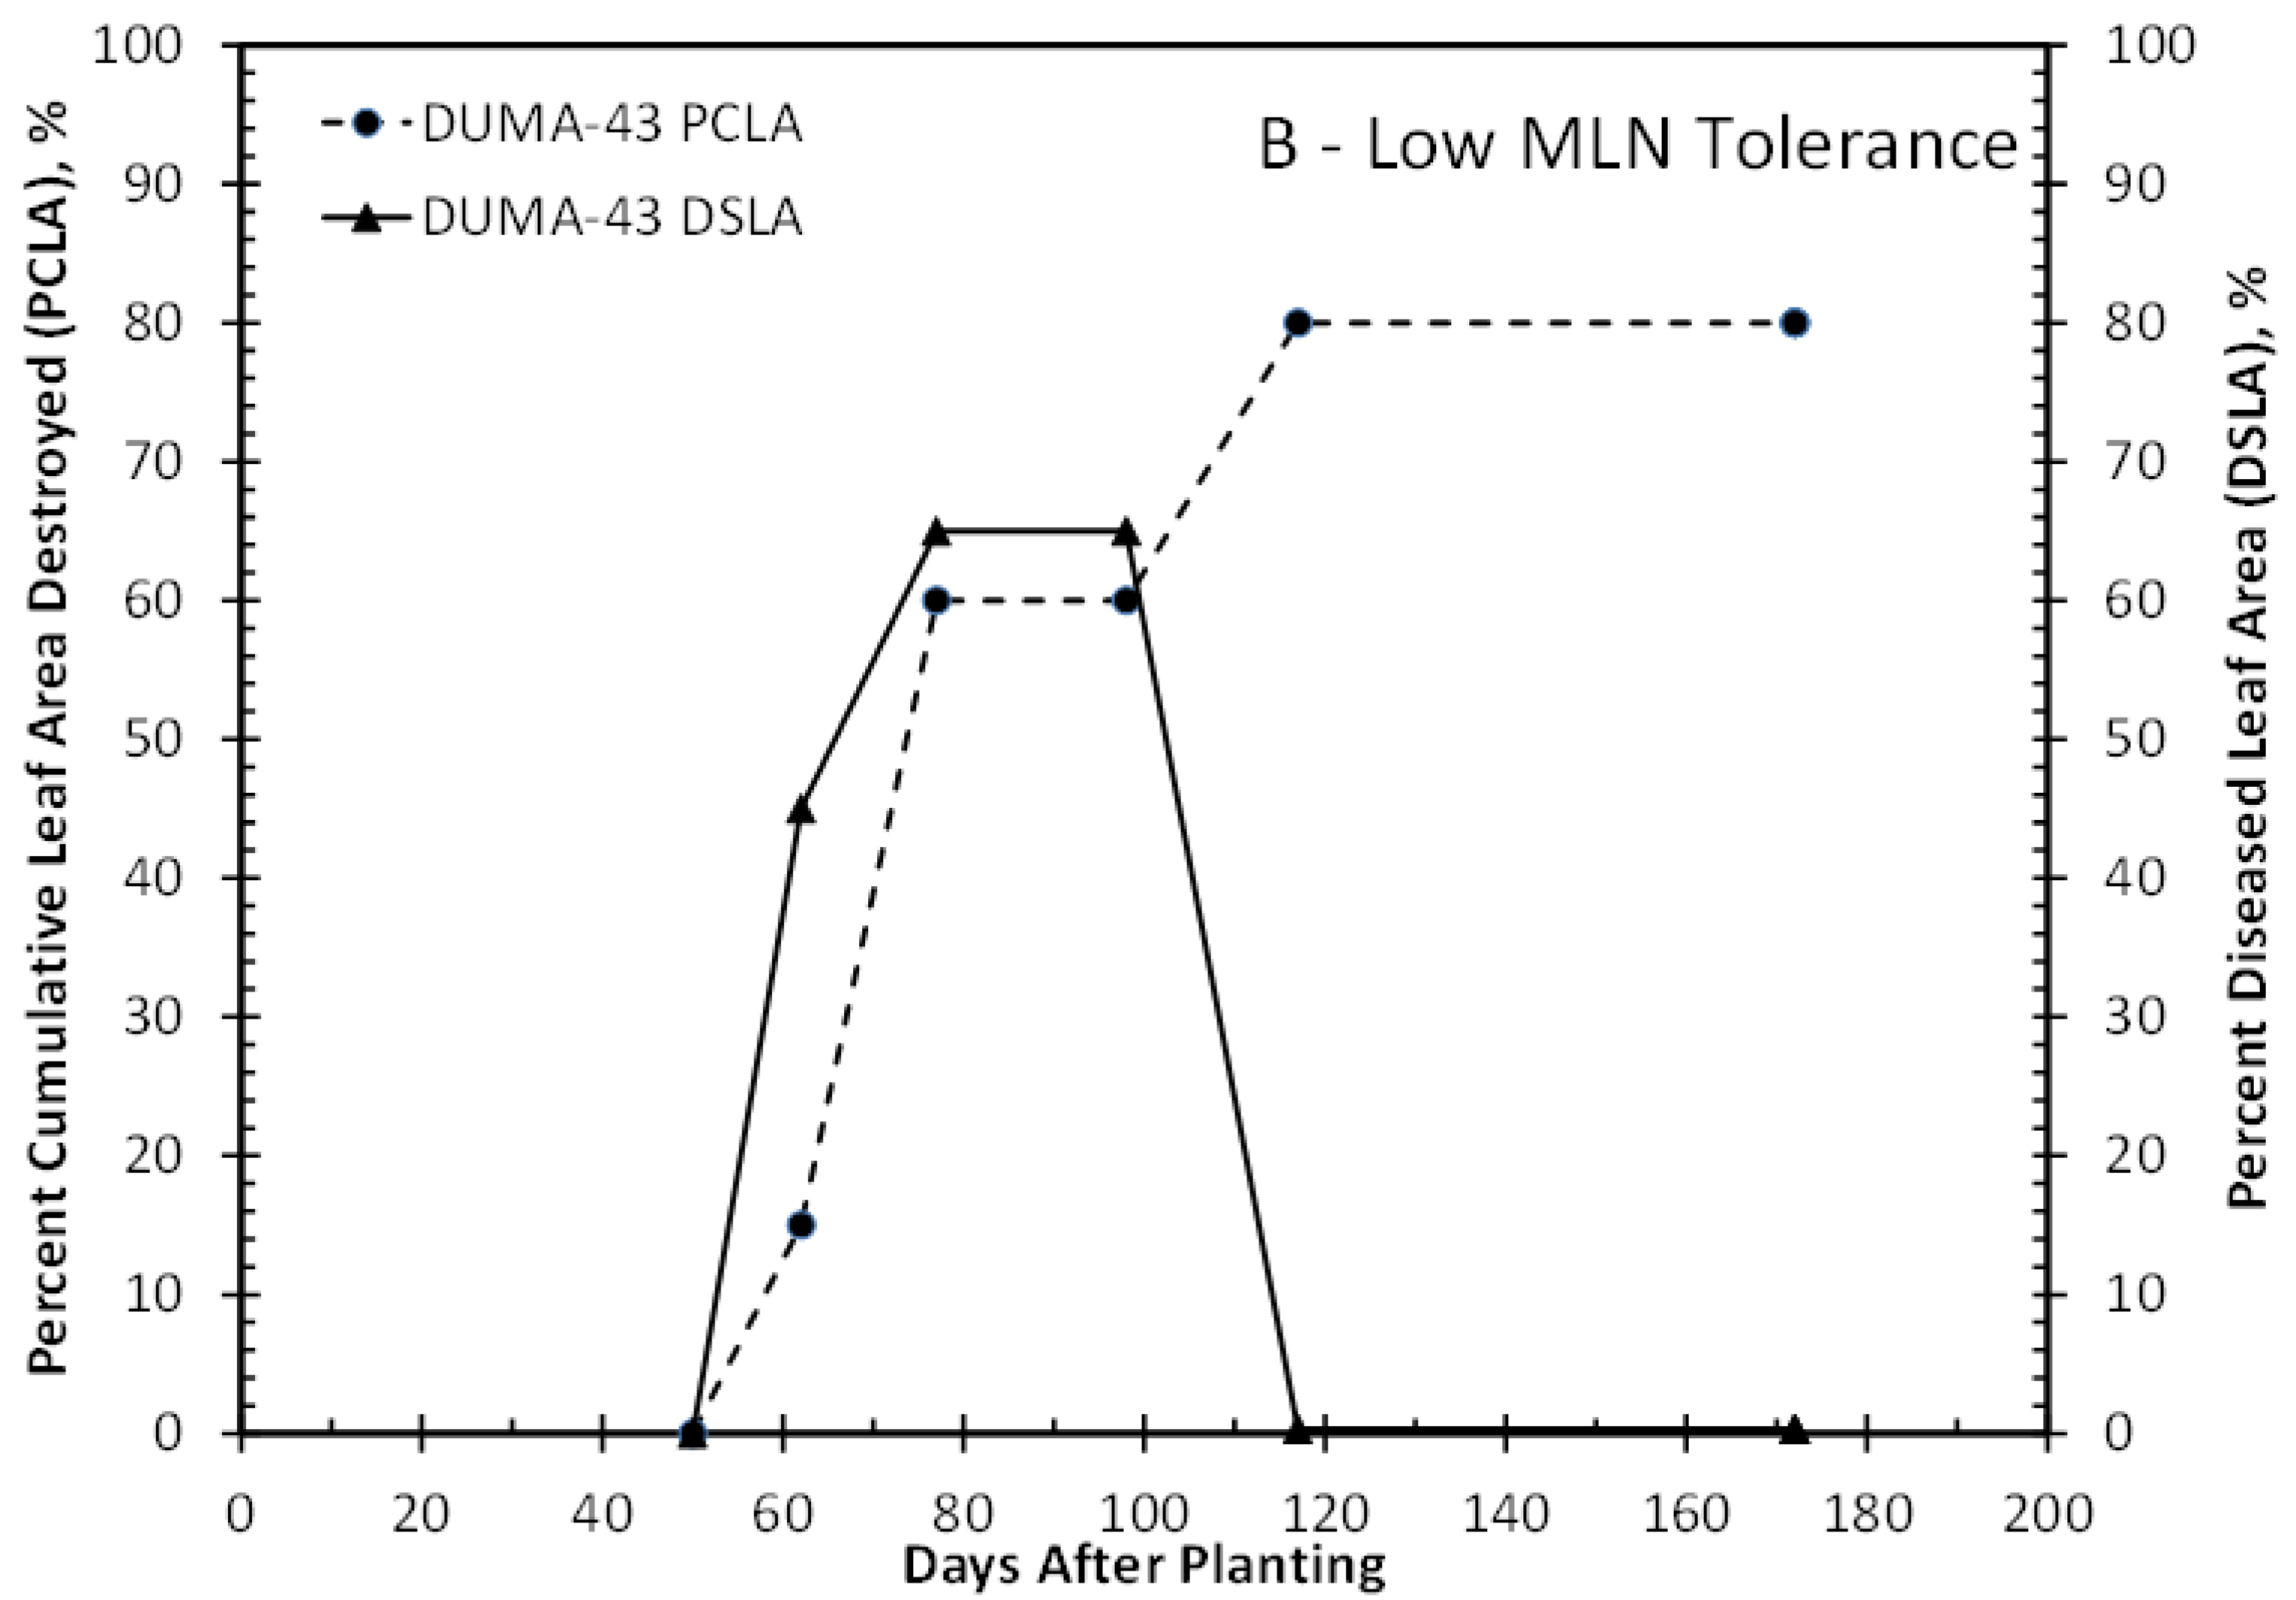
3.1. MLN Disease Severity

The area under the disease progress curve (AUDPC) was computed for each hybrid for both the calibration and evaluation treatments using the trapezoidal method. Figure 3 shows the AUDPC for the 17 selected maize hybrids ranked from high MLN tolerance to low MLN tolerance (or high susceptibility to MLN) based on the 2016 calibration treatment. The AUDPC ranged from a low of 136 for hybrid CKMLN150072 to a high of 422 for the MLN-susceptible hybrid check, PHB3253. There was a large range in disease incidence levels across the hybrids and years. Hybrids with large AUDPC values either died prematurely due to severe disease damage or resulted in very low grain yields. Hybrids with lower AUDPC values had lesser disease damage and higher grain yields.
Disease scores were converted into percent cumulative leaf area destroyed (PCLA) and percent chlorotic leaf area (DSLA) using the relationships shown in Figure 1. Both PCLA and DSLA are required inputs for the crop model to simulate disease damage. Figure 4A shows an example of PCLA and DSLA for CKMLN1500073, an MLN tolerant hybrid for the 2016 calibration treatment. There was no observed dead leaf area, and the maximum chlorosis was only 20%. Figure 4B shows the values for PCLA and DSLA for DUMA-43, an MLN-susceptible hybrid check. Significant dead leaf area and chlorosis were observed in this hybrid, with a maximum dead leaf area of 80% and maximum diseased leaf area of 68%. This damage resulted in either premature plant death or very low grain yield.

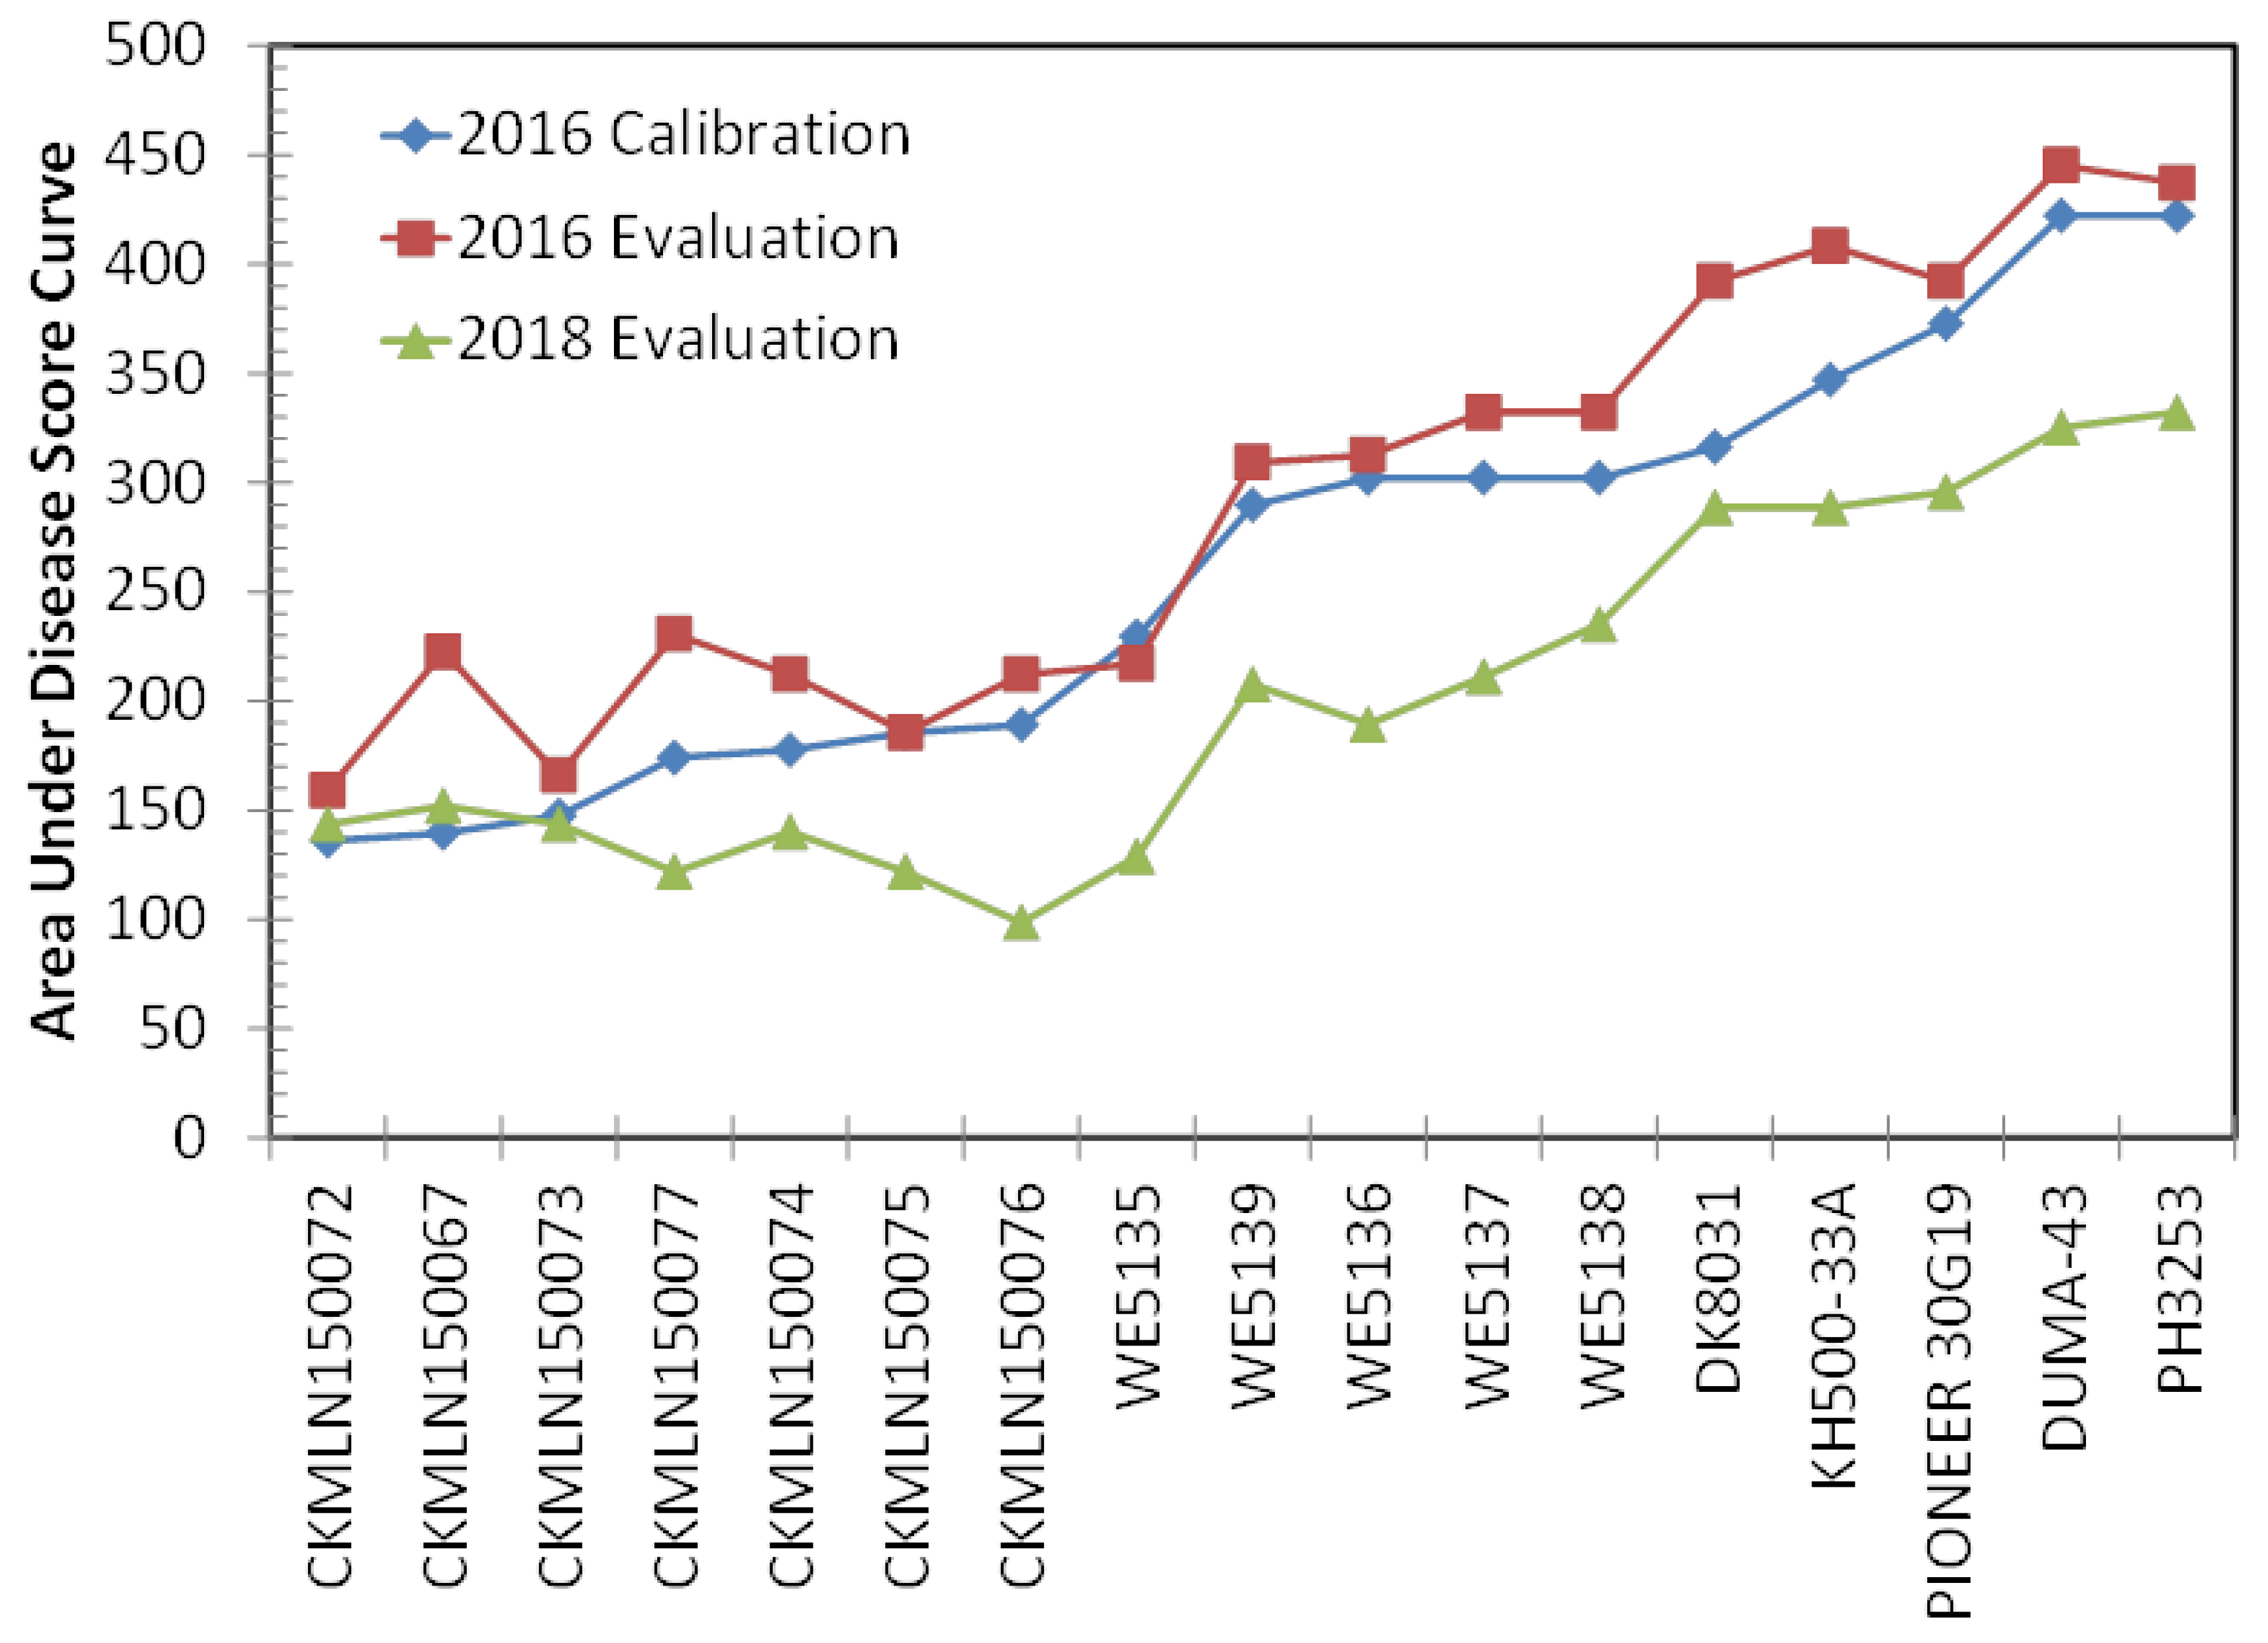
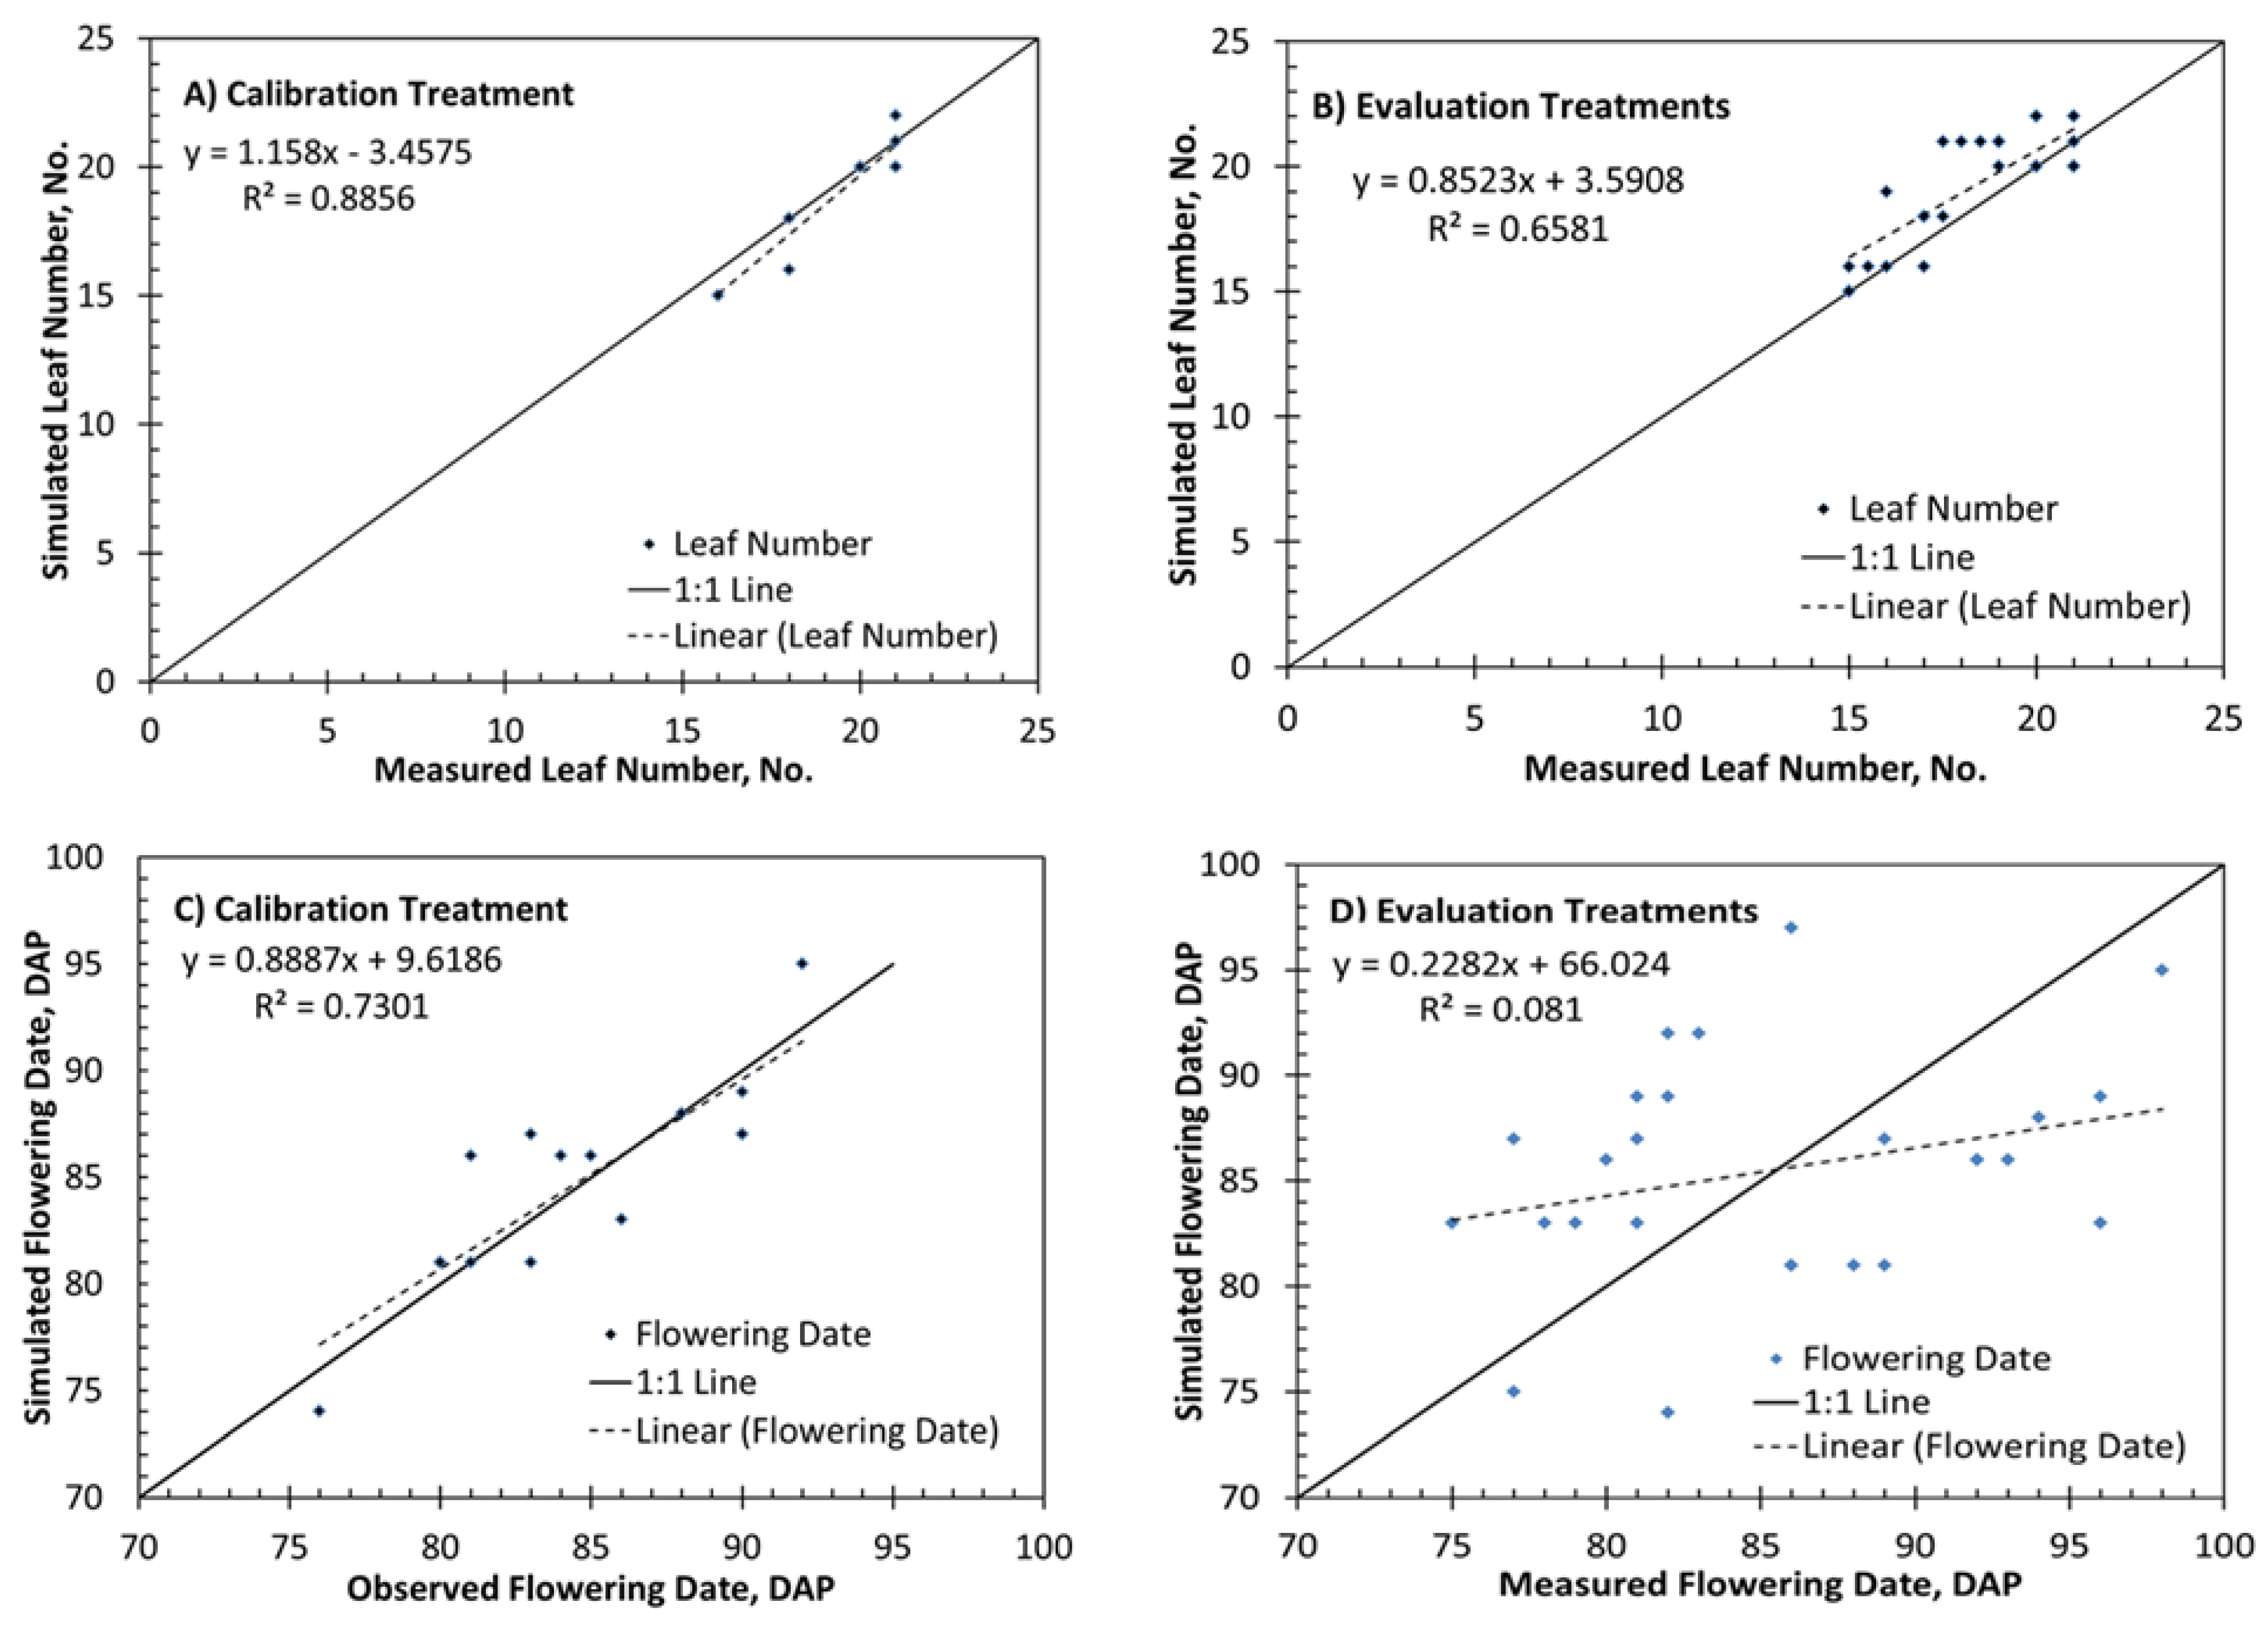
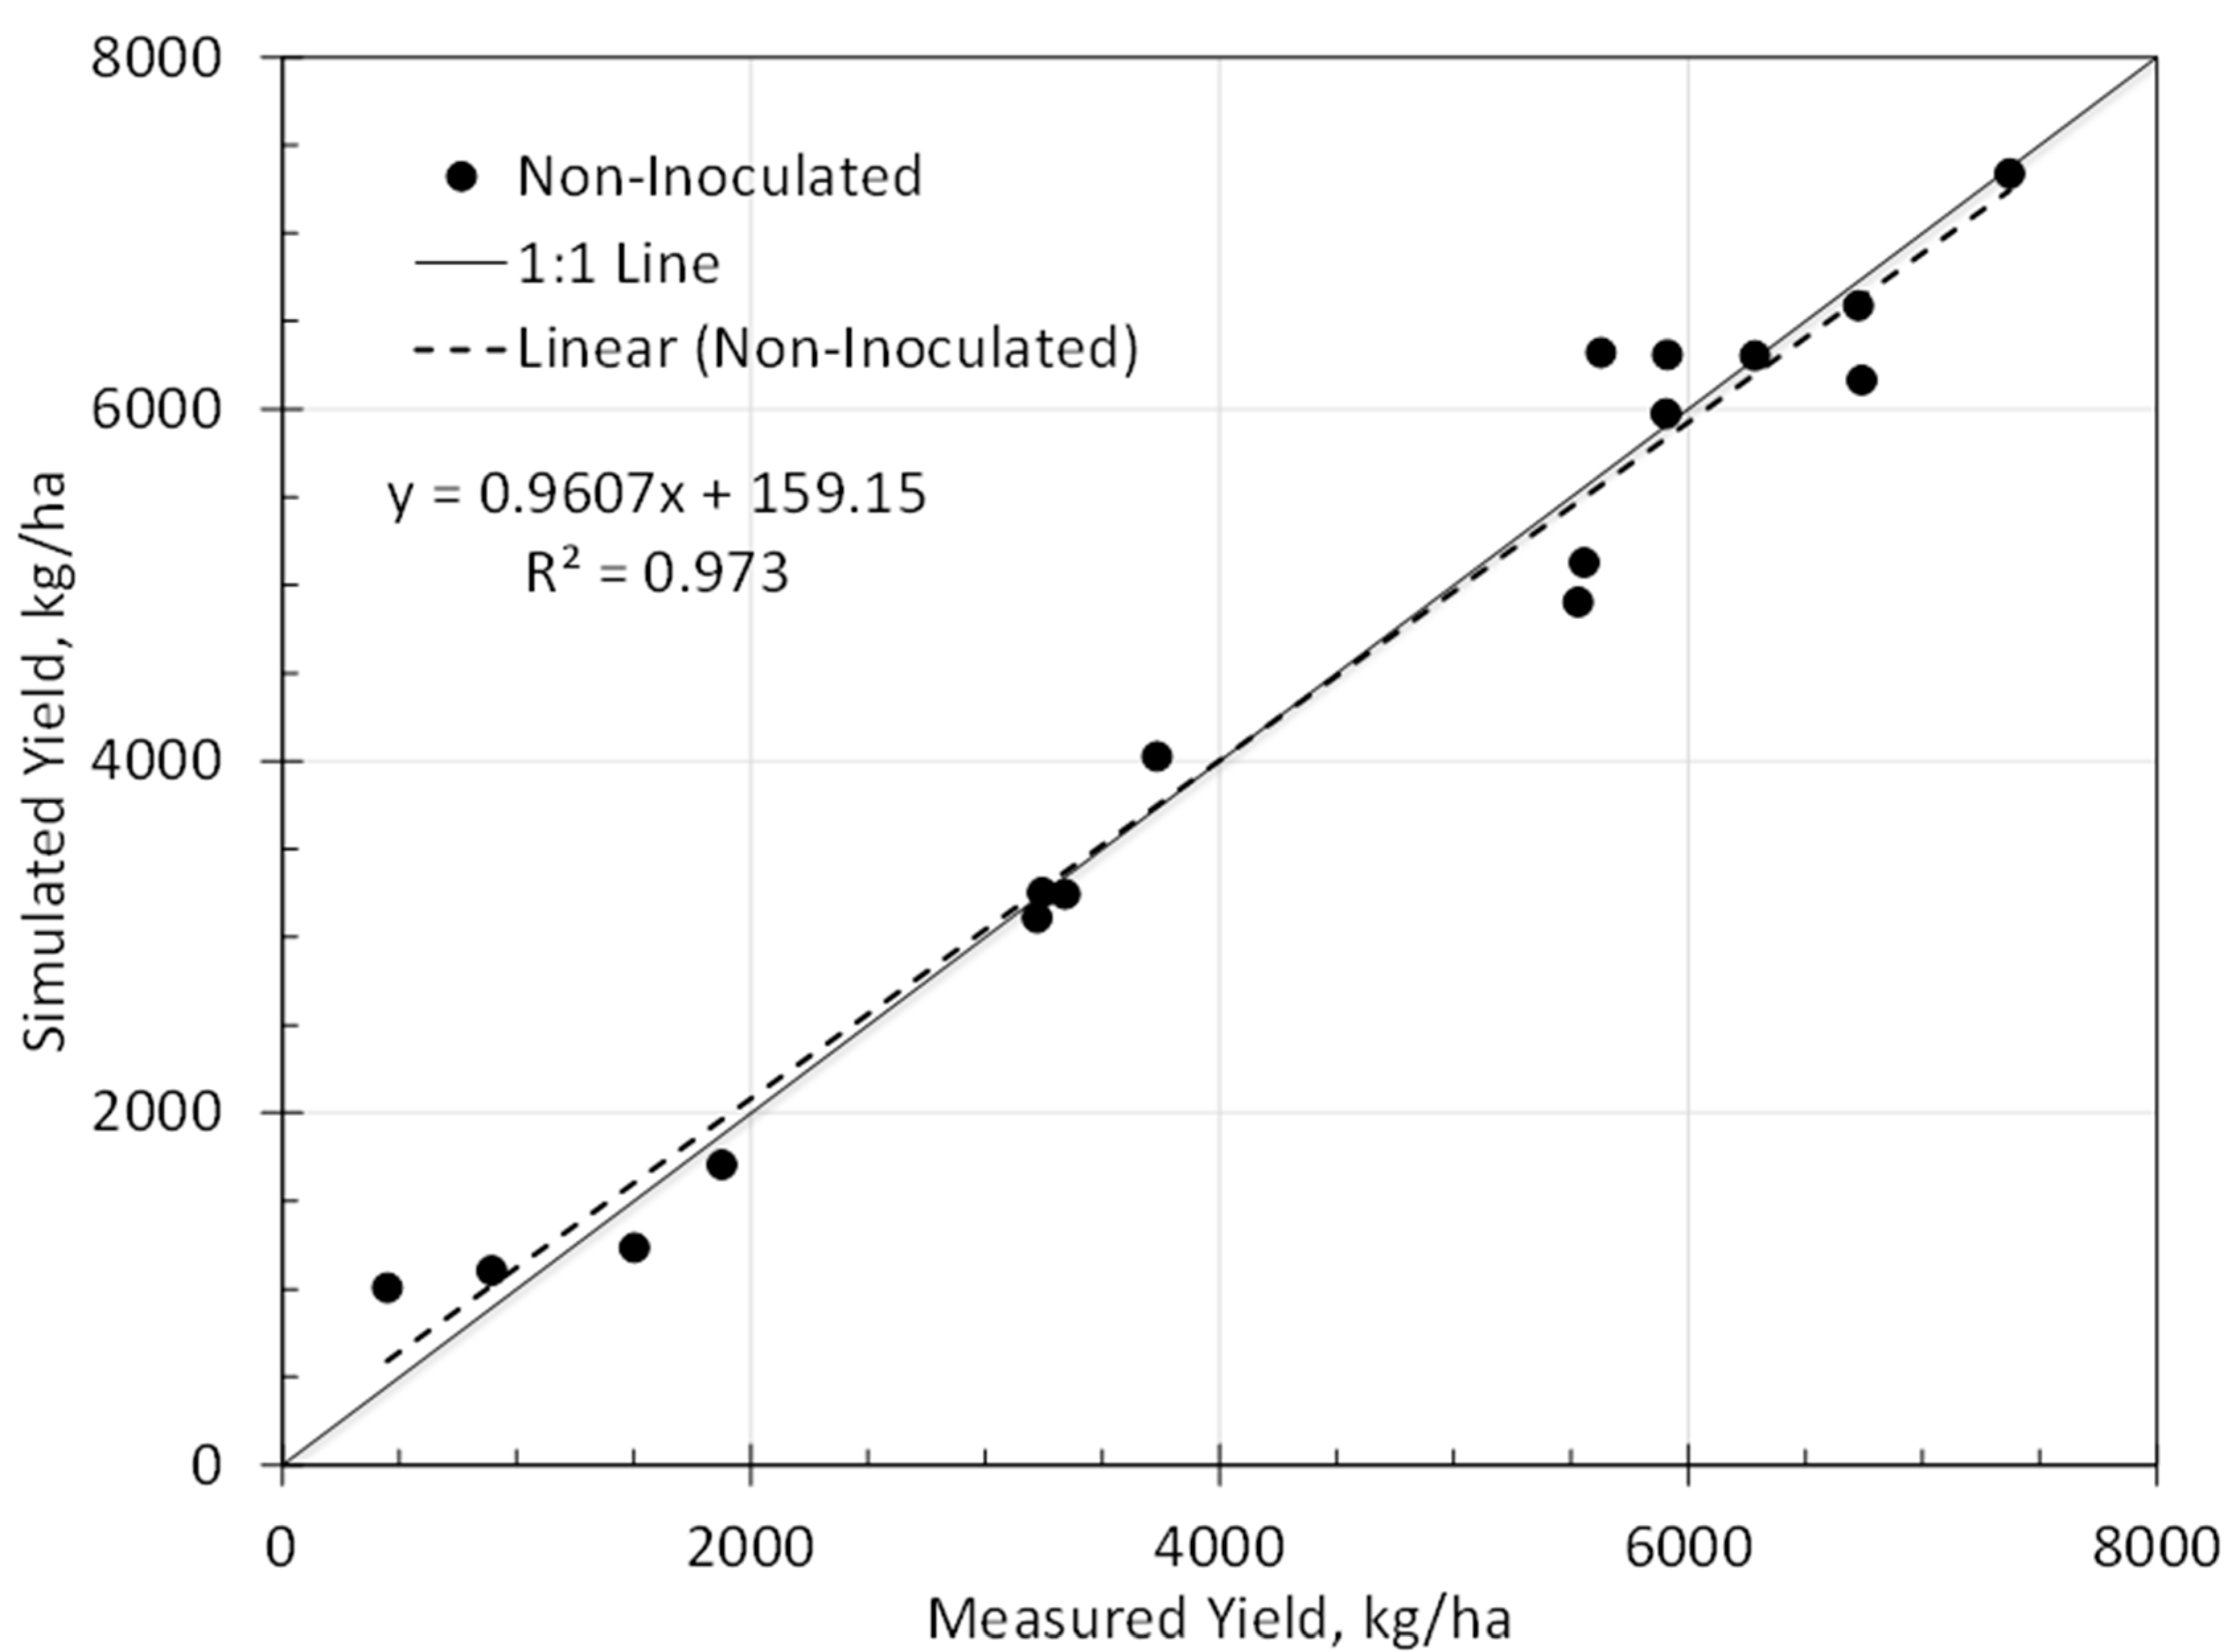
3.2. Model Calibration

The CERES-Maize model distributed in DSSAT v4.7 was calibrated using the 2016 non-inoculated treatment. While this treatment was not inoculated with MLN, it experienced high levels of MLN as demonstrated by the AUDPC levels shown in Figure 3 for MLN-susceptible hybrids. Time series MLN scores were converted to PCLA and DSLA time series inputs for the crop model. The treatments were well-irrigated and fertigated, to eliminate any possibility of water or nutrient stress. Thus, calibration focused primarily on genetic coefficients required to describe the difference in phenology and growth characteristics of different hybrids. Table 1 shows the genetic coefficients that gave the best fit between simulated and observed leaf number, flowering date and grain yield for each hybrid in the calibration treatment.
The coefficients P1 (thermal time from seedling emergence to end of juvenile phase) and PHINT (phylochron interval) were adjusted to minimize error in simulated leaf number. Figure 5A shows the simulated and observed leaf number for the 17 hybrids. The model gave good estimates of leaf number, with an R2 of 0.89, RMSE of 0.84 leaves and an MAE of 0.59 leaves. The Wilmont index of agreement (D-statistic) was 0.95. These statistics indicate that the model calibration agreed well with the observed leaf numbers. The same genetic coefficients, P1 and PHINT, were also adjusted to minimize error between simulated and observed flowering date for each hybrid. Figure 5C shows the simulated and observed flowering date. The flowering date was simulated reasonably well, with an R2 of 0.73 and an RMSE of 2.4 days (Table 3). The mean absolute error was 1.9 days and the D-statistic was 0.99 across all hybrids. These statistics indicated that the phenology calibration was good, given the limited number of parameters available to adjust both leaf number and flowering date.
The parameter P5 (thermal time from silking to physiological maturity) was adjusted to match the reported maturity date for each hybrid. The coefficients G2 (maximum possible number of kernels per plant) and G3 (kernel filling rate, mg day−1) were adjusted to obtain the minimum error between simulated and measured yield for each hybrid (Table 1). The P5 parameter ranged from 650 to 750, with many hybrids requiring 700 growing degree days (GDD) from silking to maturity. The G2 parameter ranged from 100 kernels plant−1 for low yielding local hybrids to 650 kernels plant−1 for higher-yielding MLN tolerant hybrids. The G3 coefficient had a limited range of 6.0–6.5 mg d−1 across all hybrids.
Figure 6 shows simulated and observed yield for the calibration treatment and 17 hybrids. Observed yields ranged from 448 kg ha−1 for DUMA-43, which is highly susceptible to MLN, to a high of 7371 kg ha−1 for CKMLN150077, which is an MLN resistant hybrid. The model gave good estimates of observed yield, with an R2 of 0.97 and an RMSE of 355 kg ha−1. The mean absolute error was 277 kg ha−1 and the D-statistic was 0.99. These statistics indicate that the model performed well in simulating observed grain yields using the calibrated genetic coefficients for each of the 17 hybrids. The model also performed well in simulating damage due to MLN using damage applied to the chlorosis and dead lead area coupling points from the observed disease damage observations.

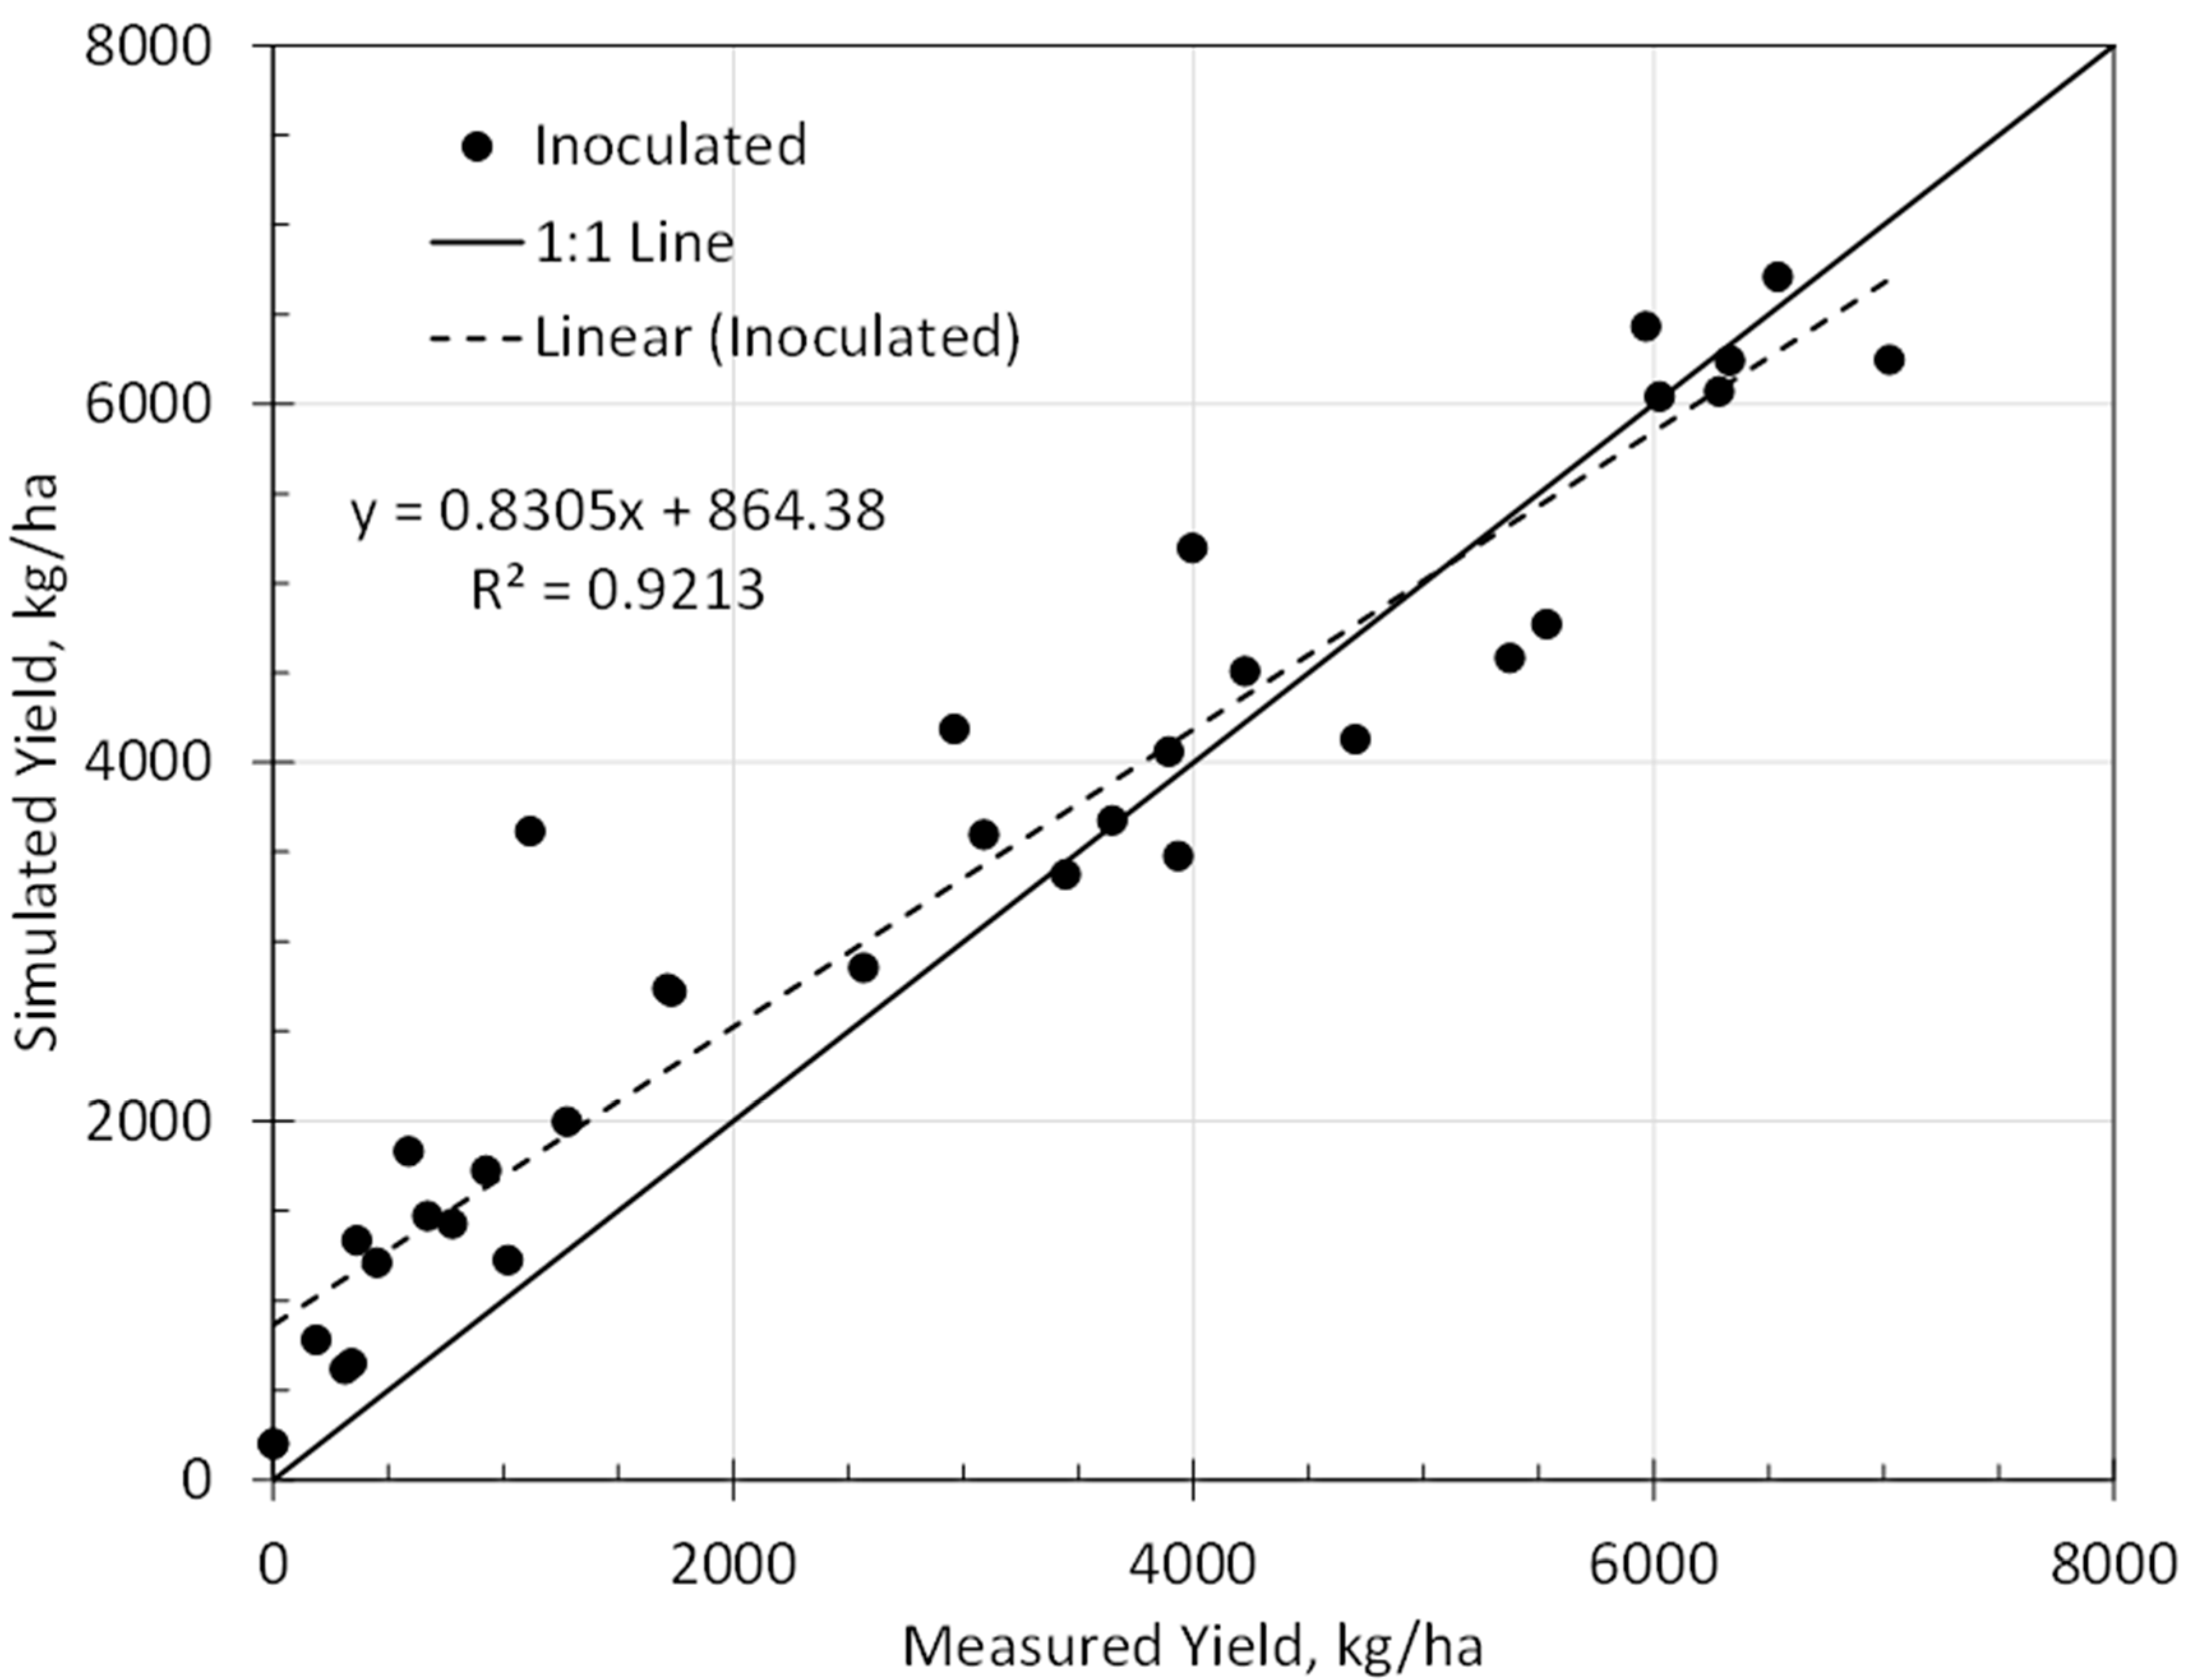
3.3. Model Evaluation

Data from the inoculated treatments for 2016 and 2018 were used to test the calibrated model using genetic coefficients shown in Table 1 and time series observations of MLN damage. Figure 5B shows the simulated and observed leaf number for the evaluation treatments. Overall, the model tended to simulate to many leaves. In 2016, the model simulated the correct leaf number for eight hybrids and simulated one leaf up to many for nine hybrids. The maximum difference between simulated and observed leaf number in the 2016 treatment was one leaf. This was expected since the 2016 non-inoculated treatment was used to estimate the genetic coefficients. In 2018, the model had a 0–1 leaf error for six hybrids, a 1–2 leaf error for seven hybrids, and a 2–3.5 leaf error for four hybrids. Overall, the model gave an R2 of 0.65 and a RMSE of 1.5 leaves. The mean absolute error was 1.1 leaves and the D-statistic was 0.86.
Figure 5D shows the simulated and observed flowering date for the 2016 and 2018 evaluation treatments. There was generally more error in simulating flowering date than leaf number or grain yield. However, errors in total leaf numbers influence the simulated flowering date. There was no correlation between simulated and observed flowering date, with an R2 of 0.08 and a D-statistic of 0.55. However, the RMSE was 7.1 days and the mean absolute error was 6.6 days, providing a reasonable estimate of flowering date. More robust data from multiple seasons or locations would likely improve the model calibration.
Figure 7 shows simulated and observed grain yields for the evaluation treatments in 2016 and 2018. Yields ranged from a low of 0 kg ha−1 for Duma-43 and PHB3253, which are highly susceptible to MLN, to a high of 9084 kg ha−1 for WE5138, an MLN tolerant hybrid. MLN pressure was high for both treatments, and hybrids with high MLN tolerance gave much higher grain yields as expected than hybrids with low or no MLN tolerance. This was evident in the AUDPC (Figure 3). Overall the model gave excellent simulations of grain yield, with an R2 of 0.92 and an RMSE of 773 kg ha2. The mean absolute error was 600 kg ha−1 and the D-statistic was 0.97. The model tended to overestimate yields for low-yielding hybrids. This may indicate that other factors, such as premature plant death or ear losses that were not considered in this approach may further reduce yields for highly susceptible hybrids. Overall, the model simulated the impact of MLN damage on grain yield very well.

4. Discussion

This work provides an example of how to simulate disease damage using the CERES-Maize model. The main objective of this work was to determine if the CERES-Maize model could simulate the impact of MLN damage on maize yield. The field experiments in 2016 and 2018 were located at the CIMMYT-managed MLN Screening Facility at Naivasha, Kenya, where maize germplasm is routinely screened against the disease under artificial inoculation. The 17 selected hybrids have a range of responses against MLN, including high levels of resistance to high susceptibility. The high levels of MLN incidence in the MLN-susceptible controls in both years indicated that the experimental site was well-suited to calibrate and evaluate the simulation of disease damage using CERES-Maize.
The key to simulating disease damage in the crop model is to develop a method to convert disease scores or ratings into damage to specific coupling points in the crop model that have been predefined in the MZCER047.PST file [23]. In this case, MLN damage was determined to impact leaf area and create leaf chlorosis, which impacts the daily photosynthesis rate. A relationship was developed to convert disease scores estimated for MLN by technicians into percent leaf chlorosis. Observed damage to leaf area and leaf chlorosis was entered in the model input files and was integrated into model runs when estimating genetic coefficients for the calibration treatment. Thus, plant damage due to MLN was incorporated into the calibration process because MLN damage occurred on all the 17 hybrids in varying degree. Good results were obtained in simulating leaf numbers, flowering date and grain yield through the calibration process. When these genetic coefficients were used to simulate the evaluation treatments, good results were obtained for leaf number and grain yield. However, flowering date was not simulated as well, especially for the year 2018, and therefore was not used for estimating genetic coefficients. Flowering date is often difficult to simulate when only one season of data is used to estimate genetic coefficients. More years or locations would certainly increase the robustness of genetic coefficients and would likely give more accurate simulations in other environments.
The model can be used to estimate the impact of MLN on maize grain yield. Figure 8 shows the grain yield loss due to MLN damage for the calibration treatment. The model was run with and without MLN damage, and percent grain yield loss due to MLN was computed. Losses ranged from a low of 5% for CKMLN150075 to a high of 73% for Duma 43 (susceptible control). The average grain yield loss due to MLN for the two evaluation treatments is also shown in Figure 8. Yield loses ranged from a low of 10% for CKMLN150076 to a high of 100% for Duma 43 and PH3253. Yield losses for individual maize hybrids varied between the calibration and evaluation treatments because MLN damage was different, especially in the 2018 season. Using this approach, maize breeders can potentially estimate the value of incorporating disease diseases resistance traits in breeding pipelines.
This work was performed under well irrigated conditions with sufficient nitrogen. There were likely no interactions between disease stress and water or nutrient stress under these conditions. More testing should be performed under water and nutrient limiting conditions often found in Africa to determine if the method implemented in the CERES-Maize model properly accounts for interactions between water, nutrient and disease stress.

5. Conclusions

This work demonstrated the concept of using time series observed disease progress scores to simulate the impact of leaf necrosis and death due to MLN disease on maize yield. This concept was demonstrated with data collected from a field experiment with 17 selected maize hybrids with varying levels of MLN tolerance or susceptibility, and under MLN inoculated and non-inoculated treatments. Data from the non-inoculated treatment was used to calibrate genetic coefficients for each hybrid, and data from the MLN inoculated treatment was used to test the model. Overall, the model performed well in simulating the impact of MLN damage on maize grain yield. The model gave an R2 of 0.97 for simulated vs. observed yield for the calibration (non-inoculated) treatment, and an R2 of 0.92 for the evaluation (inoculated treatment) treatments. Simulation techniques developed in this project can be potentially transferred to other maize diseases. The key to simulating other diseases is to develop appropriate relationships between disease severity ratings and percent leaf chlorosis and cumulative dead leaf area.

Author Contributions

Conceptualization, Y.B. and G.K.; Formal analysis, X.Z.; Investigation, W.D.B., L.M.S. and M.W.; M.L.M. Suresh and B.P.; Project administration, L.M.S.; Writing—original draft, W.D.B. and L.M.S.; Writing—review & editing, X.A., Y.B., G.K. and B.P. All authors have read and agreed to the published version of the manuscript.

Funding

This work was supported by various projects, including: a) Breeding for MLN Resistance Project, funded by the Bill & Melinda Gates Foundation (BMGF; OPP1088115) and the Syngenta Foundation for Sustainable Agriculture; b) the CGIAR Research Program on Maize (MAIZE); and c) the National Institute of Food and Agriculture, U.S. Department of Agriculture, Hatch project ALA014-1-16016. MAIZE receives Windows 1 & 2 support from the Governments of Australia, Belgium, Canada, China, France, India, Japan, Korea, Mexico, the Netherlands, New Zealand, Norway, Sweden, Switzerland, the UK, the USA and the World Bank. We are grateful to the partners, especially KALRO for outstanding partnership in addressing the MLN challenge, particularly enabling CIMMYT to establish and operate the MLN screening facility at KALRO-Naivasha, Kenya.

Conflicts of Interest

The authors declare no conflict of interest. The funders had no role in the design of the study; in the collection, analyses, or interpretation of data; in the writing of the manuscript, or in the decision to publish the results.

References

  1. Mahuku, G.; Wangai, A.; Sadessa, K.; Teklewold, A.; Wegary, D.; Ayalneh, D.; Adams, I.; Smith, J.; Bottomley, E.; Bryce, S.; et al. First report of Maize chlorotic mottle virus and Maize Lethal Necrosis on maize in Ethiopia. Plant Dis. 2015, 99, 1870. [Google Scholar] [CrossRef]
  2. Redinbaugh, M.G.; Stewart, L.R. Maize lethal necrosis: An emerging, synergistic viral disease. Annu. Rev. Virol. 2019, 5, 301–322. [Google Scholar] [CrossRef]
  3. Stewart, L.R.; Willie, K.; Wijeratne, S.; Redinbaugh, M.G.; Massawe, D.; Niblett, C.L.; Kiggundu, A.; Asiimwe, T. Johnsongrass mosaic virus contributes to maize lethal necrosis in East Africa. Plant Dis. 2017, 101, 1455–1462. [Google Scholar] [CrossRef] [Green Version]
  4. Niblett, C.L.; Claflin, L.E. Corn lethal necrosis a new virus disease of corn in Kansas. Plant Dis. Rep. 1978, 62, 15–19. [Google Scholar]
  5. De Groote, H.; Oloo, F.; Tongruksawattana, S.; Das, B. Community-survey based assessment of the geographic distribution and impact of maize lethal necrosis (MLN) disease in Kenya. Crop Prot. 2016, 82, 30–35. [Google Scholar] [CrossRef]
  6. Marenya, P.P.; Erenstein, O.; Prasanna, B.; Makumbi, D.; Jumbo, M. Maize lethal necrosis disease: Evaluating agronomic and genetic control strategies for Ethiopia and Kenya. Agric. Syst. 2018, 162, 220–228. [Google Scholar] [CrossRef]
  7. Prasanna, B.M.; Suresh, L.M.; Mwatuni, F.; Beyene, Y.; Makumbi, D.; Gowda, M.; Olsen, M.; Hodson, D.; Worku, M.; Mezzalama, M.; et al. Maize lethal necrosis (MLN): Efforts toward containing the spread and impact of a devastating transboundary disease in sub-Saharan Africa. Virus Res. 2020, 282, 187943. [Google Scholar] [CrossRef]
  8. Isabiry, B.E.; Rwomushana, I. Current and future potential distribution of maize chlorotic mottle virus and risk of maize lethal necrosis disease in Africa. J. Crop Prot. 2016, 5, 215–228. [Google Scholar] [CrossRef]
  9. Tesfaye, K.; Gbegbelegbe, S.; Cairns, J.E.; Shiferaw, B.; Prasanna, B.M.; Sonder, K.; Boote, K.J.; Makumbi, D.; Robertson, R. Maize systems under climate change in sub-Saharan Africa. Int. J. Clim. Chang. Strateg. Manag. 2015, 7, 247–271. [Google Scholar] [CrossRef]
  10. Shiferaw, B.; Tesfaye, K.; Kassie, M.; Abate, T.; Prasanna, B.M.; Menkir, A. Managing vulnerability to drought and enhancing livelihood resilience in sub-Saharan Africa. Weather Clim. Extrem. 2014, 3, 67–79. [Google Scholar] [CrossRef] [Green Version]
  11. Tesfaye, K.; Gbegbelegbe, S.; Cairns, J.E.; Shiferaw, B.; Prasanna, B.M.; Boote, K.J.; Sonder, K.; Makumbi, D.; Robertson, R. Maize systems under climate change in sub-Saharan Africa: Potential impacts on production and food security. Int. J. Clim. Chang. Strateg. Manag. 2014, 7, 247–271. [Google Scholar] [CrossRef]
  12. Cairns, J.E.; Sonder, K.; Zaidi, P.H.; Verhulst, N.; Mahuku, G.; Babu, R.; Nair, S.K.; Das, B.; Govaerts, B.; Vinayan, M.T.; et al. Maize production in a changing climate. Adv. Agron. 2012, 144, 1–58. [Google Scholar]
  13. Nair, S.K.; Babu, R.; Magorokosho, C.; Mahuku, G.; Semagn, K.; Beyene, Y.; Das, B.; Makumbi, D.; Kumar, P.L.; Olsen, M.; et al. Fine mapping of Msv1, a major QTL for resistance to Maize Streak Virus leads to development of production markers for breeding pipelines. Theor. Appl. Genet. 2015, 128, 1839–1854. [Google Scholar] [CrossRef] [PubMed]
  14. Worku, M.; Makumbi, D.; Beyene, Y.; Das, B.; Mugo, S.; Pixley, K.; Banziger, M.; Owino, F.; Olsen, M.; Asea, G.; et al. Grain yield performance and flowering synchrony of CIMMYT’s tropical maize (Zea mays L.) parental inbred lines and single crosses. Euphytica 2016, 211, 395–409. [Google Scholar] [CrossRef] [Green Version]
  15. Beyene, Y.; Gowda, M.; Suresh, L.M.; Mugo, S.; Olsen, M.; Oikeh, S.O.; Juma, C.; Tarekegne, A.; Prasanna, B.M. Genetic analysis of tropical maize inbred lines for resistance to maize lethal necrosis disease. Euphytica 2017, 213, 224. [Google Scholar] [CrossRef] [PubMed] [Green Version]
  16. Jones, J.W.; Hoogenboom, G.; Porter, C.; Boote, K.J.; Batchelor, W.D.; Hunt, L.A.; Wilkens, P.; Singh, U.; Gijsman, A.; Ritchie, J.T. DSSAT cropping system model. Spec. Ed. Eur. J. Agron. 2003, 18, 235–265. [Google Scholar] [CrossRef]
  17. Batchelor, W.D.; Jones, J.W.; Boote, K.J.; Pinnschmidt, H.O. Extending the use of crop models to study pest damage. Trans. ASAE 1993, 36, 551–558. [Google Scholar] [CrossRef]
  18. Fallick, J.B.; Batchelor, W.D.; Tylka, G.; Niblack, T.; Paz, J.O. Coupling soybean cyst nematode damage to CROPGRO-Soybean. Trans. ASAE 2002, 45, 433–441. [Google Scholar] [CrossRef]
  19. Hoogenboom, G.; Porter, C.H.; Shelia, V.; Boote, K.J.; Singh, U.; White, J.W.; Hunt, L.A.; Ogoshi, R.; Lizaso, J.I.; Koo, J.; et al. Decision Support System for Agrotechnology Transfer (DSSAT) Version 4.7 (www.DSSAT.net); DSSAT Foundation: Gainesville, FL, USA, 2017. [Google Scholar]
  20. Masuka, B.; Atlin, G.N.; Olsen, M.; Magorokosho, C.; Labuschagne, M.; Crossa, J.; Bänziger, M.; Pixley, K.; Vivek, B.; von Biljon, A.; et al. Gains in maize genetic improvement in Eastern and Southern Africa i) CIMMYT hybrid breeding pipeline. Crop Sci. 2016, 57, 1–12. [Google Scholar] [CrossRef] [Green Version]
  21. Masuka, B.; Magorokosho, C.; Olsen, M.; Atlin, G.N.; Bänziger, M.; Pixley, K.V.; Vivek, B.S.; Labuschagne, M.; Matemba-Mutasa, R.; Burgenõ, J.; et al. Gains in maize genetic improvement in Eastern and Southern Africa ii) CIMMYT open pollinated varieties (OPVs) breeding pipeline. Crop Sci. 2017, 57, 180–191. [Google Scholar] [CrossRef] [Green Version]
  22. Sitonik, C.; Suresh, L.M.; Beyene, Y.; Olsen, M.S.; Makumbi, D.; Kiplagat, O.; Das, B.; Jumbo, M.B.; Mugo, S.; Crossa, J.; et al. Genetic architecture of maize chlorotic mottle virus and maize lethal necrosis through GWAS, linkage analysis and genomic prediction in tropical germplasm. Theor. Appl. Genet. 2019, 132, 2381–2399. [Google Scholar] [CrossRef] [PubMed] [Green Version]
  23. Tsuji, G.Y.; Uehara, G.; Balas, S. (Eds.) DSSAT v3; University of Hawaii: Honolulu, HI, USA, 1994; Volume 2. [Google Scholar]
Figure 1. Relationship between visual MLN disease score and percent dead leaf area and percent leaf chlorosis.
Agronomy 10 00710 g001
Figure 2. Example of observed percent cumulative leaf area (PCLA) and percent diseased leaf area (DSLA) for two hybrids in the calibration treatment shown in the time series file (File T) format. The TRNO header is the treatment number and the header DATE is the year and day of year of the damage observations.
Agronomy 10 00710 g002
Figure 3. Area under the disease score curve for each maize hybrid and the calibration and evaluation treatments.
Agronomy 10 00710 g003
Figure 4. Daily percent death and necrotic leaf area for maize hybrids with a range of MLN tolerances for the calibration treatment (2016 non-inoculated).
Agronomy 10 00710 g004aAgronomy 10 00710 g004b
Figure 5. Calibration and evaluation results for leaf number and flowering date.
Agronomy 10 00710 g005
Figure 6. Simulated vs. observed final grain weight for 17 hybrids in the calibration (non-inoculated) treatment used to estimate genetic coefficients for the CERES-Maize model.
Agronomy 10 00710 g006
Figure 7. Simulated vs. observed final grain weight for 17 hybrids in the evaluation (inoculated) treatment for 2016 and 2018.
Agronomy 10 00710 g007
Figure 8. Simulated yield loss due to MLN damage for the calibration treatment and the average of the evaluation treatments for each hybrid.
Agronomy 10 00710 g008
Table 1. Genetic coefficients calibrated for each hybrid in the 2016 non-inoculated treatment.
HybridMLN Resistance Level 1P1 2P2 3P5 4G2 5G3 6PHINT 7
CKMLN150072R1700.277006106.530
CKMLN150067R2200.276605906.035
CKMLN150073R1920.277005006.032
CKMLN150077R2200.277006306.532
CKMLN150074R1920.277005906.532
CKMLN150075R1920.277005006.032
CKMLN150076R1920.277006306.532
WE5135T2200.277006306.532
WE5139T2210.277506506.036
WE5136T2520.277004006.040
WE5137T2300.277004006.035
WE5138T2150.277005006.035
DK8031S2500.276504756.546
KH500-33AS2000.277003006.046
PIONEER 30G19S2000.277501006.037
DUMA-43S2000.277501006.047
PH3253S2000.277501006.047
1 MLN resistance level—R = resistant, T = tolerant, S = susceptible to MLN. 2 P1—Thermal time from seedling emergence to the end of the juvenile phase (degree days). 3 P2—Extent to which development (expressed as days) is delayed for each hour increase in photoperiod above the longest photoperiod at which development proceeds at a maximum rate (days). 4 P5—Thermal time from silking to physiological maturity (degree days). 5 G2—Maximum possible number of kernels per plant (no. plant−1). 6 G3—Kernel filling rate during the linear grain filling stage and under optimum conditions (mg day−1). 7 PHINT—Phyllochron interval (degree days).
Table 2. Soil properties for the field experiment.
Layer Depth, cmLower Limit,
cm3 cm−3
Drained Upper Limit, cm3 cm−3Saturated Water Holding Capacity, cm3 cm−3Organic Carbon, %
120.2720.4110.4521.67
190.2880.4210.4461.72
420.3480.4670.4901.49
710.3420.4560.4901.56
1000.3350.4450.4901.38
1380.3240.4320.4941.44
1490.3100.4200.4951.54
1610.2730.3820.4731.75
1900.2650.3780.4731.41
1900.1970.3160.4301.66
2000.2720.4110.4521.67
Table 3. Statistical analysis of simulated vs. measured leaf number, flowering date and yield.
R2RMSE MAED-Statistic
Calibration leaf number0.890.840.590.95
Evaluation leaf number0.651.51.10.86
Calibration flowering date0.732.4 days1.9 days0.99
Evaluation flowering date0.087.1 days6.6 days0.55
Calibration yield0.97355 kg/ha277 kg/ha0.99
Evaluation yield0.92773 kg/ha600 kg/ha0.97

