Abstract
The commercial launch of dicamba-tolerant (DT) crops has resulted in increased dicamba usage and a high number of dicamba off-target movement complaints on sensitive soybeans (Glycine max L.). Dicamba is a synthetic auxin and low dosages as 0.028 g ae ha−1 can induce injury on sensitive soybean. Tank contamination has been identified as one of the sources for unintended sensitive crop exposure. The labels of new dicamba formulations require a triple rinse cleanout procedure following applications. Cleanout efficacy might vary based on the sprayer type and procedure followed. This study was performed to quantify dicamba retention in commercial sprayers and assess the risk for crop injury from remaining contaminants. The results indicate triple rinse with water was comparable to cleanout procedures utilizing ammonium, commercial tank cleaners, and glyphosate in rinses. Dicamba contaminants in final rinsates resulted in <15% visual injury and no yield response when applied to sensitive soybeans at R1 stage. A survey of 25 agricultural sprayers demonstrated a cleanout efficacy of 99.996% by triple rinsing with water following applications of dicamba at 560 g ae ha−1, with concentrations of less than 1 ug mL−1 detected rinsates from the fourth rinse. A dose response experiment predicted dosages causing 5% visual injury and the yield losses were 0.1185 and 2.8525 g ae ha−1. However, symptomology was observed for all tested dosages, including the rate as low as 0.03 g ae ha−1. The results from this study suggest triple rinsing with sufficient amount of water (≥10% of tank volume) is adequate for the removal of dicamba residues from sprayers to avoid sensitive soybean damage. This study can provide producers with confidence in cleanout procedures following dicamba applications, and aid in minimizing risk for off-target movement through tank contamination.
1. Introduction
Recent commercialization of dicamba tolerant (DT) cotton (Gossypium hirsutum L.) and soybean (Glycine max (L). Merril) has provided US producers with a new tool for controlling herbicide-resistant broadleaf weeds that is rampant in many cotton and soybean producing states. The rapid increase in dicamba usage in DT crops has led to unprecedented numbers of off-target movement complaints with an estimated 1.46 million hectares of sensitive soybean being damaged in the first year following commercialization of the technology [1]. Primary sources of dicamba off-target movement have been identified as spray particle drift, volatility, and sprayer contamination [2,3,4,5,6,7,8,9]. Adverse weather conditions can strongly influence the amount of herbicide movement away from the target site via particle drift and volatility [3,4,5,6,7,8]. Tank contamination in commercial sprayers is likely the most preventable form of unintended exposure [10]. Effective cleanout procedures need to be identified to minimize dicamba retention and reduce the risk for crop injury.
Dicamba is a synthetic auxin that can induce distinct injury on sensitive plants, including leaf cupping, leaf crinkling, stem twisting, chlorosis on terminal leaves, abnormal leaf venation, swollen petiole bases, stunting, and necrosis, etc. [6,9,11]. The soybean response to dicamba has been widely studied and dosages as low as 0.028 g ae ha−1 (0.005% of 560 g ae ha−1 use rate) have been shown to cause symptomology [2,4,9,12,13]. The degree of damage can differ based on the crop stage at the time of exposure, with consistently higher yield loss potential for reproductive stages as opposed to vegetative stages by two to six-fold [2,6,9]. For example, Griffin et al. [6] observed 4 and 15% soybean yield losses following dicamba exposure during V2–V3 stages at 4.4 and 17.5 g ae ha−1, respectively, and 10 and 36% reductions exposed during R1 stages using the same rates. In another study, the dicamba dosage predicted to cause 5% yield loss was 5.8 and 1.0 g ae ha−1 for V2-3 and R1 stages, respectively [9]. Similarly, a meta-analysis pooled data from multiple published studies found dosages predicted to cause 5% soybean yield loss ranged from 1.6 to 24, 1.2 to 47, and 0.15 to 14 g ae ha−1 for V1-3, V4-7, and R1-2 stages, respectively [2]. The available literature indicates the potential for soybean recovery is greatest when exposed at vegetative stages and exposure during reproductive stages has the highest risk for yield reduction [2,3,6,9]. However, soybean yield loss due to dicamba exposure can be inconsistent due to environmental conditions and plant vigor [2,3,4,6,9,14,15,16,17].
Row crop producers often use sprayers to apply multiple pesticides, as owning a sprayer that is dedicated to dicamba applications is expensive and unrealistic. Failure to remove dicamba residues from a sprayer could result in multiple exposures to sensitive crops throughout the season. Labels of new dicamba formulations require a triple rinse cleanout procedure following applications to minimize the risk for unintended exposure to sensitive crops [18,19,20]. Using a tank cleaning agent in the second rinse is recommended, but not required in these labels. Although dicamba is formulated as a water-soluble product, the removal from spray equipment is difficult and residues can readily adhere to plastic and rubber surfaces [5,21,22,23]. Modern self-propelled sprayers often have large tanks and multiple filters, screens, end caps, valves, and nozzles that can trap dicamba deposits. Published data is very limited on dicamba clean out efficacy in agricultural sprayers. More information is needed in order to determine the effectiveness of cleanout procedures and soybean response to the remaining contaminants. Therefore, the objective of this study was to evaluate triple rinse cleanout procedures for dicamba residue removal efficacy in agricultural sprayers following applications and assess sensitive soybean response to various concentrations of dicamba residue that may not be removed from sprayer equipment.
2. Materials and Methods
2.1. Cleanout Procedure Comparisons
Field and laboratory experiments were conducted in January 2017 to evaluate three commercial sprayers for dicamba residue retention following four triple-rinse cleanout procedures, as shown in Table 1. Hagie Upfront STS 10 (Hagie Manufacturing Co., Clarion, IA 50525, USA), John Deere 6700 (John Deere and Co., Moline, IL 61265, USA) and SprayCoupe 4660 (AGCO, Duluth, GA 30096, USA) sprayers with polyethylene tanks and capacities of 3570 L, 1590 L, and 1580 L, respectively, were used to apply diglycolamine salt of dicamba (Clarity®, BASF Corporation, Research Triangle Park, NC, 27709, USA) at a rate of 1.12 kg ae ha−1 in a carrier volume of 93.5 L ha−1. Herbicide solution was mixed for 378 L of water in each sprayer at initial application. Herbicide solution was agitated for 10 min. before being sprayed on fallow fields until no droplets were emitted from of nozzles in order to empty solution in hose and pump. Following herbicide application, remaining herbicide solution in the tank was drained completely. For each rinse during cleanout procedures, 378 L of water and the assigned cleaning treatment were added to the tank. After agitating for 5 min., half of the cleaning solution was sprayed out before rinsate samples were collected from the left, middle, and right sections of the boom simultaneously and then combined into a single sample. Sprayer tanks were not drained in between rinses during cleanout procedures. A fourth rinse using only water was included in order to demonstrate the cleaning efficacy of each triple-rinse procedure since label only mandates triple-rinse. All four cleaning procedures were repeated three times on each sprayer in field and the experiment was repeated twice.

Table 1.
Cleanout procedures, agents, and, amounts.
Rinsates were collected in 1 L glass jars, and 1/3 of each sample from the various boom sections were mixed in a single jar before being placed on ice and later frozen at −20 °C for future analytical analysis. The samples were thawed before aliquoting 1.5 mL into 2 mL Eppendorf® tubes (Eppendorf North America, Hauppauge, NY 11788, USA), which were subsequently centrifuged for 2 min. at 15,000 rpm to remove any debris. After centrifugation, 1 mL of the cleaned sample was pipetted into 2 mL glass chromatography vials. Prior to centrifuging, the samples from the first and second rinses were diluted 1:100 and 1:10, respectively, as the concentrations were too high for accurate chromatography analysis. All of the processed samples were analyzed through high performance liquid chromatography (HPLC) using an Agilent 1260 Infinity series apparatus (Agilent Technologies, Santa Clara, CA, 95051, USA) equipped with a diode array detector (1260 Infinity Diode Array Detector VL, Agilent Technologies, Santa Clara, CA, 95051, USA) and an Agilent Poreshell 120EC-C18 column (4 µm, 4.6 × 250 mm). The total run time of the chromatography for each sample was 10 min. (flow rate of 1 mL min.−1, injection volume of 100 µL) with a constant mobile phase of 50% 10 mM phosphoric acid and 50% acetonitrile. The analytical wavelength was set to 230 nm and the peaks were integrated from the DAD spectrum. The detection limit of dicamba was 0.1 µg mL−1. Analytical standards were developed while using HPLC-grade water and formulated dicamba (Clarity®, BASF Corporation, Research Triangle Park, NC 27709, USA) to include ten concentrations ranging from 0.25 to 50 µg mL−1. The known concentrations were regressed against their respective concentrations in Sigmaplot 13.0 (Systat Software, San Jose, CA 95131, USA), and the resulting linear equation was used to determine dicamba concentrations in sprayer rinsate samples.
2.2. Rinsate Application on Sensitive Soybean Bioassays
Rinsates that were collected from the fourth rinses from all cleanout procedures were applied over the top of sensitive soybeans at early-bloom (R1) stage at EV Smith Research and Extension Center at Shorter, AL (32°29’45.6” N 85°53’25.2” W) on August 15, 2017 to demonstrate dicamba clean out efficacy by triple-rinse procedures. A Roundup-Ready Soybean variety ‘P76T54R2′ (Pioneer®, Corteva Agriscience, Johnston, IA 20131, USA) was planted at 346,000 seeds ha−1 on 91 cm row spacing and managed with local recommendations. Plots were 7.6 m long by 3.7 m wide with four rows of soybean. A total of 12 treatments (three sprayers by four cleanout procedures) were sprayed over the top of soybean in a randomized complete block design, plus a non-treated control. Each treatment contained all of the replications from the spray cleaning study described above. Samples that were collected from left, middle, and right boom sections from the fourth rinse of each treatment replication were combined into a single sample and applied on the middle two rows in each plot. Rinsate samples were applied with a CO2-pressurized backpack sprayer that was equipped with four Turbo TeeJet induction (TTI110025) nozzles (TeeJet Technologies, Wheaton, IL 60187, USA) at speed of 6.4 km ha−1, 335 kpa pressure, and a carrier volume of 187 L ha−1 to ensure good coverage. Visual injury was estimated on a scale of 0 (no injury) to 100 (complete mortality) at 7, 14, and 21 days after treatment (DAT). All of the plots were maintained weed free with appropriate herbicides and hand weeding. Soybean yield was collected on November 29, 2017, by machine harvesting the middle two rows.
All of the collected data were subjected to a mixed model analysis of variance while using PROC GLIMMIX in SAS 9.4 (Statistical Analysis Systems®, version 9.4; SAS Institute Inc., Cary, NC 27513). The cleanout procedure and sprayer were considered to be fixed effects, while replication was a random effect and all of the interactions were considered. Means comparisons were generated using Tukey’s Honest Significant Difference (HSD) test with P = 0.05.
2.3. Dicamba Cleanout Survey on Commercial Sprayers
A survey was conducted across 25 commercial sprayers from various row crop farms in Alabama, Georgia, and Florida in October 2019 to further assess the cleanout efficacy of triple rinsing with water following dicamba applications. Sprayer models, manufacturers, and locations can be found in Table 2. All of the sprayers have polyethylene tanks except for sprayer ID # 4 which has a stainless-steel tank. Sprayers were thoroughly cleaned before mixing dicamba by rinsing tank and flush spray line with clean water at 15% tank capacity. Dicamba (Xtendimax® with VaporGrip® Technology, Monsanto Co., St. Louis, MO 63167, USA) was applied at 560 g ae ha−1 in tank mixture with a drift reduction agent (Intact, Precision Laboratories, LLC, Waukegan, IL 60085, USA) at 0.5% v v-1. All of the sprayers were loaded at 15% tank capacity and agitated for 10 min. before application at 140 L ha−1. A standard procedure of four rinses with water was conducted on all sprayers in this survey at 15% tank capacity during each rinse. Water was agitated for 5 min. in the tank before collection process was initiated. At each rinse, half of the water added to tank was sprayed out before sample collection from the left, middle, and right sections of the boom simultaneously. Sprayer tanks were drained after initial application and in between all rinses. The samples were immediately placed in a cooler on ice, and then frozen at −20 °C until further analysis. Rinsate samples were processed in laboratory and analyzed by HPLC with the procedure, as previously described. Rinsate samples that were collected from left, middle, and right sections of the boom were separately analyzed to reveal potential boom section effect. Dicamba concentrations in rinsates were analyzed in a mixed model analysis of variance using PROC GLIMMIX in SAS 9.4, with fixed effects of boom section and number of rinses and random effect of sprayer ID number.
Table 2.
Sprayer ID, model, boom width, and tank capacity for sprayer survey.
2.4. Soybean Response to Dicamba Concentrations
Field studies were conducted during summers of 2017, 2018, and 2019 at the E.V. Smith Research Center in Macon County, AL (32°29’45.6” N 85°53’25.2” W) and the West Central Research and Extension Center in Lincoln County, NE (41°05′15.98” N 100°46′39.42” W) in 2019 in order to evaluate soybean response to different dicamba concentrations. Air temperatures at the time of applications ranged from 33 to 35 °C with humidity of 48 to 72% across all sites. Dates for soybean planting, dicamba application, and harvest as well as temperature and humidity at the time of application can be found in Table 3. The plots were 7.6 m long by 1.2 m wide and they consisted of four rows of ‘P76T54R2′ (Pioneer®, Corteva Agriscience, Johnston, IA 20131, USA) and ‘NK S24-K2′ (NK®, Syngenta Crop Protection, Greensboro, NC 2749, USA) soybean varieties in the AL and NE field studies, respectively. Soybeans were planted at 346,000 seeds ha−1 on 91 and 76 cm row spacing in AL and NE, respectively. Randomized complete block design with four replications was used at each location. Broadcast applications of dicamba at 0.03, 0.14, 0.70, 1.40, 3.51, 14.04, 35.07, and 140.28 g ae ha−1 were used to simulate tank contamination at low concentrations. These dosages represent 0.25, 1, 5, 10, 25, 100, 250, and 1000 µg mL−1, respectively. These concentrations were applied to soybeans at first to mid-bloom stage with a CO2-pressurized backpack sprayer that was equipped with four Turbo TeeJet Induction (TTI110025) nozzles (TeeJet Technologies, Wheaton, IL 60187, USA) delivering 187 L ha−1 at 6.4 km h−1 and 335 kpa pressure.
Table 3.
Dates of soybean planting, dicamba application, harvest, and temperature and humidity at time of application.
Soybean visual injury was estimated on a scale of 0 (no injury) to 100 (complete mortality) 14 and 21 DAT. Soybean yield was collected at each location by a plot combined from the center two rows. Collected data were subjected to a mixed model analysis of variance using PROC GLIMMIX in SAS 9.4. Dicamba concentration and location were considered fixed effects, while replication was a random variable, and all interactions were examined. If an interaction was significant, data were analyzed and presented by the fixed effects at each level. Means comparisons were generated while using Tukey’s HSD test with P = 0.05. A non-linear regression model was fitted to the dry weight and visual estimations of injury data using the DRC package in R software (R Foundation for Statistical Computing, Wienna, Austria) [24]. The effective-dose to reduce 5% and 10% of plant biomass and cause 5% and 10% visual estimations of injury (ED5 and ED10) were estimated while using a four-parameter log logistic equation:
in which y corresponds to the biomass reduction and visual estimations of injury (%), x represents dicamba dosage, b is the slope at the inflection point, c is the lower limit of the model, d is the upper limit, and e is the inflection point that represent the dosage that caused 50% injury or 50% yield loss. Visual injury and yield data were pooled over years and locations for non-linear regression to provide maximum prediction power to the model.
y = c + {d – c/1 + exp[b(log x – log e)]}
3. Results
3.1. Comparison of Four Cleanout Procedures for Dicamba Residue Retention
No sprayer by cleanout procedure interactions were observed for dicamba residue retention at any rinse. Therefore, the data were combined to show cleanout procedure and sprayer effects individually (Table 4).
Table 4.
Dicamba concentrations in rinsates following cleanout procedures in different sprayers A,B,C,D.
Dicamba concentrations in the first rinse were similar for all of the cleanout procedures. Residues detected in the Hagie Upfront STS 10 exceeded those in the John Deere 6700 by 272 mg L−1, possibly due to smaller tank size of John Deere 6700. Dicamba concentrations in the rainsate from the second rinse were similar for all cleanout procedures and sprayers. Triple rinsing with water resulted in higher dicamba concentrations in the third rinse as compared to ammonium fb glyphosate fb water, with 3.56 and 0.72 µg mL−1 detected in rinsate, respectively. The Hagie Upfront STS 10 retained more dicamba than John Deere 6700 at the third rinse with 1.8 µg mL−1 higher in concentrations. Dicamba concentrations in the fourth rinse did not differ significantly for any sprayer or cleanout procedure and did not exceed 1.25 µg mL−1, which is equivalent to 0.18 g ae ha−1 in a sprayer delivering 140 L ha−1. This concentration surpassed the lowest dicamba dosage that is expected to induce soybean symptomology and slightly exceeded the dosage predicted to cause 5% yield loss, which are 0.03 and 0.15 g ae ha−1, respectively [2,6,9,13].
3.2. Application of Fourth Rinsates on Sensitive Soybean Bioassays
When the fourth rinsates were directly applied to sensitive soybeans at mid-bloom, typical dicamba symptomology of leaf cupping, stem twisting, and chlorosis was observed. However, visual injury estimations did not exceed 15% for any treatment and yield was not significantly reduced by remaining dicamba residues from any clean out procedure and any sprayer (data not shown). These data indicate that sensitive soybeans could tolerate dicamba contaminants remaining in sprayers following triple rinse cleanout procedures without risk for yield loss. However, environmental conditions can largely influence soybean response to dicamba and injury could be more severe during times of drought stress and higher temperatures [2,7,8,15]. These low concentrations of dicamba residue may still pose a concern for sensitive soybean.
Inman et al. [25] reported triple rinse with water was comparable to ammonia and commercial tank cleaners for dicamba residue removal following applications of 560 g ae ha−1, with 0.006% of original concentrations remaining in final rinses. Dicamba residue retention was higher in this study, with up to 0.015% (1.25 µg mL−1) of the original application concentrations detected, which was probably due to higher initial use rate of dicamba at 1.12 kg ae ha−1. Cundiff et al. [21] found that hose material had a greater influence on dicamba retention in sprayer equipment than triple rinse cleanout procedures of water versus ammonia, which was likely due to the material porosity of hose interior where residues can settle. Certain hose materials deteriorate quicker than others after repeated pressurization during application which led to more dicamba retention. Osborne et al. [23] conducted an anonymous sprayer survey and reported 98 to 100% cleanout efficiency, and the average dicamba concentrations of 245 µg mL−1 reduced to 0.41 µg mL−1 after triple rinses with water. The results of this study combined with previous literature demonstrate the addition of a cleaning agent might not provide an additional benefit for dicamba removal than triple rinse with water, hose type, and the age of sprayer equipment is likely a concern [21].
3.3. Survey of Commercial Sprayers for Dicamba Residue Retention Following Triple Rinse with Water
Concentrations that were collected from the left, middle, and right sections of the boom for individual rinses performed on each sprayer was not significant as a fixed effect in the model; therefore, concentrations were combined over sections. Dicamba concentration in the sprayer tank was calculated at 4000 µg mL−1 when mixed at 560 g ae ha−1 rate and applied at 140 L ha−1. The average dicamba concentrations detected in the first, second, third, and fourth rinses were 100.75, 6.78, 0.79, and 0.17 µg mL−1, respectively, indicating that the cleanout efficacy improved with each additional rinse (Table 5). Dicamba concentrations that were detected in the first rinse were not uniform across sprayers and detection ranged from 0.10 to 664.82 µg mL−1, which is likely a result of vastly different sprayer systems and equipment age. In general, sprayers that retained higher concentrations in initial rinses also retained higher amounts of dicamba throughout the rinses, such as sprayer ID no. 3, 18, and 25.
Table 5.
Dicamba concentration in surveyed sprayers rinsates from each rinse A,B.
The three sprayers with highest dicamba concentrations in the first rinse were two John Deere R4030s and a tractor mounted sprayer (ID no. 3, 18, and 25) with concentrations ranging from 287.17 to 664.82 µg mL−1 (Table 5). The greatest dicamba retention at the second rinse was observed on sprayer ID no. 25, 18, and 12, with concentrations of 84.29, 18.61, and 10.90 µg mL−1, respectively. The three highest dicamba concentrations in rinsates that were collected at the third rinse were detected from sprayers previously identified (ID No. 3, 18, 25) for retaining the greatest amounts of dicamba in the first rinse, ranging from 2.18 to 6.89 µg mL−1. All the sprayers retained 0.68 µg mL−1 or less of dicamba at the fourth rinse, with the majority (18 sprayers) below the instrument detection limit of 0.1 µg mL−1, indicating near complete cleanout efficacy on these sprayers. The triple rinse with water procedure cleaned out 99.996% of dicamba in sprayers surveyed based on initial tank concentration (4000 µg mL−1) and average concentrations generated from the fourth rinse (0.17 µg mL−1). Final dicamba concentrations in this survey, where the dicamba in-season use rate (560 g ae ha−1) was applied initially, did not surpass the lowest dosage expected to cause yield loss (0.15 g ae ha−1 or 1.07 µg mL−1). Three sprayers (ID No. 3, 24, 25) retained concentrations with potential to induce symptomology based on available literature [2,9,12,13]. Three sprayers (ID No. 4, 16, and 22) showed abnormally low dicamba concentrations in the initial rinsate samples, ranging from 0.10 to 2.70 µg mL−1. The explanation for this observation is unknown, but certain sprayer design might allow more complete tank drainage following dicamba application, thus leading to low concentrations being detected in the first rinse. Further investigation is needed to study how sprayer design affects chemical retention in these sprayers.
3.4. Soybean Dose-Response to Dicamba Concentrations
A dicamba concentration by site-year interaction was observed for soybean visual injury at 14 and 21 DAT. Data were analyzed and separately presented for each site-year (Table 6). Soybean visual injury was observed for all concentrations tested and increased from 1 to 100% as dicamba dosage increased from 0.25 µg mL−1 to 1000 µg mL−1 across all site-years. The two highest dosages tested in this study resulted in consistently higher injury of 49% or greater across all rating dates and site-years. Dicamba concentrations of 0.25 and 1 µg mL−1 did not induce visual injury that is greater than 18% and the soybean responses were variable across site-years.
Table 6.
Soybean visual injury to various concentrations of dicamba under field conditions 14 and 21 DAT A,B,C,D,E.
Soybean yield was also variable across site-years and it ranged from 852 to 4934 kg ha−1 in the nontreated control (Table 7). The AL site experienced extended periods of drought in the summer of 2019 that were likely caused the lower yields across all treatments and a lack of differences. Across all site-years, soybean yield was not significantly reduced for dicamba dosages of 5 µg mL−1 or less when compared to the nontreated control. A dicamba dosage of 10 µg mL−1 resulted yields 725 kg ha−1 lower than the nontreated control in AL during 2017. No other site-year observed a loss from this dosage, and applications of 25 µg mL−1 did not result in yield reductions for any site. The yield loss that resulted from 100 µg mL−1 was observed at the 2017 AL and 2019 NE sites with reductions of 819 and 2026 kg ha−1, respectively. Three out of four sites observed yield loss greater than 50% following dicamba applications at 250 µg mL−1. Applications of 1000 µg mL−1 (1/4 of labeled use rate at 560 g ae ha−1) caused the most severe yield loss, and resulted in lower yield for all sites, ranging from 0 to 442 kg ha−1. Non-linear regression using indicated significant relationships between dicamba dosages to soybean visual injury and yield loss (Table 8, Figure 1 and Figure 2). The ED5 and ED10 are estimated as 0.1185 and 0.4143 g ae ha−1 for visual injury and 2.8525 and 4.9602 g ae ha−1 for yield loss, respectively. The ED5 and ED10 of this study are within the range of dosages causing 5% injury and yield loss in the published studies [2,6,9,12,13].
Table 7.
Soybean yield response to various dicamba concentrations under field conditions A.
Table 8.
Parameter estimates for non-linear regression A,B.
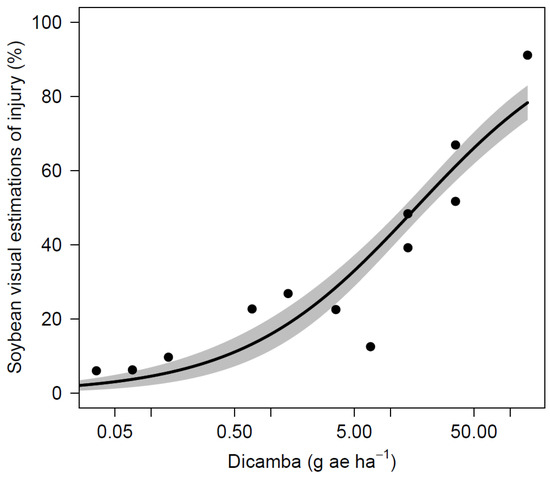
Figure 1.
Soybean visual injury as affected by dicamba dosage.
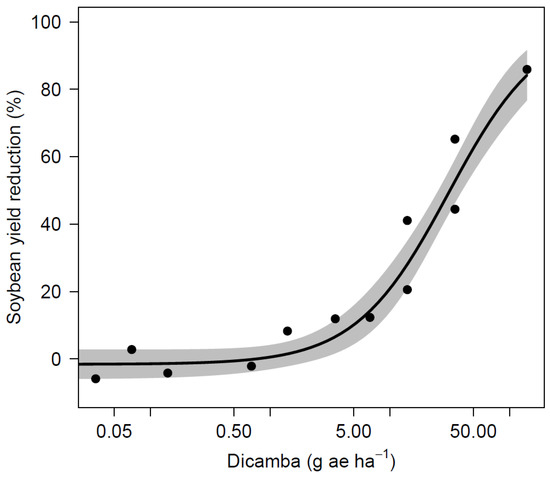
Figure 2.
Soybean yield as affected by dicamba dosage.
Visual injury was observed for all dosages that were tested in this study, which correlates to previous studies, where at least 5% visual injury was predicted with dicamba dosages as low as 0.028 g ae ha−1 [2,9,13]. A study by Griffin et al. [6] predicted that soybean injury of 19% is likely to occur from exposure to dicamba at 1.1 g ae ha−1 during reproductive stages 7 to 14 DAT. A similar dosage in this study of 1.4 g ae ha−1 (10 µg mL−1) resulted in 15 to 40% injury across all sites. Although previous literature predicts 5% soybean yield loss with dosages as low as 0.15 g ae ha−1, soybeans in this study were able to tolerate dosages up to 0.7 g ae ha−1 (5 µg mL−1) with no yield loss [2,6,9]. Research conducted by Kelley et al. [17] observed 25 and 41% visual injury resulted from dicamba applications of 0.56 and 5.6 g ae ha−1 at R2 stage with no yield loss and 7% yield loss, respectively. Foster et al. [26] reported 9% and 30% yield loss for dosages of 2.2 and 8.8 g ae ha−1 applied at reproductive stages. Injury up to 37% observed in the current study from 0.7 g ae ha−1 (5 µg mL−1) with no impact on yield, indicating that a substantial amount of injury can occur without affecting yield under certain conditions. In a nutshell, the results from this study demonstrate that concentrations greater than 1.25 µg mL−1 (0.18 g ae ha−1) have not been found on any sprayer tested if triple rinse cleanout procedures were followed. There is reasonable confidence to state that soybean yield loss from dicamba residue remained in sprayer after triple rinse procedure while using sufficient amount of water is unlikely to occur.
4. Discussion
Dicamba concentrations from the final rinse in the sprayer survey may cause visual symptomology on sensitive soybean, but they were not higher than the lowest dosage expected to cause soybean yield loss. Dicamba concentrations in the final rinse were not detectable in the majority of the sprayers surveyed. Higher amounts of dicamba may be retained when higher rates are applied. Several sprayers in both studies did retain enough dicamba residues in final rinsates to cause observable symptomology that is based on dose responses in previous studies [2,9,12,13]. Bioassay where actual rinsates were applied to soybeans at first bloom in 2017, which is the most sensitive growth stage for yield loss, resulted in <15% symptomology and no yield loss [2,3]. These observations are consistent with the findings from the dose-response portion of this study, where concentrations of 1 µg mL−1 generated 18% or less visual injury and a lack of yield response. Published literature and the results of this study suggest the safety margin for sensitive soybeans not to be damaged by dicamba residues in sprayers does exist, but it is fairly narrow (0.68 µg mL−1 dicamba found in 4th rinse and 1.07 µg mL−1 may cause soybean yield loss), so growers must be cautious when conducting triple rinse procedure [2,6,9,21].
A few precautionary measures for cleaning sprayer equipment include thoroughly draining the tank after dicamba application and between each rinse, using sufficient volumes of water (at least 10% tank capacity), washing the top of the tank, flushing hoses, cleaning end caps, soaking nozzles, and washing the exterior of the sprayer [22,27]. The failure to drain sprayer tanks in between rinses can impede proper dilution and result in higher herbicide retention [27]. Additionally, periodic maintenance of sprayer equipment and the replacement of damaged parts, such as hoses and nozzles, is often recommended to limit spaces where residues can become lodged [21]. Commercial tank cleaning agents have been shown to increase removal efficacy on flumioxazin and other herbicides with low water solubility, which tend to precipitate to the bottom of the tank and spray hose [11,27,28]. However, the addition of tank cleaning agent in the second rinse did not significantly improve dicamba clean out efficacy in this study due to its high-water solubility.
Dicamba off-target movement concerns are not likely to be completely resolved in coming years and proper technology stewardship will be necessary to minimize the impacts on sensitive crops and environment. Data generated from dicamba retention in commercial sprayers and soybean dose response experiments in this study can provide guidelines to ensure proper stewardship of new technology and avoid potential self-inflicted damage on sensitive crops. More research is needed on understanding how different sprayer designs, tank materials, boom length, hoses, and tank plumbing affect dicamba retention. Authors should discuss the results and how they can be interpreted in perspective of previous studies and of the working hypotheses. The findings and their implications should be discussed in the broadest context possible. Future research directions may also be highlighted.
Author Contributions
Conceptualization, X.L. and G.R.K.; methodology, X.L.; software, F.B.B., B.C.V.; validation, G.d.C.M.; formal analysis, F.B.B., B.C.V.; investigation, F.B.B., G.d.C.M., K.J.P., T.S., Y.W., J.W.; resources, K.J.P., J.G.; data curation, F.B.B.; writing—original draft preparation, F.B.B.; writing—review and editing, F.B.B., B.C.V., G.d.C.M., K.K., X.L.; visualization, B.C.V.; supervision, K.J.P., J.G.; project administration, X.L.; funding acquisition, X.L., K.K. All authors have read and agreed to the published version of the manuscript.
Funding
This research was funded by Auburn University Intramural Grants Program, Alabama Soybean Producer Association, Alabama Agricultural Experiment Stations and Nebraska Agricultural Experiment Station with funding from the Hatch Multistate Research capacity-funding program from the USDA National Institute of Food and Agriculture.
Acknowledgments
The authors would like to thank all participants in the sprayer survey, Alabama Agricultural Experiment Stations, and University of Nebraska Pesticide Application Technology Laboratory and for providing sprayers and labor to support this study.
Conflicts of Interest
The authors declare no conflict of interest.
References
- Bradley, K.W. A Final Report on Dicamba-injured Soybean Acres. University of Missouri. 2017. Available online: https://ipm.missouri.edu/IPCM/2017/10/final_report_dicamba_injured_soybean/ (accessed on 7 March 2020).
- Kniss, A.R. Soybean response to dicamba: A meta-analysis. Weed Technol. 2018, 32, 507–512. [Google Scholar] [CrossRef]
- Egan, J.F.; Barlow, K.M.; Mortensen, D.A. A meta-analysis on the effects of 2, 4-D and dicamba drift on soybean and cotton. Weed Sci. 2014, 62, 193–206. [Google Scholar] [CrossRef]
- Egan, J.F.; Mortensen, D.A. Quantifying vapor drift of dicamba herbicides applied to soybean. Environ. Toxicol. Chem. 2012, 31, 1023–1031. [Google Scholar] [CrossRef] [PubMed]
- Boerboom, C. Field case studies of dicamba movement to soybeans. In Proceedings of the Wisconsin Crop Management Conference: 2004 Proceedings Papers; University of Wisconsin–Madison: Madison, WI, USA, 2004; pp. 406–408. [Google Scholar]
- Griffin, J.L.; Bauerle, M.J.; Stephenson, D.O.; Miller, D.K.; Boudreaux, J.M. Soybean response to dicamba applied at vegetative and reproductive growth stages. Weed Technol. 2013, 27, 696–703. [Google Scholar] [CrossRef]
- Mueller, T.C.; Wright, D.R.; Remund, K.M. Effect of formulation and application time of day on detecting dicamba in the air under field conditions. Weed Sci. 2013, 61, 586–593. [Google Scholar] [CrossRef]
- Mueller, T.C.; Steckel, L.E. Dicamba volatility in humidomes as affected by temperature and herbicide treatment. Weed Technol. 2019, 33, 541–546. [Google Scholar] [CrossRef]
- Soltani, N.; Nurse, R.E.; Sikkema, P.H. Response of glyphosate-resistant soybean to dicamba spray tank contamination during vegetative and reproductive growth stages. Can. J. Plant Sci. 2016, 96, 160–164. [Google Scholar] [CrossRef]
- Werle, R.; Oliveira, M.C.; Jhala, A.J.; Proctor, C.A.; Rees, J.; Klein, R. Survey of Nebraska Farmers’ Adoption of Dicamba-Resistant Soybean Technology and Dicamba Off-Target Movement. Weed Technol. 2018, 32, 754–761. [Google Scholar]
- Shaner, D.L. Herbicide Handbook of the Weed Science Society of America; Shaner, L., Ed.; Weed Science Society of America: Champagne, IL, USA, 2014; pp. 22–232. [Google Scholar]
- Solomon, C.B.; Bradley, K.W. Influence of application timings and sublethal rates of synthetic auxin herbicides on soybean. Weed Technol. 2014, 28, 454–464. [Google Scholar]
- Robinson, A.P.; Simpson, D.M.; Johnson, W.G. Response of glyphosate-tolerant soybean yield components to dicamba exposure. Weed Sci. 2013, 61, 526–536. [Google Scholar] [CrossRef]
- Andersen, S.M.; Clay, S.A.; Wrage, L.J.; Matthees, D. Soybean foliage residues of dicamba and 2, 4-D and correlation to application rates and yield. Agron. J. 2004, 96, 750–760. [Google Scholar] [CrossRef]
- Al-Khatib, K.; Peterson, D. Soybean (Glycine max) response to simulated drift from selected sulfonylurea herbicides, dicamba, glyphosate, and glufosinate. Weed Technol. 1999, 13, 264–270. [Google Scholar] [CrossRef]
- Weidenhamer, J.D.; Triplett, G.B., Jr.; Sobotka, F.E. Dicamba injury to soybean. Agron. J. 1989, 81, 637–643. [Google Scholar] [CrossRef]
- Kelley, K.B.; Wax, L.M.; Hager, A.G.; Riechers, D.E. Soybean response to plant growth regulator herbicides is affected by other postemergence herbicides. Weed Sci. 2005, 53, 101–112. [Google Scholar] [CrossRef]
- Anonymous. Xtendimax® with VaporGrip® Technology Label; Monsanto Co.: St. Louis, MO, USA, 2018; Available online: http://www.cdms.net/ldat/ldDF9006.pdf (accessed on 14 February 2020).
- Anonymous. Engenia® Herbicide Label; BASF Corporation: Triangle Park, NC, USA, 2018; Available online: http://www.cdms.net/ldat/ldDG8028.pdf (accessed on 14 February 2020).
- Anonymous. Tavium® Plus VaporGrip™ Technology Label; Syngenta Crop Protection, LLC: Greensboro, NC, USA, 2019; Available online: http://www.cdms.net/ldat/ldFSO000.pdf (accessed on 18 March 2019).
- Cundiff, G.T.; Reynolds, D.B.; Mueller, T.C. Evaluation of dicamba persistence among various agricultural hose types and cleanout procedures using soybean (Glycine max) as a bio-indicator. Weed Sci. 2017, 65, 305–316. [Google Scholar] [CrossRef]
- Steckel, L.; Craig, C.; Thompson, A. Cleaning Plant Growth Regulator (PGR) Herbicides out of Field Sprayers. Knoxville, TN: The University of Tennessee Agricultural Extension Service Pub W071:3 p. 2010. Available online: https://trace.tennessee.edu/cgi/viewcontent.cgi?article=1103&context=utk_agexcrop (accessed on 28 May 2020).
- Osborne, P.P.; Xu, Z.; Swanson, K.D.; Walker, T.; Farmer, D.K. Dicamba and 2, 4-D residues following applicator cleanout: A potential point source to the environment and worker exposure. J. Air Waste Manag. Assoc. 2015, 65, 1153–1158. [Google Scholar] [CrossRef] [PubMed]
- Knezevic, S.Z.; Streibig, J.C.; Ritz, C. Utilizing R software package for dose-response studies: The concept and data analysis. Weed Technol. 2007, 21, 840–848. [Google Scholar] [CrossRef]
- Inman, M.D.; Vann, M.C.; Fisher, L.R.; Gannon, T.W. Simulated Spray Tank Contamination with Dicamba. Department of Crop and Soil Services, North Carolina State University. 2014. Available online: https://www.coresta.org/sites/default/files/abstracts/2018_TWC23_Inman.pdf (accessed on 2 April 2020).
- Foster, M.R.; Griffin, J.L. Injury criteria associated with soybean exposure to dicamba. Weed Technol. 2018, 32, 608–617. [Google Scholar] [CrossRef]
- Johnson, V.A.; Fisher, L.R.; Jordan, D.L.; Edmisten, K.E.; Stewart, A.M.; York, A.C. Cotton, peanut, and soybean response to sublethal rates of dicamba, glufosinate, and 2, 4-D. Weed Technol. 2012, 26, 195–206. [Google Scholar] [CrossRef]
- Anonymous. Valor® Herbicide EZ Label; Valent U.S.A. LLC: Walnut Creek, CA, USA, 2019; Available online: https://s3-us-west-1.amazonaws.com/agrian-cg-fs1-production/pdfs/ValorR_EZ_Herbicide2_Label.pdf (accessed on 10 April 2020).


© 2020 by the authors. Licensee MDPI, Basel, Switzerland. This article is an open access article distributed under the terms and conditions of the Creative Commons Attribution (CC BY) license (http://creativecommons.org/licenses/by/4.0/).