Article

Fractal and Topological Analyses and Antioxidant Defense Systems of Alfalfa (Medicago sativa L.) Root System under Drought and Rehydration Regimes

1
Institute of Animal Sciences (IAS), Chinese Academy of Agricultural Sciences (CAAS), Beijing 100193, China
2
Department of Jobs, Precincts and Regions, Private Bag 105, Hamilton, VIC 3300, Australia
*
Author to whom correspondence should be addressed.
Agronomy 2020, 10(6), 805; https://doi.org/10.3390/agronomy10060805
Submission received: 5 April 2020 / Revised: 31 May 2020 / Accepted: 2 June 2020 / Published: 5 June 2020

Abstract

:
Alfalfa (Medicago sativa L.) is a nutritious forage plant in dryland regions with strong drought tolerance and broad adaptability. To understand the architectural characters and physiological functions of the root systems in response to different drought stress and rehydration, two experiments were conducted in a glasshouse. Experiment 1 used three alfalfa cultivars and four soil moisture treatments in a split-plot design with four replicates to investigate the response of root systems of different alfalfa cultivars to drought stress and subsequent rehydration. Experiment 2 used one alfalfa cultivar and four soil moisture treatments in a randomized complete block (RCB) design with three replicates to measure reactive oxidant species and antioxidant defense systems of alfalfa root. The soil moisture treatments included (1) 75–80% of the water-holding capacity (CK); (2) 60–65% of the water-holding capacity and subsequent rehydration to 75–80% of the water-holding capacity; (3) 45–50% of the water-holding capacity and subsequent rehydration to 60–65% and 75–80% of the water-holding capacity; and (4) 30–35% of the water-holding capacity and subsequent rehydration to 45–50%, 60–65% and 75–80% of the water-holding capacity. Our results demonstrated that plants had higher root biomasses (mean = 0.77 g), fractal dimensions (1.47), fractal abundances (3.84), and branching ratios (0.39) under severe water deficit and rehydration than under less stressful soil moisture conditions. Plant root systems tended to exhibit herringbone branching (Topological Index = 0.63) when soil moisture was at 60–65% water-holding capacity with the soil being then rehydrated, whereas they tended to have a smaller lateral root length, root surface area, root volume, and branching ratio and larger root diameter under more favorable soil moisture conditions for less stressful soil moisture treatments. Severe water stress and subsequent considerably improved superoxide (O2) generation rate, the content of hydrogen peroxide (H2O2) and Malondialdehyde (MDA), and non-enzyme antioxidant glutathione (GSH), and reduced the content of ascorbate (AsA) and activity of catalase (CAT), ascorbate peroxidase (APX), and glutathione peroxidase (GPX). It is concluded that Medicago sativa L. cv Zhaodong (ZD) and cv Aohan (AH) exhibited higher drought resistances than cv Golden empress (GE) using topological and fractal analyses. This could be a key contributor to altering optimum soil moisture conditions and screening alfalfa cultivars based on root system architecture and antioxidant defense systems. The molecular functions warrant further investigation which could help explain the observed root phenotypes after drought conditions and rehydration.

1. Introduction

Alfalfa (Medicago sativa L.) is a perennial, productive, high-quality and highly adaptable legume that is widely grown as forage for livestock. It has natural advantages in improving the ecological environment and soil and water conservation due to its deep rooting system. The species is distributed in North America, South America, Asia, Europe, Africa, and Oceania and has been widely sown in pastures. Alfalfa has also been widely planted as a forage crop in China, which contains the largest planting area of this species [1]. Ongoing climate change, characterized by an increase in the frequency and severity of extreme climatic events and adverse weather conditions, threatens global crop production. As a consequence, drought and water shortage have become the most important factors limiting the growth and productivity of major crop species [2].
Plant roots are an important component of the soil ecosystem [3] due to their roles in the absorption, transformation, and storage of water, minerals, and carbohydrates by plants, and the growth and development of the root systems are affected by genetics and environment [4]. Under drought stress, the roots are the first plant organ to sense soil water deficit and respond accordingly, which leads to the production of a larger number of secondary and/or tertiary lateral roots. These meristematic features are effective for the uptake of water that is not uniformly distributed in the soil because roots with smaller diameter have a strong penetration ability and can absorb water in the deeper soil profile. On the other hand, newly produced lateral roots can effectively transport water to the taproot in dry soil.
Compared to other crops, alfalfa has a stronger root system that can efficiently absorb and utilize the moisture in deep soil. This feature of alfalfa is considered one of the main causes of pasture drought resistance [5]. The root system is closely related to aboveground growth and morphological characters that have been analyzed under drought stress [6,7]. The morphological traits of root systems, such as root length, root volume, root diameter, and root dry matter, can reflect the health of the root system and can be used to assess drought resistance in pastures [8,9,10,11]. After exposure to drought stress, plant roots undergo a series of changes in growth and development, morphology/anatomy, biomass, and physiological and biochemical metabolism in order to adapt to the dry conditions.
Root system plasticity is the ability of an individual organism to alter its root morphology in response to changes in environmental conditions [12]. Root system architectural change is one of the main forms of plasticity and is affected by environmental factors and genetic factors [13]. Root system architecture refers to the spatial structure and distribution of roots in the growth medium and is known to be a major determinant of root functions in the acquisition of soil resources such as nutrients and water [14,15]. Studies of root system architecture have focused on root geometry and topological parameters. The geometric parameters primarily include root length, root diameter, root biomass, and branch angle. The branching status of roots is reflected by the number of links, root branching ratio and spatial distribution of roots in the soil layer. Recently, root topology and root system architecture have attracted increasing research interests [16]. Some studies [17,18,19] have proposed that root topology has two extreme branching patterns, namely, dichotomous and herringbone branching, and the topological index (TI) is used to show the different branching patterns of plant root systems. Moreover, the nutritional competitiveness of different branching patterns was assessed, and dichotomous branching was found to be more suitable for poor habitats [20].
Fractal geometry is widely applied to assess root system architecture and the distribution of root systems in soils [4,21]. Fractal dimension (FD) is correlated with root topology [16] and root systems architecture [22]. The characterization of root system architecture would assist in better understanding the functional and growth strategies of plant root systems when they are faced with an insufficient supply of soil water [23]. FD is closely related to the branching pattern of roots, while the fractal abundance (FA) is associated with the volume of space explored by roots [24].
Water deficit has significant effects on plants at the physiological and molecular levels [25]. This stress can disrupt the dynamic equilibration of reactive oxygen species (ROS), which results in the suppression of plant growth, changes in morphology, and reductions in yield [26]. ROS, such as superoxide (O2), hydrogen peroxide (H2O2), and hydroxyl radical (OH), can decrease cellular structural integrity and physiological and biochemical processes as a result of its effects on phosphatide peroxidation, protein degradation, and DNA fragmentation, and thereby cause substantial cellular damage [27]. To mitigate and cope with the deleterious effects of ROS, plants have developed a complex antioxidant defense system [28]. The enzymatic antioxidants include superoxide dismutase (SOD), catalase (CAT), glutathione peroxidase (GPX), glutathione S-transferase (GST), glutathione reductase (GR), and ascorbate peroxidase (APX) [29]. H2O2 is scavenged by CAT, APX, and GPX, but the functions of APX and GPX must rely on existing non-enzymatic antioxidants such as ascorbate (AsA) and glutathione (GSH) [30].
Drought and rehydration often act as a continuous process in farming practice. Different varieties of the same plant exhibit different levels of drought tolerance and resilience over the course of drought and rehydration. The response of crops to rehydration involves rapid growth after the stress is relieved to compensate for the partial losses caused by water deficit. Plant resilience plays an important role in crop production after drought and rehydration. Plants undergo a series of changes in morphological, physiological and biochemical aspects under the drought and rehydration process, which requires the synergistic responses of the aboveground leaves and belowground roots. Previous studies focused on plant shoots, examining their morphological, physiological and molecular mechanisms of drought resistance [5,31,32,33]. In contrast, very few studies [34] have evaluated the architecture of whole root systems in response to soil drought and rehydration using fractal theory and topological analysis.
In this study, we examined root system architectural and morphological responses of alfalfa to changes in water deficit and rehydration using fractal and topological analyses. The aims of this study were (1) to explore the optimum soil moisture for plant root growth using topological and fractal analyses, (2) to discover whether it is possible to manipulate root system architectural features by altering soil moisture conditions in order to screen alfalfa cultivars based on drought tolerance, and to expand knowledge of the root architectural plasticity of alfalfa in agriculture, and (3) to identify the differential physiological pattern of alfalfa root on enzyme activity in response to various soil moistures, which could help elucidate the spatial traits and physiological mechanisms of the root system in alfalfa grown in arid and semiarid regions.

2. Materials and Methods

2.1. Experimental Location, Description, and Treatments

Two experiments were conducted in a controlled greenhouse at the Institute of Animal Science, Chinese Academy of Agricultural Science from January to May 2019, with 20–25 °C and 60% humidity under a 16 h light/8 h dark photoperiod. The first experiment (Experiment 1) examined root systems architecture and root morphological traits. The second experiment (Experiment 2) examined root reactive oxygen species and antioxidant defense systems. Four soil moisture treatments were imposed in both experiments. They were: (I) soil water content was kept at 75–80% of the water-holding capacity throughout the experiment (control, CK); (II) 60–65% of the water-holding capacity for four weeks and subsequent rehydration to 75–80% of the water-holding capacity for three weeks; (III) 45–50% of the water-holding capacity for four weeks and subsequent rehydration to 60–65% of the water-holding capacity for one week and 75–80% for two weeks; and (IV) 30–35% of the water-holding capacity for four weeks and subsequent rehydration to 45–50% of the water-holding capacity for one week, 60–65% for one week and 75–80% for the final week. Details of the experimental treatments are described below (Supplemental Table S1).

2.2. Seedling Establishment, Transplanting, and Management

The experiments were conducted using 18-cm-wide, 50-cm-deep cylindrical pots. The potting mix (sterilized) contained 80% nutrient-enriched soil and 20% sand with 65.0% organic matter, 1.6% total nitrogen, 0.1% total P2O5, 0.2% total K2O and 1 kg/m3 bulk density (N:P:K = 14:10:18). Prior to sowing, seed from each alfalfa cultivar was disinfected with sodium hypochlorite (1% NaClO) for 30 min and washed with deionized water four times, and then 100 seeds of each alfalfa cultivar were placed in two petri dishes containing two pieces of filter paper wetted with 4 mL of deionized water. Germinated seedlings were incubated in a growth chamber under a 16 h light and 8 h dark (temperature = 25 °C) cycle for approximately 8 days. The seedlings were transplanted into each pot. A nylon mesh bag was placed in each pot, filled with 3.0 kg of potting mix (mix sieved with 5-mm mesh, pH = 6.0), and planted with one seedling. Nitrogen fertilizer was applied at 10 kg urea/ha (4.6 kg N/ha) prior to planting. All pots were checked and watered regularly to ensure sufficient moisture for plant growth before drought and rehydration treatment. Drought treatments were then imposed for four consecutive weeks and subsequent rehydration for one week with different water deficits. Each pot was weighed, and the loss water was added to maintain the corresponding soil moisture during the period of drought stress and rehydration in Experiment 1 and Experiment 2.

2.3. Determination of Water Holding Capacity

Water holding capacity for each pot was determined by weighing the dry pot, watering until it dripped, letting the pot stand 48 h, and weighing it again. The difference between the dry and next-day weight of each pot was recorded as pot capacity.
At the start of the experiments, pots with dry potting mix were weighed and then watered until they were fully saturated. They were then drained for 48 h, and individual pots were weighed again to determine water holding capacity (moisture content at this point), which were used as the basis to calculate moisture and rehydration levels of the treatments.

2.4. Experiment 1

2.4.1. Materials

Three alfalfa cultivars were used in the experiments. They were cv. Zhaodong (ZD), Golden empress (GE) and Aohan (AH), commonly grown in northern China, which represented the range in drought tolerances of cultivars grown in the region, were selected for the study. ZD is suitable to grow in the semiarid areas with annual rainfall of 350 to 800 mm, annual evaporation of 2534 mm, and annual average temperature of 6.4 °C. GE is an indigenous forage grown in the semiarid regions with annual rainfall of 400 to 600 mm, annual evaporation of 1500 mm, and annual average temperature of 8.7 °C, and AH is an improved cultivar with high yield.

2.4.2. Design

A split-plot design was used, with the three cultivars as the main plots and four soil moisture and rehydration treatments as the subplots. The combined 3 × 4 = 12 treatments were replicated four times.

2.4.3. Root Sampling

At the end of the experiment, the nylon mesh bag in each pot was removed carefully in order to maintain their original spatial distribution and to minimize damage and disturbance to the root systems. The roots were washed thoroughly by hand, rinsed with deionized water, and then put evenly in a clear acrylic tray with 1 cm of water and scanned at 600-dpi resolution with a MICROTEK Scan Maker (i800plus). After scanning, the root samples were oven-dried at 65 °C for at least 48 h.

2.4.4. Measurements

Root Characteristics

Win-RHIZO 2017a (Regent Instruments, Inc., Quebec, QC, Canada) was used to analyze the scanned images. The routines used include thresholding, framing, editing to fix breakpoints and eliminate loops in the image and obtain root diameter, root surface area, root volume, root length, and lateral root number. The TI, FDs, FA and root branching ratio (BR) were also calculated. The details are described below.

Fractal Analysis

Digitized root images were used for fractal analysis following the box-counting method [35] within Win-RHIZO software. Each root image was first covered with a frame, and the frame was divided into boxes (grids) with side length r. The size of the boxes was designated from 200 to 3200 pixels (0.008–0.127 mm). The number N(r) of boxes that intersected with the image was counted. The number N(r) of boxes gradually increased with decreasing side length r. When plotting N(r) against r on a lg–lg scale, the power-law relationship N(r) = Kr − D was obtained if the image was fractal. The two constants D and lg K were calculated based on the equation lg Nr= −FD lgr + lg K as the fractal parameters. The negative value of the slope of regression line was the FD, and lg K was the FA [17,23].

Topological Index

Two extreme patterns of root topology were proposed: herringbone and dichotomous branching [18,19] (Figure 1). With both patterns, topological index (TI) is used to reflect the branching patterns of different plant roots, and is defined as log altitude (A)/log magnitude (M) (A is the total number of internal links in the root system and M is the total number of external links in the root system). Most studies [15,36] have shown that the majority of plant root topologies are between dichotomous and herringbone branching patterns. The root system tends to exhibit herringbone branching when TI is close to 1, and dichotomous branching when TI is close to 0.5.

Branching Ratio

Plant root orders were assessed and determined from the outside to the inside of the root crown: the first group of small roots in the outer layer of the root crown was classified as the first-level roots, the interlinks between two first-level roots were the second-level roots, the interlinks between two second-level roots were the third-level roots, and so on. If there were roots from two or more different levels, the level of the root group was determined as the roots with the highest level. Then, the root coefficient (Ni) of each level (i) was calculated. The level (i) was plotted on the x-axis, and lg Ni was plotted on the y-axis. The two constants i and lg Ni were calculated using regression analysis. The inverse logarithm of the slope of the regression line was defined as the root system’s total branching ratio.

2.5. Experiment 2

2.5.1. Material, Treatment, Design and Root Sampling

One alfalfa cultivar cv ZD was used in Experiment 2. The four soil moisture treatments identical to that in Experiment 1 were arranged in a randomized complete block (RCB) design with three replicates. At the end of Experiment 2, the nylon mesh bags were removed from each pot after completely soaking in the water for about 5–10 min and then plant roots were washed by hand to avoid damage to the plant root. Root samples were collected and frozen in liquid nitrogen, and then stored at −80 °C until they were processed.

2.5.2. Measurements

Detection of H2O2 and O2

The level of hydrogen peroxide (H2O2) was determined with spectrophotometry–colorimetry at 415 nm as described by Willekens, et al. [37]. Roots (0.1 g) were homogenized in 4 mL 0.1% (w/v) TCA in an ice bath and the extract was centrifuged at 12,000× g for 10 min at 4 °C. The rate of O2 generation was measured following Elstner and Heupel [38]. Roots (0.1 g) were homogenized in 4 mL, 65 mM phosphate buffer (pH 7.8) and centrifuged at 5000× g for 15 min at 4 °C. The absorbance of the supernatant was read at 530 nm after the addition of an equal volume of ether and centrifugation at 3000× g for 3 min.

Determination of Malondialdehyde (MDA)

The MDA concentration as the marker of lipid peroxidation was determined using the modified technology described by Heath and Packer [39]. Root samples (0.5 g) were powdered with liquid nitrogen and homogenized with 5 mL of 20% TCA. Absorbance was measured at 450 nm, 532 nm, and 600 nm using a spectrophotometer.

Estimation of Ascorbic Acid (AsA) and Reduced Glutathione (GSH)

Root tissue was extracted with 6% TCA and centrifuged at 15,000× g for 5 min (4 °C), and the supernatant was used for AsA and GSH assays [40]. The content of AsA was determined following a previously established method [40]. The supernatant (0.2 mL) was neutralized with 0.5 mL of 0.2 M K-phosphate buffer (pH 7.4) and 0.1 mL dithiothreitol (DTT; reducing DHA to AsA). The reaction mixture was incubated at 30 °C for 90 min, and the concentration was determined spectrophotometrically at 534 nm.
GSH content was determined following the method of Griffith [41]. Supernatant (0.2 mL) was neutralized with 1.4 mL of 50 Mm K-phosphate buffer (pH 7.5). Based on enzymatic recycling, glutathione was oxidized by 2-nitrobenzoic acid (DTNB) and reduced by NADPH in the presence of GR, and total GSH content was evaluated by the rate of absorption changes at 412 nm.

Antioxidant Enzyme Extraction and Activity Assays

Root samples of 0.5 g were ground with a pestle and a pre-chilled mortar in liquid nitrogen. Root tissue (0.5 g) was homogenized with 5 mL of ice-cold extraction buffer, 100 mM potassium phosphate-buffered saline (PBS), and 0.1 mM Na2EDTA with pH = 7.0–7.4. The homogenate was filtered through four layers of muslin cloth and centrifuged at 16,000× g for 20 min at 4 °C. The supernatant was used as an enzyme extract for enzyme activity assays [42]. All extracts were prepared at 4 °C, and the measurements of enzymatic activity were performed at 25 °C.
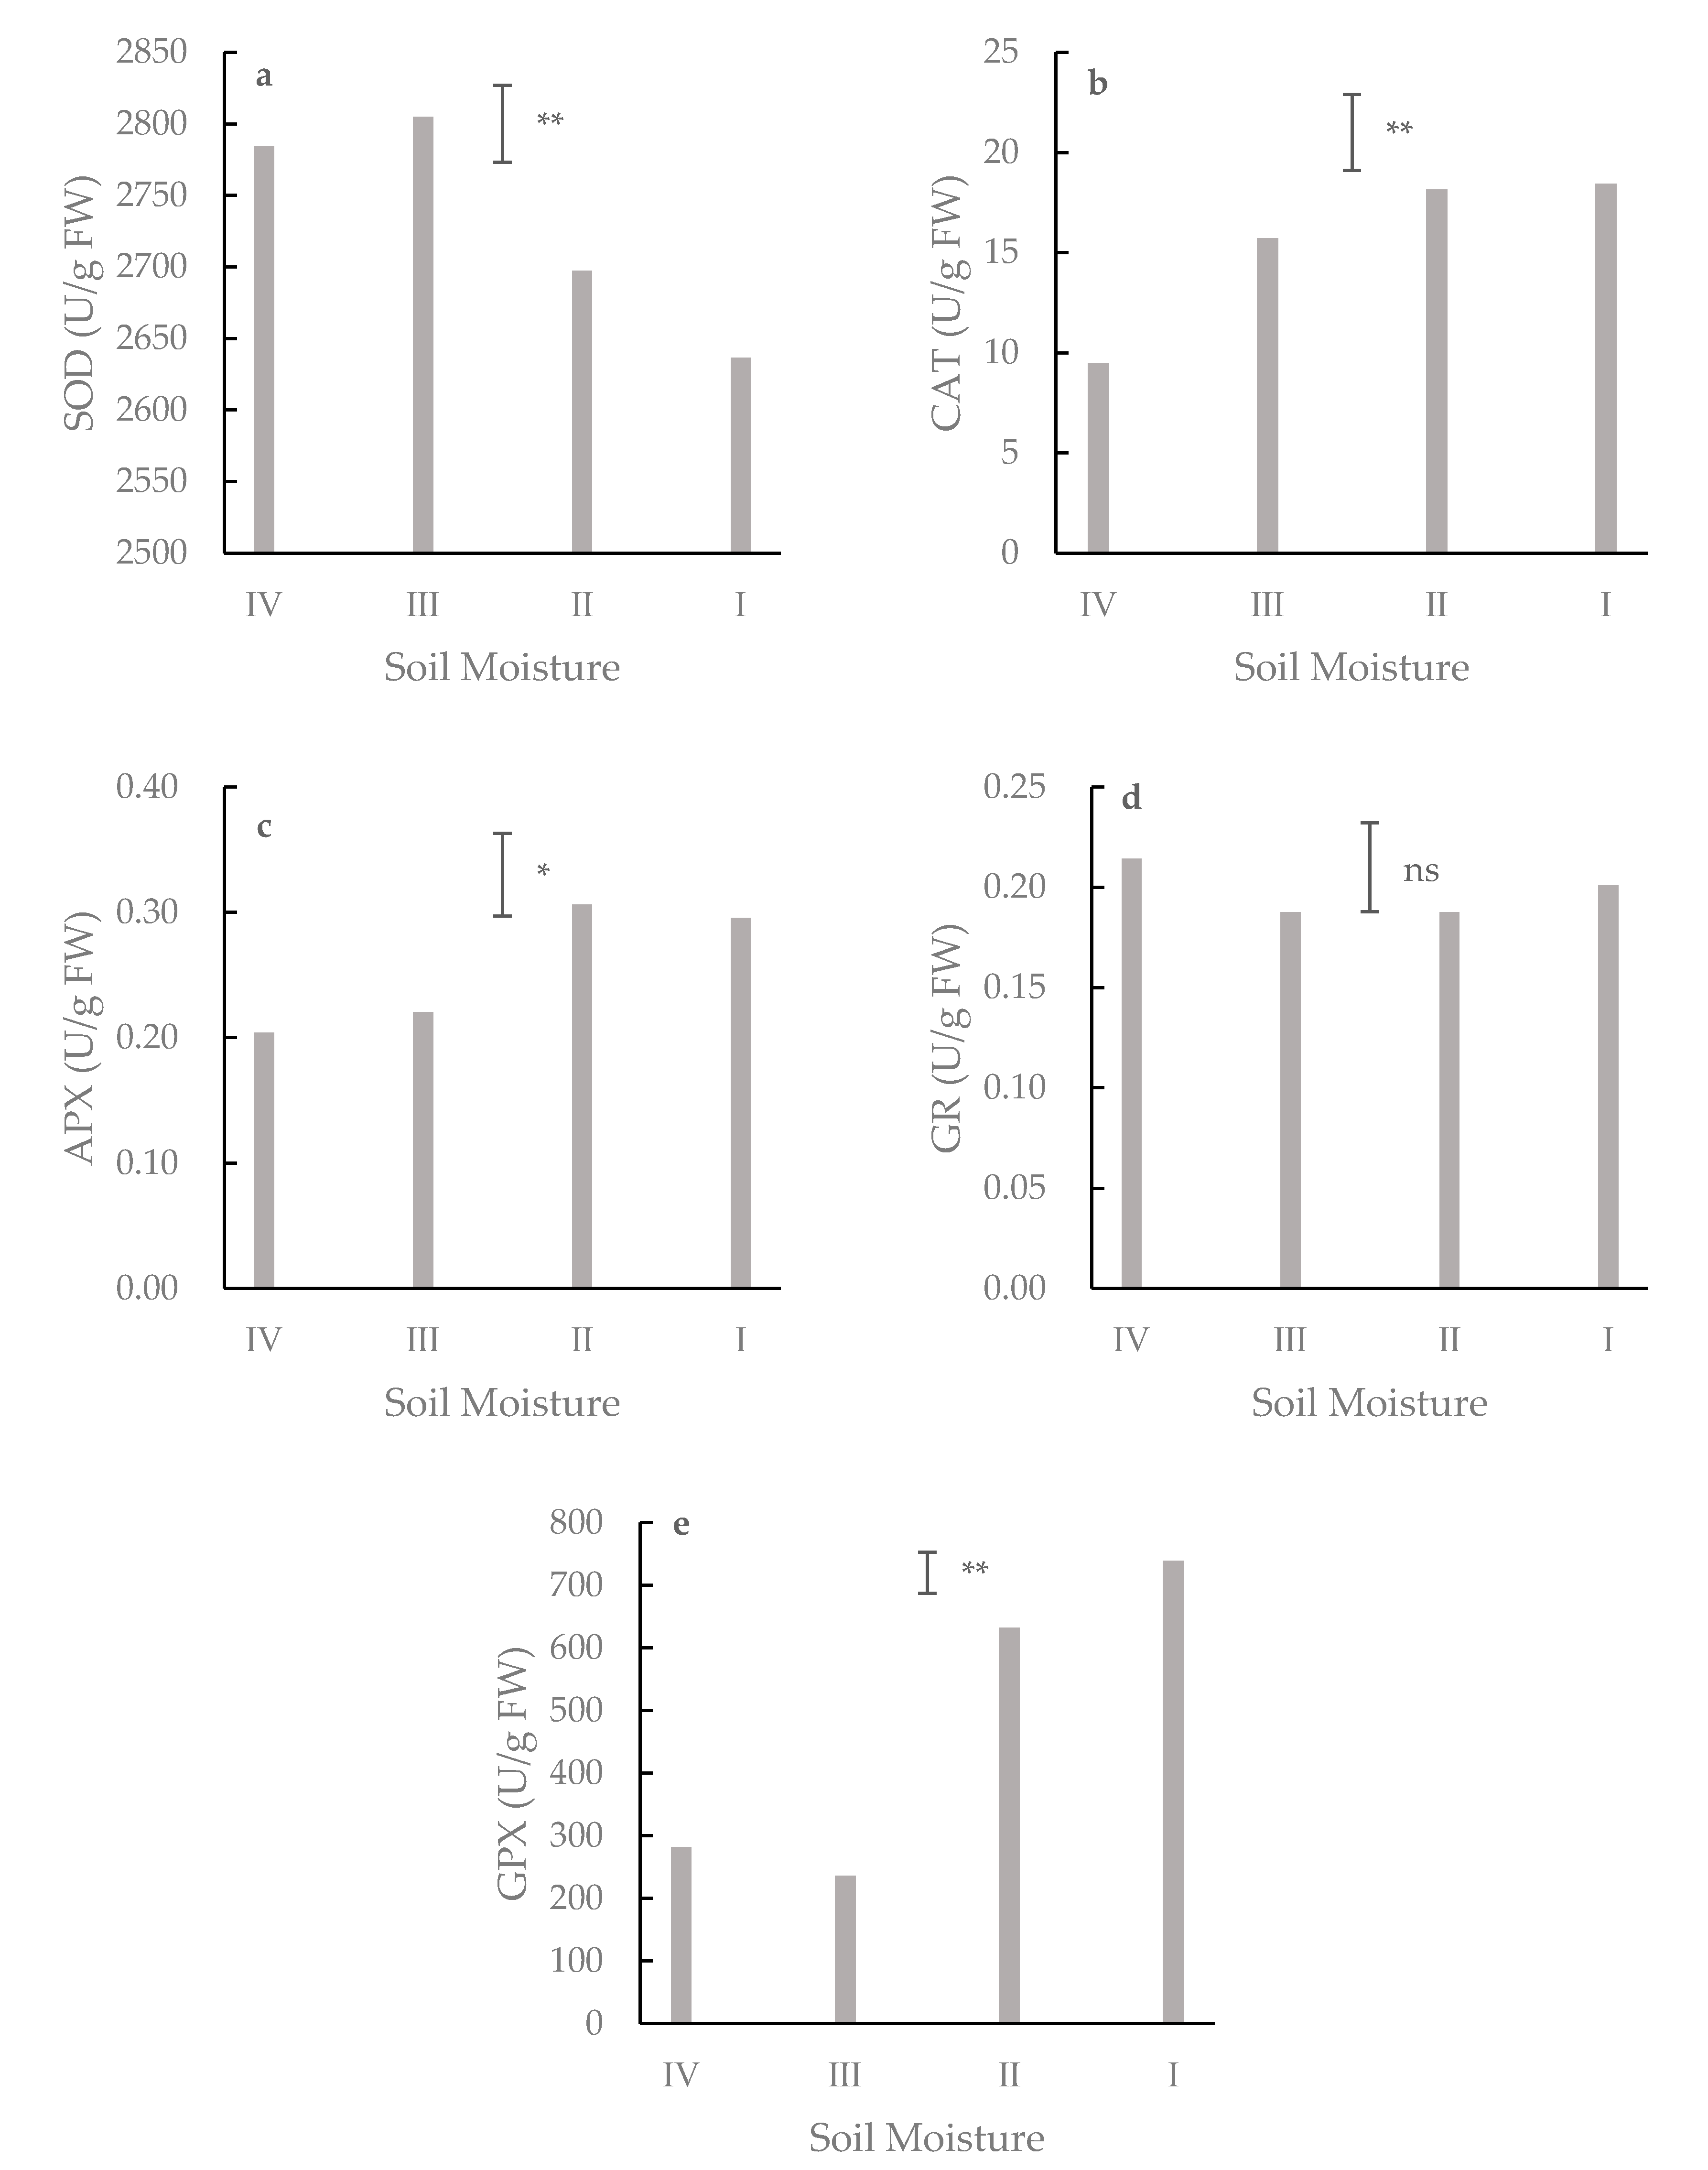
In the superoxide dismutase (SOD) activity [43], the enzyme extract (50 μL) was added into 3 mL mixture (2.7 mL of 14.5 mM methionine, 90 μL of 50 mM PBS, 100 μL of 60 μM riboflavin, 100 μL of 2.25 mM nitro-blue tetrazolium, 10 μL of 30 μM EDTA), then reacted in an illumination incubator (4000 l×) for 20 min, and the absorbance was recorded at 560 nm.
In the catalase (CAT) activity [44], the enzyme extract (100 μL) was mixed with 3 mL of 0.15 M PBS and 5 μL of 0.1 M H2O2. The absorbance was recorded at 240 nm.
In the ascorbate peroxidase (APX) activity [44], the reaction mixture contained 50 mM PBS (pH 7.0), 0.5 mM AsA, 0.1 mM EDTA, 0.1 mM H2O2, and 30 μL of enzyme extract in a final volume of 2 mL. The activity was calculated from the recorded decrease in absorbance at 290 nm for 1 min. One unit of APX was defined as the amount of enzyme that oxidizes 1 µmol of AsA per minute at room temperature.
In the glutathione peroxidase (GPX) activity [45], the reaction mixture contained 100 mM PBS (pH 7.0), 1 mM EDTA, 1 mM NaN3, 0.12 mM NADPH, 2 mM GSH, 1 μ GR, 0.6 mM H2O2 (as a substrate), and 30 μL of enzyme extract. The reaction was initiated with H2O2. The change in absorbance was recorded at 340 nm.
In the glutathione reductase (GR) activity [46], the reaction mixture consisted of 0.1 M PBS (pH 7.0), 1 mM EDTA, 1 mM GSSG, 0.2 mM NADPH, and 50 μL of enzyme extract. The reaction was started by the addition of GSSG. A decrease in absorbance was recorded at 340 nm.

2.6. Statistical Analyses

All data were analyzed using the general analysis of variance (ANOVA) procedure in GENSTAT release 18.0 (VSN International 2009). A split-plot model with repeated measures was used to analyze the main effects of water treatments and alfalfa cultivars, and their interaction on topology, fractal features, the branching ratio and root morphological traits for Experiment 1. An RCB model was used to analyze MDA, reactive oxygen species (O2, H2O2, ASA, and GSH) and antioxidant enzyme activity (SOD, CAT, APX, GR, and GPX) for Experiment 2. A significant difference was quoted at p < 0.05 or 0.01 and no significant difference between treatments indicates the probability was greater than 5% (p > 0.05).

3. Results

3.1. Experiment 1

3.1.1. Root Biomass

There was no significant (p > 0.05) interaction between alfalfa cultivar and soil moisture treatment on root biomass (Figure 2). Soil moisture had a significant (p < 0.01) effect on root biomass, but alfalfa cultivar did not (Table 1). The root biomass was higher when soil moisture was at 30–35% followed by rehydration to 45–50%, 60–65% and 75–80% water holding capacity, 28.3% higher than that of when soil moisture was 45–50% followed by rehydration to 60–65% and 75–80% water-holding capacity, 26.2% higher than that of when soil moisture was always at 75–80% water holding capacity, and 51.0% higher than when soil moisture was 60–65% followed by rehydration to 75–80% water holding capacity (Table 1).

3.1.2. Topological Index

There was a significant (p <0.01) interaction between alfalfa cultivar and soil moisture on TI (Figure 3). TI was the highest (0.63) when the soil water content was at 60–65% soil water-holding capacity followed by rehydration to 75–80% water holding capacity. TI was lower when soil moisture was at 40–45% water holding capacity followed by rehydration to 60–60% and 75–80% water holding capacity, and when soil moisture was at 75–80% water-holding capacity TI was lowest when soil moisture was at 30–35% followed by rehydration to 45–50%, 60–65% and 75–80% water holding capacity (Table 2).

3.1.3. Average Link Length

There was a significant (p < 0.01) interaction between soil moisture and alfalfa cultivar on the average link length (Figure 4). GE had the smallest average link length (0.90 mm) when the soil moisture treatment was at 30–35% of the water-holding capacity followed by rehydration to 75–80% of the water-holding capacity. The average link length of all alfalfa cultivars peaked at 1.17 mm (means) when the soil moisture treatment was 60–65% of the water-holding capacity followed by rehydration to 75–80% of the water-holding capacity (Table 3).

3.1.4. Fractal Analysis

Drought stress and rehydration treatment had significant (p < 0.01) effects on FDs and FA, but alfalfa cultivar did not (Table 4). There were significant (p < 0.01) interactions between alfalfa cultivar and soil moisture treatment on FDs and FA (Figure 5a,b). The FD value of the root system was the highest (mean = 1.47) when soil water content was at 30–35% water-holding capacity followed by rehydration to 45–50%, 60–65% and 75–80% water holding capacity, followed by that of soil water content at 45–50% followed by rehydration to 60–65% and 75–80% water holding capacity, and FD was the lowest (mean = 3.71) when soil moisture was at 60–65% water holding capacity followed by rehydration to 75–80% water holding capacity (Table 4).
The FA values were the lowest (mean = 3.71) when soil moisture was at 60–65% of water holding capacity followed by rehydration to 75–80% water holding capacity. These values peaked at 3.84 when soil moisture was at 30–35% water holding capacity followed by rehydration to 45–50%, 60–65% and 75–80% water holding capacity (Table 4).

3.1.5. Root Branching Ratio

There was a significant (p < 0.05) interaction between soil moisture and alfalfa cultivar on the branching ratio (Figure 6). The root branching ratio was highest when soil moisture was at 75–80% (root branching ration = 0.38) and 30–35% followed by rehydration to 45–50%, 60–65% and 75–80% water holding capacity (root branching ration = 0.39) (Table 5).

3.1.6. Taproot and Total Lateral Root Lengths

There was no significant interaction between them either (Table 6), and neither soil moisture nor alfalfa cultivar had a significant (p > 0.05) effect on the taproot length (Table 7), and. There was a significant (p < 0.05) interaction between soil moisture and alfalfa cultivar on lateral root length (Table 6). The lateral root length was longer when the soil moisture was at 75–80% water-holding capacity and 30–35% water-holding capacity followed by rehydration to 45–50%, 60–65% and 75–80% water holding capacity.
There was a significant (p < 0.01) interaction between soil moisture and alfalfa cultivar on the lateral root number (Table 6). The number of lateral roots peaked at 310.2 when the soil moisture treatment was at 30–35% water-holding capacity followed by rehydration to 45–50%, 60–65% and 75–80% water holding capacity (Table 7).

3.1.7. Average Root Diameter, Surface Area, and Volume

There were significant (p < 0.01) differences in average root diameter, root surface area and root volume among alfalfa cultivars and among soil moisture regimes (Table 8), and there were significant (p < 0.01) interactions between alfalfa cultivar and soil moisture on average root diameter, root surface area and root volume (Figure 7a–c). Root average diameter was higher (mean = 0.41 cm) when soil moisture was at 60–65% water holding capacity followed by rehydration to 75–80% water holding capacity. On the contrary, the average root diameter was the least when soil moisture was at 30–35% followed by rehydration to 45–50%, 60–65% and 75–80% water holding capacity (Table 8). The average root diameters of AH and GE increased first and then decreased, whereas that of ZD remained at 0.35–0.37 cm. The root surface area and root volume of AH and ZD were lowest when soil moisture was at 60–65% water holding capacity followed by rehydration to 75–80% water holding capacity (Figure 7b,c). However, the root surface area and volume of GE appeared to decline with decreasing soil moisture stress followed by rehydration to 75–80% water holding capacity.

3.2. Experiment 2

3.2.1. O2 Generation rate and H2O2 and MDA Content

There were significant differences (p < 0.01) on the O2 generation rate and H2O2 content (Figure 8a,b) under various soil moisture regimes. Both O2 generation rate and H2O2 content remained lower when soil moisture remained at 75–80% water-holding capacity, at 14.3 U g−1 FW and 55.5 μmol g−1 FW, respectively. On the contrary, O2 generation rate peaked at 15.3 U g−1 FW when soil moisture was at 30–35% water-holding capacity followed by rehydration to 45–50%, 60–65% and 75–80% water-holding capacity. H2O2 content showed a similar trend with O2 generation rate under soil moisture treatments.
There was a significant difference (p < 0.01) on MDA content under various soil moisture regimes (Figure 8c). Significant effects were detected for MDA content of root in alfalfa, which appeared to have higher MDA content when soil moisture was 30–35% water-holding capacity followed by rehydration to 45–50%, 60–65%, and 75–80% water-holding capacity. On the contrary, the content of MDA was the lowest when soil moisture remained at 75–80% water-holding capacity.

3.2.2. ASA and GSH Homeostasis

There were significant (p < 0.01) differences in ASA and GSH in alfalfa root among various soil moisture treatments (Figure 9). ASA content peaked at 83.5 μg/g FW when soil moisture was at 60–65% followed by rehydration to 75–80% water-holding capacity, compared with 76.5 μg/g FW when soil moisture remained at 75–80% water-holding capacity, 23.5% higher than when soil moisture was at 45–50% water-holding capacity followed by rehydration to 60–65%, 75–80% water-holding capacity, 46.7% higher than when soil moisture was at 30–35% followed by rehydration to 45–50%, 60–65%, 75–80% water-holding capacity (Figure 9a).
The lower content of GSH was detected when soil moisture was at 45–50% followed by 60–65% and 75–80% water-holding capacity; GSH peaked at 169.0 nmol/g FW when soil moisture was 30–35% followed by rehydration to 45–50%, 60–65%, and 75–80% water-holding capacity and was lowest when soil moisture was kept at 75–80% water-holding capacity (Figure 9b).

3.2.3. Antioxidant Enzyme Activity

There were significant (p < 0.05 or 0.01) differences in enzyme activity of SOD, CAT, APX and GSH-PX between soil moisture treatments (Figure 10a–c,e), but not in the activity of GR (Figure 10d). SOD enzyme had higher activity under 30–35% of the water-holding capacity for 4 weeks and subsequent rehydration to 45–50%, 60–65%, 75–80% of the water-holding capacity, followed by 45–50% of the water-holding capacity for four weeks and subsequent rehydration to 60–65% of the water-holding capacity for one week and 75–80% for two weeks, 60–65% of the water-holding capacity for four weeks and subsequent rehydration to 75–80% of the water-holding capacity for three weeks and the control, at 2804.8, 2784.6, 2697.3 and 2636.5 U/g FW (Figure 10a). CAT had higher enzyme activity (18.4 U/g FW) when soil moisture remained at 75–80% water-holding capacity, compared with 18.2 U/g FW when soil moisture was 60–65% followed by rehydration to 75–80% water-holding capacity, 15.7 U/g FW when soil moisture was 45–50% followed by rehydration to 60–65% and 75–80% water-holding capacity and 9.49 U/g FW when soil moisture was 30–35% followed by rehydration to 45–50%, 60–65% and 75–80% water-holding capacity (Figure 10b). Under 60–65% soil moisture followed by rehydration to 75–80% water-holding capacity, the activity of APX was 0.31 U/g FW, 40.9% more than that under 45–50% moisture followed by rehydration to 60–65%, 75–80% water-holding capacity, and 55.0% more than that under 30–35% soil moisture followed by rehydration to 45–50%, 60–65%, and 75–80% water holding capacity (Figure 10c). Under 75–80% water-holding capacity, the activity of GPX was 16.4% higher than that when soil moisture was 60–65% followed by rehydration to 75–80% water-holding capacity, three times higher than that when soil moisture was at 45–50% followed by 60–65% and 75–80% water-holding capacity, two times higher than that when soil moisture was at 30–35% followed by 45–50%, 60–65% and 75–80% water-holding capacity (Figure 10e).

4. Discussion

4.1. Root Biomass

Variation in biomass allocation reflects plant adaptation to different habitats. Water is the main factor limiting plant growth in arid and semiarid regions. Under soil water stress, plants can obtain more water to adapt to drought stress through changes in biomass [47]. Plants can improve water use efficiency by reducing aboveground biomass and increasing belowground biomass under water deficit conditions [48]. In this study, under severe water stress and rehydration conditions, root biomass was high, indicating that plants can transfer less water from belowground to aboveground and provide enough water for root growth. The root biomass of GE gradually increased and then decreased with decreasing soil water content, whereas the root biomass of AH and ZD decreased initially and then increased from less stressful water deficit and subsequent rehydration to severe soil moisture followed by rehydration, reflecting the differences in their ability to allocate photosynthetic products to roots in response to soil moisture stress [49].

4.2. Root Systems Architecture

The study of root system architectural features mainly concerns root geometry and topological parameters, and the branching status of the root system is mainly reflected by the link number, the branching rate of the root system and the spatial distribution of root systems in the soil layers [20]. The topological properties of root systems have received considerable attention in the literature [36,50]. The topological structure is an important component of root system architecture, determines the spatial distribution of plant root systems in the soil and affects the capacity for nutrient absorption and water uptake [36,51]. Some researchers [52] have developed theoretical approaches to evaluating topology, which indicate that dichotomously branched root systems (TI < 1) have a greater capacity to acquire soil moisture and nutrients than do herringbone-branched root systems (TI = 1). The main purpose of root topology measurement is to explore how root systems branching changes in response to habitat conditions [53]. In this study, the topological analysis was used to quantify the root system architecture of alfalfa under different water deficit and subsequent rehydration conditions. The TI was lower when soil moisture was at 30–35% and then rehydrated to 45–50%, 60–65% and 75–80% water holding capacity than for other treatments, indicating that root systems tend to exhibit dichotomous branching pattern under severe water deficit followed by rehydration. Plant roots develop in the soil and form a complex system of branches in order to uptake nutrients and water. Fractal analysis can be a useful tool for qualitatively describing root system morphology and accurately showing differences in plant root development. FDs illustrate the differences in root system structures under various stress conditions, and root FA can show the expanded volume of plant roots in soil [54]. The FD value also indicates the number of plant root branches in the soil with larger FA values indicating that the plant root system has a larger volume range in the soil. The two-dimensional FD and FA fractal values obtained in this study were greatest when the soil moisture treatment was 30–35% of the water-holding capacity followed by rehydration to 75–80% of the water-holding capacity, demonstrating that alfalfa root systems had more branches and a larger volume range in response to severe water deficit followed by rehydration. The FA level of alfalfa showed similar trends with FD in response to drought stress and rehydration in this experiment. The FA of roots is related to the extent, spatial expansion ability and water and nutrient absorption efficiency of the root systems.
Fitter [55] found that it is closely related to the root branch structure and the link length, and root link length reflects the number of lateral roots and spatial distribution of root systems. Our result showed that under serious water deficit followed by rehydration, the average link length of the root systems was smaller, and total lateral root length was significantly longer and lateral root number significantly greater than those observed under less stressful and rehydration treatments, which indicated that alfalfa had developed more lateral roots to expand the distribution area of its root system in soil in response to serious water stress and subsequent rehydration. Root system length directly affects the ability of roots to expand spatially, absorb nutrients and uptake water in the soil [21].
Root branching of plants tends to change in a heterogeneous resource environment; thus, root branching may reflect the ability of roots to respond to the environmental changes. A high branching ratio may indicate the plant’s adaptation to increase water uptake by increasing root branching under stressful conditions. In this study, alfalfa exhibited more root system branching under more severe drought stress followed by rehydration. The root system parameters of GE differed from those of ZD and AH when the soil moisture treatment was less than 40–45% or more than 60–65% of the water-holding capacity followed by rehydration. These parameters may be key indicators of alfalfa varieties in terms of drought resistance [56]. Overall, these parameters have shown that GE had lower drought resistance than ZD and AH. Root system architecture may be a useful trait for screening alfalfa cultivars based on drought tolerance.

4.3. Root Morphological Traits

Under water stress, plant roots undergo morphological and physiological changes [57]. As the water deficit increases, plants can increase their root length, root surface area, specific root length, and specific surface area and reduce their root diameter to improve their access to soil water [58,59,60]. In this study, under severe water deficit followed by rehydration, all alfalfa cultivars reduced their average root diameter and increased their root volume and root surface area in response to water fluctuation. This demonstrates that reducing the taproot diameter and increasing the number of lateral roots may have been an important adaptation strategy for plants to survive under moisture stress [61,62].
Average root diameter was greater and root volume and root surface area were lower when the soil moisture treatment was at 60–65% of the water-holding capacity followed by rehydration than for all other treatments, which indicated that the optimal soil moisture level for alfalfa growth may have been in this range (60–65% of the water-holding capacity), and plants can change their root morphological traits in order to get access to more water in the soil profile for growth [63]. There was a tendency for the root surface area and root volume of different cultivars to increase with decreasing soil moisture. This is in line with the report by [64] that alfalfa varieties respond to a water deficit by increasing their root length and root volume and reducing their root diameter because of their relatively stronger resistance to drought.

4.4. Reactive Oxygen Species and Antioxidant Defense Systems

Drought stress induces a loss of balance between the light reactions and the Calvin–Benson cycle, which resulted in the production of ROS by the transfer of electrons to molecular oxygen. The production of ROS will increase when plants are subjected to diversified stress [65]. In our experiment, free radicals (O2 generation rate) and nonradical compounds (H2O2) were higher in both soil moisture treatments except for the control.
Over-production of ROS leads to cell membrane damages via lipid peroxidation. MDA, which is a product of lipid peroxidation, is associated with the accumulation of ROS, resulting in the damage of cell membrane integrity in plants [66]. Our results showed that MDA content was less when soil moisture was at 75–80% water holding capacity indicating that rehydration did not reduced the production of MDA in alfalfa root after drought stress.
Antioxidant enzyme is the most direct and useful substance to scavenge ROS in plants [67]. Being the first line of the enzymatic defense system, SOD converts toxic O2 to the more stable H2O2 [68]. The result of this study showed that SOD activity increased in both soil moisture treatments except for 75–80% water holding capacity and was consistent with the change of O2generation rate, which indicated that rehydration could not reduce the activity of SOD after drought stress.
The enzyme SOD acts as a first line of defense by catalyzing O2 into H2O2 and O2. In return, other antioxidant enzymes such as APX, CAT, POD, and GR break down H2O2 using different pathways [69]. CAT is a tetrameric heme-containing enzyme responsible for catalyzing the dismutation of H2O2 into H2O and O2. In our experiment, the CAT activity was lower among soil moisture treatments than the control (soil moisture at 75–80% water holding capacity) indicating that drought and subsequent rehydration could decrease CAT activity. However, whether this decrease was attributed to moisture stress or rehydration needs further investigation given various moisture stress levels followed by rehydration were treated as systems to mimic practical scenarios in the current experiment. In addition, APX, GPX, and GR are potential enzymes that participate in the AsA-GSH cycle playing indispensable roles in scavenging ROS and maintaining the AsA and GSH levels [70]. GPX and GR also participated in the ROS-scavenging process by the conversion between GSH and Oxidized glutathione (GSSG) [67]. The GPX activity under more stressful water deficit followed by rehydration demonstrated that antioxidant defense systems in the ROS-scavenging process could be impaired to a higher degree under these treatment conditions. GSH can help to maintain normal immune system function and has antioxidant and detoxification effects [71]. The content of GSH was greater for all soil moisture stress and rehydration treatments than the control (75–80% water holding capacity) in this experiment, probably reflecting the plant’s response to maintain its immune system under a water deficit. APX is engaged in the ROS scavenging process by converting AsA to dehydroascorbate (DHA) [72], which caused the decline of APX activity and AsA content under severe drought stress followed by rehydration (Figure 9a and Figure 10c). These results revealed the tolerance of alfalfa root in antioxidant defense system in response to water deficit and rehydration.

5. Conclusions

Alfalfa root systems tended to exhibit herringbone branching for root growth using topological and fractal analyses when soil moisture was at 60–65% water holding capacity than rehydration to 75–80% of water holding capacity. The cultivars ZD and AH had higher drought resistances than GE due to differences in root system architecture. Alfalfa roots had a stronger non-enzyme antioxidant and antioxidant defense system under less stressful soil moisture followed by rehydration. These results will help elucidate the adaptation mechanism of plants in response to water deficit and rehydration in arid and semiarid areas.

Supplementary Materials

The following are available online at https://www.mdpi.com/2073-4395/10/6/805/s1, Table S1: Description of experimental treatments (I: 75–80% water holding capacity, II: 60–65% followed by rehydration to 75–80% water holding capacity, III: 45–50% followed by rehydration 60–65% and 75–80% water holding capacity, and IV: 30–35% followed by rehydration to 45–50%, 60–65%, and 75–80% water holding capacity.).

Author Contributions

Conceptualization and methodology, S.L. and L.W.; writing, S.L.; review and editing, S.L., L.W. and Z.N.; investigation, S.L. and X.L. All authors have read and agreed to the published version of the manuscript.

Funding

This research was funded by National Natural Science Foundation of China [grant number 31772671].

Acknowledgments

We thank Lihong Miao and Yue Li for their advice and assistance in conducting these studies.

Conflicts of Interest

The authors declare no conflict of interest.

References

  1. Jose, M.; Manuel, B.; Iñaki, L.O.; Silvia, F.; Robert, K.; Pedro, A.T. Drought induces oxidative stress in pea plants. Planta 1994, 194, 346–352. [Google Scholar]
  2. Barnabas, B.; Jager, K.A. The effect of drought and heat stress on reproductive processes in cereals. Plant Cell Environ. 2010, 31, 11–38. [Google Scholar] [CrossRef] [PubMed]
  3. María, B.G.; Rosa, S.L.; Manuel, B. Effects of olive root warming on potassium transport and plant growth. J. Plant Physiol. 2017, 218, 182–188. [Google Scholar]
  4. Dannowski, M.; Block, A. Fractal geometry and root system structures of heterogeneous plant communities. Plant Soil 2005, 272, 61–76. [Google Scholar] [CrossRef]
  5. Quan, W.L.; Xun, L.; Wang, H.Q.; Chan, Z.L. Comparative physiological and transcriptional analyses of two contrasting drought tolerant alfalfa varieties. Front. Plant Sci. 2016, 6, 1–16. [Google Scholar] [CrossRef] [Green Version]
  6. Erice, G.; Louahlia, S.; Irigoyen, J.J.; Sanchez-Diaz, M.; Avice, J.C. Biomass partitioning, morphology and water status of four alfalfa genotypes submitted to progressive drought and subsequent recovery. J. Plant Physiol. 2010, 167, 114–120. [Google Scholar] [CrossRef] [PubMed]
  7. Hamidi, H.; Safarnejad, A. Effect of drought stress on alfalfa cultivars (Medicago sativa L.) in germination stage. Am. Eurasian J. Agric. Environ. Sci. 2010, 8, 705–709. [Google Scholar]
  8. Kondo, M.; Murty, M.V.R.; Aragones, D.V. Characteristics of root growth and water uptake from soil in upland rice and maize under water stress. Soil Sci. Plant Nutr. 2000, 46, 721–732. [Google Scholar] [CrossRef]
  9. Aziez, A.F.; Hanudin, E.; Harieni, S. Impact of water management on root morphology, growth and yield component of lowland rice varieties under the organic system of rice intensification. J. Degrad. Min. Lands Manag. 2018, 5, 1035–1045. [Google Scholar] [CrossRef] [Green Version]
  10. Wang, J.P.; Bughrara, S.S.; Nelson, C.J. Morpho-Physiological responses of several fescue grasses to drought stress. Hortsci. Publ. Am. Soc. Hortic. Sci. 2008, 43, 161–173. [Google Scholar] [CrossRef] [Green Version]
  11. Shahidi, R.; Yoshida, J.; Cougnon, M.; Reheul, D.; Labeke, M.C.V. Morpho-Physiological responses to dehydration stress of perennial ryegrass and tall fescue genotypes. Funct. Plant Biol. 2017, 44, 612–623. [Google Scholar] [CrossRef]
  12. Gruber, B.D.; Ricardo, F.H.G.; Swetlana, F.; Nicolaus, V.W. Plasticity of the Arabidopsis root system under nutrient deficiencies. Plant Physiol. 2013, 163, 161–179. [Google Scholar] [CrossRef] [PubMed] [Green Version]
  13. Jose, L.B.; Alfredo, C.R.; Luis, H.E. The role of nutrient availability in regulating root architecture. Curr. Opin. Plant Biol. 2003, 6, 280–287. [Google Scholar]
  14. Wang, H.; Inukai, Y.; Yamauchi, A. Root development and nutrient uptake. Crit. Rev. Plant Sci. 2006, 25, 279–301. [Google Scholar] [CrossRef]
  15. Lynch, J. Root architecture and plant productivity. Plant Physiol. 1995, 109, 7–13. [Google Scholar] [CrossRef]
  16. Martin, B.; Brodersen, C.; James Saiers, J. Whole root system water conductance responds to both axial and radial traits and network topology over natural range of trait variation. J. Theor. Biol. 2018, 456, 49–61. [Google Scholar]
  17. Fitter, A.H.; Stickland, T.R. Fractal characterization of root system architecture. Funct. Ecol. 1992, 6, 632–635. [Google Scholar] [CrossRef]
  18. Fitter, A.H.; Stickland, T.R.; Harvey, M.L.; Wilson, G.W. Architectural analysis of plant root systems 1. Architectural correlates of exploitation efficiency. New Phytol. 1991, 118, 375–382. [Google Scholar] [CrossRef]
  19. Fitter, A.H.; Stickland, T.R. Architectural analysis of plant root systems 2. Influence of nutrient supply on architecture in contrasting plant species. New Phytol. 1991, 118, 383–389. [Google Scholar] [CrossRef]
  20. Glimskär, A. Estimates of root system topology of five plant species grown at steady-state nutrition. Plant Soil 2000, 227, 249–256. [Google Scholar] [CrossRef]
  21. Walk, T.C.; Van, E.E.; Lynch, J.P. Modelling applicability of fractal analysis to efficiency of soil exploration by roots. Ann. Bot. 2004, 94, 119–128. [Google Scholar] [CrossRef] [PubMed] [Green Version]
  22. Kai, L.N.; Weiss, H.N. Fractal geometry of bean root systems: Correlations between spatial and fractal dimension. Am. J. Bot. 1997, 84, 26–33. [Google Scholar]
  23. Ketipearachchi, K.W.; Tatsumi, J. Local fractal dimensions and multifractal analysis of the root system of legumes. Plant Prod. Sci. 2000, 3, 289–295. [Google Scholar] [CrossRef]
  24. Tatsumi, J.; Yamauchi, A.; Kono, Y. Fractal analysis of plant root systems. Ann. Bot. 1989, 64, 499–503. [Google Scholar] [CrossRef]
  25. Kvgk, V.P.; Rama, R.G. Various plant’s responses and strategies to cope with the water deficit: A review. J. Pharmacogn. Phytochem. 2019, 8, 159–168. [Google Scholar]
  26. Farooq, M.; Wahid, A.; Kobayashi, N.; Fujita, D.; Basra, S.M.A. Plant drought stress: Effects, mechanisms and management. Agron. Sustain. Dev. 2009, 29, 185–212. [Google Scholar] [CrossRef] [Green Version]
  27. Mittler, R. Oxidative stress, antioxidants and stress tolerance. Trends Plant Sci. 2002, 7, 405–410. [Google Scholar] [CrossRef]
  28. Scandalios, J.G. Oxygen stress and superoxide dismutases. Plant Physiol. 1993, 101, 7–12. [Google Scholar] [CrossRef] [Green Version]
  29. Xing, X.H.; Zhou, Q.; Xing, H.; Jiang, H.D.; Wang, S.H. Early abscisic acid accumulation regulates ascorbate and glutathione metabolism in soybean leaves under progressive water stress. J. Plant Growth Regul. 2016, 35, 865–876. [Google Scholar] [CrossRef]
  30. Sousa, R.H.V.; Carvalho, F.E.L.; Ribeiro, C.W.; Passaia, G.; Cunha, J.R.; LimaMelo, Y.; Margis-Pinheiro, M.; Silveira, J.A.G. Peroxisomal APX knockdown triggers antioxidant mechanisms favourable for coping with high photorespiratory H2O2 induced by CAT deficiency in rice. Plant Cell Environ. 2015, 38, 499–513. [Google Scholar] [CrossRef]
  31. Boldaji, S.A.H.; Khavari-Nejad, R.A.; Sajedi, R.H.; Fahimi, H.; Saadatmand, S. Water availability effects on antioxidant enzyme activities, lipid peroxidation, and reducing sugar contents of alfalfa (Medicago sativa L.). Acta Physiol. Plant. 2012, 34, 1177–1186. [Google Scholar] [CrossRef]
  32. Tang, L.L.; Cai, H.; Zhai, H.; Luo, X.; Wang, Z.Y.; Cui, L.; Bai, X. Overexpression of Glycine soja WRKY20 enhances both drought and salt tolerance in transgenic alfalfa (Medicago sativa L.). Plant Cell Tissue Organ Cult. 2014, 118, 77–86. [Google Scholar] [CrossRef]
  33. Kang, Y.; Han, Y.H.; Torres-Jerez, I.; Wang, M.Y.; Tang, Y.H.; Monteros, M.; Udvardi, M. System responses to long-term drought and re-watering of two contrasting alfalfa varieties. Plant J. 2011, 68, 871–889. [Google Scholar] [CrossRef] [PubMed]
  34. Wu, Q.; Pagès, L.C.; Wu, J. Relationships between root diameter, root length and root branching along lateral roots in adult, field-grown maize. Ann. Bot. 2016, 117, 379–390. [Google Scholar] [CrossRef] [Green Version]
  35. Tanaka, M.; Kayama, A.; Kato, R.; Ito, Y. Estimation of the fractal dimension of freature surface patterns by box counting method. Fractals Complex Geom. Patterns Scaling Nat. Soc. 2003, 7, 335–340. [Google Scholar]
  36. Berntson, G.M. Topological scaling and plant root system architecture: Developmental and functional hierarchies. New Phytol. 1997, 135, 621–634. [Google Scholar] [CrossRef]
  37. Willekens, H.; Chamnongpol, S.; Davey, M.; Schraudner, M.; Langebartels, C.; Montagu, M.V.; Inzé, D.; Camp, W.V. Catalase is a sink for H2O2 and is indispensable for stress defence in C3 plants. EMBO J. 1997, 16, 4806–4816. [Google Scholar] [CrossRef] [Green Version]
  38. Elstner, E.F.; Heupel, A. Formation of hydrogen peroxide by isolated cell walls from horseradish (Armoracia lapathifolia Gilib.). Planta 1976, 130, 175–180. [Google Scholar] [CrossRef]
  39. Heath, R.L.; Packer, L. Photoperoxidation in isolated chloroplasts: I. Kinetics and stoichiometry of fatty acid peroxidation. Arch. Biochem. Biophys. 1968, 125, 189–198. [Google Scholar] [CrossRef]
  40. Kampfenkel, K.; Vanmontagu, M.; Inze, D. Extraction and determination of ascorbate and dehydroascorbate from plant tissue. Anal. Biochem. 1995, 225, 165–167. [Google Scholar] [CrossRef]
  41. Griffith, O.W. Determination of glutathione and glutathione disulfide using glutathione reductase and 2-vinylpyridine. Anal. Biochem. 1980, 106, 207–212. [Google Scholar] [CrossRef]
  42. Neto, A.D.; Prisco, J.T.; Enéas-Filho, J.; Medeiros, J.V.R.; Gomes-Filho, E. Hydrogen peroxide pretreatment induces salt-stress acclimation in maize plants. J. Plant Physiol. 2005, 162, 1114–1122. [Google Scholar] [CrossRef]
  43. Giannopolitis, C.N.; Ries, S.K. Superoxide dismutases: I. Occurrence in higher plants. Plant Physiol. 1977, 59, 309–314. [Google Scholar] [CrossRef] [PubMed]
  44. Nakano, Y.; Asada, K. Hydrogen peroxide is scavenged by ascorbate-specific peroxidase in Spinach chloroplasts. Plant Cell Physiol. 1981, 22, 867–880. [Google Scholar]
  45. Elia, A.C.; Galarini, R.; Taticchi, M.I.; Dörr, A.J.M.; Mantilacci, L. Antioxidant responses and bioaccumulation in Ictalurus melas under mercury exposure. Ecotoxicol. Environ. Saf. 2003, 55, 162–167. [Google Scholar] [CrossRef]
  46. Foyer, C.H.; Halliwell, B. The presence of glutathione and glutathione reductase in chloroplasts: A proposed role in ascorbic acid metabolism. Planta 1976, 133, 21–25. [Google Scholar] [CrossRef] [PubMed]
  47. Chen, Y.N.; Pang, Z.H.; Chen, Y.P.; Li, W.H.; Xu, C.C.; Hao, X.M.; Huang, X.; Huang, T.M.; Ye, Z.X. Response of riparian vegetation to water-table changes in the lower reaches of Tarim River, Xinjiang Uygur, China. Hydrogeol. J. 2008, 16, 1371–1379. [Google Scholar] [CrossRef]
  48. Shan, L.S.; Zhang, X.M.; Wang, Y.K.; Hui, W.; Yan, H.N.; Jiang, W.; Hao, X. Influence of moisture on the growth and biomass allocation in Haloxylon ammodendron and Tamarix ramosissima seedlings in the shelterbelt along the Tarim Desert Highway, Xinjiang, China. Chin. Sci. Bull. 2008, 53, 93–101. [Google Scholar] [CrossRef] [Green Version]
  49. Jangpromma, N.; Thammasirirak, S.; Jaisil, P.; Songsri, P. Effects of drought and recovery from drought stress on above ground and root growth, and water use efficiency in sugarcane (Saccharum officinarum L.). Aust. J. Crop Sci. 2012, 6, 1298–1304. [Google Scholar]
  50. Hodge, A.; Berta, G.; Doussan, C.; Merchan, F.; Crespi, M. Plant root growth, architecture and function. Plant Soil 2009, 321, 153–187. [Google Scholar] [CrossRef]
  51. Berntson, G.M. The characterization of topology: A comparison of four topological indices for rooted binary trees. J. Theor. Biol. 1995, 177, 271–281. [Google Scholar] [CrossRef]
  52. Fitter, A.H. Functional Significance of Root Morphology and Root System Architecture; British Ecological Society Special Publication, Blackwell Scientific Publisher: Oxford, UK, 1985; pp. 87–106. [Google Scholar]
  53. Oppelt, A.L.; Kurth, W.; Godbold, D.L. Topology, scaling relations and Leonardo’s rule in root systems from African tree species. Tree Physiol. 2001, 21, 117–128. [Google Scholar] [CrossRef]
  54. Quijano-Guerta, C.; Kirk, G.J.D.; Portugal, A.M.; Bartolome, V.I.; Mclaren, G.C. Tolerance of rice germplasm to zinc deficiency. Field Crop. Res. 2002, 76, 123–130. [Google Scholar] [CrossRef]
  55. Fitter, A.H. An architectural approach to the comparative ecology of plant root systems. New Phytol. 1987, 106, 61–77. [Google Scholar] [CrossRef]
  56. Yambao, E.B.; Ingram, K.T.; Real, J.G. Root xylem influence on the water relations and drought resistance of rice. J. Exp. Bot. 1992, 43, 925–932. [Google Scholar] [CrossRef]
  57. Pierret, A.; Doussan, C.; Capowiez, Y.; Bastardie, F.; Pagès, L. Root functional architecture: A framework for modeling the interplay between roots and soil. Vadose Zone J. 2007, 6, 269–281. [Google Scholar] [CrossRef]
  58. Dorlodot, S.D.; Forster, B.; Pagès, L.; Price, A.; Tuberosa, R.; Draye, X. Root system architecture: Opportunities and constraints for genetic improvement of crops. Trends Plant Sci. 2007, 12, 474–481. [Google Scholar] [CrossRef]
  59. Jongrungklang, N.; Toomsan, B.; Vorasoot, N.; Jogloy, S.; Boote, K.J.; Hoogenboom, G.; Patanothai, A. Rooting traits of peanut genotypes with different yield responses to pre-flowering drought stress. Field Crop. Res. 2011, 120, 265–270. [Google Scholar] [CrossRef]
  60. Wang, H.; Siopongco, J.; Wade, L.J.; Yamauchi, A. Fractal analysis on root systems of rice plants in response to drought stress. Environ. Exp. Bot. 2009, 65, 338–344. [Google Scholar] [CrossRef]
  61. He, W.M.; Zhang, X.S. Responses of an evergreen shrub Sabina vulgaris to soil water and nutrient shortages in the semi-arid Mu Us Sandland in China. J. Arid Environ. 2003, 53, 307–316. [Google Scholar] [CrossRef]
  62. Fernández, R.J.; Wang, M.B.; Reynolds, J.F. Do morphological changes mediate plant responses to water stress? A steady-state experiment with two C4 grasses. New Phytol. 2002, 155, 79–88. [Google Scholar] [CrossRef] [Green Version]
  63. Decuseara, C.; Nedelea, G. The effect of genotype and water stress on root growth in some alfalfa varieties. J. Hortic. For. Biotechnol. 2012, 16, 149–152. [Google Scholar]
  64. Li, W.R.; Zhang, S.Q.; Lun, S.; Eneji, A.E. Changes in root characteristics, gas exchange and water use efficiency following water stress and rehydration of alfalfa and sorghum. Aust. J. Crop Sci. 2011, 5, 1521–1532. [Google Scholar]
  65. Nahar, K.; Hasanuzzaman, M.; Alam, M.M.; Rahman, A.; Mahmud, J.A.; Suzuki, T.; Fujita, M.N. Insights into spermine-induced combined high temperature and drought tolerance in mung bean: Osmoregulation and roles of antioxidant and glyoxalase system. Protoplasma 2017, 254, 445–460. [Google Scholar] [CrossRef]
  66. Puyang, X.H.; An, M.Y.; Han, L.B.; Zhang, X.Z. Protective effect of spermidine on salt stress induced oxidative damage in two Kentucky bluegrass (Poa pratensis L.) cultivars. Ecotoxicol. Environ. Saf. 2015, 117, 96–106. [Google Scholar] [CrossRef]
  67. Apel, K.; Hirt, H. Reactive oxygen species: Metabolism, oxidative stress, and signal transduction. Annu. Rev. Plant Biol. 2004, 55, 373–399. [Google Scholar] [CrossRef] [Green Version]
  68. Elstner, F.E. Oxygen activation and oxygen toxicity. Annu. Rev. Plant Physiol. 1982, 33, 73–96. [Google Scholar] [CrossRef]
  69. Katuwal, K.B.; Schwartz, B.; Jespersen, D. Desiccation avoidance and drought tolerance strategies in Bermudagrasses. Environ. Exp. Bot. 2020, 171. [Google Scholar] [CrossRef]
  70. Noctor, G.; Foyer, C.H. Ascorbate and glutathione: Keeping active oxygen under control. Plant Biol. 1998, 49, 249–279. [Google Scholar] [CrossRef] [PubMed]
  71. Kasperczyk, A.; Dobrakowski, M.; Czuba, Z.P.; Horak, S.A.; Kasperczyk, S.A. Environmental exposure to lead induces oxidative stress and modulates the function of the antioxidant defense system and the immune system in the semen of males with normal semen profile. Toxicol. Appl. Pharmacol. 2015, 284, 339–344. [Google Scholar] [CrossRef] [PubMed]
  72. Gill, S.S.; Tuteja, N. Reactive oxygen species and antioxidant machinery in abiotic stress tolerance in crop plants. Plant Physiol. Biochem. 2010, 48, 909–930. [Google Scholar] [CrossRef] [PubMed]
Figure 1. Schematic representation of Fitter’s link-based parameters used to describe root topology. A link is defined as a piece of the root between two branching points (interior link) or between a branch and a meristem (exterior link). The magnitude (M) of the overall root system represents the number of exterior links, which equals the number of meristems in a root. The magnitude of an individual link within the root system represents the total number of root segments connected to the shoot through that specific link. The altitude of the overall root system (A) is the number of links in the longest path from an exterior link to the most basal link of the root system. The topological index of a root system may be defined as log altitude/log magnitude.
Agronomy 10 00805 g001
Figure 2. Interaction on root biomass between cultivars (Aohan (AH), Golden empress (GE) and Zhaodong (ZD)) and soil moisture (I: 75–80% water holding capacity, II: 60–65% followed by rehydration to 75–80% water holding capacity, III: 45–50% followed by rehydration 60–65% and 75–80% water holding capacity, and IV: 30–35% followed by rehydration to 45–50%, 60–65%, and 75–80% water holding capacity.). The vertical bars indicate the least significant difference (L.S.D.); ns-no significant.
Agronomy 10 00805 g002
Figure 3. Interaction on topological index between cultivars (AH, GE and ZD) and soil moisture (See Figure 2 for soil moisture abbreviations). ** p < 0.01.
Agronomy 10 00805 g003
Figure 4. Interaction on link average length between cultivars (AH, GE and ZD) and soil moisture (See Figure 2 for soil moisture abbreviations). * p < 0.05.
Agronomy 10 00805 g004
Figure 5. Interaction on (a) fractal dimension and (b) fractal abundances between cultivars (AH, GE and ZD) and soil moisture (See Figure 2 for soil moisture abbreviations). ** p < 0.01.
Agronomy 10 00805 g005
Figure 6. Interaction on branching ratio between cultivars (AH, GE and ZD) and soil moisture (See Figure 2 for soil moisture abbreviations). * p < 0.05.
Agronomy 10 00805 g006
Figure 7. Interaction on (a) average root diameter, (b) root surface area and (c) root volume between cultivars (AH, GE and ZD) and soil moisture (See Figure 2 for soil moisture abbreviations). ** p < 0.01.
Agronomy 10 00805 g007
Figure 8. Content of (a) O2, (b) H2O2 and (c) malondialdehyde (MDA) in root of alfalfa under various soil moisture treatments (See Figure 2 for soil moisture abbreviations). * p < 0.05; ** p < 0.01.
Agronomy 10 00805 g008
Figure 9. The content of (a) Ascorbic acid (ASA) and (b) reduced glutathione (GSH) in alfalfa root under various soil moisture treatments (See Figure 2 for soil moisture abbreviations). ** p < 0.01.
Agronomy 10 00805 g009
Figure 10. Antioxidant enzyme activity of (a) SOD, (b) CAT, (c) APX, (d) GR, and (e) GPX in alfalfa root under various soil moisture treatments (See Figure 2 for soil moisture abbreviations). * p < 0.05; ** p < 0.01; ns-no significant.
Agronomy 10 00805 g010
Table 1. Mean root biomass (RB; g) under various soil moisture (I: 75–80% water holding capacity, II: 60–65% followed by rehydration to 75–80% water holding capacity, III: 45–50% followed by rehydration 60–65% and 75–80% water holding capacity, and IV: 30–35% followed by rehydration to 45–50%, 60–65%, and 75–80% water holding capacity.) and cultivar (AH, GE and ZD) treatments. ** p < 0.01; ns-no significant.
Soil MoistureRBCultivarsRB
I0.61AH0.57
II0.51GE0.65
III0.60ZD0.64
IV0.77l.s.d.0.170 ns
l.s.d.0.144 **
Table 2. Mean topological index (TI) under various soil moisture (See Table 1 for soil moisture abbreviations) and cultivar (AH, GE and ZD) treatments. * p < 0.05; ** p < 0.01.
Soil MoistureTICultivarsTI
I0.61AH0.61
II0.63GE0.62
III0.62ZD0.61
IV0.60l.s.d.0.008 *
l.s.d.0.007 **
Table 3. Mean average link length (ALL; mm) under various soil moisture (See Table 1 for soil moisture abbreviations) and cultivar (AH, GE and ZD) treatments. * p < 0.05; ns-no significant.
Soil MoistureALLCultivarsALL
I1.14AH1.17
II1.17GE1.09
III1.14ZD1.13
IV1.06l.s.d.0.067 ns
l.s.d.0.072 *
Table 4. Mean fractal dimensions (FD) and fractal abundances (FA) under various soil moisture (See Table 1 for soil moisture abbreviations) and cultivar (AH, GE and ZD) treatments. ** p < 0.01; ns-no significant.
Soil MoistureFDFACultivarsFDFA
I1.433.82AH1.433.78
II1.423.71GE1.463.78
III1.443.81ZD1.433.82
IV1.473.84l.s.d.0.024 ns0.040 ns
l.s.d.0.020 **0.051 **
Table 5. Mean branching ratio (BR) under various soil moisture (See Table 1 for soil moisture abbreviations) and cultivar (AH, GE and ZD) treatments. * p < 0.05; ns-no significant.
Soil MoistureBRCultivarsBR
I0.38AH0.35
II0.35GE0.36
III0.34ZD0.38
IV0.39l.s.d.0.036 ns
l.s.d.0.034 *
Table 6. Interactions on tap root length (TRL; cm), lateral root length (LRL; cm) and lateral root number (LRN) between cultivars (AH, GE and ZD) and soil moisture treatments (See Table 1 for soil moisture abbreviations). * p < 0.05; ** p < 0.01; ns-no significant.
CultivarsSoil Moisture
IVIIIIII
Tap root length
AH30.629.725.426.2
GE31.730.629.326.2
ZD29.332.631.932.7
l.s.d.5.66 ns
Total lateral root length
AH139.0108.7115.0151.5
GE155.3131.187.5102.7
ZD127.2116.2113.2157.8
l.s.d.50.10 *
Lateral root number
AH359.0288.8183.5242.0
GE331.8186.5140.5117.2
ZD240.0144.0148.0207.2
l.s.d.56.33 **
Table 7. Tap root length (TRL; cm), lateral root length (LRL; cm) and lateral root number (LRN) under various soil moisture (See Table 1 for soil moisture abbreviations) and cultivar (AH, GE and ZD) treatments. ** p < 0.01; ns-no significant.
Soil MoistureTRLLRLLRNCulTRLLRLLRN
I28.4137.3188.8AH28.0128.5268.3
II28.9105.2157.3GE29.4119.2194.0
III31.0118.7206.4ZD31.6128.6184.8
IV30.5140.5310.2l.s.d.3.67 ns43.15 ns24.97 **
l.s.d.3.19 ns21.80 **35.18 **
Table 8. Average root diameter (RD; cm), root surface area (SA; cm2) and root volume (RV; cm3) under various soil moisture (See Table 1 for soil moisture abbreviations) and cultivar (AH, GE and ZD) treatments. ** p < 0.01.
Soil MoistureRDSARVCultivarsRDSARV
I0.3964.630.68AH0.3658.310.64
II0.4148.510.50GE0.4158.430.67
III0.3660.230.69ZD0.3765.510.69
IV0.3569.630.79l.s.d.0.016 **1.472 **0.024 **
l.s.d.0.012 **2.012 **0.035 **

