Abstract
There is little information on the fatty acid dynamics of forages under grazing. The objectives of this study were to determine the fatty acid compositions of fall-planted rye (Secale cereale L.) and wheat (Triticum aestivum L.) forages while rotationally grazed by steers (Bos Taurus L.) for seven weeks in the spring and summer in Minnesota, USA. With respect to the total fatty acids in forages, the concentration of α-linolenic acid (C18:3n-3) decreased linearly while the concentration of linoleic acid (C18:2n-6) increased quadratically over the grazing interval. Simultaneously, the omega-6 to omega-3 fatty acid ratio increased quadratically in forages. The fatty acid composition had a greater magnitude of variation in wheat compared to rye over the course of the grazing interval. The omega-6 to omega-3 fatty acid ratio was lower in wheat compared to rye for at least the first five weeks, but was ≤ 0.21 for both forages during the entire grazing interval. Results from this study indicated that forage fatty acid compositions varied based on number of days of the grazing interval and forage species, informing producers of potential grazing schedule adjustments to manage the dietary fatty acid intake of grazing cattle.
1. Introduction
The demand for organic animal products is increasing [1,2], which is partially driven by consumer interest in the health benefits of meat and milk from animals that consumed primarily forages [3]. Saturated fatty acids dominate the fatty acid compositions of beef and milk. Yet, beef and milk have the potential to be sources of unsaturated fatty acids that are important for human health, such as omega-3 (n-3) fatty acids and conjugated linoleic acid (CLA) [4,5,6,7]. Previous research established that these particular fatty acids (i.e., n-3 and CLA) found in beef and milk have a positive relationship with the proportion of fresh forages in cattle diets, which also improves (i.e., lowers) the omega-6:omega-3 (n-6:n-3) fatty acid ratio in animal products [8,9,10]. In the United States of America (USA), certified organic cattle must consume ≥ 30% of their dietary intake from forages by grazing during the grazing season, in order to fulfill the grazing regulations set forth by the United States Department of Agriculture National Organic Program (§205.237) [11]. Thus, fresh forages are innately a major part of organic cattle diets, which can lead to improved fatty acid profiles in the resultant beef and milk products [12,13]. Omega-3 fatty acids found in beef and milk include α-linolenic acid (C18:3n-3), eicosapentaenoic acid (EPA; C20:5n-3), docosapentaenoic acid (DPA; C22:5n-3) and docosahexaenoic acid (DHA; C22:6n-3). Alpha-linolenic acid, the predominant fatty acid in forage, is a precursor to the longer chain n-3 fatty acids found in beef and milk [14,15]. Alternatively, the CLA in beef and milk is attained by incomplete ruminal biohydrogenation of linoleic acid (C18:2n-6), an n-6 fatty acid [16]. However, high levels of dietary α-linolenic acid may also play a role in facilitating a population of microflora that increases the accumulation of CLA in tissues [17]. The desirable fatty acids in beef and dairy products from grazing cattle, and the resulting potential benefits to human health, have prompted a particular research interest in the fatty acid composition of forages [12,18,19].
A recent review by Glasser et al. [20] reported considerable fatty acid variations between an array of forage species, including forbs, grasses and legumes. Other studies reported changes in fatty acids over several cutting dates in forages [21,22,23]. These previous studies indicate that the fatty acid composition of forages depends on plant species and maturity. Yet, limited research exists on the fatty acid composition of forages under realistic, large-scale grazing conditions. In one study, Meľuchová et al. [24] investigated the fatty acid composition of perennial forb, grass and legume forages from a pasture that was rotationally grazed by ewes (Ovis aries L.). This study reported variations in the concentrations of α-linolenic, palmitic (C16:0) and linoleic acids in the total fatty acid content of forages over the course of the grazing season. Likewise, authors also reported seasonal variations in the n-6:n-3 fatty acid ratio of the forages (ibid).
Alternative cool-season annual forages may be used to extend the grazing season into the early spring in cooler climates. Crop–livestock integration (i.e., mixing crop and livestock production) is a dynamic diversification strategy, that can improve environmental resilience and has been suggested as a promising antidote for the negative effects of farming intensification and specialization [25]. Although farmers may ideally favor crop–livestock methods, perceived social obstacles limit the adoption of these practices [26]. In a review of crop–livestock integration, Lemaire et al. [27] suggested that the development of crop–livestock methods must account for different agro-ecological zones. In the upper Midwest region of the USA, integrating a cool-season annual ley—a temporary pastureland that is integrated into a crop rotation [28]—for spring grazing represents a feasible method for achieving crop–livestock integration. Considering the strong consumer interest in the beneficial fatty acids of beef and milk from grazed cattle, research into fatty acids in forages may be helpful in managing the resulting fatty acids in these products. Therefore, the current study contributes to filling acknowledged research gaps regarding crop–livestock integration methods and fatty acid compositions of alternative cool-season annual forages for cattle grazing.
For this study, fall-planted rye (Secale cereale L.) and wheat (Triticum aestivum L.) forages were selected based on their established popularity as winter cover crops in the upper Midwest of the USA, due to their demonstrated adaptation to low temperatures and their potential as forages for leys. We hypothesized that the fatty acid compositions of spring-grazed forages would depend on species and number of days of the grazing interval. The objectives of this study were to determine and predict the fatty acid compositions of rye and wheat forages under cattle grazing conditions during the entire grazing interval. The grazing land and grazing animal terminology used in this article (e.g., “grazing interval”, “grazing season”, etc.) is in accordance with terminology defined by Allen et al. [28] on behalf of the International Forage and Grazing Lands Terminology Committee.
2. Materials and Methods
2.1. Experimental Design
Research was conducted at the University of Minnesota West Central Research and Outreach Center in Morris, MN, USA in 2016. The organic dairy herd and pastureland had been certified since June 2010 by the Midwest Organic Services Association—a certification agency accredited by the United States Department of Agriculture National Organic Program. For ≥ 20 years prior to the study, the specific location used for the experiment was managed as permanent pastureland for dairy cattle grazing during the grazing season months of approximately May through October. The pastureland included perennial forbs, grasses and legumes, such as alfalfa (Medicago sativa L.), chicory (Cichorium intybus L.), meadow brome grass (Bromus biebersteinii L.), meadow fescue (Festuca pratensis L.), orchard grass (Dactylis glomerate L.), perennial ryegrass (Lolium perenne L.), red clover (Trifolium pretense L.) and white clover (Trifolium repens L.). Soil cores taken at a depth of 0 to 15 cm prior to the current study had the following characteristics: 7.1 pH (methods described by Watson and Brown [29]); 8.4 g 100g−1 organic matter (methods described by Combs and Nathan [30]); 24 cmolc kg−1 cation exchange capacity (methods described by Warncke and Brown [31]); 4.8 g 100g−1 total carbon, 0.44 g 100g−1 total nitrogen, and 0.07 g 100g−1 total sulfur as determined by combustion (Vario MAX Cube instrument in CNS mode; Elementar, Ronkonkoma, NY, USA); 3540 mg kg−1 plant-available calcium, 591 mg kg−1 plant-available magnesium, and 340 mg kg−1 plant-available potassium as determined using Mehlich-3 extractants [31]; 19 mg kg−1 plant-available phosphorus as determined using Bray-1 extractants [32]; 3.9 mg kg−1 ammonium (methods described by Nelson [33]), and 1.7 mg kg−1 plant-available nitrate (methods described by Gelderman and Beegle [34]), when averaged across pastures. Prior to and during the study, the pastureland was not irrigated or fertilized.
This field-scale study was part of an integrated crop–livestock system experiment, described by Phillips et al. [35] and Nazareth et al. [36], where pastures were rotated to cereal grain crops in subsequent years. For the current study, the treatments of rye (S. cereale) and wheat (T. aestivum) were randomly assigned to two adjacent 4-hectare (ha) pastures (45°34’52.8” N, 95°53’44.7” W) that were seeded in monoculture in September 2015. To reduce pre-study variability, the specific location was chosen to minimize variability between pastures (as described by Murison and Scott [37]), such that the slope, soil characteristics and pre-study management of the land were similar. Each pasture was divided into seven 0.57-ha paddocks in order to implement rotational stocking methods. Then, each paddock was divided into three 0.19-ha pens using temporary electric fencing in order to house separate groups of steers. In total, 6 groups of 4 or 5 steers (29 total steers) were randomly allocated to either treatment, which were balanced for animal age and breed composition (Holstein and two crossbreeds), for a total of 3 steer groups assigned to each of the treatments. One steer died prior to the study grazing interval, so one pen had 4 steers—which was randomly assigned to the wheat pasture—while all the others had 5 steers over the course of the study.
As shown in Figure 1, the 607 × 66-m pastures were delineated into seven 87 × 66-m paddocks in each of the rye and wheat pastures. Within each pasture, the experimental units of 3 steer-pens were established and stocked with the assigned steer group. Over the course of the study, experimental units were grazed using rotational stocking methods by utilizing recurring periods of grazing and rest among the seven paddocks. This design followed procedures outlined by Fisher [38] for grazing trials, which include animal groups on pasture units. The rotation cycles were the same for all steer-pens, such that steers in rye and wheat pastures were always adjacent to each other. This method allowed steers to maintain social proximity, to reduce animal stress and consequential disruption of grazing [39]. Only one paddock within each pasture was occupied at any given time and each of the pens in the paddock housed only one steer group. The steer-pens remained in the same configuration in paddocks for each grazing period.
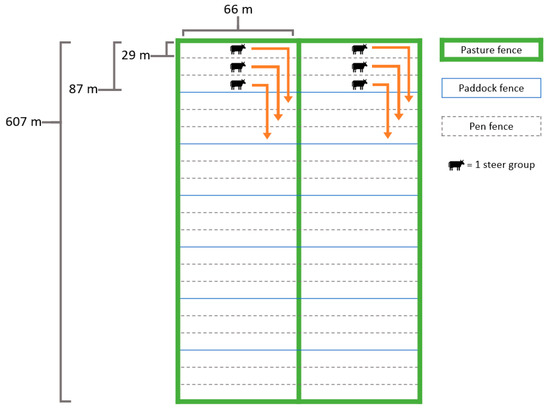
Figure 1.
An illustration of the rotational grazing methods utilized during the grazing interval. The arrows depict the movement of steer groups during each rotation to a new paddock.
For the duration of the grazing interval, cattle were supplemented with ad libitum organic-certified minerals formulated for steers (Vita Plus®, Madison, WI, USA). Phillips et al. [35] reports the beef lipid fatty acids of steers that were rotationally stocked on the pastures of the current study. The University of Minnesota Institutional Animal Care and Use Committee approved all aspects of animal care management specific to this study, including handling, housing and feeding practices (protocol number: 1411-32060A).
Grazing of steers (arithmetic mean ± standard deviation [SD]; 369 ± 20 days [d] of age; 422 ± 44 kg body weight) initiated when forages reached heights of 15 cm above the soil on April 25, 2016. At this time, both forages were in the early stem elongation stage of growth. Rotational stocking was utilized throughout the grazing interval, in which each recurring grazing period concluded after approximately 50% of visual forage removal. Thus, the grazing period durations were variable (lasting either 3 or 4 d). When each grazing period ended, steer groups rotated to a new paddock corresponding to their pen. The grazing interval concluded after 47 d on June 10, 2016, when forages reached the flowering stage of growth. At this time, the steers (arithmetic mean ± SD; 438 ± 44 kg body weight) were removed from the pastures. There was a maximum of 3 grazing period cycles with an average rest period (± SD) of 16 ± 6 d. The average stocking density (± SD) of pens was 25 ± 2 steers ha−1 at 10,700 ± 1,350 kg of body weight ha−1 for each grazing period. The average daily body weight gains (± SD) of steers stocked on the rye pasture was 0.36 ± 0.32 kg d−1, and was 0.34 ± 0.31 kg d−1 for steers stocked on the wheat pasture.
Repeated measures were performed on every experimental unit, when pens were entered for grazing, by hand-harvesting a random sample of live forage within a 0.23-m2 quadrat area to a height of 5 cm above the soil [40]. This sample represented the forage available for cattle consumption. Fresh samples were immediately oven dried for 48 h at 60 °C in a forced-air oven, then ground through a 2-mm screen (Model 4, Wiley Mill®, Thomas Scientific, Minneapolis, MN, USA) and stored at approximately 21 °C until forage analyses for fatty acid composition by a commercial laboratory (Eurofins BioDiagnostics, River Falls, WI, USA). A total of 96 samples were collected and analyzed (48 per forage species). Fatty acids were extracted from forage samples and methylated. Sunflower oil and sunflower seed internal control samples were used to validate the consistency in variation resulting from the extraction and methylation procedures. Separation of fatty acid methyl esters was achieved with a Hewlett-Packard (Wilmington, DE, USA) Agilent model 6890 gas chromatograph instrument with electronic pneumatics control and a flame ionization detector. Samples were presented onto a fused silica chemically bonded capillary column that was 100 m long, 0.25 mm for inner diameter and 0.25 µm for film thickness (J&W DB-23, Agilent, Santa Clara, CA, USA). Individual fatty acids were identified according to their retention times using reference standards (GLC-21A and GLC-17A, Nu-Chek Prep, Elysian, MN, USA). Results for individual fatty acids are reported as g 100g−1 of total fatty acids in the forage sample.
2.2. Statistical Analysis
The lmer function in the lme4 package [41] of RStudio® software [42] (version 3.6.3) was used to determine restricted maximum likelihood (REML) estimates of the parameters in linear mixed-effects models. Fixed factors were forage species (2 levels), the continuous variable of day (range: 0–46), and the interaction term of forage species and day. Random factors were the experimental unit of steer-pen (6 levels), paddock (7 levels), the paddock and forage species interaction (14 levels), and pen within the paddock and forage species interaction (42 levels). The quadratic term of day and the interaction with forage species was considered for each model. Cubic models were not considered for this study. Using the maximum likelihood (ML) estimates, the hierarchical models were compared for fit; the quadratic model was accepted when the computed p-value of the X2 test statistic for the likelihood ratio test was < 0.05. Diagnostics plots of residuals were assessed for normality and constant variance. No transformations of variables were applied. The presence of spatial autocorrelation was assessed for each outcome by using tools in the DHARMa package [43]. Simulated residuals were aggregated for each of the 42 pens grazed throughout the study, and the Moran’s I test [44] was performed using x, y coordinates that were assigned to each of the 42 pen locations based on their central point. For all tests, the test statistics had p > 0.05, indicating no apparent spatial autocorrelation. The lowest-concentration fatty acids [eicosenoic (C20:1) and erucic (C22:1) acids] were summed and the arithmetic mean was calculated and reported. The Kenward–Roger procedure was used to estimate the denominator degrees of freedom, and statistical significance of fixed effects was declared when p < 0.05. Predicted outcomes for rye and wheat forages for each day of the grazing interval (e.g., days 0, 1, 2, …, 46) were calculated using model estimates excluding the effects of random variables. Then, the bootMer function of the lme4 package was used to perform 1000 model-based parametric bootstrap resamples and construct 95% confidence intervals (CIs) of the predicted fatty acid outcomes. The marginal R2 value (R2(m)) for each model was calculated to indicate the variance explained by the fixed effects. The R2(m) value was calculated by using the r.squaredGLMM function of the MuMIn package [45] based on equations described by Nakagawa and Schielzeth [46]. Results are reported as predicted means and regression estimates (coefficients and R2(m)). Data is available as a supplementary file (Data S1). Figures of bootstrap estimates were created using graphic tools from the ggplot2 package [47].
3. Results
3.1. Weather
The University of Minnesota West Central Research and Outreach Center weather station recorded daily weather. Table 1 reports monthly temperature means and precipitation (i.e., rainfall and snowfall) summations for the 130-year, long-term mean ranging from 1886 to 2016, and for the duration of the current study ranging from September 2015 to June 2016. Seeds were planted in the month of September, grazing initiated in the month of April, and grazing terminated in the month of June. The total mean monthly temperature for the current study (2 °C) was similar to the long-term mean (3 °C). The mean temperature during the grazing interval—April to June—of the current study (10 °C) was also similar to the long-term mean (13 °C). The total rainfall and snowfall sums for the current study were approximately 114 and 343 mm less than the sum reported for the long-term mean, respectively. The total rainfall and snowfall sums during the grazing interval of the study were approximately 90 and 51 mm less than the long-term mean. The difference in precipitation between the current study and the long-term mean was especially apparent during the month of June, in which the precipitation was approximately 53% less than reported for the long-term mean.

Table 1.
Monthly weather during the study duration compared to the long-term mean.
3.2. Fatty Acids
Bootstrap means and 95% CIs of fatty acid compositions for rye and wheat forages on the first (day0) and last (day46) days of the grazing interval are presented in Table 2, and the regression coefficients used to predict fatty acid compositions of forages based on day of the grazing interval are presented in Table 3. The most abundant fatty acid in forages was α-linolenic acid (C18:3n-3), with an average concentration of 64.8 g 100g−1 of total fatty acids across the grazing interval and forage species. Palmitic acid (C16:0) was the second most prominent fatty acid, which accounted for an average of 17.8 g 100g−1 of the total fatty acids in forages over the course of the grazing interval. Linoleic acid (C18:2n-6) was the third most abundant fatty acid and had an average concentration of 9.2 g 100g−1 of total fatty acids in forages throughout the grazing interval. The remaining fatty acids made up approximately 8.2 g 100g−1 of the total fatty acid content in the forages throughout the grazing interval, and are therefore not discussed in great detail in this article, yet these results are available as supplementary files (Figures S1–S6). In general, myristic (C14:0), palmitic, oleic (C18:1), linoleic and lignoceric (C24:0) acid concentrations increased, and α-linolenic and arachidic (C20:0) acid concentrations decreased in the fatty acids of forages during the grazing interval. Day of the grazing interval was not a major source of variation for analyses of stearic (C18:0) and behenic (C22:0) acid concentrations of fatty acids in forages.
Table 2.
Fixed effect bootstrap means and 95% confidence intervals (CIs; 1000 resamples) for fatty acid compositions of rye (Secale cereale L.) and wheat (Triticum aestivum L.) forages during the spring cattle grazing interval.
Table 3.
Fixed effects regression coefficients and 95% confidence intervals (CIs) for predicting fatty acid compositions of rye (Secale cereale L.) and wheat (Triticum aestivum L.) forages during spring grazing from 25 April to 10 June 2016.
Scatter plots of data points with predicted regression lines and bootstrap-based 95% CIs for myristic, stearic, oleic, arachidic, behenic and lignoceric acid compositions in rye and wheat forages during the grazing interval are presented as supplementary files in Figures S1–S6, respectively.
3.2.1. Alpha-Linolenic Acid (C18:3n-3)
The concentration of α-linolenic acid in the total fatty acids of forages decreased by approximately 7% in rye and 21% in wheat over the course of the grazing interval (Table 2). From regression coefficient results in Table 3, the effects of forage species and day explained less than half of the variation in the model (R2(m) = 0.41). However, all fixed effects were major sources of model variation. Concentrations decreased linearly in the fatty acids of both forages over the course of the study, but the concentration in the fatty acids of wheat decreased at a rate that was 0.24 (95% CI [0.11, 0.37]) g 100g−1 of total fatty acids greater per day than in rye.
Figure 2 illustrates the dynamic changes in the α-linolenic acid concentration of total fatty acids in rye and wheat forages during the spring grazing interval. Concentrations were greater in the fatty acids of wheat compared to rye on days 0 through 26 of the study [mean difference for wheat–rye (95% CI) at day0, 8.6 (4.7, 12.2) g 100g−1 of total fatty acids; at day26, 2.2 (0.3, 4.1) g 100g−1 of total fatty acids]. However, concentrations were similar in the fatty acids of forages for days 27 to 46 of the grazing interval [mean difference for wheat–rye (95% CI) at day27, 2.0 (−0.0, 3.9) g 100g−1 of total fatty acids; at day46, −2.6 (−6.2, 0.9) g 100g−1 of total fatty acids].
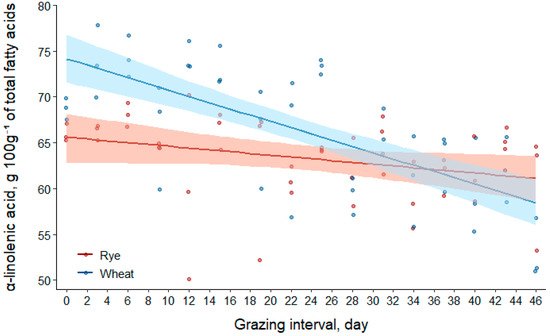
Figure 2.
Scatter plot of data with regression (solid lines) and bootstrap 95% confidence intervals (transparent bands) based on 1000 resamples for α-linolenic acid (C18:3n-3) concentrations of fatty acids in rye and wheat forages during the grazing interval (day0 = 25 April; day46 = 10 June 2016).
3.2.2. Palmitic Acid (C16:0)
Palmitic acid concentrations of the total fatty acids in forages increased by approximately 6% in rye and 49% in wheat between the first and last days of grazing (Table 2). Results in Table 3 suggest that fixed effects only explained approximately a third of the model variation (R2(m) = 0.27). However, all fixed effects were sources of variation in the model. For rye, the slope for the linear effect of day to predict palmitic acid concentration was not different than 0, indicating that the change in concentration for rye was trivial during the study duration. The linear slope for the effect of day was 0.13 [95% CI (0.06, 0.20)] g 100g−1 of total fatty acids greater per day for wheat compared to rye. Furthermore, the concentration in the total fatty acids of wheat increased at a rate of 0.15 [95% CI (0.10, 0.20)] g 100g−1 of total fatty acids per day.
Temporal changes in palmitic acid concentrations of fatty acids for rye and wheat forages are summarized visually in Figure 3. The total fatty acids in rye had a greater concentration of palmitic acid from days 0 to 12 of the study [mean difference for rye–wheat (95% CI) at day0, 2.8 (0.9, 4.9) g 100g−1 of total fatty acids; at day12, 1.3 (0.1, 2.7) g 100g−1 of total fatty acids]. Concentrations in the fatty acids of forages were similar for days 13 through 32 [mean difference for rye–wheat (95% CI) at day13, 1.2 (−0.0, 2.5) g 100g−1 of total fatty acids; at day32, −1.2 (−2.3, 0.0) g 100g−1 of total fatty acids]. For the remainder of the study, fatty acids in wheat had greater concentrations than fatty acids in rye [mean difference for wheat–rye (95% CI) at day33, 1.3 (0.0, 2.5) g 100g−1 of total fatty acids; at day46, 2.9 (1.0, 4.8) g 100g−1 of total fatty acids].
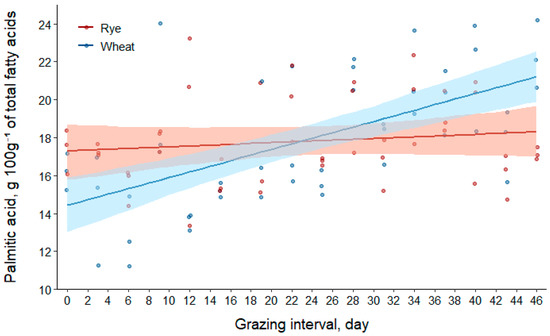
Figure 3.
Scatter plot of data with regression (solid lines) and bootstrap 95% confidence intervals (transparent bands) based on 1000 resamples for palmitic acid (C16:0) concentrations of fatty acids in rye and wheat forages during the grazing interval (day0 = 25 April; day46 = 10 June 2016).
3.2.3. Linoleic Acid (C18:2n-6)
Linoleic acid concentrations in the total fatty acids of forages increased by approximately 3% in rye and 90% in wheat over the grazing interval (Table 2). Regression coefficient results from Table 3 suggest that the model to predict linoleic acid concentration had the greatest R2(m) value compared to all other models, and the effects of forage species and day explained most of the model variation (R2(m) = 0.77). Intuitively, all fixed effects were major sources of variation in the model.
The linear and quadratic effects of day were 9.31 [95% CI (5.90, 12.88)] and 8.11 [95% CI (3.89, 11.74)] g 100g−1 of total fatty acids per day greater for wheat compared to rye, respectively. The coefficient for the quadratic term of day was negative for rye and positive for wheat. The outcome of these contrasting quadratic terms is displayed in Figure 4 by the concave (negative coefficient) and convex (positive coefficient) relationships between the composition and day.
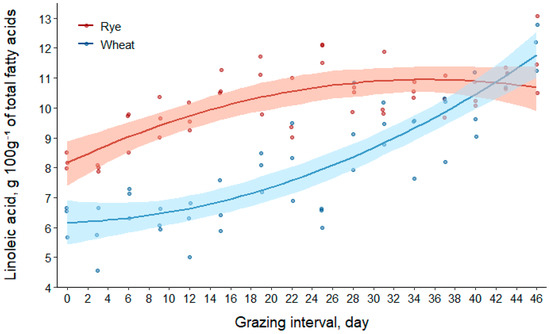
Figure 4.
Scatter plot of data with regression (solid lines) and bootstrap 95% confidence intervals (transparent bands) based on 1000 resamples for linoleic acid (C18:2n-6) concentration of total fatty acids in rye and wheat forages during the grazing interval (day0 = 25 April; day46 = 10 June 2016).
As displayed in Figure 4, the concentration of linoleic acid was greater in the total fatty acid content of rye compared to wheat for the majority of the study’s beginning [mean difference for rye–wheat (95% CI) at day0, 2.0 (0.9, 3.0) g 100g−1 of total fatty acids; at day39, 0.6 (0.0, 1.3) g 100g−1 of total fatty acids]. However, the fatty acid content of forages had similar concentrations from days 40 through 45 (mean difference for rye–wheat (95% CI) at day40, 0.4 (−0.2, 1.1) g 100g−1 of total fatty acids; at day45, −0.8 (−1.8, 0.2) g 100g−1 of total fatty acids]. On the final day of the grazing interval (day46), wheat had 1.1 [95% CI (0.0, 2.2)] g 100g−1 of total fatty acids greater linoleic acid than rye.
3.2.4. Omega-6 to Omega-3 (n-6:n-3) Fatty Acid Ratio
The n-6:n-3 fatty acid ratio increased by approximately 41% in rye and 140% in wheat (Table 2). From the results in Table 3, the effects of forage species and day explained most of the variation in the n-6:n-3 fatty acid ratio outcome (R2(m) = 0.72), and all fixed effects were sources of variation in the model. Similar to the results for linoleic acid, the linear and quadratic effects of day were 0.213 [95% CI (0.130, 0.296)] and 0.174 [95% CI (0.091, 0.256)] per day greater for wheat compared to rye, respectively. The coefficient for the quadratic term of day was negative for rye and positive for wheat, which is visually apparent in Figure 5.
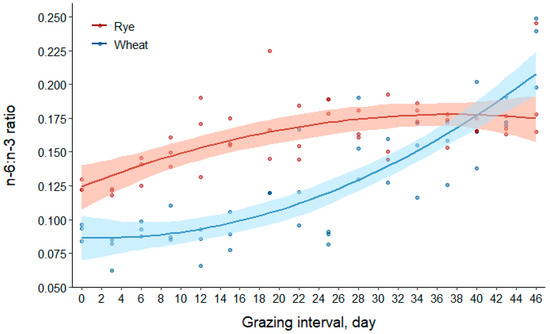
Figure 5.
Scatter plot of data with regression (solid lines) and bootstrap 95% confidence intervals (transparent bands) based on 1000 resamples for the omega-6 to omega-3 (n-6:n-3) fatty acid ratio of rye and wheat forages during the grazing interval (day0 = Apr 25; day46 = 10 June 2016).
From results illustrated in Figure 5, the n-6:n-3 fatty acid ratio was greater in rye compared to wheat from days 0 through 37 [mean difference for rye–wheat (95% CI) at day0, 0.04 (0.01, 0.06); at day37, 0.01 (0.00, 0.03)]. Rye and wheat forages had similar n-6:n-3 fatty acid ratios from days 38 through 43 [mean difference for rye–wheat (95% CI) at day38, 0.01 (−0.00, 0.02); at day43, −0.02 (−0.03, 0.00)]. The n-6:n-3 fatty acid ratio was greater for wheat compared to rye for the last 3 days of the grazing interval [mean difference for wheat–rye (95% CI) at day44, 0.02 (0.00, 0.04); at day46, 0.03 (0.01, 0.06)].
4. Discussion
Concentrations of α-linolenic acid in the fatty acids of forages decreased during the grazing interval, while palmitic and linoleic acids increased (Table 2). The magnitude of fatty acid composition change for wheat was profoundly greater than that for rye. In a comparable study, Clapham et al. [22] investigated the effects of forage maturity on the fatty acid compositions of numerous forb, grass and legume species over a 6-week interval. This study reported a 13% (range: −4% to 12%) decrease in α-linolenic acid, a 1% (range: 0% to 36%) increase in palmitic acid, and a 2% (range: −11% to 18%) increase in linoleic acid concentrations in the total fatty acid content, as well as a 4% (range: −12% to 31%) increase in the n-6:n-3 fatty acid ratio between minimum and maximum harvest dates, when averaged across forage species (ibid). The wide ranges of values reported suggest that forage species has a major influence on the variation of fatty acid concentration change in the total fatty acid contents of forages. Boufaïed et al. [21] investigated the effects of plant maturity, between stem elongation and the early flowering growth stages, on the fatty acid composition in timothy forages, and reported a 11% decrease in α-linolenic acid, a 10% increase in palmitic acid and a 8% increase in linoleic acid concentrations in the total fatty acid content, as well as a 22% increase in the n-6:n-3 fatty acid ratio as forages matured. For the results of the current study, the percentage change in fatty acid compositions for rye forages are similar to the results reported in previous studies, but the percentage change in fatty acid compositions for wheat forages are much greater than previous reports. Authors encourage the investigation of similar forages—which have the potential to be utilized for leys—in future large-scale grazing experiments, to better understand fatty acid composition dynamics.
Grazing land management factors, such as fertilizer application and rest period, may play a limited role in the fatty acid composition variation of forages [21,23,48]. Mayland et al. [48] reported that the total content of fatty acids in forages increased linearly between soil nitrogen concentrations of 1 and 5 g 100g−1. Boufaïed et al. [21] found no effect of the addition of 45 kg ha−1 of phosphorus fertilization on the total fatty acid content of timothy forages; however, the addition of 120 kg ha−1 of nitrogen fertilization increased the overall fatty acid content of forages. Forages treated with 120 kg ha−1 of nitrogen fertilization had 5.0 g 100g−1 of total fatty acids greater α-linolenic acid, 1.3 g 100g−1 of total fatty acids less palmitic acid, 2.5 g 100g−1 of total fatty acids less linoleic acid, and a 0.10 lower n-6:n-3 fatty acid ratio (ibid). In a study comparing 20-d and 38-d rest periods, Dewhurst et al. [23] reported that the longer rest period resulted in 6.9 g 100g−1 of total fatty acids lower α-linolenic acid, 3.3 g 100g−1 of total fatty acids greater palmitic acid, 1.3 g 100g−1 of total fatty acids greater linoleic acid, and a 0.04 increase in the n-6:n-3 fatty acid ratio in forages. Soil nitrogen levels of soil cores taken at a depth of 0 to 15 cm prior to fall planting (0.43 g 100g−1), during the grazing interval (0.48 g 100g−1) and at the end of the grazing interval (0.47 g 100g−1) were similar, suggesting that soil nitrogen levels likely did not influence fatty acid composition variation. The difference between the maximum and minimum rest period was 19 d for the current study. On the basis of this information, and results reported by Dewhurst et al. [23], the varying rest period utilized during the current study may have played a minor role in the fatty acid composition variation in forages throughout the grazing interval.
Numerous reviews of previous research studies agree that the major factors influencing the fatty acid concentrations of forages include maturity and species [20,49,50,51]. Quantitative results, analyzed in a meta-analysis by Glasser et al. [20], reported that stage of maturity had the greatest magnitude of effect on the α-linolenic acid concentration in the total fatty acids of forages, compared to rest period and soil nitrogen, where the estimated difference between maximum and minimum cutting dates was a difference of −14 g 100g−1 of total fatty acids. Khan et al. [50] investigated the causes of variation in fatty acid content and composition of forage silage samples, and determined from a redundancy analysis that forage maturity explained 82% of the variation in the fatty acid content and composition of silages. As forages mature through the vegetative stages, the proportion of leaves decreases while the proportion of stems and seeds increases [23], which results in a decrease of membrane lipids and a decrease in the concentration of α-linolenic fatty acid, in terms of its contribution to the total fatty acid content in forages [52]. Thereafter, the maturation and senescence of leaves, as well as an increase in the fiber and grain development, explain variations in the fatty acid composition of forages due to reproductive stage. With the results of the current study supported by evidence of previous studies, the change in fatty acid compositions of rye and wheat forages throughout the grazing interval was most likely explained by stage of maturity, characterized by stem-to-leaf ratio and grain development.
The awareness of fatty acids in human diets is a driver for investigating alternative forages for production of organic and pasture-raised cattle. The major important fatty acids in dairy and beef products include CLA and long-chain n-3 fatty acids (i.e., EPA, DPA and DHA). Although the CLA in beef and milk is formed from the incomplete ruminal biohydrogenation of linoleic acid [16], cattle diets high in α-linolenic acid appear to enable specific microflora development that increases the formation and deposition of CLA in tissues [17]. The longer chain n-3 fatty acids in beef and milk are formed from dietary α-linolenic acid [14,15]. Results from the current study demonstrated that rye and wheat forages vary in their fatty acid compositions over the grazing interval. Specifically, the prominent fatty acid concentrations of α-linolenic, palmitic and linoleic acids, and the n-6:n-3 fatty acid ratio, varied in respect to day and forage species during the grazing interval. Therefore, these findings suggest that forage species and number of days of the grazing interval may contribute to the formation of CLA and long-chain n-3 fatty acids in beef and milk from grazing cattle.
The n-6:n-3 fatty acid ratio in cattle diets may be related to CLA and the n-6:n-3 fatty acid ratio in beef and milk. A study by Dhiman et al. [53] reported increased CLA concentrations in milk when linoleic acid was supplemented and the dietary n-6:n-3 fatty acid ratio was ≥ 5, as well as when α-linolenic acid was supplemented and the dietary n-6:n-3 fatty acid ratio was approximately 0.5. The study also reported a similar relationship between n-6:n-3 fatty acid ratios in the diet and consequent milk in dairy cattle (ibid). A high dietary n-6:n-3 fatty acid ratio may lead to increased CLA concentrations, but may also have undesirable effects on the n-6:n-3 fatty acid ratio by increasing the ratio in cattle tissues. In another study, French et al. [10] reported increased CLA concentrations and decreased n-6:n-3 fatty acid ratios in the intramuscular fat of beef when cattle consumed a diet with an n-6:n-3 fatty acid ratio of approximately 0.3. The maximum predicted n-6:n-3 fatty acid ratio in forages of the current study was 0.21 (Table 2). On the basis of this information, increasing beef and milk fat CLA concentrations, while simultaneously decreasing the n-6:n-3 fatty acid ratio, may be achieved by implementing cattle grazing of forages with high α-linolenic acid concentrations, like the rye and wheat forages investigated in the current study. In general, producers should aim to stock cattle as soon as conditions are suitable for grazing, to take advantage of the lowest n-6:n-3 fatty acid ratio offered in immature forages.
Grazing land management is currently a major focus for organic and pasture-raised cattle producers. The growing consumer interest in desirable fatty acid profiles of beef and dairy products has inspired the development of alternative grazing land management strategies that can support cattle production. In the Midwest of the USA, cool-season annual leys in the early spring can complement permanent pastureland by extending the grazing season beyond the ability of a permanent pastureland. Rye and wheat are cool-season annual forages that are primarily used for improving soil health in rotation with crops. By utilizing integrated crop–livestock methods, rye and wheat leys can simultaneously provide forages rich in α-linolenic acid for cattle grazing. Since the grazing interval of cool-season annual leys may only last several weeks, it is important to stress that producers should also explore other feeding strategies to implement throughout the year (e.g., perennial pasture improvement, warm-season annual pastures and fatty acid dietary supplementation) to continue enhancing a favorable fatty acid composition of beef and milk products. It is important to note that this study was conducted in one location over a single grazing interval. This limitation should be considered when applying the results of the study to the development of crop–livestock integration methods in other agro-ecological zones, as emphasized by Lemaire et al. [27]. The fatty acid compositions of forages may vary due to numerous factors, such as climate, grazing methods, irrigation, water quality and soil fertility, as well as plant characteristics such as density, growth rates, physiological stress, seeding rate and competition for light, nutrients, and space. Future studies should explore the effects of alternative forages, grazing patterns and rest period durations on fatty acids in forages, to further support crop–livestock integration practices.
5. Conclusions
The composition of fatty acids in rye and wheat forages changed during the grazing interval. The greatest marginal R2 values resulted from models predicting linoleic acid (0.77) and the n-6:n-3 fatty acid ratio (0.72), indicating that the variations in linoleic acid concentration of total fatty acids, and variations in the n-6:n-3 fatty acid ratio, may be mostly explained by forage species and number of days of the grazing interval. Alpha-linolenic acid, the most prominent fatty acid in the forages, decreased linearly over the grazing interval in terms of its concentration in the overall fatty acid content of forages. The n-6:n-3 fatty acid ratios in the forages increased quadratically, but remained below levels that were previously determined to improve CLA and n-6:n-3 fatty acid ratios in beef and milk products. Based on results from this study, forage species and number of days of the grazing interval influence the composition of fatty acids in forages under rotational cattle grazing conditions.
Supplementary Materials
The following are available online at https://www.mdpi.com/2073-4395/10/6/813/s1, Figure S1: Myristic (C14:0) acid; Figure S2: Steric (C18:0) acid; Figure S3: Oleic (C18:1) acid; Figure S4: Arachidic (C20:0) acid; Figure S5: Behenic (C22:0) acid; Figure S6: Lignoceric (C24:0) acid; and Data S1: Data used for analysis with fatty acids expressed as g g−1 of total fatty acids.
Author Contributions
Conceptualization, B.J.H. and K.D.; Data curation, H.N.P.; Formal analysis, H.N.P.; Funding acquisition, B.J.H., K.D. and R.T.; Investigation, H.N.P. and B.J.H.; Methodology, B.J.H.; Project administration, B.J.H.; Supervision, B.J.H.; Visualization, H.N.P.; Writing: original draft, H.N.P.; Writing: review and editing, H.N.P., B.J.H., K.D. and R.T. All authors have read and agreed to the published version of the manuscript.
Funding
This research was funded by the National Institute of Food and Agriculture United States Department of Agriculture under award number 2014-51300-22541.
Acknowledgments
The authors express gratitude to Darin Huot, summer interns, and staff at WCROC for their assistance in data collection and care of animals.
Conflicts of Interest
The authors declare no conflict of interest. The funders had no role in the design of the study; in the collection, analyses, or interpretation of data; in the writing of the manuscript, or in the decision to publish the results.
References
- Greene, C.; McBride, W. Consumer Demand for Organic Milk Continues to Expand—Can the US Dairy Sector Catch up? Available online: http://www.choicesmagazine.org/ (accessed on 15 March 2020).
- Umberger, W.J.; Boxall, P.C.; Lacy, R.C. Role of credence and health information in determining us consumers’ willingness-to-pay for grass-finished beef. Aust. J. Agric. Resour. Econ. 2009, 53, 603–623. [Google Scholar] [CrossRef]
- Kearney, J. Food consumption trends and drivers. Philos. Trans. R. Soc. Lond. B Biol. Sci. 2010, 365, 2793–2807. [Google Scholar] [CrossRef]
- Leaf, A.; Weber, P. Cardiovascular effects of n-3 fattys acids. N. Engl. J. Med. 1998, 318, 549–557. [Google Scholar] [CrossRef] [PubMed]
- McGuire, M.A.; McGuire, M.K. Conjugated linoleic acid (CLA): A ruminant fatty acid with beneficial effects on human health. J. Anim. Sci. 2000, 77, 1. [Google Scholar] [CrossRef]
- Tapiero, H.; Ba, G.N.; Couvreur, P.; Tew, K.D. Polyunsaturated fatty acids (PUFA) and eicosanoids in human health and pathologies. Biomed. Pharmacother. 2002, 56, 215–222. [Google Scholar] [CrossRef]
- Weill, P.; Schmitt, B.; Chesneau, G.; Daniel, N.; Safraou, F.; Legrand, P. Effects of introducing linseed in livestock diet on blood fatty acid composition of consumers of animal products. Ann. Nutr. Metab. 2002, 46, 182–191. [Google Scholar] [CrossRef] [PubMed]
- Kelly, M.L.; Kolver, E.S.; Bauman, D.E.; Van Amburgh, M.E.; Muller, L.D. Effect of intake of pasture on concentrations of conjugated linoleic acid in milk of lactating cows. J. Dairy Sci. 1998, 81, 1630–1636. [Google Scholar] [CrossRef]
- Dhiman, T.R.; Anand, G.R.; Satter, L.D.; Pariza, M.W. Conjugated linoleic acid content of milk from cows fed different diets. J. Dairy Sci. 1999, 82, 2146–2156. [Google Scholar] [CrossRef]
- French, P.; Stanton, C.; Lawless, F.; O’Riordan, E.G.; Monahan, F.J.; Caffrey, P.J.; Moloney, A.P. Fatty acid composition, including conjugated linoleic acid, of intramuscular fat from steers offered grazed grass, grass silage, or concentrate-based diets. J. Anim. Sci. 2000, 78, 2849–2855. [Google Scholar] [CrossRef]
- Electronic Code of Federal Regulations. Available online: https://www.ecfr.gov/ (accessed on 19 March 2020).
- Benbrook, C.M.; Davis, D.R.; Heins, B.J.; Latif, M.A.; Leifert, C.; Peterman, L.; Butler, G.; Faergeman, O.; Abel-Caines, S.; Baranski, M. Enhancing the fatty acid profile of milk through forage-based rations, with nutrition modeling of diet outcomes. Food Sci. Nutr. 2018, 6, 681–700. [Google Scholar] [CrossRef]
- Bjorklund, E.A.; Heins, B.J.; Dicostanzo, A.; Chester-Jones, H. Fatty acid profiles, meat quality, and sensory attributes of organic versus conventional dairy beef steers. J. Dairy Sci. 2014, 97, 1828–1834. [Google Scholar] [CrossRef] [PubMed]
- Scollan, N.; Hocquette, J.-F.; Nuernberg, K.; Dannenberger, D.; Richardson, I.; Moloney, A. Innovations in beef production systems that enhance the nutritional and health value of beef lipids and their relationship with meat quality. Meat Sci. 2006, 74, 17–33. [Google Scholar] [CrossRef] [PubMed]
- Bernal-Santos, G.; O’Donnell, A.M.; Vicini, J.L.; Hartnell, G.F.; Bauman, D.E. Hot topic: Enhancing omega-3 fatty acids in milk fat of dairy cows by using stearidonic acid-enriched soybean oil from genetically modified soybeans. J. Dairy Sci. 2010, 93, 32–37. [Google Scholar] [CrossRef] [PubMed]
- Griinari, J.; Bauman, D. Biosynthesis of conjugated linoleic acid and its incorporation into meat and milk in ruminants. In Advances in Conjugated Linoleic Acid Research; Yurawecz, M., Mossoba, M., Kramer, J., Pariza, M., Nelson, G., Eds.; AOCS Press: Champaign, IL, USA, 1999; Volume 1, pp. 180–200. ISBN 1-893997-02-2. [Google Scholar]
- Mir, P.S.; McAllister, T.A.; Scott, S.; Aalhus, J.; Baron, V.; McCartney, D.; Charmley, E.; Goonewardene, L.; Basarab, J.; Okine, E.; et al. Conjugated linoleic acid–enriched beef production. Am. J. Clin. Nutr. 2004, 79, 1207S–1211S. [Google Scholar] [CrossRef]
- MacRae, J.; O’Reilly, L.; Morgan, P. Desirable characteristics of animal products from a human health perspective. Livest. Prod. Sci. 2005, 94, 95–103. [Google Scholar] [CrossRef]
- Daley, C.A.; Abbott, A.; Doyle, P.S.; Nader, G.A.; Larson, S. A review of fatty acid profiles and antioxidant content in grass-fed and grain-fed beef. Nutr. J. 2010, 9, 10. [Google Scholar] [CrossRef]
- Glasser, F.; Doreau, M.; Maxin, G.; Baumont, R. Fat and fatty acid content and composition of forages: A meta-analysis. Anim. Feed Sci. Technol. 2013, 185, 19–34. [Google Scholar] [CrossRef]
- Boufaïed, H.; Chouinard, P.Y.; Tremblay, G.F.; Petit, H.V.; Michaud, R.; Bélanger, G. Fatty acids in forages. I. Factors affecting concentrations. Can. J. Anim. Sci. 2003, 83, 501–511. [Google Scholar] [CrossRef]
- Clapham, W.M.; Foster, J.G.; Neel, J.P.S.; Fedders, J.M. Fatty acid composition of traditional and novel forages. J. Agric. Food Chem. 2005, 53, 10068–10073. [Google Scholar] [CrossRef]
- Dewhurst, R.J.; Scollan, N.D.; Youell, S.J.; Tweed, J.K.S.; Humphreys, M.O. Influence of species, cutting date and cutting interval on the fatty acid composition of grasses. Grass Forage Sci. 2001, 56, 68–74. [Google Scholar] [CrossRef]
- Meľuchová, B.; Blaško, J.; Kubinec, R.; Górová, R.; Dubravská, J.; Margetín, M.; Soják, L. Seasonal variations in fatty acid composition of pasture forage plants and CLA content in ewe milk fat. Small Rumin. Res. 2008, 78, 56–65. [Google Scholar] [CrossRef]
- Sulc, R.M.; Tracy, B.F. Integrated crop-livestock systems in the U.S. corn belt. Agron. J. 2007, 99, 335–345. [Google Scholar] [CrossRef]
- Hayden, J.; Rocker, S.; Phillips, H.; Heins, B.; Smith, A.; Delate, K. The importance of social support and communities of practice: Farmer perceptions of the challenges and opportunities of integrated crop-livestock systems on organically managed farms in the Northern US. Sustainability 2018, 10, 4606. [Google Scholar] [CrossRef]
- Lemaire, G.; Franzluebbers, A.; de Faccio Carvalho, P.C.; Dedieu, B. Integrated crop-livestock systems: Strategies to achieve synergy between agricultural production and environmental quality. Agric. Ecosyst. Environ. 2014, 190, 4–8. [Google Scholar] [CrossRef]
- Allen, V.G.; Batello, C.; Berretta, E.J.; Hodgson, J.; Kothmann, M.; Li, X.; McIvor, J.; Milne, J.; Morris, C.; Peeters, A.; et al. An international terminology for grazing lands and grazing animals. Grass Forage Sci. 2011, 66, 2–28. [Google Scholar] [CrossRef]
- Watson, M.E.; Brown, J.R. pH and lime requirement. In Recommended Chemical Soil Test Procedures for the North Central Region; Brown, J.R., Ed.; Missouri Agricultural Experiment Station SB 1001: Columbia, MO, USA, 1998; Volume 221, pp. 13–16. [Google Scholar]
- Combs, S.M.; Nathan, M.V. Soil organic matter. In Recommended Chemical Soil Test Procedures for the North Central Region; Brown, J.R., Ed.; Missouri Agricultural Experiment Station SB 1001: Columbia, MO, USA, 1998; Volume 221, pp. 53–58. [Google Scholar]
- Warncke, D.; Brown, J.R. Potassium and other basic cations. In Recommended Chemical Soil Test Procedures for the North Central Region; Brown, J.R., Ed.; Missouri Agricultural Experiment Station SB 1001: Columbia, MO, USA, 1998; Volume 221, pp. 31–34. [Google Scholar]
- Frank, K.; Beegle, D.; Denning, J. Phosphorus. In Recommended Chemical Soil Test Procedures for the North Central Region; Brown, J.R., Ed.; Missouri Agricultural Experiment Station SB 1001: Columbia, MO, USA, 1998; Volume 221, pp. 21–29. [Google Scholar]
- Nelson, D.W. Determination of ammonium in KCl extracts of soils by the salicylate method. Commun. Soil Sci. Plant Anal. 1983, 14, 1051–1062. [Google Scholar] [CrossRef]
- Gelderman, R.H.; Beegle, D. Nitrate-nitrogen. In Recommended Chemical Soil Test Procedures for the North Central Region; Brown, J.R., Ed.; Missouri Agricultural Experiment Station SB 1001: Columbia, MO, USA, 1998; Volume 221, pp. 17–20. [Google Scholar]
- Phillips, H.N.; Heins, B.J.; Delate, K.; Turnbull, R. Impact of grazing dairy steers on winter rye (Secale cereale) versus winter wheat (Triticum aestivum) and effects on meat quality, fatty acid and amino acid profiles, and consumer acceptability of organic beef. PLoS ONE 2017, 12, e0187686. [Google Scholar] [CrossRef]
- Nazareth, J.; Shaw, A.; Delate, K.; Turnbull, R. Food safety considerations in integrated organic crop-livestock systems: Prevalence of Salmonella spp. and E. coli O157:H7 in organically raised cattle and organic feed. Renew. Agric. Food Syst. 2019, 1–9. [Google Scholar] [CrossRef]
- Murison, R.; Scott, J.M. Statistical methodologies for drawing causal inference from an unreplicated farmlet experiment conducted by the Cicerone Project. Anim. Prod. Sci. 2013, 53, 643–648. [Google Scholar] [CrossRef][Green Version]
- Fisher, D. Defining the experimental unit in grazing trials. J. Anim. Sci. 2000, 77, 1–5. [Google Scholar] [CrossRef]
- Boissy, A.; Le Neindre, P. Behavioral, cardiac and cortisol responses to brief peer separation and reunion in cattle. Physiol. Behav. 1997, 61, 693–699. [Google Scholar] [CrossRef]
- Schmidt, J.R.; Miller, M.C.; Andrae, J.G.; Ellis, S.E.; Duckett, S.K. Effect of summer forage species grazed during finishing on animal performance, carcass quality, and meat quality. J. Anim. Sci. 2013, 91, 4451–4461. [Google Scholar] [CrossRef] [PubMed]
- Bates, D.; Mächler, M.; Bolker, B.; Walker, S. Fitting linear mixed-effects models using lme4. J. Stat. Softw. 2015, 67, 1–48. [Google Scholar] [CrossRef]
- R Core Team. A Language and Environment For Statistical Computing. Available online: http://203.187.160.132:9011/finzi.psych.upenn.edu/c3pr90ntc0td/R/library/dplR/doc/intro-dplR.pdf (accessed on 1 June 2020).
- Hartig, F. DHARMa: Residual Diagnostics for Hierarchical (multi-level/mixed) Regression Models. Available online: https://cran.r-project.org/package=DHARMa (accessed on 27 May 2020).
- Moran, P.A.P. Notes on continuous stochastic phenomena. Biometrika 1950, 37, 17–23. [Google Scholar] [CrossRef]
- Barton, K. MuMIn: Multi-Model Inference. Available online: https://cran.r-project.org/package=MuMIn (accessed on 30 March 2020).
- Nakagawa, S.; Schielzeth, H. A general and simple method for obtaining R2 from generalized linear mixed-effects models. Methods Ecol. Evol. 2013, 4, 133–142. [Google Scholar] [CrossRef]
- Wickham, H. ggplot2: Elegant Graphics for Data Analysis; Springer: New York, NY, USA, 2016; ISBN 978-3-319-24277-4. [Google Scholar]
- Mayland, H.F.; Molloy, L.F.; Collie, T.W. Higher fatty acid composition of immature forages as affected by N fertilization. Agron. J. 1976, 68, 979–982. [Google Scholar] [CrossRef]
- Dewhurst, R.J.; Shingfield, K.J.; Lee, M.R.F.; Scollan, N.D. Increasing the concentrations of beneficial polyunsaturated fatty acids in milk produced by dairy cows in high-forage systems. Anim. Feed Sci. Technol. 2006, 131, 168–206. [Google Scholar] [CrossRef]
- Khan, N.A.; Cone, J.W.; Fievez, V.; Hendriks, W.H. Causes of variation in fatty acid content and composition in grass and maize silages. Anim. Feed Sci. Technol. 2012, 174, 36–45. [Google Scholar] [CrossRef]
- Elgersma, A. Grazing increases the unsaturated fatty acid concentration of milk from grass-fed cows: A review of the contributing factors, challenges and future perspectives. Eur. J. Lipid Sci. Technol. 2015, 117, 1345–1369. [Google Scholar] [CrossRef]
- Buccioni, A.; Decandia, M.; Minieri, S.; Molle, G.; Cabiddu, A. Lipid metabolism in the rumen: New insights on lipolysis and biohydrogenation with an emphasis on the role of endogenous plant factors. Anim. Feed Sci. Technol. 2012, 174, 1–25. [Google Scholar] [CrossRef]
- Dhiman, T.R.; Satter, L.D.; Pariza, M.W.; Galli, M.P.; Albright, K.; Tolosa, M.X. Conjugated linoleic acid (CLA) content of milk from cows offered diets rich in linoleic and linolenic acid. J. Dairy Sci. 2000, 83, 1016–1027. [Google Scholar] [CrossRef]


© 2020 by the authors. Licensee MDPI, Basel, Switzerland. This article is an open access article distributed under the terms and conditions of the Creative Commons Attribution (CC BY) license (http://creativecommons.org/licenses/by/4.0/).