Humboldtian Diagnosis of Peach Tree (Prunus persica) Nutrition Using Machine-Learning and Compositional Methods


 ,
, 
Abstract
1. Introduction
2. Material and Methods
2.1. Experimental Data Set
2.2. Soil and Tissue Analyses
2.3. Isometric Log-Ratio Transformation
2.4. Centered Log-Ratio Transformation
3. Results
3.1. Features
3.2. Model Precision
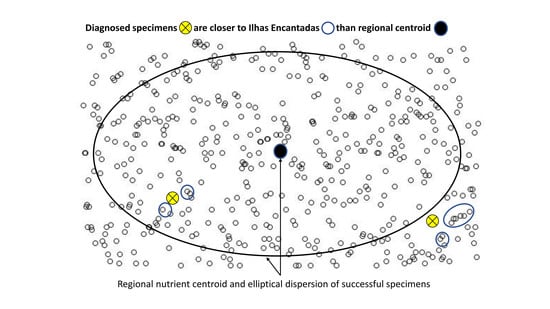
3.3. Regional vs. Local Diagnosis
4. Discussion
4.1. Compositions as Separate Parts or Interactive Systems?
4.2. From Regional to Local Diagnosis
4.3. Machine Learning and Big Data
4.4. Citizen Science and Precision Farming
5. Conclusions
Author Contributions
Funding
Conflicts of Interest
References
- FAOSTAT. Production Quantities of Peaches and Nectarines by Country. 2019. Available online: http://www.fao.org/faostat/en/#data/QC/visualize (accessed on 22 June 2020).
- FNP; Pêssego. FNP Consultoria & Comércio; Agrianual edition; Agribuisiness Intelligence: São Paulo, Brazil, 2018. [Google Scholar]
- Parent, L.E.; Parent, S.É.; Rozane, D.E.; Amorim, D.A.; Hernandes, A.; Natale, W. Unbiased Approach to Diagnose the Nutrient Status of Guava, Petrolina, Pernambuco, Brazil. In III International Symposium on Guava and other Myrtaceae; International Society for Horticultural Science (ISHS): Petrolina, Brazil, 2012; Volume 959, pp. 145–159. [Google Scholar]
- Sousa, R.O.; Ermani, P.R. Manual de Calagem e Adubação para os Estados do Rio Grande do Sul e de Santa Catarina; Comissão de Química e Fertilidade do Solo—RS/SC (Sociedade Brasileira de Ciência do Solo—Núcleo Regional Sul): Santa Maria, Brazil, 2016. [Google Scholar]
- Van Maarschalkerweerd, M.; Husted, S. Recent in Fast Spectroscopy for Mineral Plant Analysis. Front. Plant Sci. 2015, 6, 169. [Google Scholar] [CrossRef]
- Munson, R.D.; Nelson, W.L. Principles and Practices in Plant Analysis. In Soil Testing and Plant Analysis; Westerman, R.L., Ed.; Soil Science Society of America: Madison WI, USA, 1990; pp. 359–387. [Google Scholar]
- Natale, W.; Neton, A.J.L.; Rozane, D.E.; Parent, L.E.; Corrêa, M.C. Mineral Nutrition Evolution in the Formation of Fruit Tree Rootstocks and Seedlings. Rev. Bras. Frutic. 2018, 46. [Google Scholar] [CrossRef]
- Rombolà, A.D.; Sorrenti, G.; Marodin, G.A.B.; De Pieri, A.Z.; Barca, E. Nutrition and Soil Management in Stone Fruit Trees in Temperate Regions. Ciências Agrárias 2012, 33, 639–654. [Google Scholar]
- Keppel, G.; Kreft, H. Integration and Synthesis of Quantitative Data: Alexander von Humboldt’s Renewed Relevance in Modern Biogeography and Ecology. Front. Biogeogr. 2019, 11, e43187. [Google Scholar] [CrossRef]
- Coulibali, Z.; Cambouris, A.N.; Parent, S.-É. Cultivar-Specific Nutritional Status of Potato (Solanum Tuberosum L.) Crops. PLoS ONE, 2020; 15, e0230458. [Google Scholar] [CrossRef]
- Aitchison, J. The Statistical Analysis of Compositional Data; Monographs on Statistics and Applied Probability; Chapman & Hall Ltd.: London, UK, 1986. [Google Scholar]
- Lagatu, H.; Maume, L. Le diagnostic foliaire de la pomme de terre. Ann. L’école Natl. Agron. Montp. 1934, 22, 50–158. [Google Scholar]
- Holland, D.A. The interpretation of leaf analysis. J. Hortic. Sci. 1966, 41, 311–329. [Google Scholar] [CrossRef]
- Beaufils, E.R. Diagnosis and Recommendation Integrated System (DRIS); Soil Science Bulletin #1; Department of Soil Science and Agrometeorology at the University of Natal: Pietermaritzburg, South Africa, 1973. [Google Scholar]
- Egozcue, J.J.; Pawlowsky-Glahn, V.; Mateu-Figueras, G.; Barceló-Vidal, C. Isometric Logratio Transformations for Compositional Data Analysis. Math. Geol. 2003, 35, 279–300. [Google Scholar] [CrossRef]
- Parent, L.E.; Dafir, M. A Theoretical Concept of Compositional Nutrient Diagnosis. J. Am. Soc. Hortic. Sci. 1992, 117, 239–242. [Google Scholar] [CrossRef]
- Parent, S.É.; Parent, L.E.; Rozane, D.E.; Natale, W. Plant Ionome Diagnosis Using Sound Balances: Case Study with Mango (Mangifera Indica). Front. Plant Sci. 2013, 4. [Google Scholar] [CrossRef]
- De Deus, J.A.L.; Neves, J.C.L.; M.C.M.C.; Parent, S.-É.; Natale, W.; Parent, L.E. Balance design for robust foliar nutrient diagnosis of ‘Prata’ banana (Musa spp.). Sci. Rep. 2018, 2018, 15040. [Google Scholar] [CrossRef]
- MAPA. Normas Técnicas Específicas Para a Produção Integrada de Pêssego—NTEPI-Pêssego. 2008. Available online: https://www.normasbrasil.com.br/norma/instrucao-normativa-37-2008_76973.html (accessed on 22 June 2020).
- May-De Mio, L.L.; Monteiro, L.B.; Motta, C.C.V.; Cuquel, F.L.; Serrat, B.M.; Kowata-Dresch, L.S. Nutrição, danos e produção de pessegueiro em sistema de Produção Integrada. Rev. Bras. Ciências Agrárias 2014, 9, 512–518. [Google Scholar] [CrossRef][Green Version]
- Campoy, J.A.; Darbyshire, R.; Dirlewanger, E.; Quero-García, J.; Wenden, B. Yield Potential Definition of the Chilling Requirement Reveals Likely Underestimation of the Risk of Climate Change on Winter Chill Accumulation. Int. J. Biometeorol. 2019, 63, 183–192. [Google Scholar] [CrossRef] [PubMed]
- Embrapa. Uva e Vinho. Available online: https://www.embrapa.br/en/uva-e-vinho/dados-meteorologicos (accessed on 19 April 2020).
- Embrapa. Clima-Temperado—Laboratório de Agrometeorologia. Available online: http://agromet.cpact.embrapa.br/ (accessed on 19 April 2020).
- UFRGS. Série Meteorológica Da Estação Experimental Agronômica. Available online: https://hospedagemphp.ufrgs.br/agronomia/joomla/index.php/eea-pesquisa (accessed on 19 April 2020).
- De Santos, H.G.; Jacomine, P.K.T.; Anjos, L.H.C.; de Oliveira, V.A.; Lumbreras, J.F.; Coelho, M.R.; de Almeida, J.A.; de Araujo Filho, J.C.; de Oliveira, J.B.; Cunha, T.J. Brazilian Soil Classification System; Embrapa: Brasília, Brazil, 2018. [Google Scholar]
- Brunetto, G.; Ermani, P.R.; de Melo, G.W.B.; Nava, G.F. Manual de calagem e adubação para os estados do Rio Grande do Sul e de Santa Catarina; Silva, L.S., Gatiboni, L.C., Anghinoni, I., Sousa, R.O., Emani, P.R., Eds.; Comissão de Química e Fertilidade do Solo,RS/SC (Sociedade Brasileira de Ciência do Solo—Núcleo Regional Sul): Santa Maria, Brazil, 2016; pp. 189–233. [Google Scholar]
- Embrapa. Manual de Análises Químicas de Solos, Plantas e Fertilizantes; Silva, F.C., Ed.; Embrapa A Agroindústria Tropical, Empresa Brasileira de Pesquisa Agropecuária: Fortaleza, Brazil, 2009. [Google Scholar]
- Instituto Adolfo Lutz. Métodos físico-químicos para análise de alimentos /coordenadores Odair Zenebon, Neus Sadocco Pascuet e Paulo Tiglea. 2008. Available online: http://www.ial.sp.gov.br/resources/editorinplace/ial/2016_3_19/analisedealimentosial_2008.pdf (accessed on 22 June 2020).
- Aitchison, J.; Greenacre, M. Biplots of Compositional Data. Appl. Stat. 2002, 51, 375–392. [Google Scholar] [CrossRef]
- Egozcue, J.J.; Pawlowsky-Glahn, V. Groups of Parts and Their Balances in Compositional Data Analysis. Math. Geol. 2005, 37, 795–828. [Google Scholar] [CrossRef]
- Tagliavini, M.; Zavalloni, C.; Rombolà, A.D.; Quartieri, M.; Malaguti, D.; Mazzanti, F.; Millard, P.; Marangoni, B. Mineral Nutrient Partitioning to Fruits of Deciduous Trees. Acta Hortic. 2000, 512, 131–140. [Google Scholar] [CrossRef]
- Rietra, R.P.J.J.; Heinen, N.; Dimkpa, C.O.; Bindraban, P.S. Effects of Nutrient Antagonism and Synergism on Yield and Fertilizer Use Efficiency. Commun. Soil Sci. Plant Anal. 2017, 48, 1895–1920. [Google Scholar] [CrossRef]
- Badra, A.; Parent, L.E.; Allard, G.; Tremblay, N.; Desjardins, Y.; Morin, N. Effect of leaf nitrogen concentration versus CND nutritional balance on shoot density and foliage colour of an established Kentucky bluegrass (Poa pratensis L.) turf. Can. J. Plant Sci. 2006, 86, 1107–1118. [Google Scholar] [CrossRef]
- Delacour, H.; Servonnet, A.; Perrot, A.; Vigezzi, J.F.; Ramirez, J.M. La courbe ROC (receiver operating characteristic): Principes et principales applications en biologie clinique. Ann. Biol. Clin. 2005, 63, 145–154. [Google Scholar]
- Tolosana-Delgado, R.; Talebi, H.; Khodadadzadeh, M.; van den Boogaart, K.G. On machine learning algorithms and compositional data. In Proceedings of the 8th International Workshop on Compositional Data Analysis, Terrassa, Spain, 3–8 June 2019; Egozcue, J.J., Graffelman, J., Ortego, M.I., Eds.; pp. 172–175, ISBN 978-84-947240-2-2. [Google Scholar]
- Parent, L.E.; Rozane, D.E.; Deus, J.A.L.; Natale, W. Composition in Fruit Crops: Latest Developments. In Fruit Crops. Diagnosis and Management of Nutrient Constraints; Chapter 12; Srivastava, A., Hue, C., Eds.; Elsevier: New York, NY, USA, 2019. [Google Scholar]
- Johnson, R.S. Nutrient and Water Requirements of Peach Trees. In The Peach: Botany, Production and Uses; Layne, D.R., Bassi, D., Eds.; CABI: Wallingford, UK, 2008; pp. 303–331. [Google Scholar]
- Montañéz, L.; Heras, L.; Abadia, J.; Sanz, M. Plant Analysis Interpretation Based on a New Index: Deviation from Optimum Percentage (DOP). J. Plant Nutr. 1993, 16, 1289–1308. [Google Scholar] [CrossRef]
- Nowaki, R.D.H.; Parent, S.É.; Cecílio Filho, A.B.; Rozane, D.E.; Meneses, N.B.; Silva, A.S.; Natale, W.; Parent, L.E. Phosphorus Over-Fertilization and Nutrient Misbalance of Irrigated Tomato Crops in Brazil. Front. Plant Sci. 2017. [Google Scholar] [CrossRef]
- Tagliavini, M.; Hogue, E.J.; Nielsen, G.H. Influence of Phosphorus Nutrition and Root Zone Temperature on Growth and Mineral Uptake of Peach Seedlings. J. Plant Nutr. 1991, 14, 1267–1276. [Google Scholar] [CrossRef]
- Sinclair, A.G.; Morrison, J.D.; Smith, L.C.; Dodds, K.G. Determination of Optimum Nutrient Element Ratios in Plant Tissue. J. Plant Nutr. 1997, 20, 1069–1083. [Google Scholar] [CrossRef]
- Wilkinson, S.R. Nutrient Interactions in Soil and Plant Nutrition. In Handbook of Soil Science; Sumner, M.E., Ed.; CRC Press: Boca Raton, FL, USA, 2000; pp. 89–112. [Google Scholar]
- Parent, S.É. Why We Should Use Balances and Machine Learning to Diagnose Ionomes. Authorea 2020. [Google Scholar] [CrossRef]
- Epstein, E.; Bloom, A.J. Mineral Nutrition of Plants: Principles and Perspectives; Sinauer Assoc.: Sunderland, MA, USA, 2005. [Google Scholar]
- De Wit, C.T. Resource Use in Agriculture. Agric. Syst. 1992, 40, 125–151. [Google Scholar] [CrossRef]
- Wallace, A.; Wallace, G.A. Limiting Factors, High Yields, and Law of the Maximum. Hortic. Rev. 1993, 15, 409–448. [Google Scholar] [CrossRef]
- Heady, E.O.; Pesek, J.T.; Brown, W.G. Crop Response Surfaces and Economic Optima in Fertilizer Use; Iowa Agriculture and Home Economics Experiment Station Research Bulletin: Ames, IO, USA, 1955. [Google Scholar]
- Kyveryga, P.; Blackmer, T.M.; Morris, T.F. Disaggregating Model Bias and Variability When Calculating Economic Optimum Rates of Nitrogen Fertilization for Corn. Agron. J. 2007, 99, 1048–1056. [Google Scholar] [CrossRef]
- Nelson, L.A.; Anderson, R.L. Partitioning of soil test-crop response probability. In Soil Testing: Correlating and Interpreting the Analytical Results; Stelly, M., Ed.; American Society of Agronomy: Madison, WI, USA, 1984; pp. 19–28. [Google Scholar]
- Kyveryga, P.; Blackmer, T.M.; Morris, T.F. Alternative Benchmarks for Economically Optimal Rates of Nitrogen Fertilization for Corn. Agron. J. 2007, 99, 1057–1065. [Google Scholar] [CrossRef]
- Kyveryga, P.; Caragea, P.C.; Kaiser, M.S.; Blackmer, T.M. Predicting Risk of Reducing Nitrogen Fertilization Using Hierarchical Models and On-Farm Data. Agron. J. 2013, 105, 85–94. [Google Scholar] [CrossRef]
- Mestre, L.; Reig, G.; Bertrán, J.A.; Moreno, M.A. Influence of Plum Rootstocks on Agronomic Performance, Leaf Mineral Nutrition and Fruit Quality of ‘Catherina’ Peach Cultivar in Heavy Calcareous Soil Conditions. Span. J. Agric. Res. 2017, 15, e0901. [Google Scholar] [CrossRef]
- Jimenez, I.M.; Mayer, N.A.; dos Santos Dias, C.T.; Scarpare Filho, J.A.; da Silva, S.R. Influence of Clonal Rootstocks on Leaf Nutrient Content, Vigor and Productivity of Young ‘Sunraycer’ Nectarine Trees. Sci. Hortic. 2018, 235, 279–285. [Google Scholar] [CrossRef]
- Mayer, A.N.; Ueno, B.; da Silva, V.A.L. Teores de nutrientes foliares de pessegueiro em cinco porta-enxertos. Rev. Bras. Frutic. 2015, 37, 1045–1052. [Google Scholar] [CrossRef]
- Galarça, S.P.; Lima, C.S.M.; Fachinello, J.C.; Pretto, A.; Vahl, L.C.; Betemps, D.L. Influence of Several Rootstocks on Foliar Nutrition in Peach. Acta Hortic. 2015, 1084, 75–84. [Google Scholar] [CrossRef]
- Taylor, B.K.; van den Ende, B. The Nitrogen Nutrition of the Peach Tree. IV. Storage and Mobilization of Nitrogen in Mature Trees. Aust. J. Agric. Res. 1969, 20, 869–881. [Google Scholar] [CrossRef]
- Cruz, A.F.; de Almeida, G.M.; Wadt, P.G.S.; de Carvalho Pires, M.; Ramos, M.L.G. Seasonal Variation of Plant Mineral Nutrition in Fruit Trees. Braz. Arch. Biol. Technol. 2019, 62, e19180340. [Google Scholar] [CrossRef]
- Meyer-Aurich, A.; Weersink, A.; Gandorfer, M.; Wagner, P. Optimal Site-Specific Fertilization and Harvesting Strategies with Respect to Crop Yield and Quality Response to Nitrogen. Agric. Syst. 2010, 103, 478–485. [Google Scholar] [CrossRef]
- Pellerin, A.; Parent, L.E.; Fortin, J.; Tremblay, C.; Khiari, L.; Giroux, M. Environmental Mehlich-III Soil Phosphorus Saturation Indices for Quebec Acid to near Neutral Mineral Soils Varying in Texture and Genesis. Can. J. Soil Sci. 2006, 86, 711–723. [Google Scholar] [CrossRef]
- Gemtos, T.; Fountas, S.; Tagarakis, A.; Liakos, V. Precision Agriculture Application in Fruit Crops: Experience in Hand-Picked Fruits. Procedia Technol. 2013, 8, 324–332. [Google Scholar] [CrossRef]
- Molin, J.P.; Colaço, A.F.; Carlo, E.F.; de Mattos, D., Jr. Mapping Yield, Soil Fertility and Tree Gaps in an Orange Orchard. Rev. Bras. Frutic. 2012, 34, 1256–1265. [Google Scholar] [CrossRef]
- Appenfeller, L.R.; Lloyd, S.; Szendrei, Z. Citizen Science Improves Our Understanding of the Impact of Soil Management on Wild Pollinator Abundance in Agroecosystems. PLoS ONE 2020, 15, e0230007. [Google Scholar] [CrossRef]
- Gibson, K.J.; Streich, M.K.; Topping, T.S.; Stunz, G.W. Utility of Citizen Science Data: A Case Study in Land-Based Shark Fishing. PLoS ONE 2019, 14, e0226782. [Google Scholar] [CrossRef]
- Tremblay, N.; Bouroubi, Y.M.; Bélec, C.; Mullen, R.W.; Kitchen, N.R.; Thomason, W.E.; Ebelhar, S.; Mengel, D.B.; Raun, W.R.; Francis, D.D.; et al. Corn Response to Nitrogen Is Influenced by Soil Texture and Weather. Agron. J. 2012, 104, 1658–1671. [Google Scholar] [CrossRef]
- Gallardo, R.K.; Grant, K.; Brown, D.J.; McFerson, J.R.; Lewis, K.M.; Einshorn, T.; Sazo, M.M. Perceptions of Precision Agriculture Technologies in the U.S. Fresh Apple Industry. HortTechnology 2019, 29, 151–162. [Google Scholar] [CrossRef]
- Morris, T.F.; Murrell, T.S.; Beegle, D.B.; Camberato, J.J.; Ferguson, R.B.; Grove, J.; Ketterings, Q.; Kyveryga, P.M.; Laboski, C.A.; McGrath, J.M.; et al. Strengths and Limitations of Nitrogen Rate Recommendations for Corn and Opportunities for Improvement. Agron. J. 2018, 110, 1–37. [Google Scholar] [CrossRef]
- Parent, S.É.; Dossou-Yovo, W.; Ziadi, N.; Tremblay, G.; Pellerin, A.; Parent, L.E. Corn Response to Banded P Fertilizers with or without Manure Application in Eastern Canada. Agron. J. 2020. [Google Scholar] [CrossRef]
- Abdi, D. Predicting Soil Phosphorous and Other Properties Using near Infrared Spectroscopy. Soil Sci. Soc. Am. J. 2012, 76, 2318–2326. [Google Scholar] [CrossRef]
- Ge, Y.; Thomasson, J.A.; Sui, R. Remote Sensing of Soil Properties in Precision Agriculture: A Review. Front. Earth Sci. 2011, 5, 229–238. [Google Scholar] [CrossRef]
- Nduwamungu, C.; Ziadi, N.; Parent, L.E.; Tremblay, G.F.; Thuriès, L. Opportunities for, and Limitations of, near Infrared Reflectance Spectroscopy Applications in Soil Analysis: A Review. Can. J. Soil Sci. 2009, 89, 531–541. [Google Scholar] [CrossRef]
- Salt, D.E.; Baxter, I.; Lahner, B. Ionomics and the Study of the Plant Ionome. Annu. Rev. Plant Biol. 2008, 59, 709–733. [Google Scholar] [CrossRef]
- Villas-Boas, P.; Franco, M.A.; Martin-Neto, L.; Gollany, H.T.; Milori, B.M.D.P. Applications of Laser-induced Breakdown Spectroscopy for Soil Characterization, Part II: Review of Elemental Analysis and Soil Classification. Eur. J. Soil Sci. 2019. [Google Scholar] [CrossRef]


| Ilr | N | P | K | Mg | Ca | Cu | Zn | Mn | Fe | Fv | r | s |
|---|---|---|---|---|---|---|---|---|---|---|---|---|
| 1 | 1 | −1 | 0 | 0 | 0 | 0 | 0 | 0 | 0 | 0 | 1 | 1 |
| 2 | 0 | 0 | 1 | −1 | 0 | 0 | 0 | 0 | 0 | 0 | 1 | 1 |
| 3 | 1 | 1 | −1 | −1 | 0 | 0 | 0 | 0 | 0 | 0 | 2 | 2 |
| 4 | 1 | 1 | 1 | 1 | −1 | −1 | −1 | −1 | −1 | 0 | 4 | 5 |
| 5 | 0 | 0 | 0 | 0 | 1 | −1 | −1 | −1 | −1 | 0 | 1 | 4 |
| 6 | 0 | 0 | 0 | 0 | 0 | 1 | −1 | 0 | 0 | 0 | 1 | 1 |
| 7 | 0 | 0 | 0 | 0 | 0 | 0 | 0 | 1 | −1 | 0 | 1 | 1 |
| 8 | 0 | 0 | 0 | 0 | 0 | 1 | 1 | −1 | −1 | 0 | 2 | 2 |
| 9 | 1 | 1 | 1 | 1 | 1 | 1 | 1 | 1 | 1 | −1 | 9 | 1 |
| Unit | Minimum | Median | Maximum | |
|---|---|---|---|---|
| Bento Gonçalves | ||||
| Mean annual air temperature | °C | 12.95 | 17.15 | 22.30 |
| Mean annual precipitations | mm | 1401 | 1810 | 2043 |
| Average number of chilling hours < 7.2 °C | °C | 263 | 360 | 435 |
| Fruit yield | Mg ha−1 | 0.2 | 7.1 | 30.4 |
| Pelotas | ||||
| Mean annual air temperature | °C | 14.40 | 17.90 | 23.68 |
| Mean annual precipitations | mm | 1096 | 1398 | 1833 |
| Average number of chilling hours < 7.2 °C | °C | 173 | 350 | 440 |
| Fruit yield | Mg ha−1 | 0.5 | 14.1 | 38.8 |
| Eldorado do Sul | ||||
| Mean annual air temperature | °C | 12.77 | 18.28 | 24.75 |
| Mean annual precipitations | mm | 1333 | 1530 | 2011 |
| Average number of chilling hours < 7.2 °C† | °C | 282 | 376 | 469 |
| Fruit yield | Mg ha−1 | 0.4 | 5.0 | 10.1 |
| Minimum | Median | Maximum | |
|---|---|---|---|
| % | |||
| Clay | 14 | 17 | 25 |
| Organic matter | 1.0 | 1.8 | 3.9 |
| Base saturation | 36 | 48 | 78 |
| cmolc dm−3 | |||
| Cation exchange capacity | 4 | 11 | 16 |
| Sum of bases | 23 | 73 | 92 |
| mg dm−3 | |||
| K | 44 | 128 | 330 |
| Ca | 160 | 1400 | 2000 |
| Mg | 48 | 108 | 648 |
| Na | 3 | 10 | 33 |
| P | 2 | 27 | 84 |
| Cu | 4.5 | 6.3 | 30.1 |
| Zn | 1.8 | 5.7 | 16.7 |
| Mn | 14 | 17 | 48 |
| Fe | 1000 | 2000 | 5000 |
| Minimum | Median | Maximum | Minimum | Median | Maximum | Minimum | Median | Maximum | Minimum | Median | Maximum | |
|---|---|---|---|---|---|---|---|---|---|---|---|---|
| g kg−1 | g kg−1 | g kg−1 | g kg−1 | |||||||||
| Maciel | Chimarrita | Chiripá | Eragil | |||||||||
| N | 10.60 | 29.25 | 39.04 | 19.26 | 27.55 | 41.32 | 14.36 | 21.80 | 29.24 | 18.04 | 22.02 | 27.40 |
| P | 1.20 | 2.26 | 3.40 | 1.36 | 2.16 | 2.57 | 1.92 | 2.58 | 3.99 | 1.99 | 2.62 | 3.16 |
| K | 1.94 | 22.5 | 37.18 | 14.58 | 22.5 | 38.45 | 12.92 | 19.45 | 29.25 | 13.14 | 25.80 | 34.97 |
| Ca | 9.43 | 17.25 | 32.88 | 8.07 | 16.95 | 31.10 | 11.42 | 26.65 | 43.90 | 9.70 | 25.11 | 33.60 |
| Mg | 2.00 | 4.86 | 8.20 | 2.00 | 3.92 | 7.45 | 3.57 | 5.72 | 9.16 | 2.61 | 5.26 | 6.85 |
| Cu | 0.001 | 0.005 | 0.011 | 0.001 | 0.005 | 0.020 | 0.007 | 0.010 | 0.061 | 0.008 | 0.011 | 0.032 |
| Zn | 0.003 | 0.017 | 0.036 | 0.013 | 0.025 | 0.050 | 0.025 | 0.047 | 0.148 | 0.030 | 0.078 | 0.352 |
| Mn | 0.023 | 0.081 | 0.262 | 0.050 | 0.100 | 0.200 | 0.012 | 0.176 | 0.535 | 0.060 | 0.195 | 0.482 |
| Fe | 0.043 | 0.097 | 0.190 | 0.023 | 0.144 | 0.570 | 0.045 | 0.074 | 0.139 | 0.049 | 0.077 | 0.112 |
| Pialo | Delanona | Fascínio | Kampai | |||||||||
| N | 21.54 | 24.73 | 26.96 | 20.66 | 22.59 | 24.43 | 20.31 | 21.63 | 22.33 | 18.04 | 19.83 | 21.89 |
| P | 2.25 | 2.42 | 2.73 | 2.04 | 2.18 | 2.53 | 2.16 | 2.33 | 2.59 | 2.64 | 2.75 | 3.11 |
| K | 11.48 | 14.91 | 21.69 | 13.28 | 14.24 | 16.03 | 16.11 | 17.62 | 19.06 | 13.78 | 15.89 | 17.76 |
| Ca | 11.18 | 15.64 | 19.09 | 21.04 | 24.13 | 27.32 | 12.67 | 16.85 | 18.08 | 13.43 | 24.12 | 27.97 |
| Mg | 3.48 | 4.33 | 5.27 | 5.08 | 5.42 | 6.43 | 3.77 | 4.43 | 4.63 | 3.96 | 5.22 | 5.62 |
| Cu | 0.008 | 0.009 | 0.011 | 0.069 | 0.080 | 0.103 | 0.012 | 0.014 | 0.018 | 0.010 | 0.010 | 0.011 |
| Zn | 0.032 | 0.038 | 0.048 | 0.145 | 0.192 | 0.215 | 0.018 | 0.020 | 0.026 | 0.045 | 0.054 | 0.066 |
| Mn | 0.179 | 0.244 | 0.272 | 0.428 | 0.538 | 0.627 | 0.095 | 0.102 | 0.136 | 0.127 | 0.154 | 0.171 |
| Fe | 0.058 | 0.073 | 0.082 | 0.064 | 0.075 | 0.094 | 0.101 | 0.113 | 0.134 | 0.058 | 0.063 | 0.083 |
| PS10711 | PS-Tardia | São Barbosa | General | |||||||||
| N | 23.73 | 25.96 | 27.14 | 20.23 | 21.71 | 22.94 | 21.89 | 23.77 | 24.16 | 10.6 | 26.11 | 41.32 |
| P | 2.29 | 2.80 | 3.08 | 2.03 | 2.10 | 2.24 | 2.13 | 2.17 | 2.22 | 1.20 | 2.30 | 3.99 |
| K | 13.81 | 14.99 | 16.62 | 18.24 | 20.71 | 21.63 | 12.98 | 18.80 | 20.27 | 19.40 | 21.90 | 38.45 |
| Ca | 13.63 | 18.13 | 20.52 | 32.95 | 35.27 | 40.58 | 26.13 | 31.06 | 40.11 | 8.07 | 18.42 | 43.90 |
| Mg | 4.57 | 6.40 | 7.33 | 5.08 | 5.36 | 6.63 | 5.35 | 6.34 | 7.52 | 2.00 | 4.85 | 9.16 |
| Cu | 0.009 | 0.010 | 0.012 | 0.013 | 0.015 | 0.016 | 0.009 | 0.009 | 0.010 | 0.001 | 0.006 | 0.103 |
| Zn | 0.047 | 0.054 | 0.064 | 0.110 | 0.141 | 0.183 | 0.045 | 0.058 | 0.079 | 0.003 | 0.026 | 0.352 |
| Mn | 0.186 | 0.224 | 0.247 | 0.321 | 0.428 | 0.492 | 0.134 | 0.256 | 0.394 | 0.012 | 0.130 | 0.627 |
| Fe | 0.072 | 0.118 | 0.224 | 0.074 | 0.082 | 0.112 | 0.068 | 0.084 | 0.099 | 0.043 | 0.092 | 0.204 |
| Expression | Testing Data (30% of the Data) | Cross-Validation (100% of the Data) | ||
|---|---|---|---|---|
| Area under Curve | Classification Accuracy | Area under Curve | Classification Accuracy | |
| Raw concentration data | 0.844 | 0.801 | 0.894 | 0.826 |
| Centered log ratios | 0.834 | 0.794 | 0.901 | 0.835 |
| Isometric log ratios | 0.844 | 0.794 | 0.901 | 0.836 |
| Nutrient | State Standards (Brunetto et al [26]) | True Negative Specimens | Centered Log Ratio | ||||||
|---|---|---|---|---|---|---|---|---|---|
| g kg−1 | Unitless | ||||||||
| Insufficient | Normal | Excessive | Minimum | Median | Maximum | Minimum | Median | Maximum | |
| N | <20.0 | 33.0–45.0 | >60.0 | 16.5 | 27.4 | 39.0 | 0.344 | 0.965 | 1.422 |
| P | <0.5 | 1.5–3.0 | >4.0 | 1.2 | 2.5 | 3.4 | −1.804 | −1.337 | −1.171 |
| K | <5.0 | 14.0–20.0 | >28.0 | 11.5 | 23.1 | 35.0 | 0.063 | 0.755 | 1.144 |
| Mg | <2.0 | 5.0–8.0 | >12.0 | 2.1 | 4.7 | 8.3 | −1.511 | −0.804 | −0.393 |
| Ca | <6.5 | 17.0–26.0 | >36.0 | 11.2 | 19.1 | 35.0 | 0.236 | 0.590 | 1.270 |
| mg kg−1 | |||||||||
| Cu | ? | 6–30 | >50 | 2 | 6 | 18 | −2.112 | −1.671 | −1.209 |
| Fe | <50 | 100–230 | >330 | 53 | 83 | 148 | −1.122 | −0.346 | 0.430 |
| Zn | <10 | 24–37 | >50 | 4 | 31 | 84 | 0.404 | 1.245 | 1.874 |
| Mn | <20 | 30–160 | >400 | 38 | 139 | 422 | −0.281 | 0.637 | 2.087 |
| B | <3 | 30–60 | >90 | - | - | - | - | - | - |
| Balance | P|N | Mg|K | K,Mg|N,P | Ca|N,P,K,Mg |
|---|---|---|---|---|
| Mean | ||||
| 1.692 | 1.081 | −0.202 | −0.702 | |
| Covariance matrix | ||||
| P|N | 0.04991 | 0.04247 | 0.01101 | 0.03489 |
| Mg|K | 0.04247 | 0.10014 | 0.02391 | 0.04505 |
| K,Mg|N,P | 0.01101 | 0.02391 | 0.03912 | 0.03483 |
| Ca|N,P,K,Mg | 0.03489 | 0.04505 | 0.03483 | 0.06803 |
| Reference Values | Concentration Values (g kg−1) | Centered Log Ratios (Unitless) | Fruit Yield | ||||||||
|---|---|---|---|---|---|---|---|---|---|---|---|
| N | P | K | Mg | Ca | clr_N | clr_P | clr_K | clr_Mg | clr_Ca | Mg kg−1 | |
| State “normal” concentrations (Rio Grande do Sul) | |||||||||||
| Median value † | 39.0 | 2.3 | 17.0 | 6.5 | 21.5 | 1.214 | −1.639 | 0.384 | −0.578 | 0.619 | - |
| Q1_Q3 † | 36.0 | 2.6 | 15.5 | 7.3 | 19.3 | 1.138 | −1.481 | 0.295 | −0.465 | 0.512 | - |
| Bento Gonçalves—RS (Nordeste Rio-Grandense) | |||||||||||
| Defective trees | 23.2 | 1.7 | 18.3 | 4.7 | 26.2 | 0.873 | −1.772 | 0.635 | −0.731 | 0.995 | 8.9 |
| Closest successful neighbors | 25.0 | 1.7 | 25.3 | 3.5 | 26.8 | 0.917 | −1.773 | 0.926 | −1.056 | 0.986 | 30.4 |
| Pelotas—RS (Sudeste Rio-Grandense) | |||||||||||
| Defective trees | 31.4 | 2.8 | 18.9 | 3.9 | 11.7 | 1.200 | −1.218 | 0.692 | −0.886 | 0.212 | 0.4 |
| Closest successful neighbors | 33.4 | 3.2 | 23.2 | 4.5 | 13.8 | 1.120 | −1.226 | 0.755 | −0.885 | 0.236 | 21.5 |
© 2020 by the authors. Licensee MDPI, Basel, Switzerland. This article is an open access article distributed under the terms and conditions of the Creative Commons Attribution (CC BY) license (http://creativecommons.org/licenses/by/4.0/).
Share and Cite
Leitzke Betemps, D.; Vahl de Paula, B.; Parent, S.-É.; Galarça, S.P.; Mayer, N.A.; Marodin, G.A.B.; Rozane, D.E.; Natale, W.; Melo, G.W.B.; Parent, L.E.; et al. Humboldtian Diagnosis of Peach Tree (Prunus persica) Nutrition Using Machine-Learning and Compositional Methods. Agronomy 2020, 10, 900. https://doi.org/10.3390/agronomy10060900
Leitzke Betemps D, Vahl de Paula B, Parent S-É, Galarça SP, Mayer NA, Marodin GAB, Rozane DE, Natale W, Melo GWB, Parent LE, et al. Humboldtian Diagnosis of Peach Tree (Prunus persica) Nutrition Using Machine-Learning and Compositional Methods. Agronomy. 2020; 10(6):900. https://doi.org/10.3390/agronomy10060900
Chicago/Turabian StyleLeitzke Betemps, Debora, Betania Vahl de Paula, Serge-Étienne Parent, Simone P. Galarça, Newton A. Mayer, Gilmar A.B. Marodin, Danilo E. Rozane, William Natale, George Wellington B. Melo, Léon E. Parent, and et al. 2020. "Humboldtian Diagnosis of Peach Tree (Prunus persica) Nutrition Using Machine-Learning and Compositional Methods" Agronomy 10, no. 6: 900. https://doi.org/10.3390/agronomy10060900
APA StyleLeitzke Betemps, D., Vahl de Paula, B., Parent, S.-É., Galarça, S. P., Mayer, N. A., Marodin, G. A. B., Rozane, D. E., Natale, W., Melo, G. W. B., Parent, L. E., & Brunetto, G. (2020). Humboldtian Diagnosis of Peach Tree (Prunus persica) Nutrition Using Machine-Learning and Compositional Methods. Agronomy, 10(6), 900. https://doi.org/10.3390/agronomy10060900