Article

Optimization of Irrigation Scheduling for Maize in an Arid Oasis Based on Simulation–Optimization Model

1
College of Agricultural Science and Engineering, Hohai University, Nanjing 210098, China
2
College of Mechanical and Electronic Engineering, Nanjing Forestry University, Nanjing 210037, China
3
College of Water Resources and Civil Engineering, China Agricultural University, Beijing 100083, China
4
State Key Laboratory of Hydroscience and Engineering, Tsinghua University, Beijing 100084, China
5
Key Laboratory of Hydrology-Water Resources and Hydraulic Engineering, Hohai University, Nanjing 210098, China
6
Collaborative Innovation Center for Water Security and Water Science, Hohai University, Nanjing 210098, China
*
Author to whom correspondence should be addressed.
Agronomy 2020, 10(7), 935; https://doi.org/10.3390/agronomy10070935
Submission received: 25 May 2020 / Revised: 11 June 2020 / Accepted: 25 June 2020 / Published: 29 June 2020
(This article belongs to the Section Crop Breeding and Genetics)

Abstract

:
In arid regions, irrigation scheduling optimization is efficient in coping with the shortage of agricultural water resources. This paper developed a simulation–optimization model for irrigation scheduling optimization for the main crop in an arid oasis, aiming to maximize crop yield and minimize crop water consumption. The model integrated the soil water balance simulation model and the optimization model for crop irrigation scheduling. The simulation model was firstly calibrated and validated based on field experiment data for maize in 2012 and 2013, respectively. Then, considering the distribution of soil types and irrigation districts in the study area, the model was used to solve the optimal irrigation schedules for the scenarios of status quo and typical climate years. The results indicated that the model is applicable for reflecting the complexities of simulation–optimization for maize irrigation scheduling. The optimization results showed that the irrigation water-saving potential of the study area was between 97 mm and 240 mm, and the average annual optimal yield of maize was over 7.3 t/ha. The simulation–optimization model of irrigation schedule established in this paper can provide a technical means for the formulation of irrigation schedules to ensure yield optimization and water productivity or water saving.

1. Introduction

Agriculture is the biggest consumer of the world’s water resources by far, as irrigated agriculture uses about 70% of the world’s freshwater withdrawals [1,2]. This amount is already insufficient to fulfil actual irrigation needs and is expected to decrease in the next few years due to the intensifying competition with other users, especially in arid and semi-arid regions.
In the arid land of northwest China, agricultural water consumption accounts for approximately 90% of the total water use [3]; however, the average available of water is only 5.8% of the average level in China. The second largest inland river basin of China, the Heihe River Basin, located in the arid zones of northwest China, is the main food production zone, producing a quarter of Chinese corn seed. Agricultural water use in the middle-reaches accounts for 96% of the total water use, with 86% of the irrigation water coming from Heihe River [4,5]. The amount of water diverted from Heihe River to the middle-reaches should be reduced by one third since the year 2001 with the implementation of the Water Diversion Plan, since severe ecological problems downstream were caused by water scarcity [6]. Thus, effective irrigation water management, such as irrigation scheduling optimization, will be very helpful in coping with the shortage of agricultural water resources in those regions [7,8].
Generally, the impacts of different irrigation strategies can be understood by using agro-hydrological simulation models. Simulation models can vividly describe the dynamics of crop growth and soil water balance under various irrigation schedules and meteorological factors. After proper calibration and validation, these simulation models can be adopted to do scenario analysis for searching preferable management strategies. For example, AquaCrop, SWAP, the soil water balance simulation model, Hydrus, etc., are popular simulation models used to simulate farmland crop growth or water consumption/supply [9,10,11,12]. Such simulation models are good at quantitatively describing the effects of various irrigation water management strategies on the hydrological processes in farmland. However, they could only be used to answer the “What if?” question [13]. This means that the better irrigation water management strategy is based on scenario analysis of several user-defined alternative scenarios. In scenario simulation, a number of pre-specified water management strategies are firstly evaluated by comparing the simulation results. Then, the strategy with better results is recommended. The recommended strategy is generally the best one among the chosen options, but it is unlikely to be the globally optimal one [14]. To get a truly global optimum, optimization methods must be combined with simulation models to derive optimal irrigation strategies [13,15].
Aside from simulation modeling, optimization methods are another effective way to solve the problems of irrigation water management [16]. Optimization methods describe and generalize the irrigation system by establishing a series of mathematical equations, and using optimization solution technology to get the optimal solution [17]. Optimization objectives, constraints, and solution methods are the three basic elements for optimization models. A multitude of optimization models for water allocation or irrigation scheduling have been developed, using such optimization techniques as linear programming, non-linear programming, and dynamic programing, etc. [18,19,20,21,22]. However, optimization models cannot reflect the process of crop growth or water movement as simulation models.
To break the limitations of both simulation modeling and optimization methods, they can be internally or externally linked together [23]. The genetic algorithm (GA) is one of the most famous artificial intelligence search methods and it has been frequently used to solve optimization problems in water management. Compared with other traditional optimization methods, GA is more likely to be used in solving the simulation–optimization model and it has been widely used in irrigation water allocation [24]. Taking into account the considerations above, the main objective of this study is to develop a simulation–optimization model of irrigation scheduling optimization for the main crop in an arid oasis, aiming to maximize crop yield and minimize crop water consumption.

2. Materials and Methods

2.1. Study Area and Data Collection

The area of interest is the middle-reaches of the Heihe River Basin with 17 irrigation districts and its geographic location is shown in Figure 1. It covers an area of 11,352 km2, 23% of which is irrigated farmland [25]. The typical crop in this region is maize, which accounts for 48% of the irrigated land [25]. The study area has a temperate arid climate with the mean annual temperature varying from 273.15 K to 278.15 K. The average annual precipitation is 136.5 mm and the average annual potential evaporation is 1154 mm [26]. The groundwater level is in the range of 1300 m to 1690 m [26]. Due to the limited precipitation, irrigation is required during the whole crop growing season (from April to October) with water diverted from either the Heihe River or pumped from the aquifer [27].
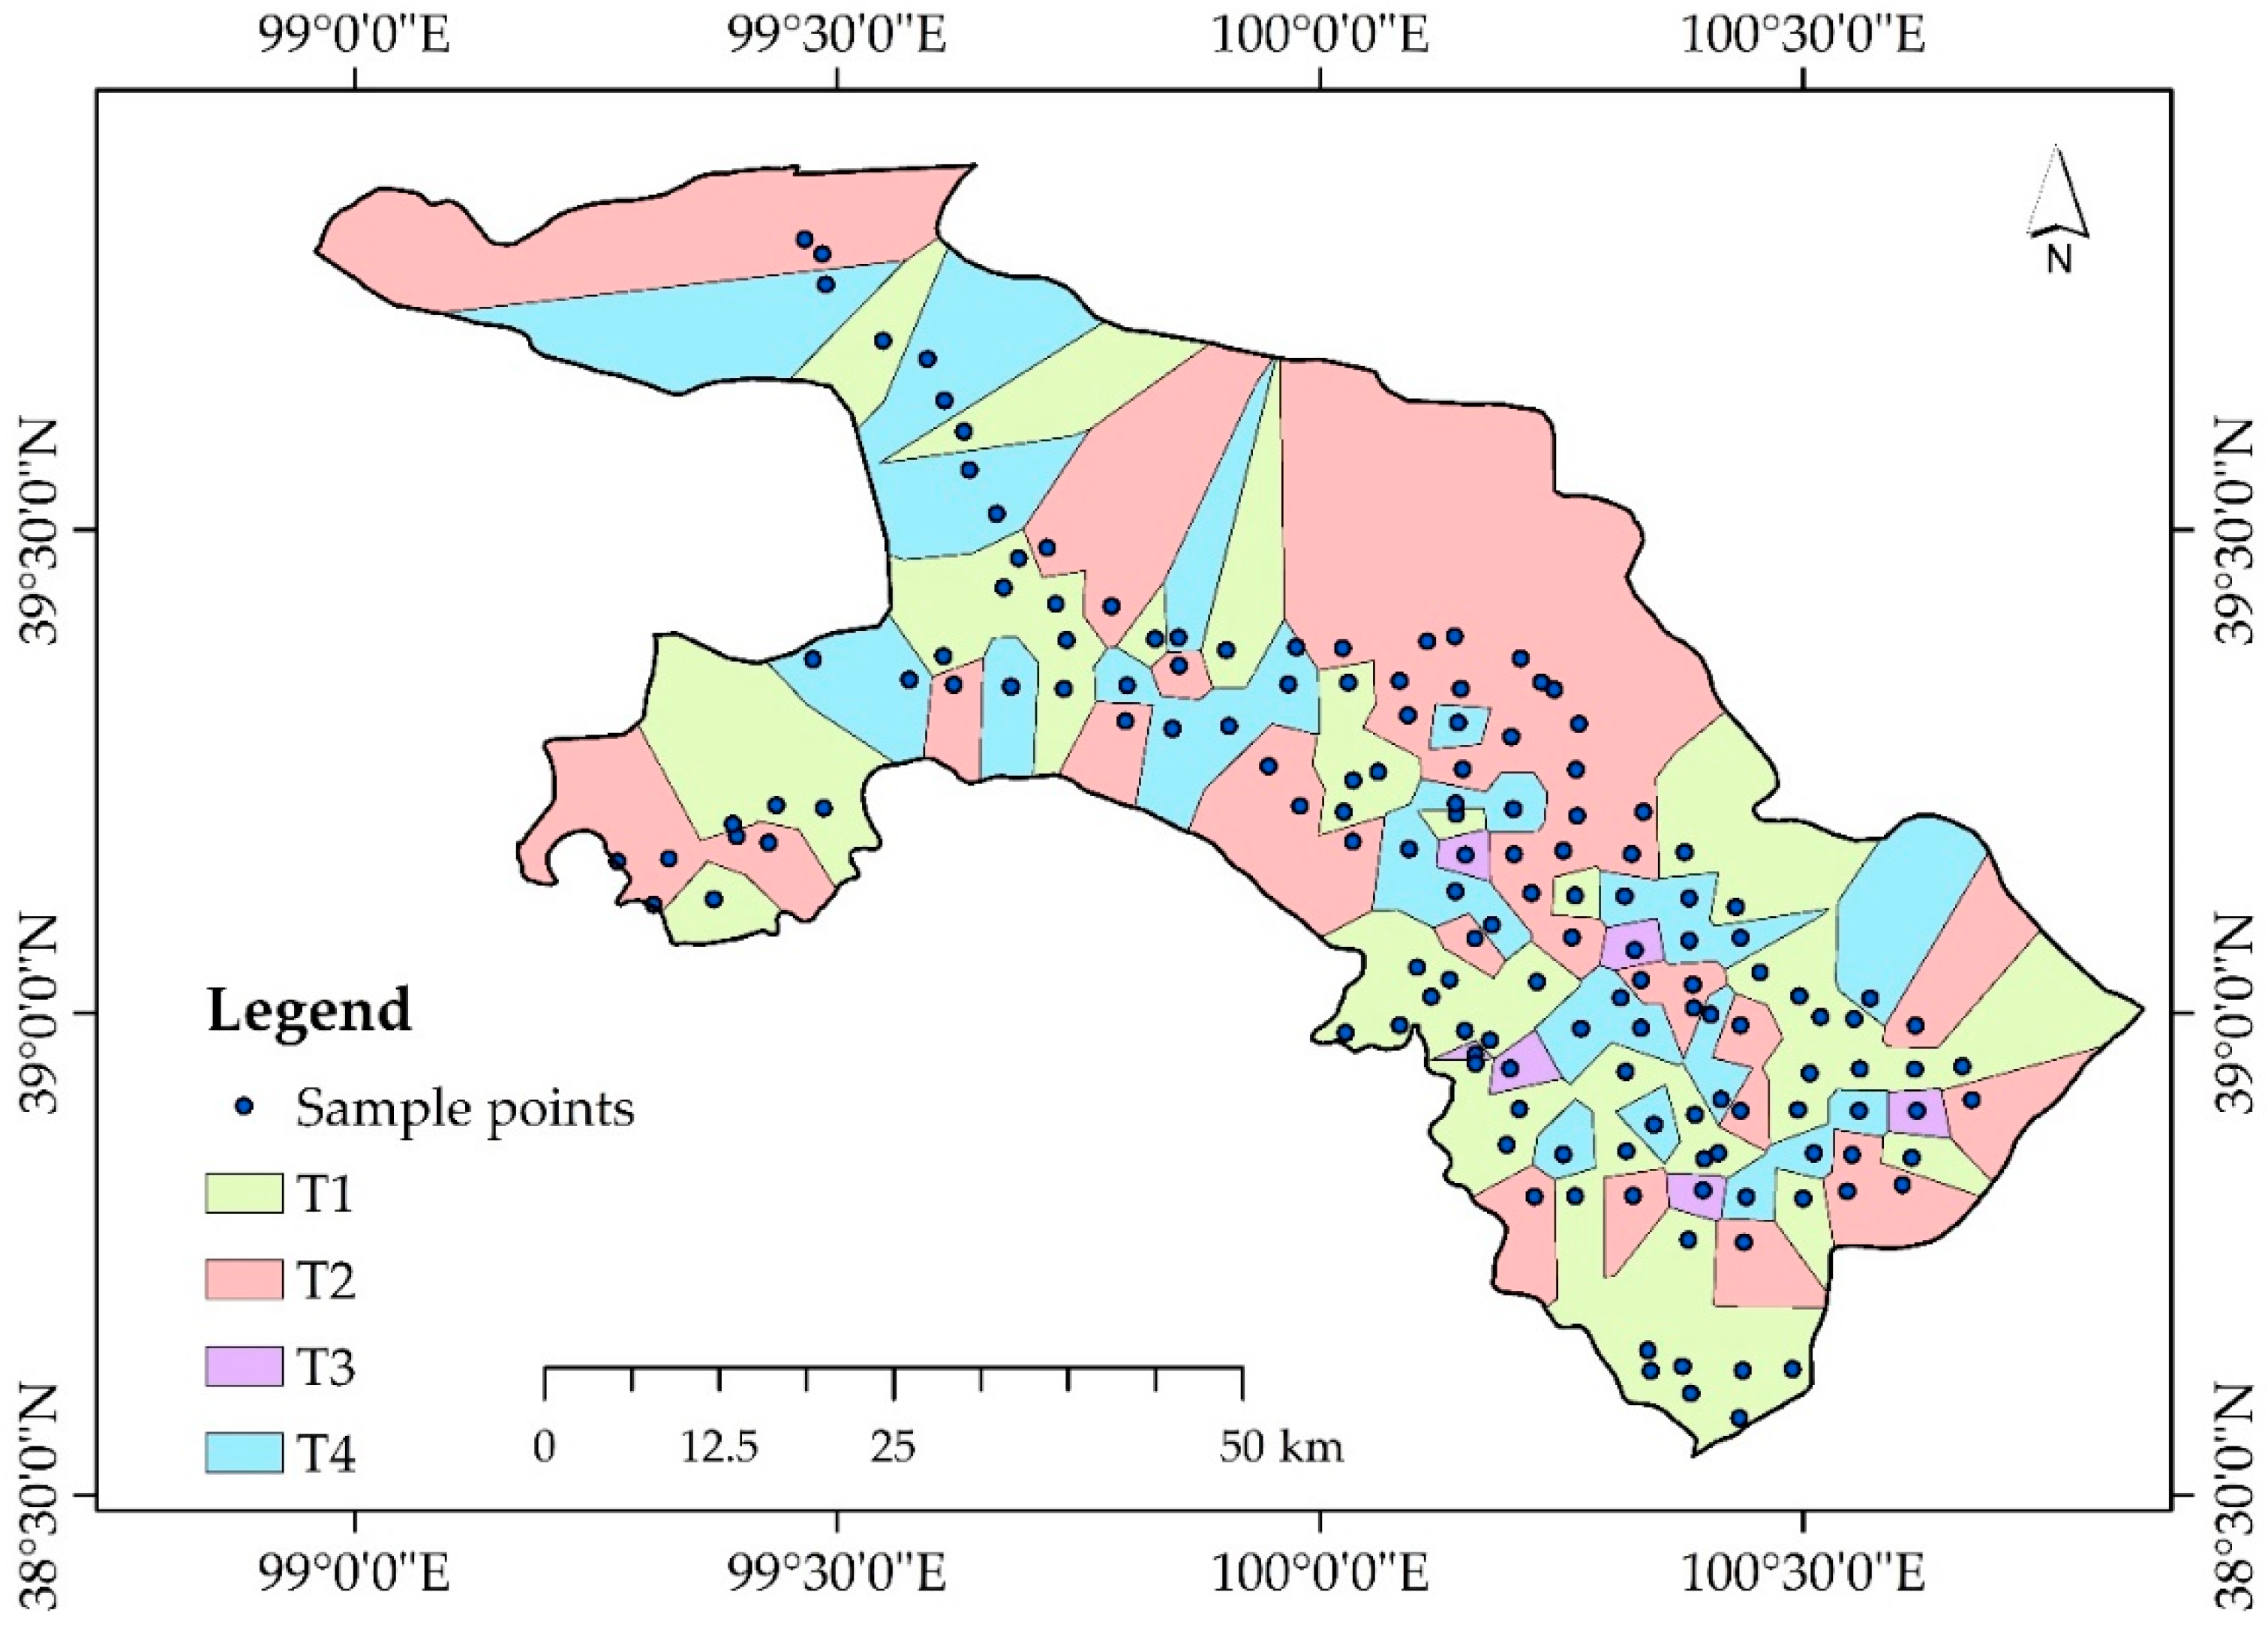
The collected data mainly contains irrigation data, soil characteristics, meteorological data and field observation data of soil moisture. Soil moisture was sampled at 20 cm intervals down to 110 cm below ground surface using the gravimetric sampling method every 10 days during the crop growing period in 2012 and 2013, with three replicates. The irrigation data for crops in different irrigation districts were collected from the Zhangye Statistics Yearbook. For details, the irrigation amounts for maize in different irrigation districts ranged from 360 mm to 1184 mm during 2001 to 2010. The classification map of soil textural classes was based on our survey in 2014. The sampling units for the data were about 5 km. The details of the samplings can be found in a previous study [25]. Here, we used the main soil types in the farmland, and the details are shown in Figure 2 and Table 1. Meteorological data during 1963 to 2016, (i.e., precipitation, relative humidity, sunshine hours, average temperature, air temperature, and wind speed at Zhangye weather station (38°56′ E, 100°26′ N, 1482.7 m)) were obtained from the China Meteorological Data Sharing Service System (http://data.cma.cn/).

2.2. Soil Water Balance Simulation Model

Maize land is divided into various maize units according to different soil types and irrigation districts. The items of water balance in the root zone of each maize unit include the water input, output, and changes of soil water storage. The water balance equation can be described by Equation (1) [11]:
Δ W = W t + 1 W t = P t + I t E T t Q s t
where ΔW is the change of water storage in the root zone at the tth day (mm) (positive means increase), Wt+1 and Wt are the soil water storage at the beginning of the (t + 1)th and tth day (mm), Pt, It, ETt, and Qst are precipitation, irrigation depth, evapotranspiration, and water flux at the bottom of the root zone at the tth day (mm). Qst can be calculated by Equation (2) [28], with positive values referring to deep percolation from the root zone to the lower zone and negative values indicating upward recharge from the lower zone to the root zone:
Q s t = a ( W t W f ) b ( W t W c )
where Wf = θfL is the field water capacity (mm), θf is soil moisture at field capacity (m3/m3), L is the depth of root zone (mm), Wc= θcL is the critical value of water storage corresponding to zero flux at the bottom of the root zone (mm), θc is the critical rate of water storage (m3/m3), and a and b are empirical coefficients (dimensionless). Values of θf, θc, a, and b are obtained through model calibration.
The evapotranspiration ETt can be calculated by Equation (3) [29]:
E T t = K s t K c t E T 0 t
where ET0t is the reference evapotranspiration at the tth day (mm) and can be calculated by Penman–Monteith equation, recommended in Allen et al. [29]. Kct is the crop coefficient at the tth day (dimensionless), which varies with specific crop characteristics and growing stages, and is normally obtained through field experiments. The values of Kct for maize in this study are obtained according to previous research in the same study area [30]. Kst is the soil water stress coefficient at the tth day (dimensionless) and can be described by Equation (4) [31]:
{ K s t = ln ( A w t + 1 ) ln 101 A w t = θ t θ w θ f θ w
where θt is the average soil moisture (m3/m3), and θw is the wilting soil moisture (m3/m3).
In this study, normalized root mean square error (NRMSE) and the coefficient of determination (R2) were used to evaluate the performance of the simulation model. These indexes can be calculated as:
NRMSE = 100 M ave 1 N n = 1 N ( M n S n ) 2
R 2 = [ n = 1 N ( M n M ave ) ( S n S ave ) ] 2 n = 1 N ( M n M ave ) 2 n = 1 N ( S n S ave ) 2
where N is the number of the measurement points, Sn is the simulated value, Mn is the measured value, Mave and Save are the average of the measured values and the simulated values, respectively.
The performance of the simulation model was firstly calibrated based on the field experiment data for maize under various soil types in the Yingke Irrigation District in the Heihe River Basin in 2012, and then validated using the data in 2013.

2.3. Optimization Model for Irrigation Scheduling

In the optimization model for irrigation scheduling, crop yield is targeted to be maximized and crop water consumption to be minimized, with constraints of irrigation data and irrigation amount. The objective functions and constraint functions are as follows:
Objectives : { max Y = max ( α E T 2 + β E T + C ) min E T
Subject   to : { d i < d i + 1 ( i n 1 ,   i N * ) I min I i I max ( i n ,   i N * )
where Y is the crop yield (t/ha), which is calculated by the water production function (αET + βET + C). α, β, and C are the empirical parameters obtained from the previous research [32] in the same study area. For details, α = −0.0148, β = 16.99, C = 2468.67. ET is crop water consumption simulated by the soil water balance simulation model (mm). d is a vector composed by irrigation data di listed in sequence. n is the total irrigation times during the crop growing season. Ii is the irrigation depth of the ith irrigation (mm). Imin and Imax are the minimum and maximum irrigation depths (mm); minimal irrigation depth is set to be zero and maximal irrigation depth is the irrigation amount obtained from the Zhangye Statistics Yearbook for each irrigation district.
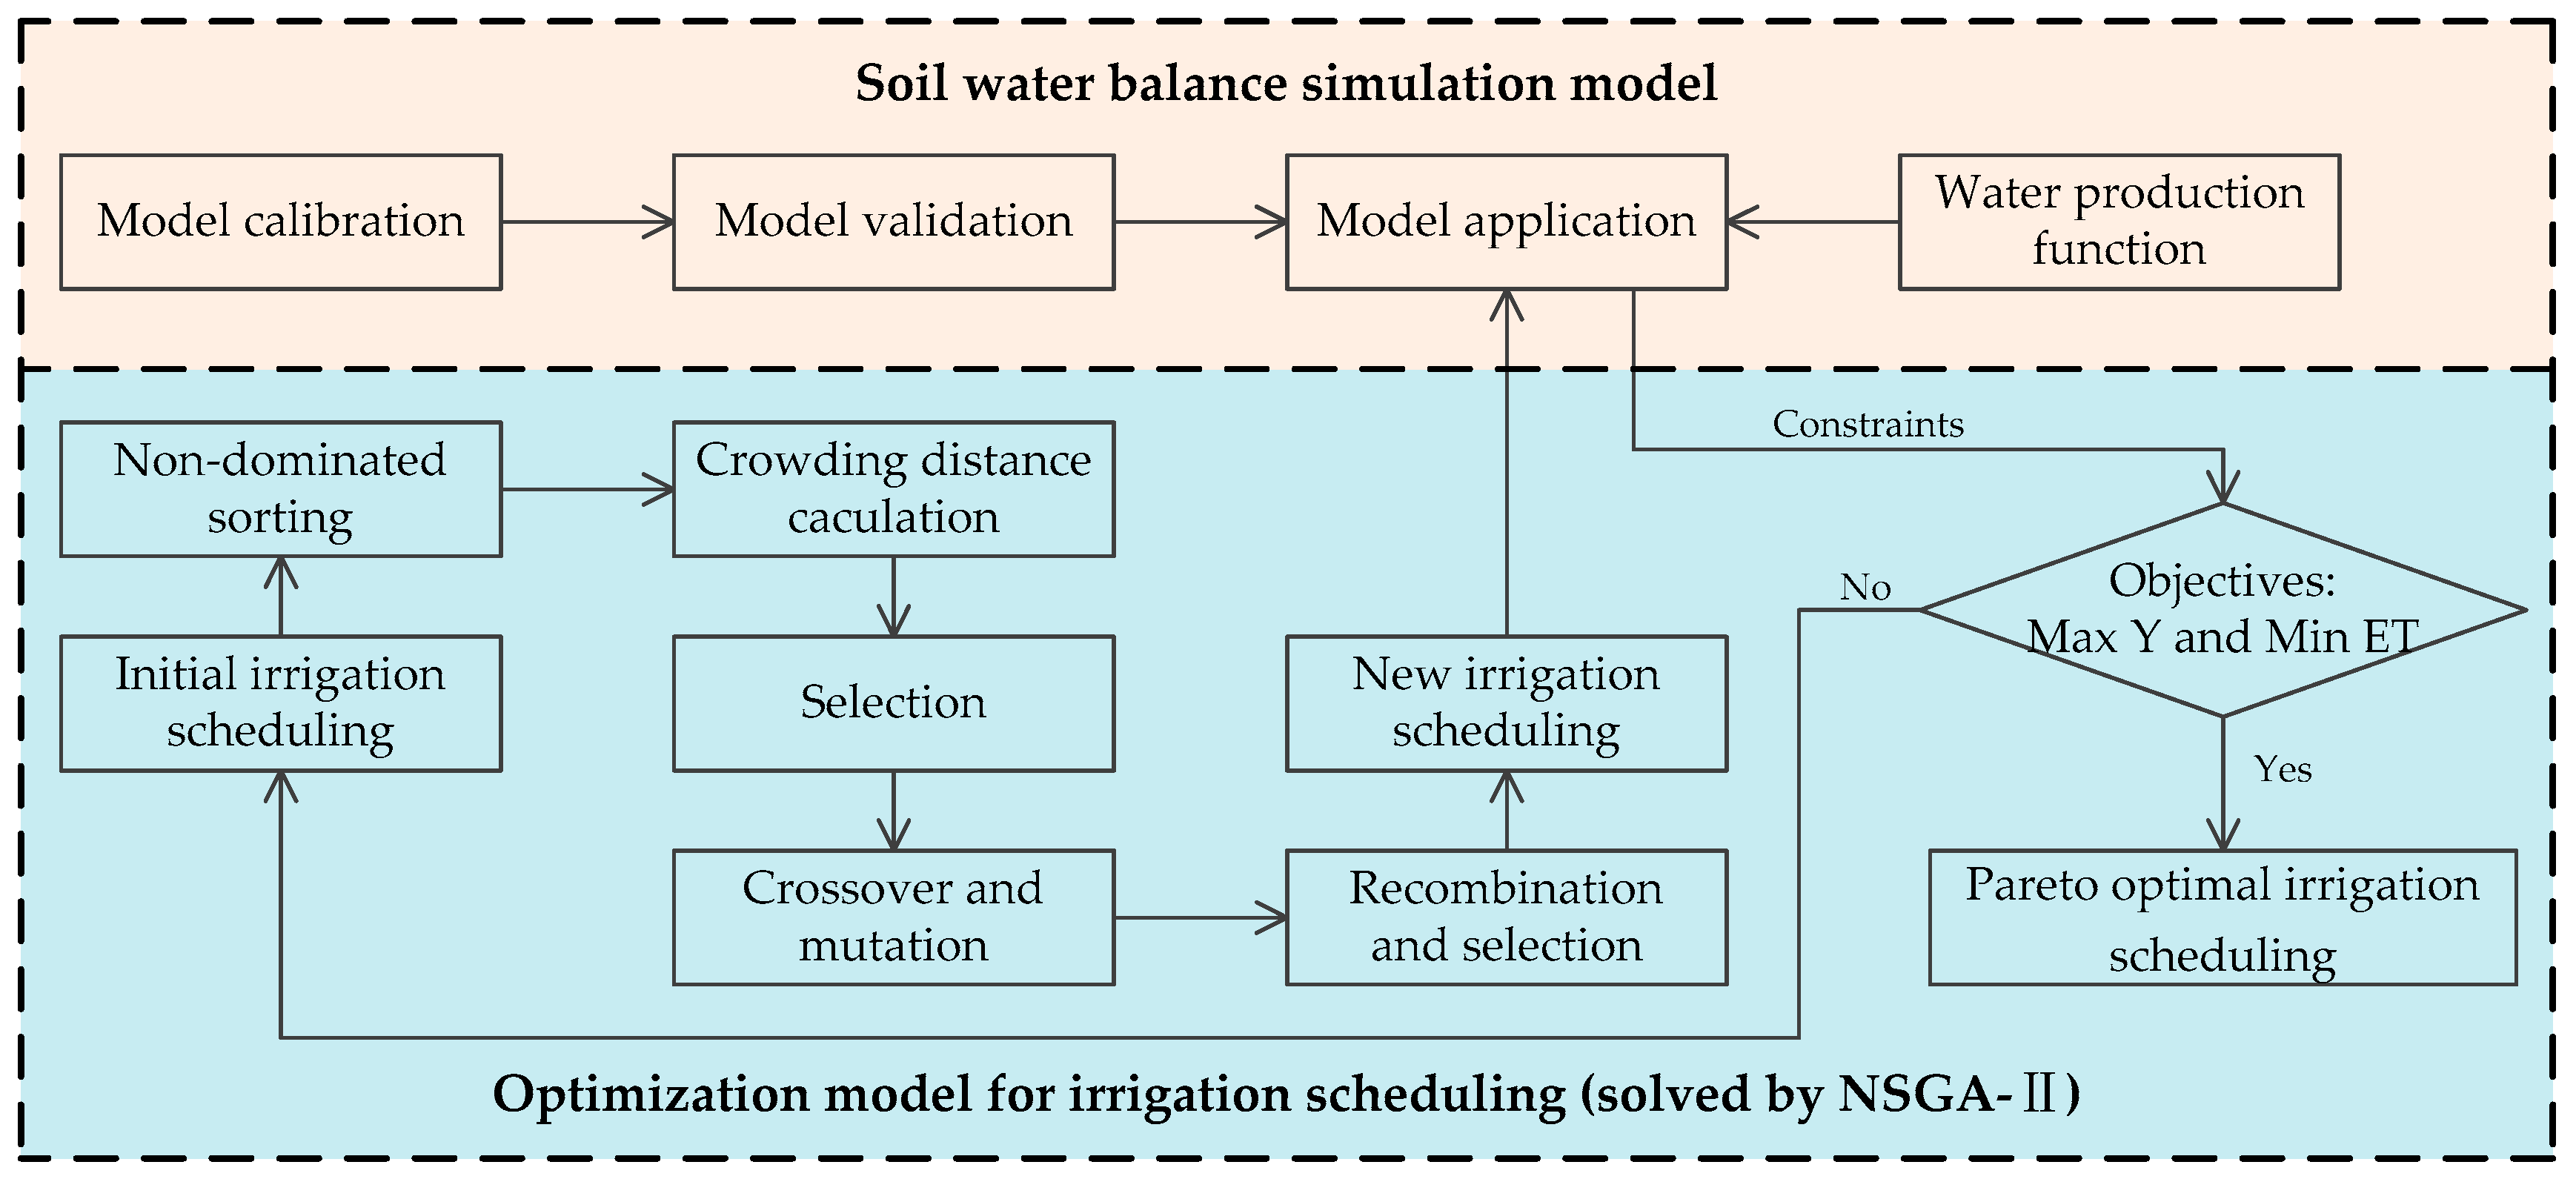
The optimal model for irrigation scheduling is solved by the improved non-dominated sorting genetic algorithm (NSGA-II) [33]. There are six steps in NSGA-II (i.e., population initialization, non-dominated sorting, crowding distance calculation, selection, crossover and mutation, and recombination and selection). In this study, the initial irrigation scheduling is generated randomly, and then the irrigation dates are sequenced to generate the initial solution with normal irrigation sequence. By using the initial solution for genetic operations, such as crossover and variation, the Pareto optimal solution set is finally obtained. In total, 50 individuals were used for 200 generations of genetic optimization in this study.

2.4. Framework of Simulation–Optimization Model

The framework of the simulation–optimization model for irrigation scheduling contains two parts (i.e., the simulation part and the optimization part), as shown in Figure 3. In the first part, the soil water balance simulation model was calibrated and validated with the experimental data of soil moisture. Then, the simulation model was combined with water production functions to simulate the items of soil water balance and calculate the crop yield for the optimization part. Finally, the optimal irrigation scheduling was solved by NSGA-II under different scenarios.

2.5. Scenario Designs

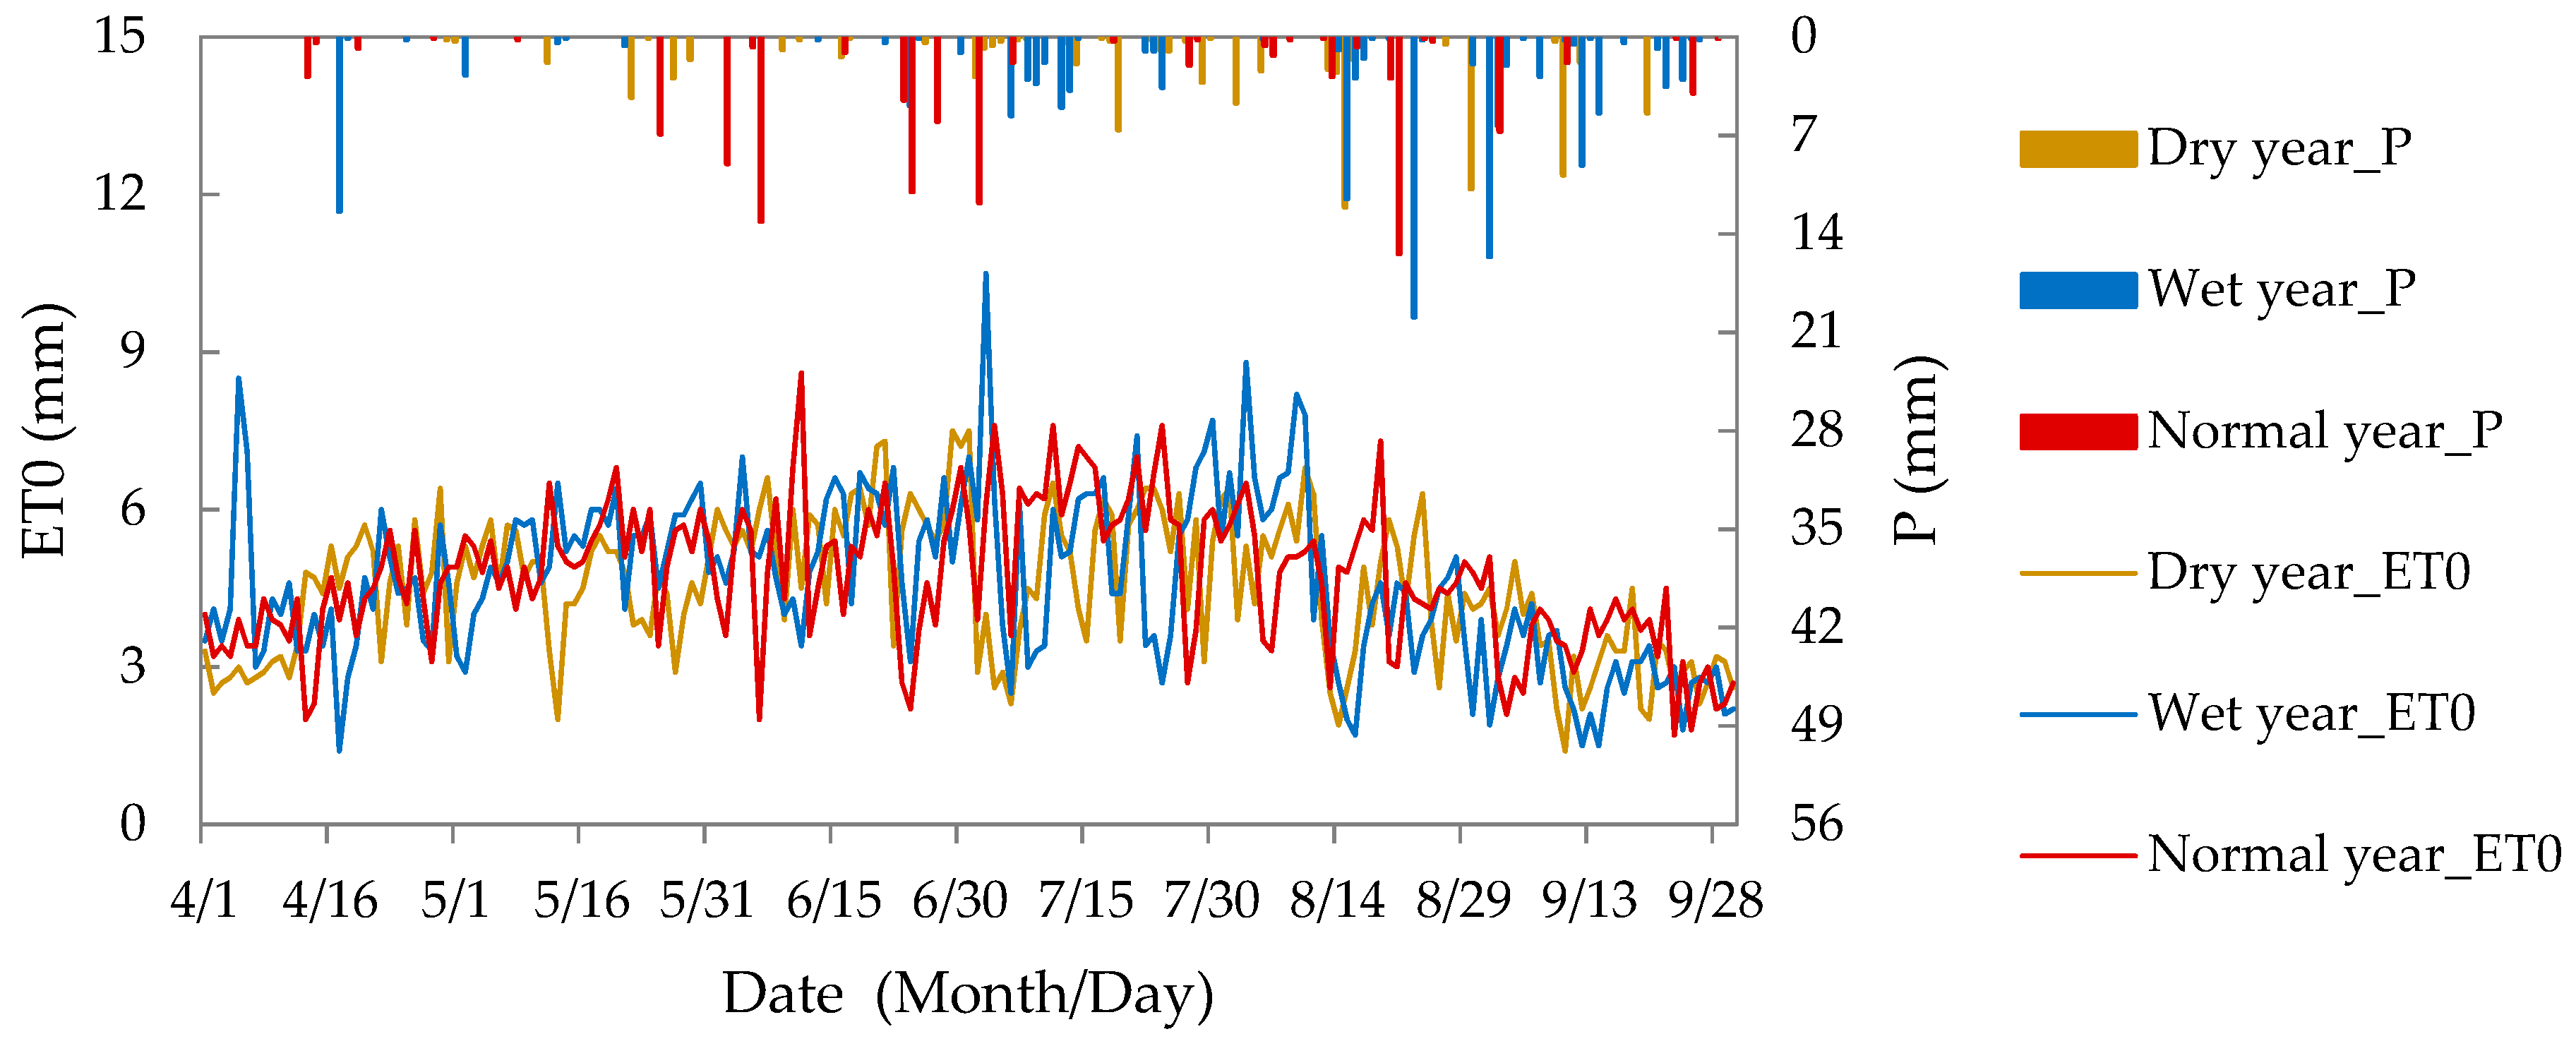
In this study, two types of scenarios (status quo and scenarios of different typical climate years) were set to find out the optimal irrigation scheduling to maximize crop yield and minimize crop water consumption. In status quo, the meteorological data during 2001 to 2010 were used to get the optimal irrigation scheduling. Typical climate years, including wet, normal, and dry years, were determined according to 25%, 50%, and 75% precipitation assurance by the optimum curve-fitting method based on the historical meteorological data (1963–2016) at Zhangye Weather Station. The daily precipitation and reference evapotranspiration in different scenarios are shown in Figure 4.

3. Results and Discussion

3.1. Model Calibration and Validation

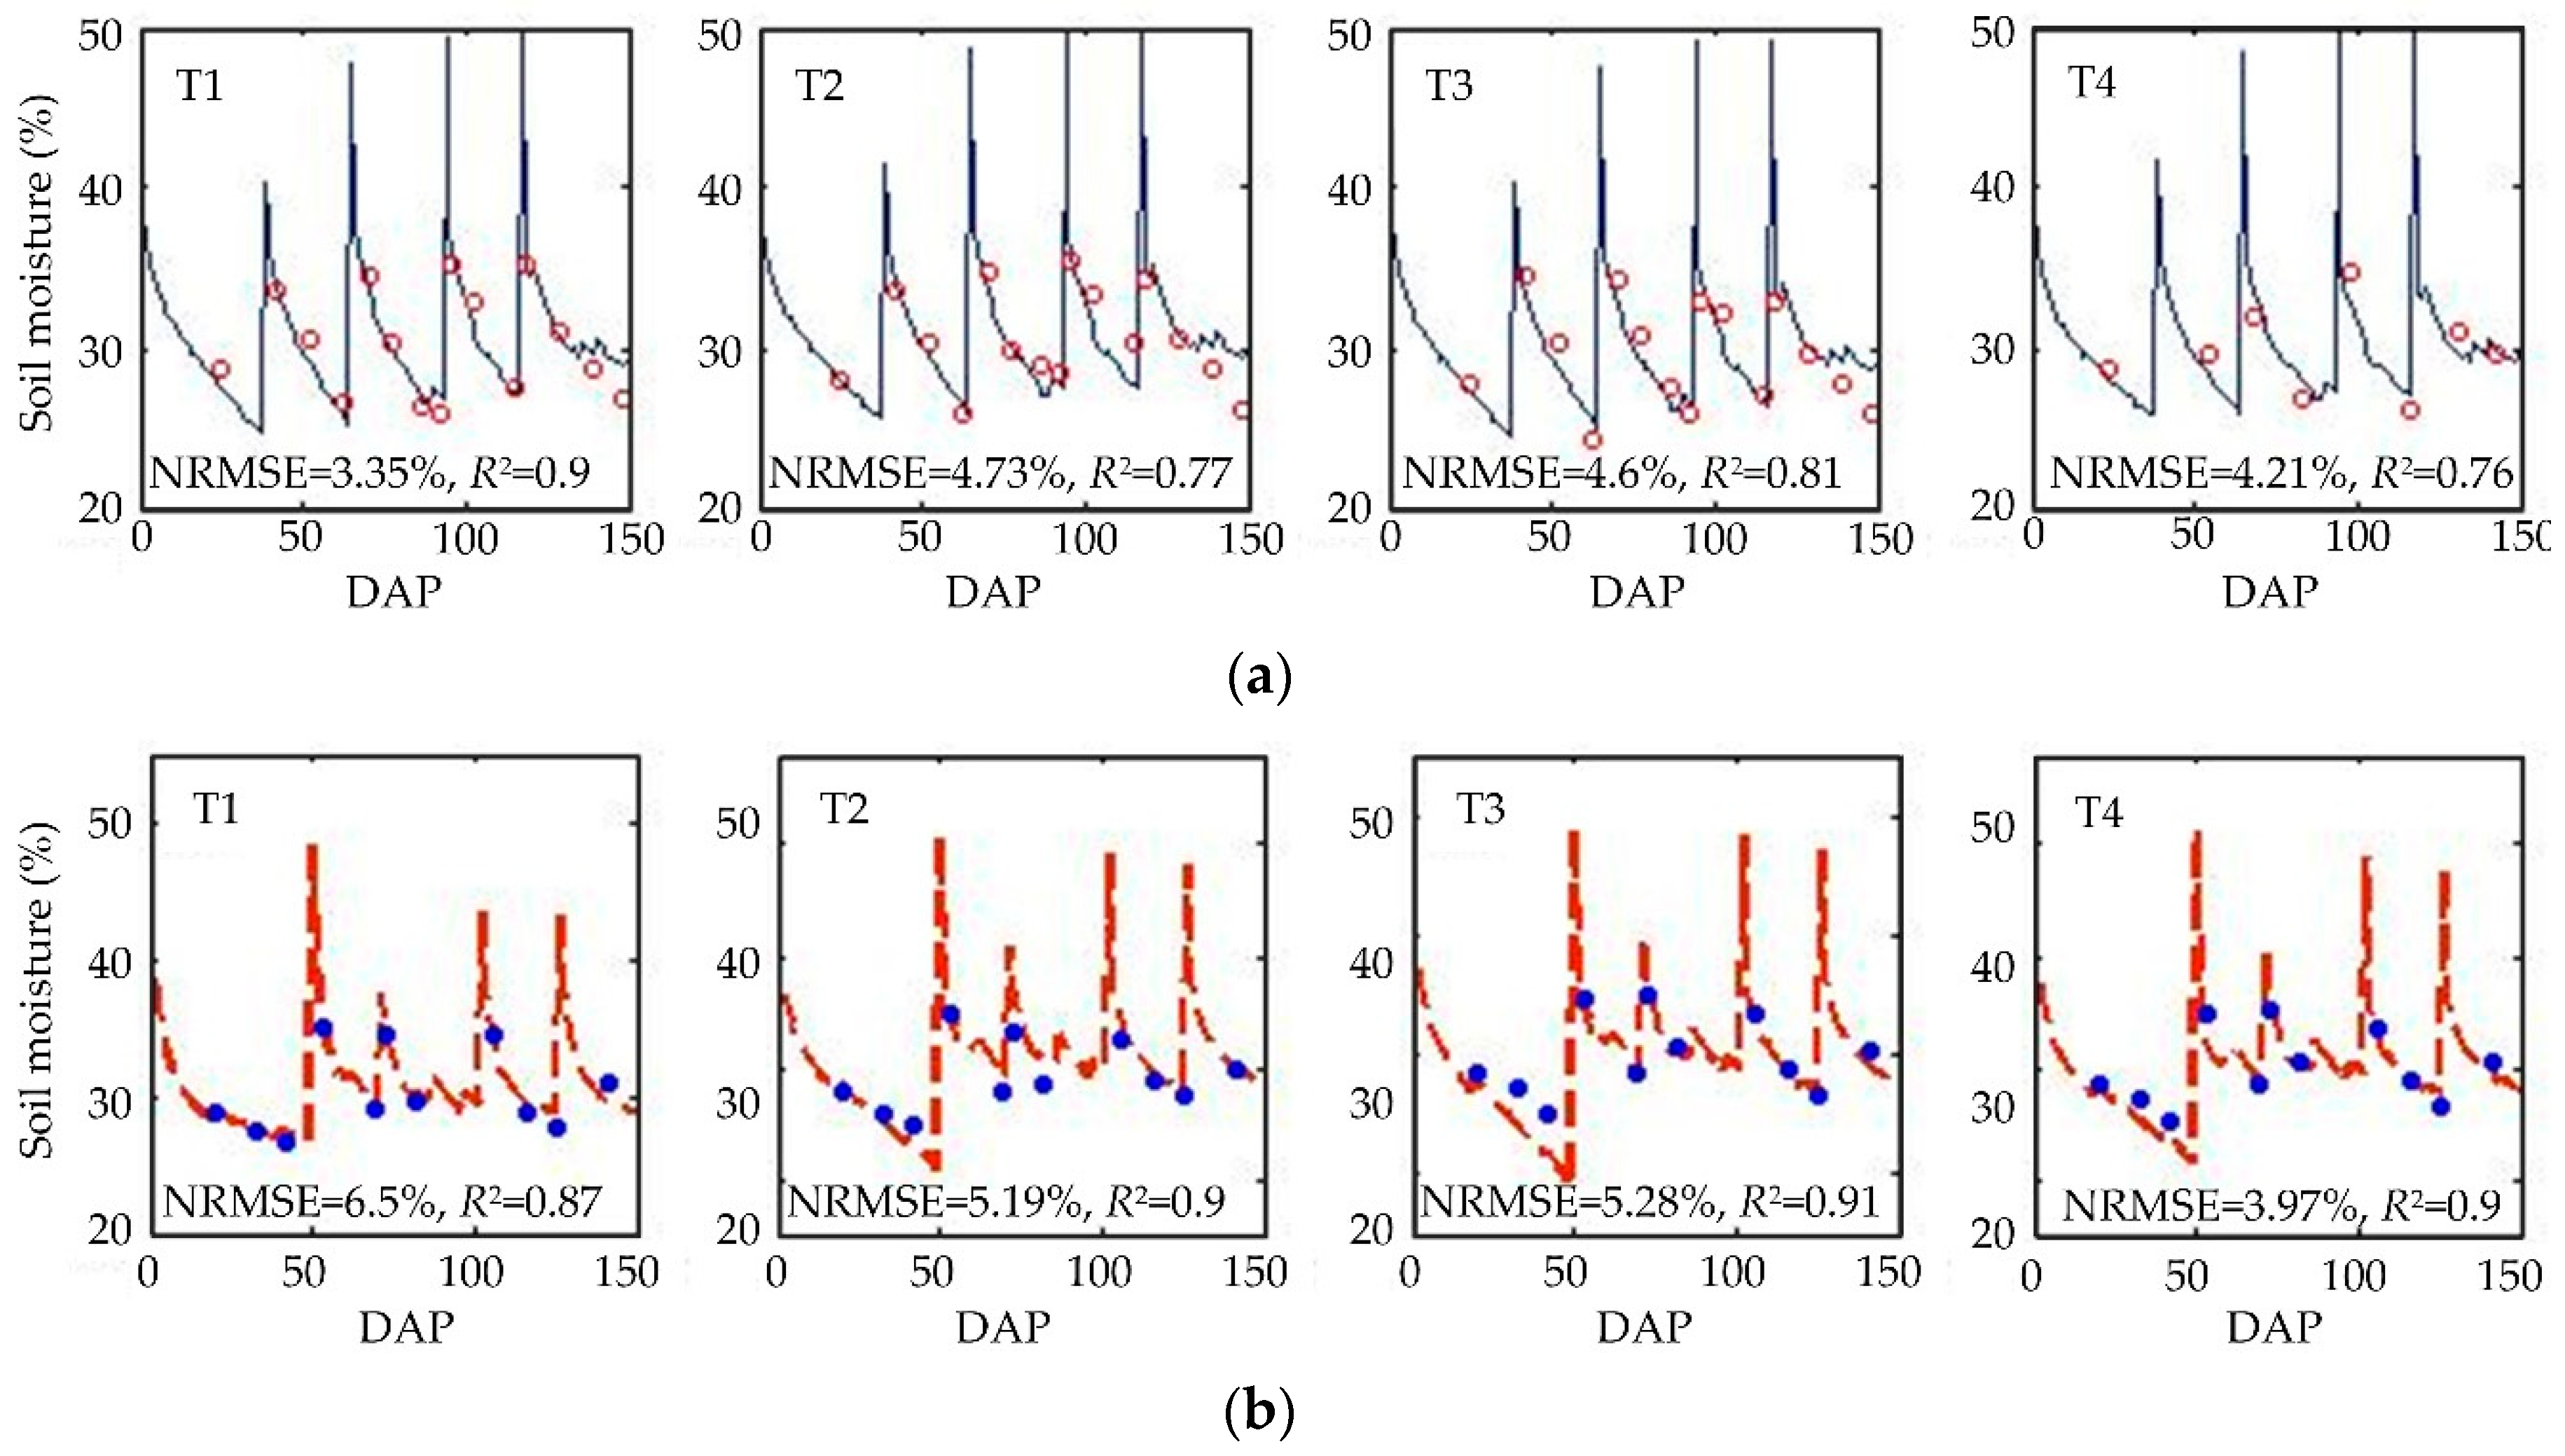
The soil water balance simulation model was calibrated by the field observations of averaged soil moisture in 0–110 cm depths in 2012, and further calibrated by observation data in 2013. The comparisons of simulated and measured soil moistures under different soil types for model calibration and validation are shown in Figure 5, and the calibrated parameters are presented in Table 2. The results show that the simulated values were in accordance with the observations, with the sharp increase in soil moisture responding to water input through irrigation/precipitation, followed by a gradual decrease due to continuous evapotranspiration. The values of NRMSE were all less than 6.5% and R2 were all above 0.76, which indicated a good performance of this model, which was capable of being used for predicting the soil moisture and water balance of maize during the crop growth season in the study area.

3.2. Optimal Irrigation Schedulings under Status Quo

3.2.1. Optimal Irrigation Scheduling for Different Maize Units

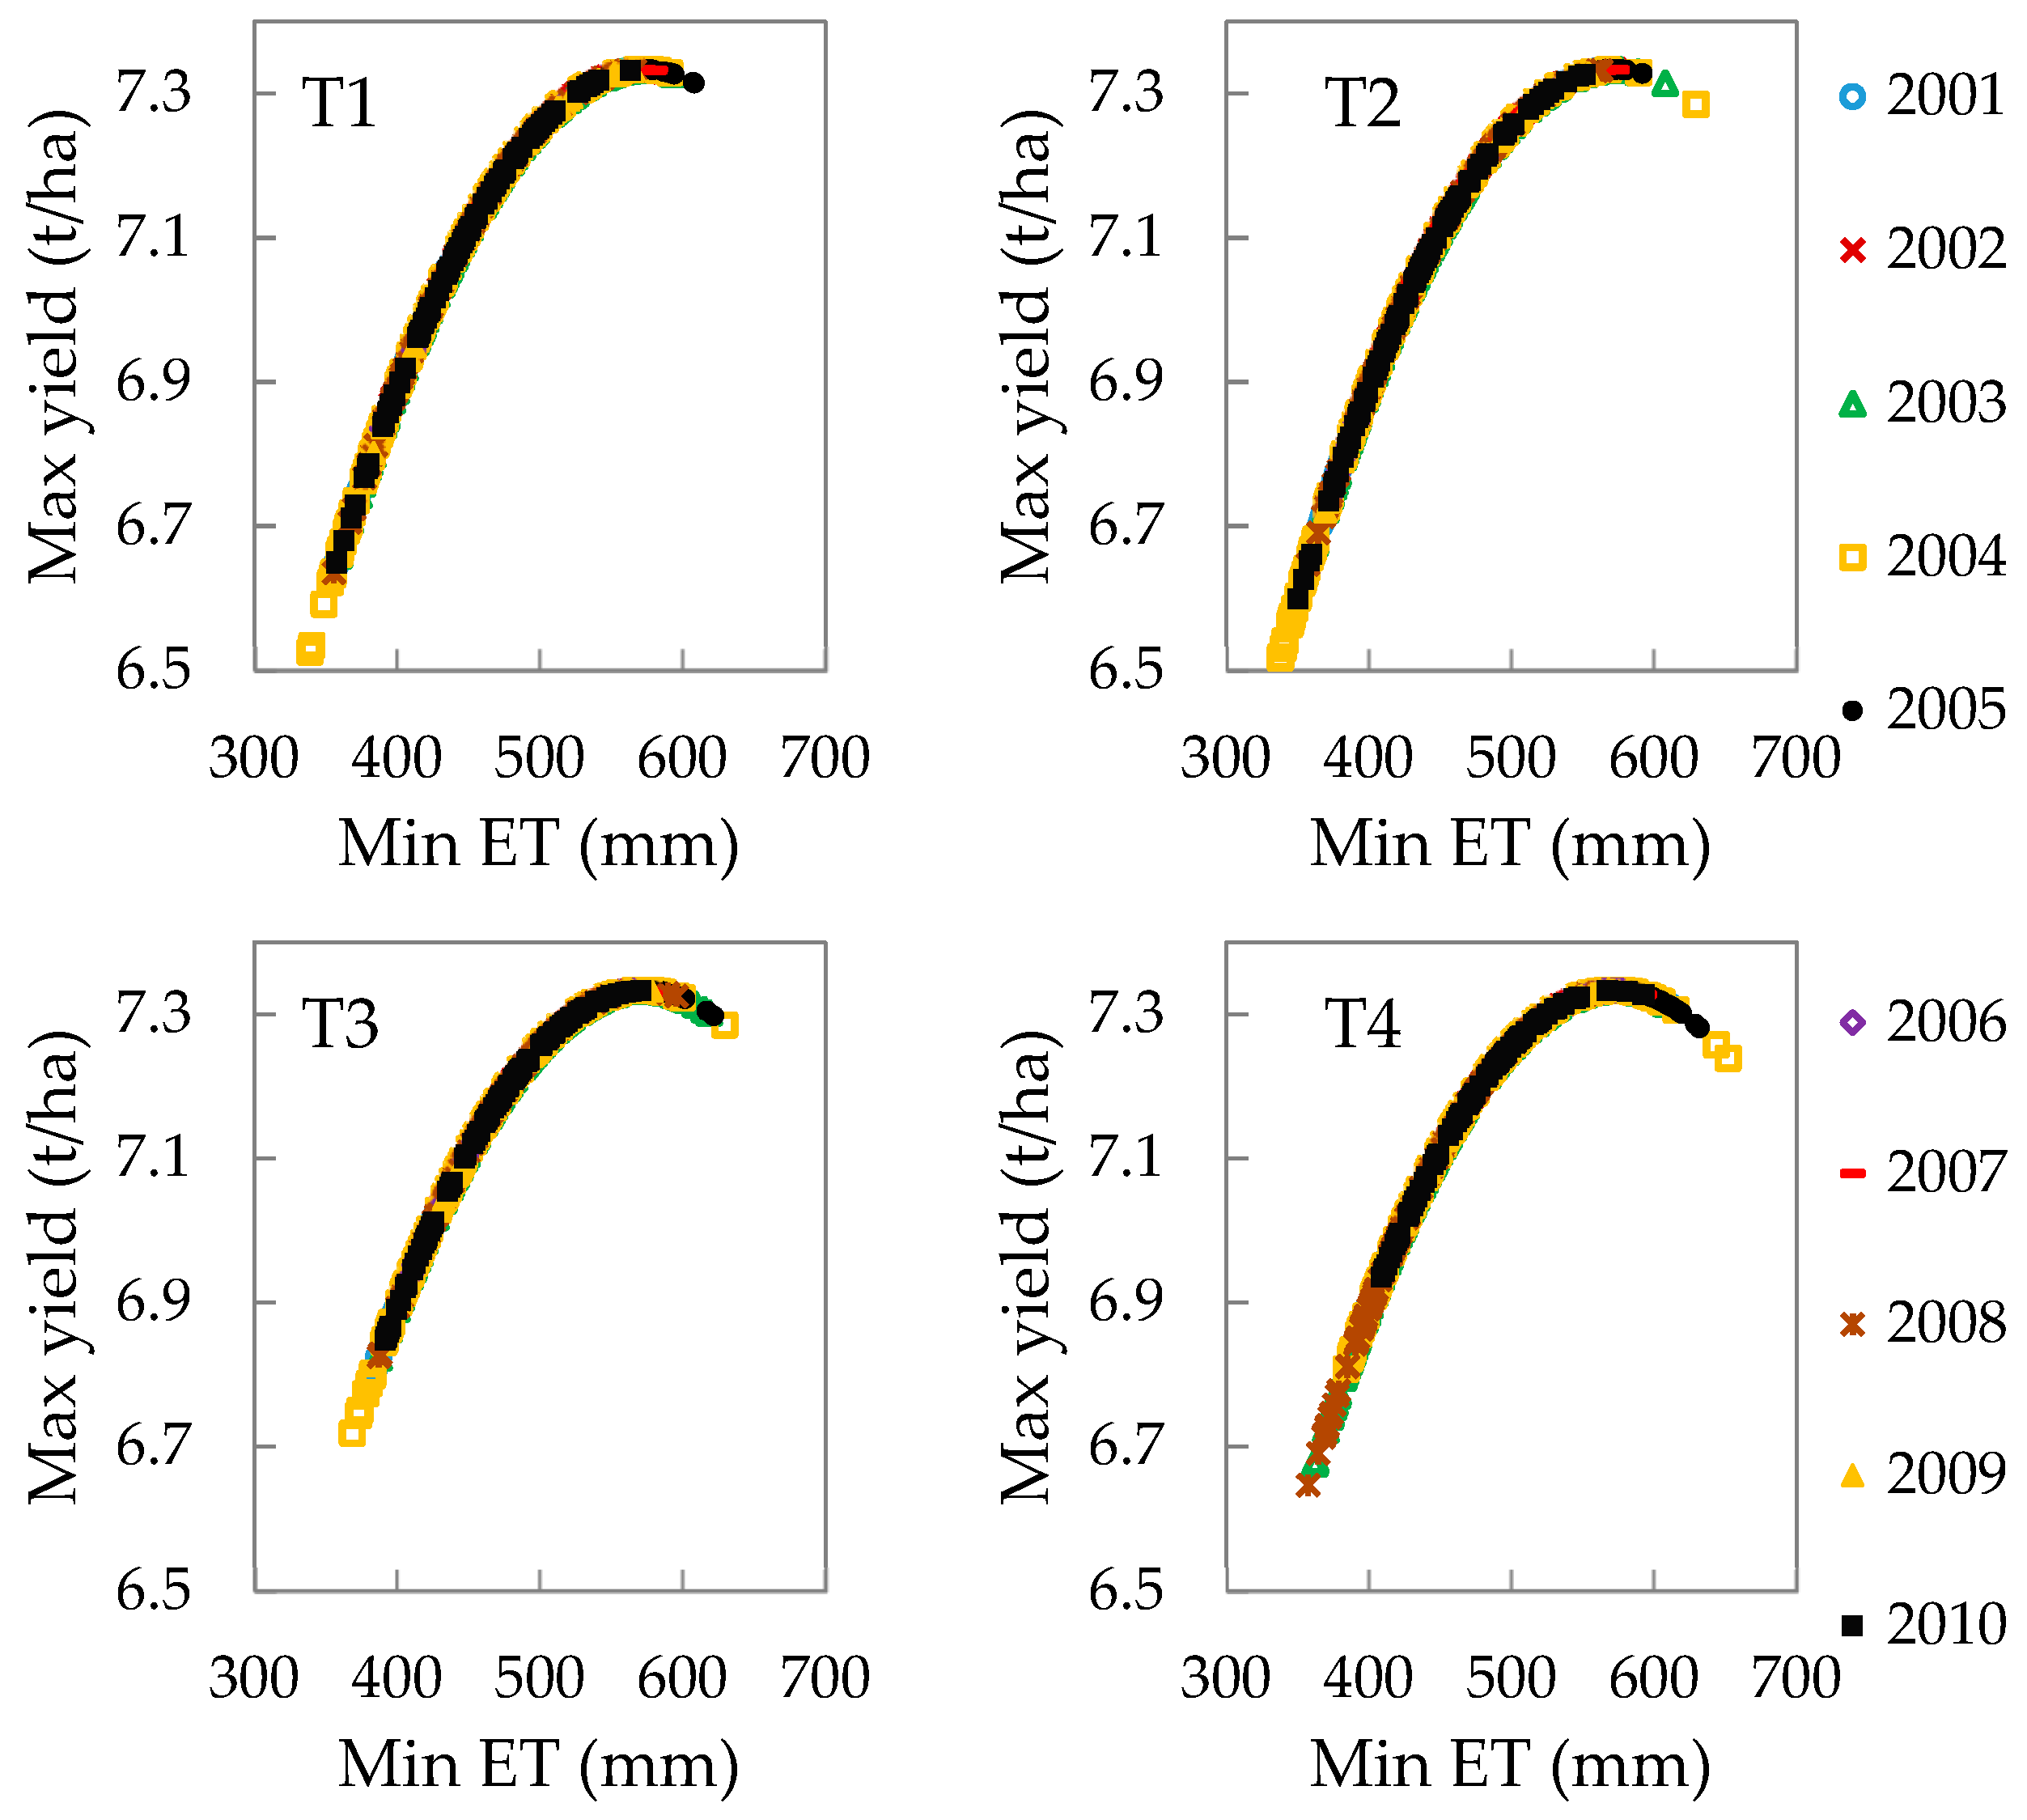
The simulation–optimization model was used to optimize the irrigation schedules for maize under different soil types in different irrigation districts from 2001 to 2010 with the objective of maximum crop yield and minimum crop water consumption. The results of optimal irrigation schedules under the same soil types in different irrigation districts were similar. In this section, the results of maize units in the Daman Irrigation District were chosen as an example to be listed and discussed. Figure 6 shows Pareto solution curves between maximal crop yield and the minimal crop water consumption of maize under different crop types during 2001 to 2010.
It can be seen from Figure 6 that the Pareto solution curves showed a trend of inclining to the top right, indicating the obvious conflict relationship between the two objectives. This means that, with the improvement of the crop water consumption target (decrease in water consumption), the crop yield target deteriorated (decrease in production). In other words, with the increase in water consumption, the optimal crop yield would show a gradual increase trend. However, the optimal crop yield would not increase but would decrease slightly with the increase in crop water consumption, when the crop water consumption increased to a certain extent (564 mm in T1, 552 mm in T2, 570 mm in T3, and 594 mm in T4). The Pareto solution curves in different years almost coincided. The reason was that the yield model (water production function) is a quadratic water production function, and the shape of the Pareto curves would be similar to those of water production curves. For different years, the meteorological data (precipitation and reference evapotranspiration) and the maximum irrigation depths of different irrigation districts were different. If the irrigation depths for constrains of the optimization model were appropriate, the maximum crop yield (the highest point of the Pareto curve) would be obtained. Pareto curves under different soil types showed that all the curves had the same shapes and different curvatures. Different curvatures of the Pareto curves were mainly caused by the differences in soil water transformation in various soil types under the same irrigation conditions. The recommended irrigation schedule for different soil types was the schedule at the highest point of the Pareto curve, (i.e., the irrigation schedule with the highest crop yield). Table 3 lists the results of the irrigation schedule recommendation in 2010.

3.2.2. Water Balance under Optimal Irrigation Scheduling

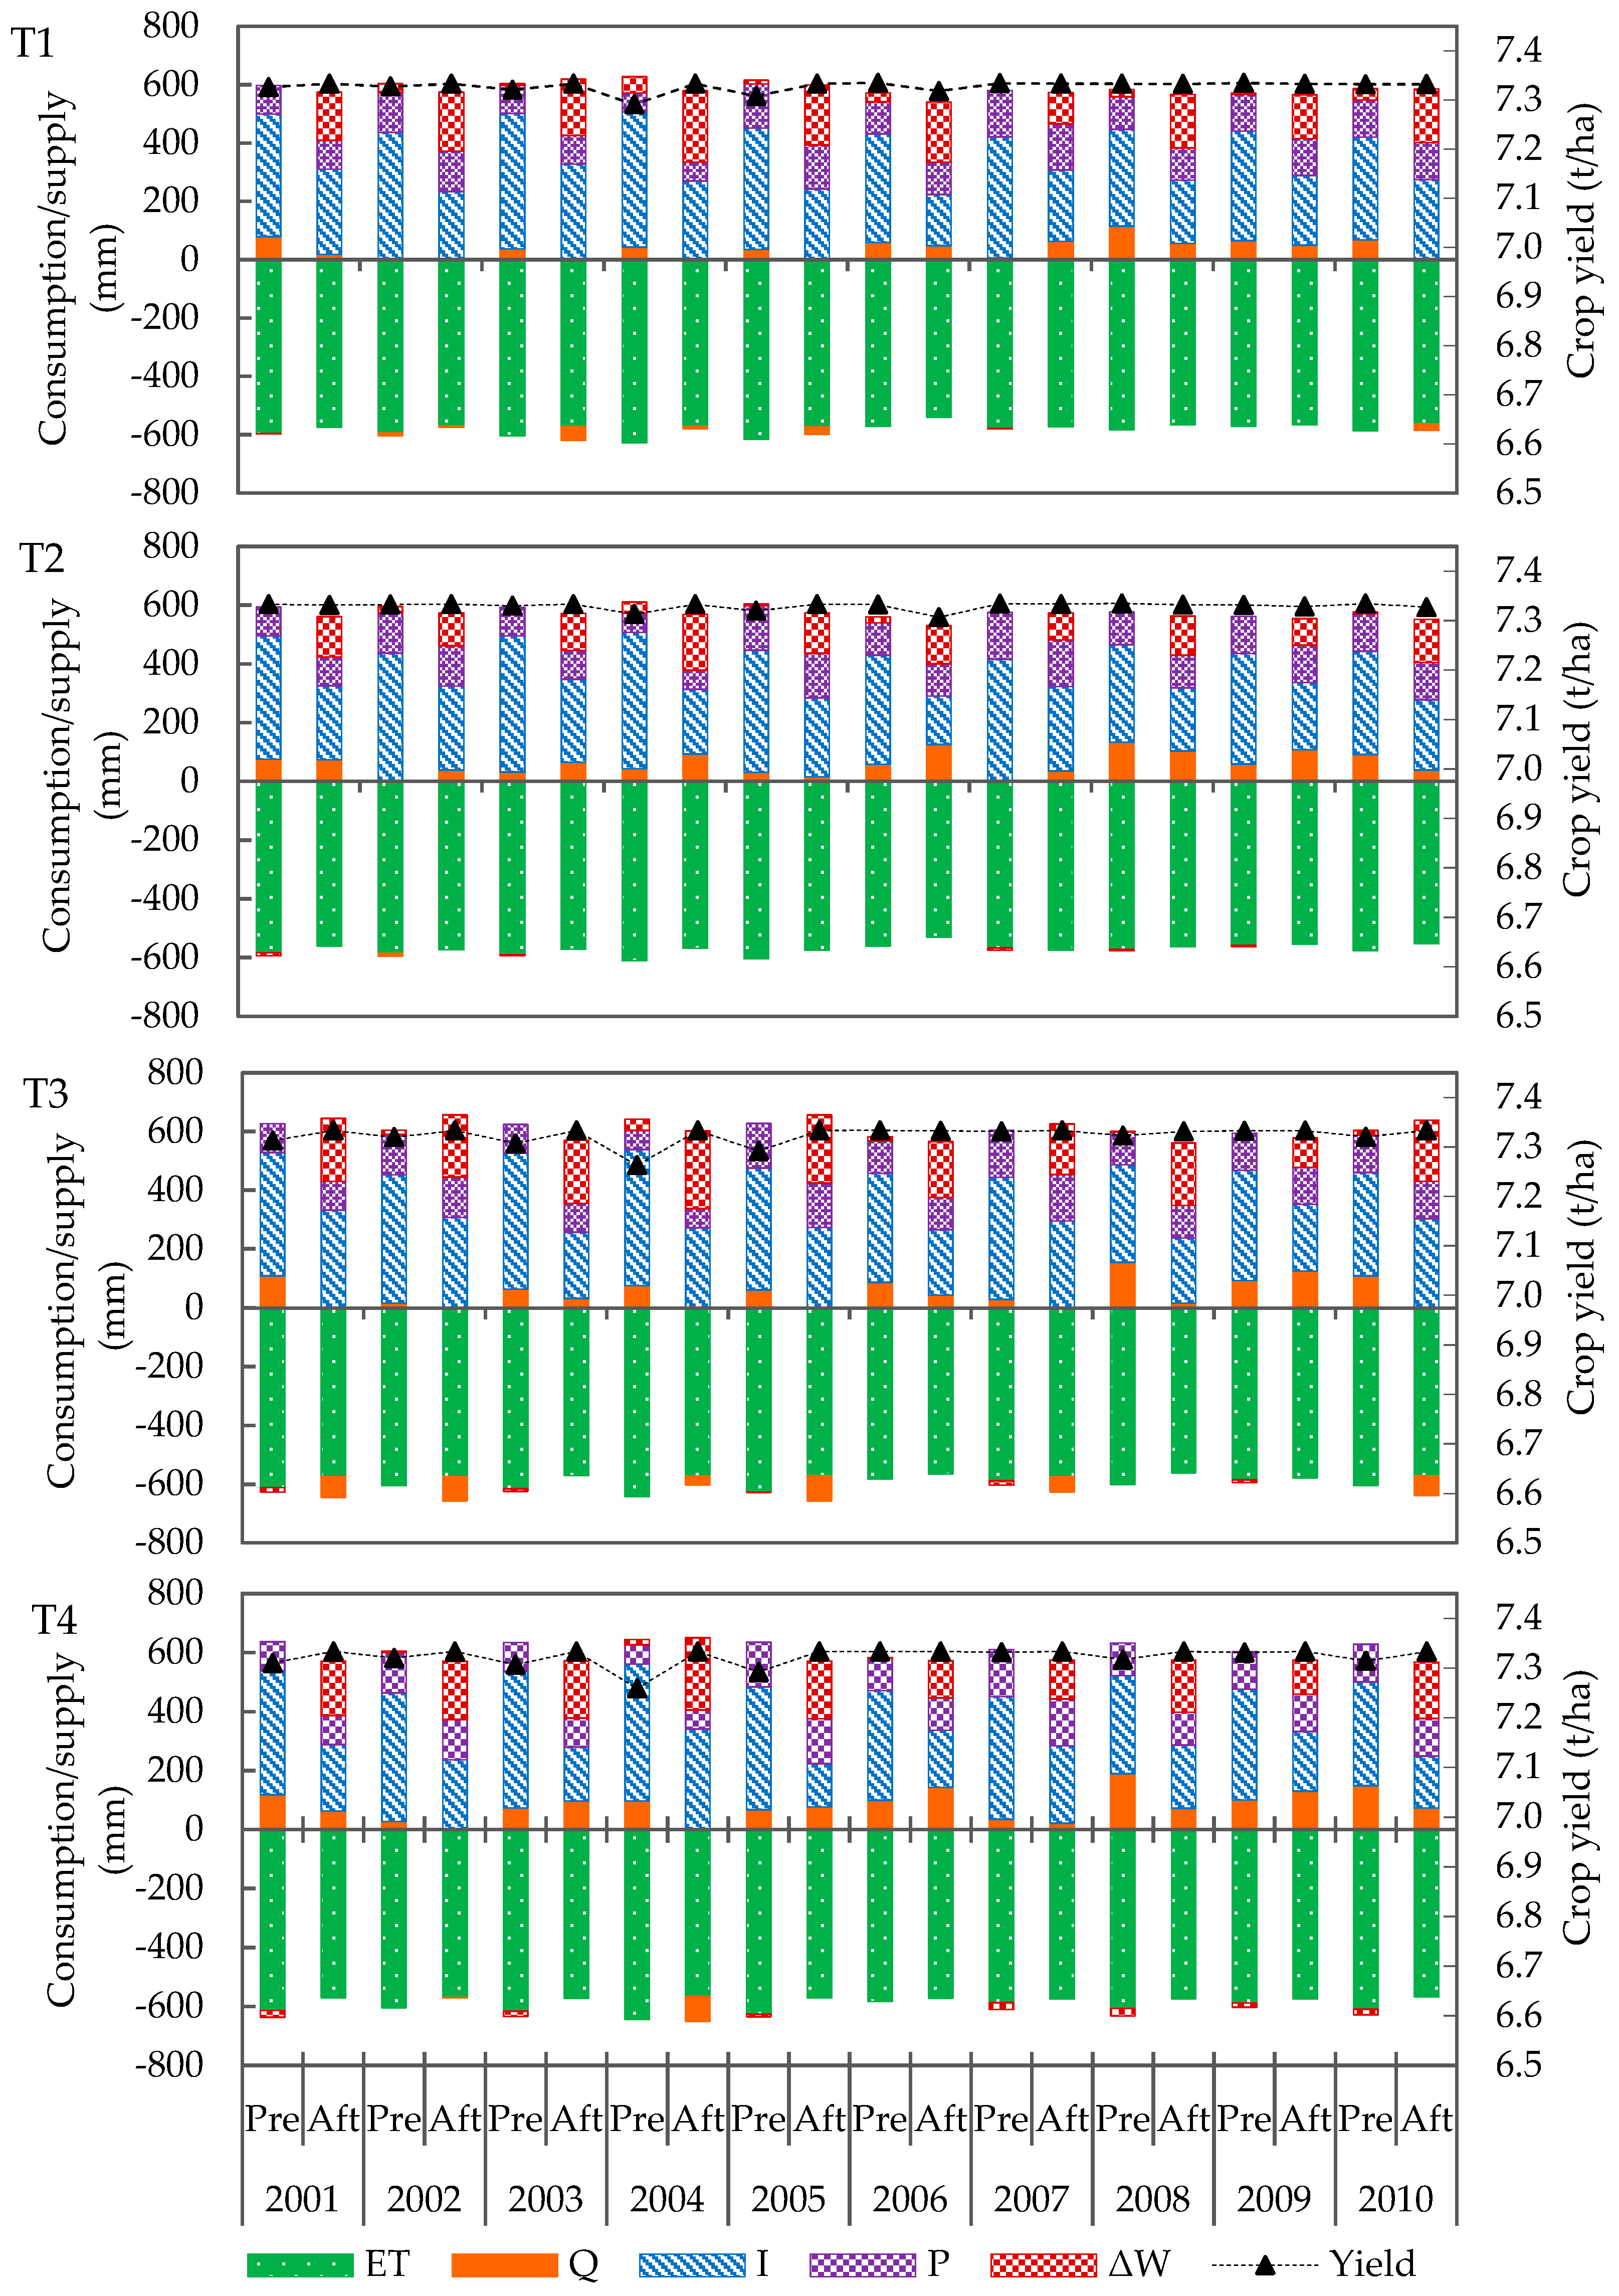
Figure 7 shows the terms of water balance and crop yields before and after irrigation scheduling optimization under different soil types in the Daman Irrigation District from 2001 to 2010. The results show that the amount of irrigation water in each year would be significantly reduced with the amount of reduction in soil water storage, and the amount of evapotranspiration would not change much after the optimization of irrigation scheduling. This indicates that soil water storage in farmland would be fully utilized and finally converted into evapotranspiration, and then the irrigation water resources could be saved after irrigation scheduling optimization. The optimal irrigation depth ranged from 147 mm to 341 mm with the highest irrigation water saving potential being 281 mm after optimization, which was under the T4 soil type in 2003. The highest crop yield after irrigation scheduling optimization was about 7.32 t/ha. The results of the crop yields showed that the effect of irrigation optimization on crop yield was little under the T1 and T2 soil types. While, under the T3 and T4 soil types, the crop yields obviously increased after irrigation scheduling optimization from 2003 to 2005. Crop yield was calculated by the water production functions in this paper. If there were little differences in evapotranspiration before and after irrigation scheduling optimization, the final crop yield would not change much. From 2003 to 2005, the evapotranspiration before irrigation optimization was relatively low under the T3 and T4 soil types, so the crop yields were relatively small before optimization. The crop yields were also nearly 7.28 t/ha under this condition, so the increase in the space of the crop yield is relatively small, and the improvement of crop yield was not obvious. However, the main significance of this work is to save irrigation water resources and to ensure crop yields by irrigation scheduling optimization.

3.2.3. Spatial Distribution of Soil Water Consumption, Supply and Crop Yield

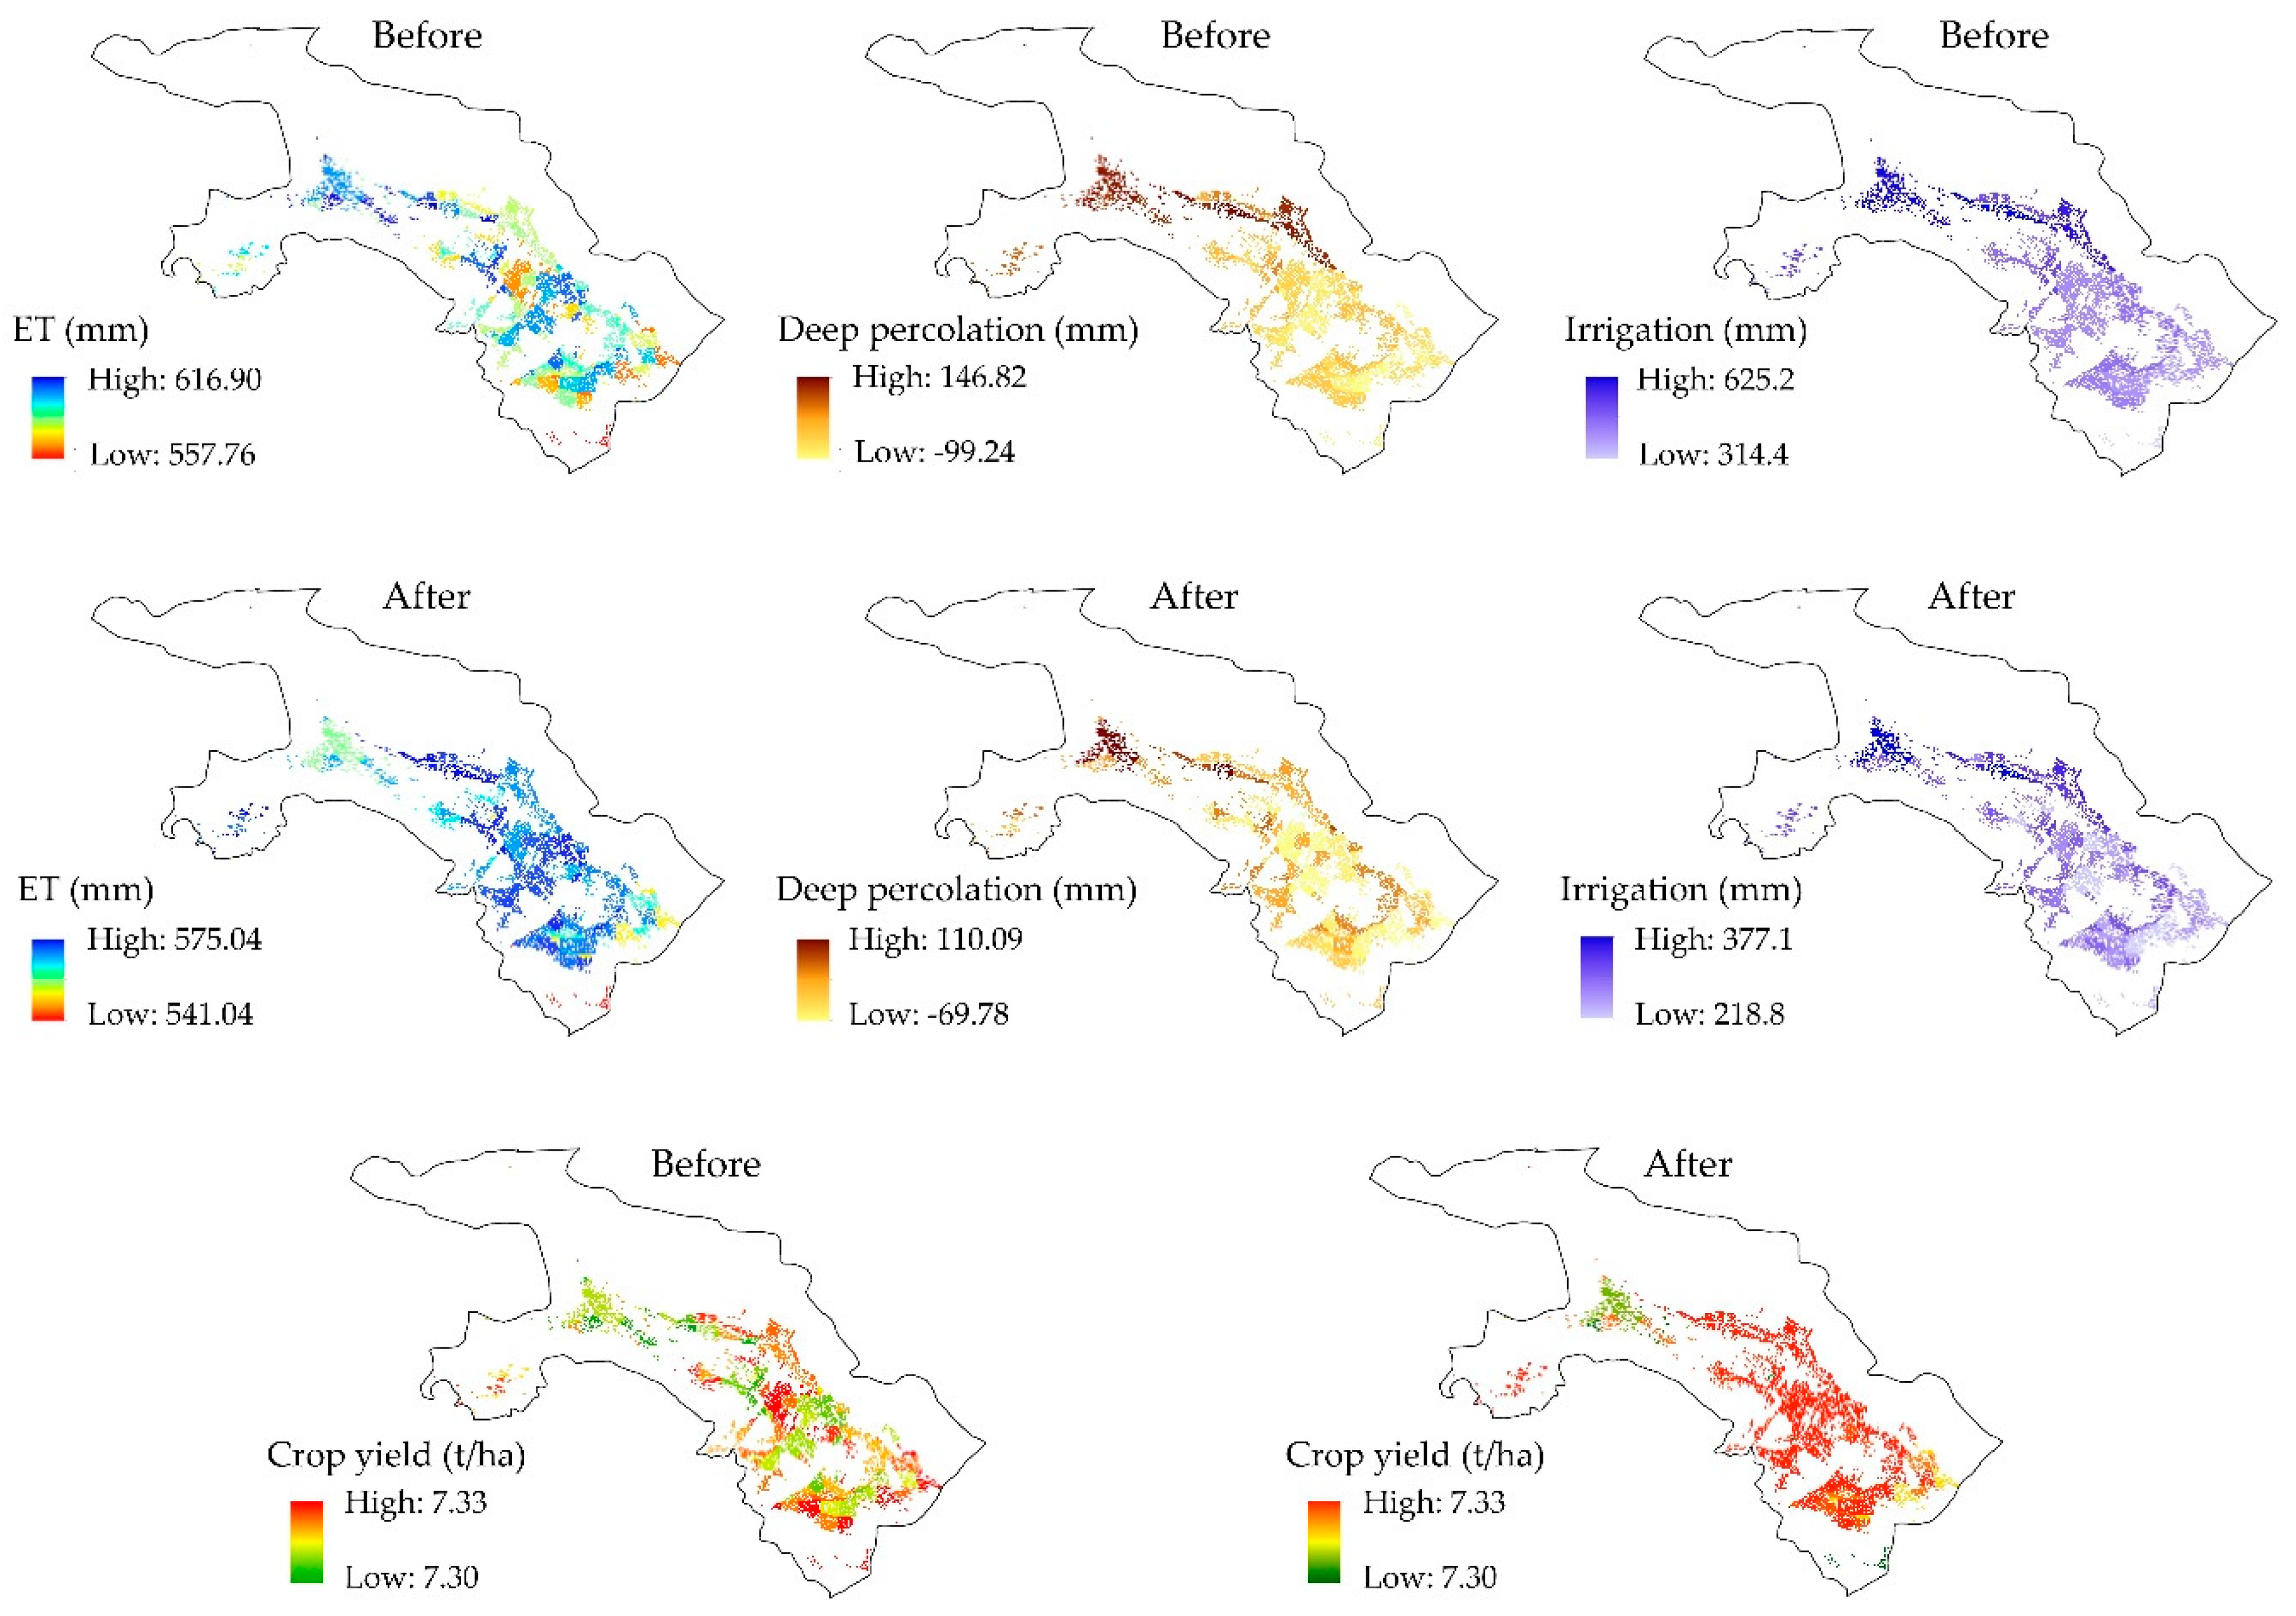
Figure 8 shows the distributions of average values of annual evapotranspiration (ET), deep percolation, irrigation depths, and the crop yields during the crop growth seasons from 2001 to 2020, before and after irrigation scheduling optimization. It can be seen that the spatial distribution of ET was more uniform after optimization than before optimization, ranging from 558 mm to 617 mm before optimization and 541 mm to 575 mm after optimization. The deep percolation was less after irrigation scheduling optimization than that before optimization (i.e., the amount of water exchange between the root zone and the subsoil was 99 mm upward recharge and 147 mm deep percolation); while after irrigation scheduling optimization, it was 70 mm upward recharge and 110 mm deep percolation, indicating that the inefficient water consumption of deep percolation would be reduced in the process of maize growth after irrigation scheduling optimization. The irrigation depths obviously changed after irrigation scheduling optimization. For details, irrigation depth would decrease to 218–337 mm after optimization from 315–625 mm before irrigation scheduling optimization. The crop yield was both above 7.3 t/ha before and after irrigation scheduling optimization, but after optimization the spatial distribution of the crop yield was more uniform. The crop yield in the northwest was slightly lower than it in other places before and after optimization, because the irrigation quota was relatively lower than it in other places. Under the lower irrigation quota, the final optimization solution of the Pareto curve would not reach the highest yield point, resulting in the lowest optimization yield.
Figure 9 shows the average values of annual evapotranspiration (ET), deep percolation, irrigation depths, and the crop yields of different irrigation districts during the crop growth seasons from 2001 to 2020 before and after irrigation scheduling optimization. The results show that the spatial distribution of water consumption and yield for the irrigation district was highly variable, which was caused by greatly differing maize planting areas of different irrigation districts. The total crop water consumption of each irrigation district ranged from 2.91 × 10⁵ m3 to 1.65 × 10⁸ m3 before irrigation scheduling optimization, and from 2.71 × 10⁵ m3 to 1.57 × 10⁸ m3 after optimization. The total yield of each irrigation district was between 300 tons and 310,000 tons before and after optimization, which indicated that the irrigation scheduling optimization in this study mainly contributed to decreasing crop water consumption.

3.3. Optimal Irrigation Schedulings under Different Climate Years

3.3.1. Water Balance under Optimal Irrigation Scheduling

Figure 10 shows the soil water balance and crop yield of different soil types in the Daman Irrigation District after irrigation scheduling optimization under different climate years. It can be seen that there was only one term of water consumption during wet year (i.e., evapotranspiration). Under wet conditions, precipitation, irrigation and soil water in both the root zone and soil below the root zone were all used for evapotranspiration. Under the normal year, evapotranspiration was the main consumption item of soil water balance. Under the T2, T3, and T4 soil types, there would be a small amount of deep percolation under normal conditions. There would also be a small amount of deep percolation in the T2 soil during the dry year, while in the other soil types there would be only evapotranspiration as water consumption under dry conditions. The results of irrigation scheduling optimization show that the optimization could help in making full use of water resources and ensuring crop yield. Table 4 shows the specific irrigation schedules for maize of different soil types. It can be seen from the table that the optimal irrigation schedules for different soil types were quite different, which was caused by the solution algorithm of this optimization model. In the process of solving the optimization model, the genetic algorithm was constantly searching out the solution set that meets the conditions, so there would be a large difference in the solution under the same situation. However, the simulation–optimization model for irrigation scheduling developed in this paper was aimed at providing a means to solve the optimal irrigation schedule in different situations. When solving practical problems in the future, this model can be used to solve the optimization of irrigation schedules according to the actual meteorological conditions and irrigation demands.

3.3.2. Spatial Distribution of Soil Water Consumption, Supply, and Crop Yield

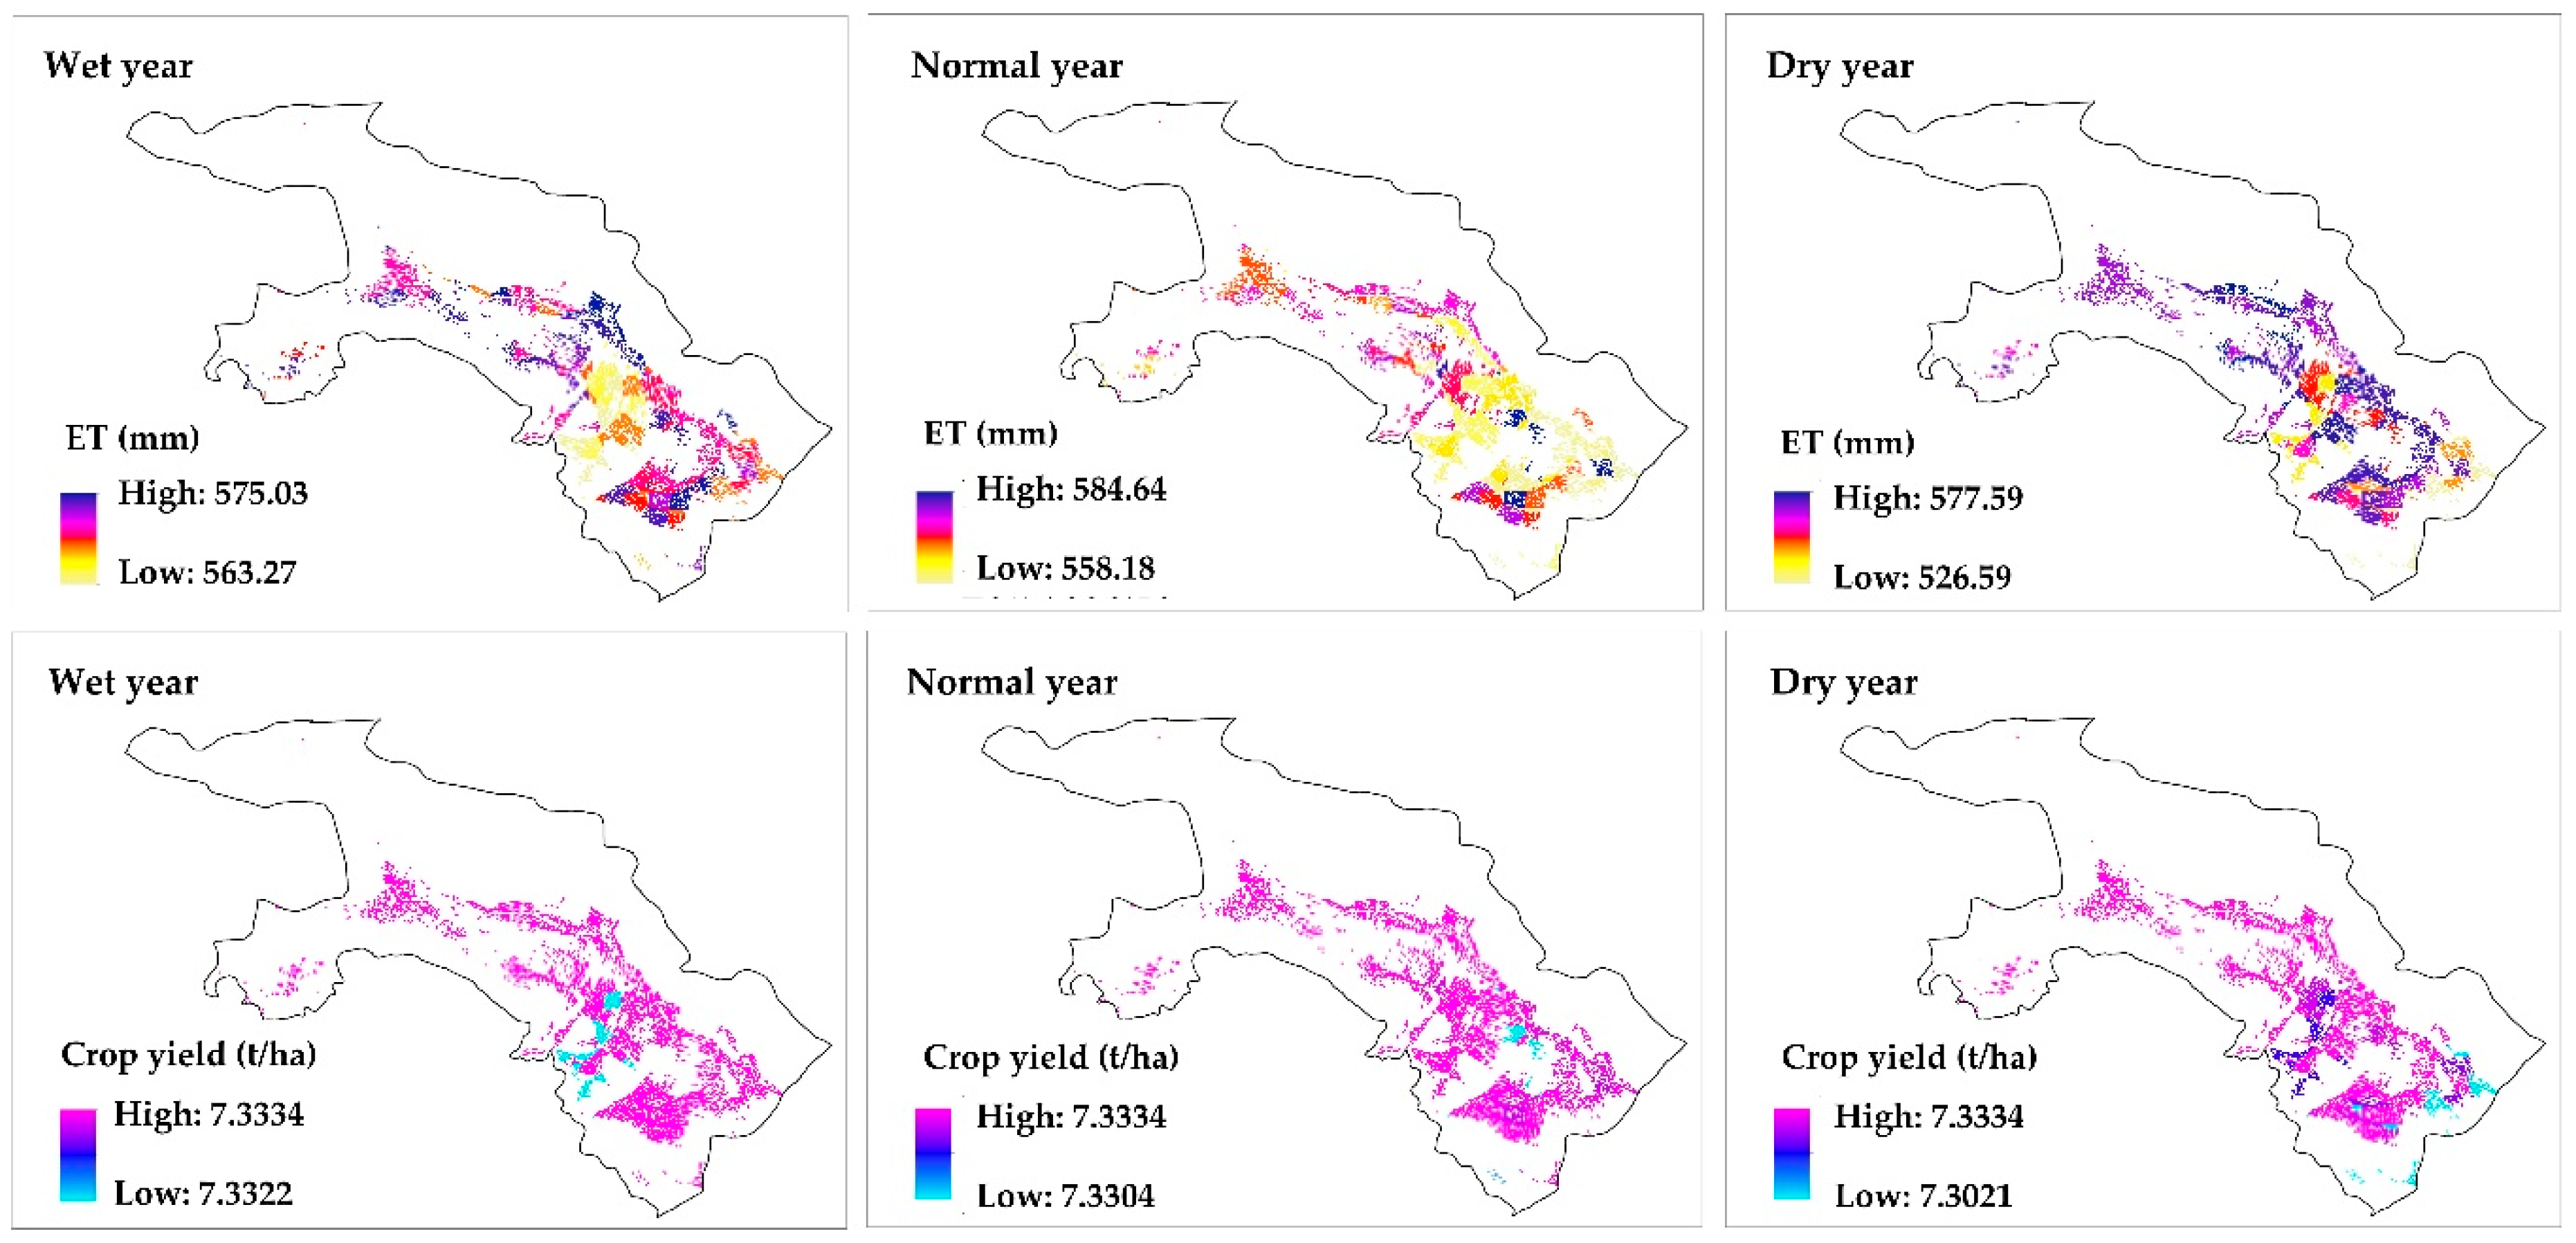
Figure 11 shows the distributions of evapotranspiration (ET) and yield under different climate years after irrigation scheduling optimization. The results show that the spatial variability of ET in the dry year was the largest, ranging from 527 mm to 578 mm, followed by the normal year ranging from 559 mm to 585 mm, and the smallest was the wet year, ranging from 563 mm to 575 mm. The maximal irrigation quota of the maize in the same irrigation district was the same, and the input data of meteorological factors in the same meteorological year were the same, so the ET difference was mainly caused by soil types. After irrigation scheduling optimization, the maximal yield was similar under different climate years, ranging from 7.3 t/ha to 7.34 t/ha. This indicated that the highest crop yield can be obtained if irrigation scheduling is optimized.
The simulation–optimization model built in this study was coupled by the soil water balance simulation model and optimization model. The crop yield was calculated by water production function, which was related with the parameters. When other researchers use the model to solve problems in other study areas, the parameters in water production function should be selected carefully or obtained based on field experiments.

4. Conclusions

To optimize the irrigation scheduling for maize in an arid oasis, we established an irrigation scheduling optimization model based on simulation and optimization. The simulation part is the soil water balance simulation model and it was calibrated and validated by the monitoring data of soil water in maize land of the Yingke Irrigation District from 2012 to 2013. The empirical water production function is jointed to the optimization model, with the maximum crop yield and the minimum water consumption as the objectives, and the maximum irrigation quotas of the maize fields in the study area as the constraints. NSGA-II was used to solve the optimization model, with the optimal irrigation schedules of the maize in different soil types of different irrigation districts under historical meteorological years (2001–2010) and different typical climate years (wet year, normal year, dry year). The main conclusions are as follows:
(1)
The simulation model can reflect the soil water movement of maize filed during the crop growth period in the study area well, with NRMSE less than 6.5% and R2 more than 0.76.
(2)
The Pareto solution curve after irrigation scheduling optimization showed a trend of inclining to the upper right, which shows that the yield objective is deteriorating (yield reduction) with the improvement of the water consumption objective (water consumption reduction). The irrigation schedule with the highest point of the Pareto curve (when the yield is the highest) can be selected as the recommended optimal irrigation schedule.
(3)
From 2001 to 2010, the irrigation water-saving potential of the study area was between 97 mm and 240 mm, and the average annual optimal yield of maize was over 7.3 t/ha, which indicated that the yield of maize could be obtained after reasonable irrigation scheduling optimization.
(4)
The optimal irrigation schedules varied greatly in different typical meteorological years, but the crop yield can be guaranteed between 7.3t/ha and 7.34t/ha. The simulation–optimization model of irrigation schedule established in this paper can provide a technical means for the formulation of irrigation schedules to ensure crop yield and save irrigation water consumption.

Author Contributions

Conceptualization, J.L. and X.J.; data curation, J.L.; formal analysis, J.S. and H.J.; funding acquisition, J.L. and X.J.; investigation, J.L. and H.J.; methodology, J.L.; software, J.S.; writing—original draft, J.L. and H.J.; writing—review and editing, J.L., X.J., and L.C. All authors have read and agreed to the published version of the manuscript.

Funding

This research was funded by the National Key Research and Development Program (2017YFC0403303), Cooperative Innovation Center for Water Safety & Hydro Science of Hohai University, the Fundamental Research Funds for the Central Universities (2019B06114), Joint Open Research Fund Program of State key Laboratory of Hydroscience and Engineering and Tsinghua—Ningxia Yinchuan Joint Institute of Internet of Waters on Digital Water Governance (sklhse-2020-Iow02) and China Postdoctoral Science Foundation (2018M631484).

Acknowledgments

We thank Xiaoke Zhao, Gaozhan Yang, Shilei Chen, Yao Jiang, Minghuan Liu, Donghao Li, and Yue Cao of China Agricultural University for their help in soil sampling and field survey in the Heihe River Basin in 2014.

Conflicts of Interest

The authors declare no conflict of interest.

References

  1. Michelon, N.; Pennisi, G.; Myint, N.O.; Orsini, F.; Gianquinto, G. Strategies for improved water use efficiency (WUE) of field-grown Lettuce (Lactuca sativa L.) under a semi-arid climate. Agronomy 2020, 10, 668. [Google Scholar] [CrossRef]
  2. Jeong, J.; Zhang, X. Model application for sustainable agricultural water use. Agronomy 2020, 10, 396. [Google Scholar] [CrossRef] [Green Version]
  3. Li, W.; Li, Y.P.; Li, C.H.; Huang, G.H. An inexact two-stage water management model for planning agricultural irrigation under uncertainty. Agric. Water Manag. 2010, 97, 1905–1914. [Google Scholar] [CrossRef]
  4. Chen, D.; Xu, Z.; Chen, R. Design of water resources accounts: A case of integrated environmental and economic accounting. Adv. Water. Sci. 2003, 5, 631–637. [Google Scholar]
  5. Zhao, C.S.; Huang, L.M.; Shen, B.; Lei, Z.D.; Hu, H.P.; Yang, S.X. The creation of the dissipative hydrological model for Hotan Oasis (DHMHO). J. Arid. Land. Resour. Environ. 2010, 24, 72–77. [Google Scholar]
  6. The Ministry of Water Resources of the People’s Republic of China. The People Republic of China. Recent Layout Suggestions of Water Resources in the Mainstream of Heihe River; The Ministry of Water Resources of the People’s Republic of China: Beijing, China, 2001.
  7. Akhtar, F.; Tischbein, B.A. Optimizing deficit irrigation scheduling under shallow groundwater conditions in lower reaches of Amu Darya River Basin. Water. Resour. Manag. 2013, 27, 3165–3178. [Google Scholar] [CrossRef]
  8. Gu, Z.; Qi, Z.; Burghate, R.; Yuan, S.; Jiao, X.; Xu, J. Irrigation scheduling approaches and applications: A review. J. Irrig. Drain. Eng. 2020, 146, 04020007. [Google Scholar] [CrossRef]
  9. Xu, X.; Jiang, Y.; Liu, M.; Huang, Q.; Huang, G. Modeling and assessing agro-hydrological processes and irrigation water saving in the middle Heihe River basin. Agric. Water Manag. 2019, 211, 152–164. [Google Scholar] [CrossRef]
  10. Ran, H.; Kan, S.; Li, F.; Du, T.; Zhang, X. Parameterization of the AquaCrop model for full and deficit irrigated maize for seed production in arid Northwest China. Agric. Water Manag. 2018, 203, 438–450. [Google Scholar] [CrossRef]
  11. Li, J.; Mao, X.; Shang, S.; Steenhuis, T. Modeling regional soil water balance in farmland of the middle reaches of Heihe River Basin. Water 2017, 9, 847. [Google Scholar] [CrossRef] [Green Version]
  12. Li, J.; Wang, X.; Bai, L.; Mao, X. Quantification of lateral seepage from farmland during maize growing season in arid region. Agric. Water Manag. 2017, 191, 85–97. [Google Scholar] [CrossRef]
  13. Singh, A. Simulation–optimization modeling for conjunctive water use management. Agric. Water Manag. 2014, 141, 23–29. [Google Scholar] [CrossRef]
  14. Shang, S.; Mao, X. Application of a simulation based optimization model for winter wheat irrigation scheduling in North China. Agric. Water Manag. 2006, 85, 314–322. [Google Scholar] [CrossRef]
  15. Singh, A.; Panda, S.N. Optimization and simulation modelling for managing the problems of water resources. Water. Resour. Manag. 2013, 27, 3421–3431. [Google Scholar] [CrossRef]
  16. Jiang, Y.; Xu, X.; Huang, Q.; Huo, Z.; Huang, G. Optimizing regional irrigation water use by integrating a two-level optimization model and an agro-hydrological model. Agric. Water Manag. 2016, 178, 76–88. [Google Scholar] [CrossRef] [Green Version]
  17. Singh, A. An overview of the optimization modelling applications. J. Hydrol. 2012, 466–467, 167–182. [Google Scholar] [CrossRef]
  18. Li, M.; Fu, Q.; Guo, P.; Singh, V.P.; Zhang, C.; Yang, G. Stochastic multi-objective decision making for sustainable irrigation in a changing environment. J. Clean. Prod. 2019, 223, 928–945. [Google Scholar] [CrossRef]
  19. Li, M.; Fu, Q.; Singh, V.P.; Liu, D.; Gong, X. Risk-based agricultural water allocation under multiple uncertainties. Agric. Water Manag. 2020, 233, 106105. [Google Scholar] [CrossRef]
  20. Li, M.; Fu, Q.; Singh, V.P.; Liu, D.; Li, T. Stochastic multi-objective modeling for optimization of water-food-energy nexus of irrigated agriculture. Adv. Water. Resour. 2019, 127, 209–224. [Google Scholar] [CrossRef]
  21. Li, M.; Fu, Q.; Singh, V.P.; Liu, D.; Li, T.; Zhou, Y. Managing agricultural water and land resources with tradeoff between economic, environmental, and social considerations: A multi-objective non-linear optimization model under uncertainty. Agric. Syst. 2020, 178, 102685. [Google Scholar] [CrossRef]
  22. Ferguson, J.C.; Krutz, L.J.; Calhoun, J.S.; Gholson, D.M.; Merritt, L.H.; Wesley, M.T.; Broster, K.L.; Treadway, Z.R. Optimizing overhead irrigation droplet size for six mississippi soils. Agronomy 2020, 10, 574. [Google Scholar] [CrossRef] [Green Version]
  23. Li, M.; Li, J.; Singh, V.P.; Fu, Q.; Liu, D.; Yang, G. Efficient allocation of agricultural land and water resources for soil environment protection using a mixed optimization-simulation approach under uncertainty. Geoderma 2019, 353, 55–69. [Google Scholar] [CrossRef]
  24. Wen, Y.; Shang, S.; Jian, Y. Optimization of irrigation scheduling for spring wheat with mulching and limited irrigation water in an arid climate. Agric. Water Manag. 2017, 192, 33–44. [Google Scholar] [CrossRef]
  25. Li, J.; Wan, H.; Shang, S. Comparison of interpolation methods for mapping layered soil particle-size fractions and texture in an arid oasis. Catena 2020, 190, 104514. [Google Scholar] [CrossRef]
  26. Li, J.; Mao, X.; Li, M. Modeling hydrological processes in oasis of Heihe River Basin by landscape unit-based conceptual models integrated with FEFLOW and GIS. Agric. Water Manag. 2017, 179, 338–351. [Google Scholar] [CrossRef]
  27. Li, J.; Zhu, T.; Mao, X.; Adeloye, A. Modeling crop water consumption and water productivity in the middle reaches of Heihe River Basin. Comput. Electron. Agric. 2016, 123, 242–255. [Google Scholar] [CrossRef]
  28. Wang, Y.R. Study of the Transformation of Water in the Field Water Production Function for Winter Wheat. Master’s Thesis, Tsinghua University, Beijing, China, 1996. [Google Scholar]
  29. Allen, R.G.; Pereira, L.S.; Raes, D.; Smith, M. Crop Evapotranspiration: Guidelines for Computing Crop Requirements; Irrigation and Drainage Paper No. 56; FAO: Rome, Italy, 1998. [Google Scholar]
  30. Yin, H.; Zhang, B.; Wang, Y.; Zhang, Y.; Wang, Q.; Zhao, Y. Research on the changes trend of crop water requirement in the middle reaches of Heihe River Basin in the recent 43 years. Resourc. Sci. 2012, 34, 409–417. [Google Scholar]
  31. Lei, Z.D.; Yang, S.X.; Xie, S.C. Soil Hydrodynamics; Tsinghua University Press: Beijing, China, 1988. [Google Scholar]
  32. Li, T. Pilot study on Water Production Functions and Optimal Irrigation Schedule of Main Crops in Shinyang River Basin. Master’s Thesis, Yangling Northwest A & F University, Shaanxi, China, 2005. [Google Scholar]
  33. Deb, K.; Agrawal, S.; Pratap, A. A fast elitist non-dominated sorting genetic algorithm for multi-objective optimization: NSGA-II. In Parallel Problem Solving from Nature PPSN VI; Springer: Berlin/Heidelberg, Germany, 2000. [Google Scholar]
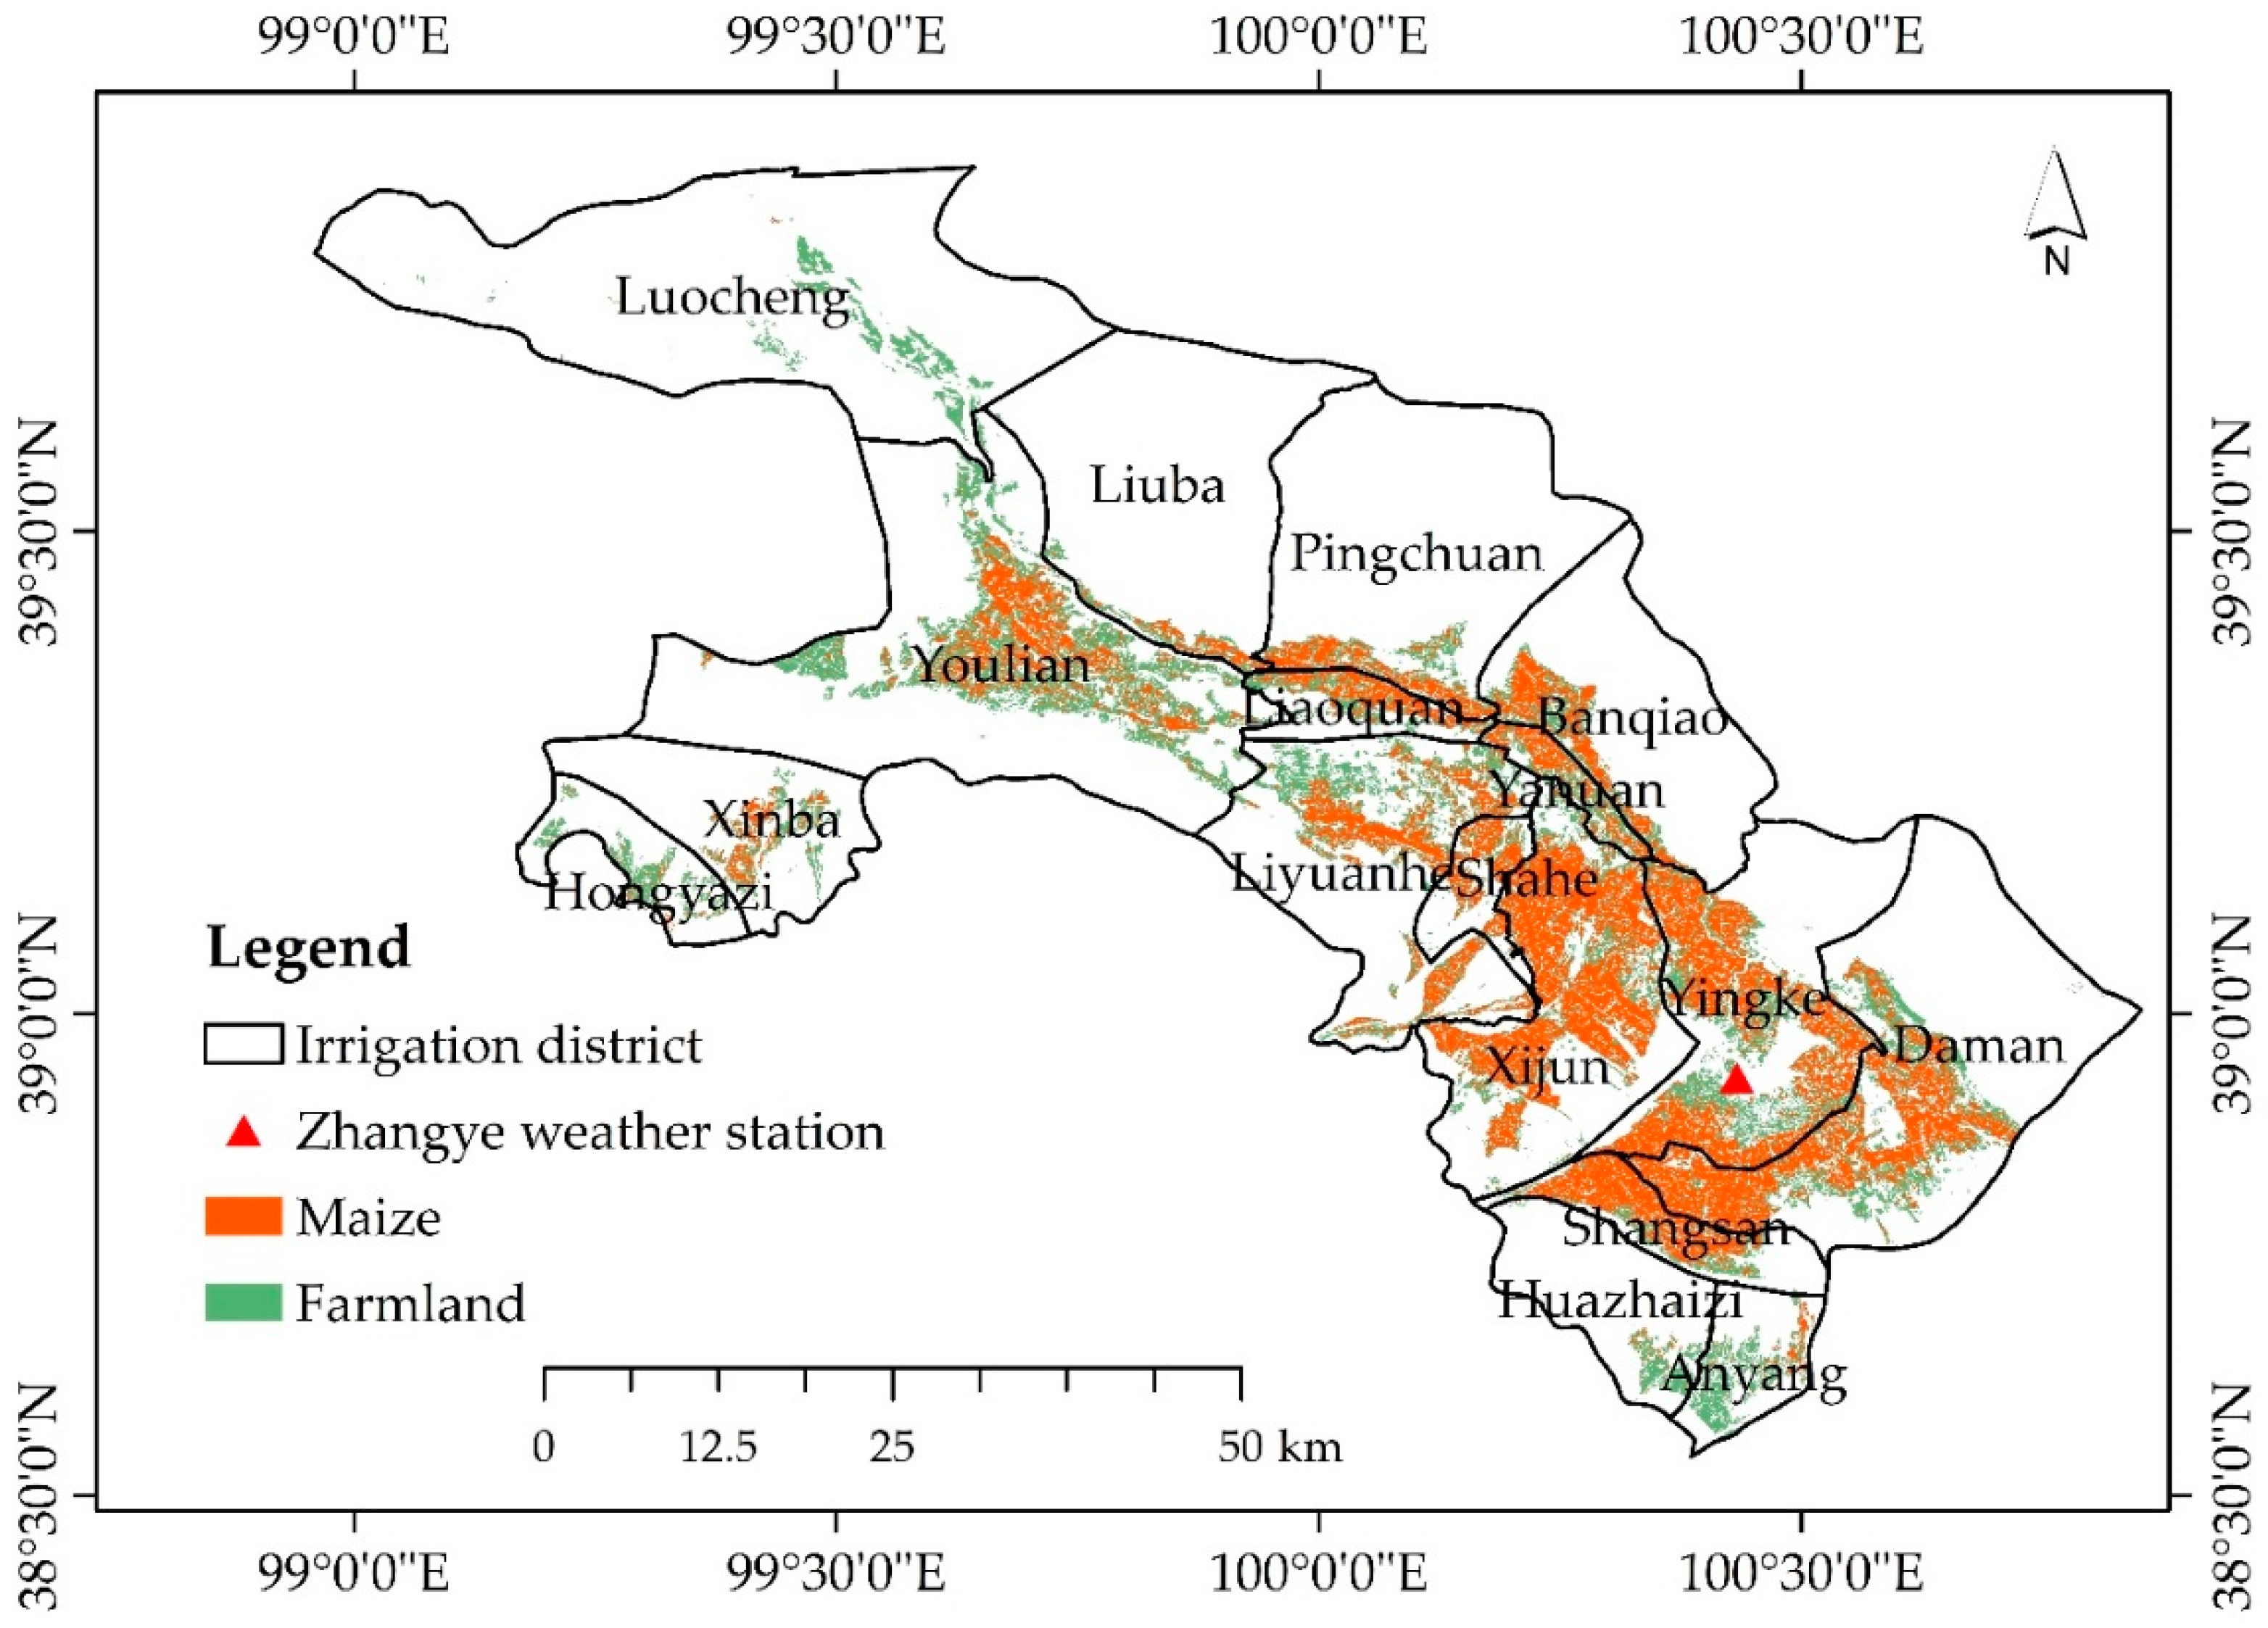
Figure 1. Geographic location of the study area and distribution of maize.
Agronomy 10 00935 g001
Figure 2. Distribution of the soil samples and soil types.
Agronomy 10 00935 g002
Figure 3. Framework of Simulation–Optimization Model for irrigation scheduling.
Agronomy 10 00935 g003
Figure 4. Reference evapotranspiration (ET0) and precipitation (P) under different climate years.
Agronomy 10 00935 g004
Figure 5. Results of soil water balance simulation model calibration (a) and validation (b). Note that DAP means “days after planting”.
Agronomy 10 00935 g005
Figure 6. Relationship curves between maximal crop yield and minimal crop water consumption during 2001 to 2010.
Agronomy 10 00935 g006
Figure 7. Mean values of soil water consumption and supply (positive means supply, negative means consumption, ET means evapotranspiration, Q means deep percolation, ΔW means changes of water storage, Pre and Aft mean before and after optimization) during 2001 to 2010.
Agronomy 10 00935 g007
Figure 8. Distribution of annual evapotranspiration (ET), deep percolation, irrigation amount and crop yield during 2001 to 2010 in maize land before and after irrigation optimization conditions.
Agronomy 10 00935 g008
Figure 9. Annual evapotranspiration and crop yields of maize for different irrigation districts during 2001 to 2010 before and after irrigation optimization conditions.
Agronomy 10 00935 g009
Figure 10. Soil water consumption and supply (positive means supply, negative means consumption, ET means evapotranspiration, Q means deep percolation, ΔW means changes in water storage) under different climate changes.
Agronomy 10 00935 g010
Figure 11. Distribution of minimal evapotranspiration (ET) and maximal crop yield under different climate years after irrigation optimization conditions.
Agronomy 10 00935 g011
Table 1. The soil types along the soil profile.
Soil TypeSoil Texture
0–80 cm80–140 cm
T1Silt loamSilt loam
T2Silt loamSandy loam
T3Silt loamLoam
T4LoamLoam
Table 2. Calculated parameters of soil water balance simulation model.
Soil Typeθf (m3/m3)θc (m3/m3)θw (m3/m3)ab
T10.350.310.100.114.97
T20.350.310.150.124.77
T30.340.310.070.124.97
T40.340.310.090.144.51
Table 3. Optimal irrigation schedules under different soil types in Danman Irrigation District in 2010.
Soil TypeT1T2T3T4
Irrigation ScheduleDate (DAP 1)Depth (mm)Date (DAP 1)Depth (mm)Date (DAP 1)Depth (mm)Date (DAP 1)Depth (mm)
First irrigation306220471488915
Second irrigation4651455044662814
Third irrigation7081665765875482
Fourth irrigation 9780888595628465
1 DAP means “days after planting”.
Table 4. Optimal irrigation schedules under different soil types in Danman Irrigation District under different climate changes.
Climate YearsSoil TypeT1T2T3T4
Irrigation ScheduleDate (DAP 1)Depth (mm)Date (DAP 1)Depth (mm)Date (DAP 1)Depth (mm)Date (DAP 1)Depth (mm)
WetFirst irrigation2596197229682273
Second irrigation5090489151463718
Third irrigation8049789781915759
Fourth irrigation 91919150106548364
NormalFirst irrigation2415248527662158
Second irrigation5375497247963799
Third irrigation7698759871586132
Fourth irrigation 8626814893687587
DryFirst irrigation2857306529993056
Second irrigation4914447950764737
Third irrigation7199569779726396
Fourth irrigation 9496749995837248
1 DAP means “days after planting”.