Article

Current and Future Potential Distribution of Wild Strawberry Species in the Biodiversity Hotspot of Yunnan Province, China

1
Yunnan Institute of Microbiology, School of Life Sciences, Yunnan University, Kunming 650091, China
2
State Key Laboratory for Conservation and Utilization of Bio-Resources in Yunnan, Yunnan University, Kunming 650091, China
3
Kunming Academy of Agricultural Science, Kunming 650034, China
*
Authors to whom correspondence should be addressed.
Agronomy 2020, 10(7), 959; https://doi.org/10.3390/agronomy10070959
Submission received: 17 June 2020 / Revised: 28 June 2020 / Accepted: 1 July 2020 / Published: 3 July 2020

Abstract

:
Based on 243 current valid distribution records for six wild strawberry species in China and data on 20 environmental variables, the geographical distributions of and potentially suitable areas for the wild strawberry species in Yunnan Province (China) under the current climate scenario were explored using the MaxEnt model and ArcGIS software, and major environmental variables affecting their geographical distributions were evaluated. In addition, the spatio-temporal dynamic patterns of the suitable areas for the six wild strawberry species in Yunnan Province in the 2050s and 2070s under the two climate models of RCP2.6 and RCP8.5 were predicted. Under the current climate scenario, the six wild strawberry species have suitable areas in Yunnan Province, which were mainly distributed in the high-altitude and low-temperature regions in the northwest and northeast, such as Diqing and Zhaotong. In addition, the average size of the highly suitable area for diploid wild strawberry species was greater than that for tetraploid species. Under the future climate scenarios, the average size of the highly suitable area for diploid species showed a tendency to expand, while that of tetraploid species showed a tendency to shrink. Altitude was a critical variable affecting the distribution of tetraploid species. Under the two future climate models of RCP2.6 and RCP8.5, the suitable areas for wild strawberry species shifted to the regions of high latitude, high altitude, and low temperature. In addition, the average distance in the shift of the suitable area for tetraploid strawberry species was greater than that for the suitable area for diploid strawberry species. The above results provide valuable information for the management and protection of the germplasm resources of Fragaria.

Graphical Abstract

1. Introduction

Climate is a primary factor determining the geographical and spatial ranges of species, and climate warming has an impact on the natural environment and species distributions [1]. At present, research on the relationships between plants and climate is a hot topic in botany, ecology, and biogeography. With an area of 394,000 km2 (4.1% of China’s total area), Yunnan Province is a biodiversity hotspot in China and around the world. It is known as China’s ‘‘Treasure House’’ of biological diversity because it is where three of the 34 global biodiversity hotspots (the Himalayas, India-Myanmar region, and mountainous areas in southwest China) overlap [2,3,4]. As a result of its particular geographical location, landform features and diverse climatic conditions, Yunnan Province, known as the “Kingdom of Plants” and “Kingdom of Animals”, ranks first in terms of biological diversity and the proportion of endemic species in China [5].
However, the biological diversity in Yunnan Province, similar to what is occurring in the rest of the world, is facing significant impacts from global environmental change and has become one of the most sensitive regions to future climate change [6,7]. According to the fifth assessment report (AR5) from the Intergovernmental Panel on Climate Change (IPCC), the average temperature of Earth’s surface has increased by 0.85 degrees over the past 130 years (1880 to 2012) [8,9]. Previous studies have shown that climate change can lead to changes in the suitable range for species while driving species in core distributional regions to shift to higher elevations or latitudes [10,11]. Under the continuous influence of global warming, fluctuating trends of increasing annual average temperature and increasing or decreasing precipitation in different periods and an uneven distribution of climatic factors in different regions may be observed in Yunnan Province [4]. In addition, climate change may lead to the extinction of some species and may shrink or destroy the habitats of wild animals [12] and plants [10,13]. Therefore, assessing the impacts of climatic variables on the geographical distribution patterns of species will aid the understanding of the effects of global climate change on the biodiversity hotspots of Yunnan. Such studies will also provide theoretical and practical guidance for formulating effective strategies for biodiversity conservation and the rational use of wild resources.
Previous studies have indicated that the MaxEnt model can simulate the distribution of species under different climate scenarios based on the close relationship between incomplete locality information and environmental variables [14,15]. This model can provide the best results for the potential distribution of species when there are few distribution locality data points (fewer than 20) [16]. Due to its simple operation, small necessary sample size, and high simulation precision, the MaxEnt model has been used to predict the suitable geographical distribution of various species by researchers in China and around the world, including those of animals [11,12,17], invasive insects [18], medicinal plants [7], plant diseases [19,20], and animal diseases [21].
Strawberries belong to the genus Fragaria of the family Rosaceae, which includes herbaceous perennial plants according to the Taxonomy of Chinese Fruit Trees [22,23]. There are approximately 24 species of Fragaria around the world. Additionally, 14 of the 24 species are naturally distributed in China, including eight diploid species, five tetraploid species, and one pentaploid species [24,25,26]. Therefore, China has more abundant wild strawberry resources than any other countries in the world. According to the “Flora of China” and “Flora of Yunnan”, Yunnan is the province with the richest wild strawberry germplasm resources in China [27,28], including four diploid species (2n = 2x = 14, F. vesca, F. nilgerrensis, F. pentaphylla and a new record F. nubicola), and three tetraploid species (2n = 4x = 28, F. orientalis, F. moupinensis, and F. gracilis). The dictionary of medicinal plants suggests that F. vesca, F. nilgerrensis, F. nubicola, F. orientalis, and F. moupinensis show various indications of reducing inflammation, detoxification, and eliminating wind and cough. In addition, these types of strawberry plants can be used to treat multiple ailments, such as canker sores, dysentery, traumatic injuries, and envenomation. Therefore, wild strawberry resources have significant medicinal value, and wild strawberry germplasm resources can be used as ideal breeding materials for strawberry cultivars [29]. Previous studies on wild strawberry plants have focused on, for example, their geographical distributions, the protection of germplasm resources, the genetic and historical evolution of the genus Fragaria, functional gene and genome analysis, karyotype analysis, and the physiological and biochemical analysis of wild strawberry plants [24,30]. However, studies on wild strawberry spatio-temporal dynamic patterns and ecological suitability for these plants have rarely been reported. In the context of climate change, the migration and diffusion of wild strawberry species, as well as their response and adaptation to climate warming, remain to be further studied.
This study thus uses the MaxEnt model, six wild strawberry species, including three diploid species (F. vesca, F. nilgerrensis, and F. pentaphylla) and three tetraploid species (F. orientalis, F. moupinensis, and F. gracilis), and three climate scenarios (current, 2050s, and 2070s) to predict the suitable areas in Yunnan Province. The primary purposes of this study are to (1) assess the dynamic spatio-temporal patterns of the suitable ranges of six wild strawberry species under different climate scenarios, (2) identify the critical environmental factors affecting the scope of the suitable areas, (3) evaluate whether climate warming is likely to lead to a change in the range of suitable areas and a shift of the centroid of suitable areas, and (4) determine whether there is a close relationship between the ploidy of wild strawberry species and climate change. The aim of this study is to provide a scientific basis for the rational protection and utilization of wild strawberry species.

2. Materials and Methods

2.1. Wild Strawberry Species Data

Yunnan Province, known as the “Kingdom of Plants”, “Kingdom of Animals”, and one of the global biodiversity hotspots, ranks first in terms of biological diversity in China. It is a region for researchers to conduct ideal geography and climate model research. We collected coordinate information for six wild strawberry species from authoritative databases [15,16,20,27,28], including the Global Biodiversity Information Facility (http://www.gbif.org), the National Specimen Information Infrastructure (http://www.nsii.org.cn), the Scientific Database of China Plant Species (http://db.kib.ac.cn), and the Flora of China (http://www.iplant.cn). The six wild strawberry species mentioned above, including three diploid species (F. vesca, F. nilgerrensis, F. pentaphylla) and three tetraploid species (F. orientalis, F. moupinensis, and F. gracilis), are distributed in China. To verify the accuracy of the predicted suitable geographical and spatial distributions for these six wild strawberry species in the biodiversity hotspot of Yunnan Province, we used their occurrence records in China. Finally, when the model prediction results were obtained, the distribution results for these strawberry species in Yunnan Province were extracted with ArcGIS 10.2 software (Environmental Systems Research Institute, Redlands, CA, USA).
Only distribution localities representing sites where the six wild strawberry species naturally occur and records from the five above databases with latitude and longitude coordinates were retained [15,16]. Data points with coordinates that were distributed where these species do not naturally occur, such as in greenhouses, botanical gardens, and schools, were removed. Then, with the help of ArcGIS 10.2 software, duplicate distribution localities were deleted, and the data were spatially filtered so that only one point occurred within each grid cell (10 × 10 km) [16,20]. Finally, the numbers of occurrence records for the six wild strawberry species were 24 for F. vesca, 85 for F. nilgerrensis, 20 for F. pentaphylla, 47 for F. orientalis, 33 for F. moupinensis and 34 for F. gracilis, resulting in different maps of occurrence records for each of the six wild strawberry species in China (Figure 1). All valid distribution locality data, such as the species name, longitude, and latitude for each strawberry species, were imported into Microsoft Excel 2013 (Microsoft, Redmond, WA, USA) and stored in six different CSV-format files (Table S1).

2.2. Current Environmental Variables

To predict the suitable areas for the six wild strawberry species in Yunnan Province, China, we selected 19 climate environmental factors and an altitude factor as the 20 major environmental variables (Table S2). We downloaded data for the 19 environmental variables (BIO1-BIO19) from WorldClim-Global Climate Data (http://www.worldclim.org, the new version 2.1 for the current period) in raster format at 2.5-arc-minute resolution [15,31]. The digital elevation model (DEM) for China with 250 m resolution was derived from the Institute of Geographic Sciences and Natural Resources Research, CAS (Resource and Environment Data Cloud Platform, http://www.resdc.cn/Default.aspx) [16]. The 20 environmental variables were spatially correlated, which might lead to prediction overfitting. Therefore, we used the jackknife test to evaluate the contribution percentage of each environmental variable and removed variables with a lack of contribution rate (contribution rate = 0) [32]. To avoid multicollinearity among these environmental variables, environmental data from all distribution points for each wild strawberry species were extracted from layers of the 20 environmental variables using ArcGIS 10.2 software. SPSS 20.0 software was used to calculate the Pearson correlation coefficients (r) of the environmental variables with a percent contribution greater than zero (Table S3). Then, if two environmental variables were highly correlated (|r| ≥ 0.8), the one with the greatest contribution rate was retained, and the other variable was removed (Table S4); all environmental variables with a low correlation (|r| ˂ 0.8) were retained [33].

2.3. Future Environmental Variables Data

Two relatively extreme climate models, RCP2.6 (the minimum greenhouse gas scenario) and RCP8.5 (the maximum greenhouse gas scenario) were selected for two periods of the 2050s (2041 to 2060) and 2070s (2061 to 2080) for the future prediction of suitable areas for the six wild strawberry species [8]. Therefore, four scenarios, 2050-RCP2.6, 2070-RCP2.6, 2050-RCP8.5, and 2070-RCP8.5, were downloaded under the CCSM4 model from WorldClim-Global Climate Data. Data for the 19 climate environmental parameters were also provided for each scenario, which were consistent with the current parameters. The environmental variable of altitude remained unchanged under the four future climate scenarios. The screening of future environmental variables was of importance in determining the accuracy of the predictive model (Tables S3 and S4). Therefore, the 20 future environmental variables were screened using the same method as for the current environmental variables.

2.4. Distribution Modeling and Statistical Analysis

The MaxEnt software (version 3.4.1, from the website http://biodiversityinformatics.amnh.org/open_source/maxent/) was used for distribution modeling in this study [16]. All the environmental variables that were screened under the current and future scenarios were resampled to the same cell size as China’s administrative division map, and the base map of China was downloaded from the Institute of Geographic Sciences and Natural Resources Research, CAS (resource and environment data cloud platform). The most essential options of random test percentage and replicates in the MaxEnt software were set to 25 and 10, respectively [16,21,32]. The receiver operating characteristic (ROC) curve and the area under the ROC (AUC) curve were calculated using MaxEnt software to evaluate the accuracy of the models [34]. Yunnan’s administrative boundary (CAS, Resource and Environment Data Cloud Platform, http://www.resdc.cn/Default.aspx) from each distribution map was extracted with spatial analysis tools in ArcGIS 10.2. Then, we reclassified the areas in the extracted map and classified them into four categories according to the method of Jenks [35]. The suitable areas were calculated using the Zonal and Overlay tools; spatial analysis tools were also used to calculate the core distribution shifts and centroid coordinates for each suitable area in ArcGIS 10.2 (Environmental Systems Research Institute, Redlands, CA, USA). All statistical analyses and graph creation in the present study were performed using SPSS 20.0 (IBM Corp., Armonk, NY, USA), Microsoft Excel 2013 (Microsoft, Redmond, WA, USA), and OriginLab 2019b software (OriginLab, Northampton, MA, USA).

3. Results

3.1. Screening of the Environmental Variables under Different Climate Scenarios

In this study, our results indicated that a total of eight, eight, five, six, seven, and six environmental variables under the current scenario were screened for the predictive analysis of F. nilgerrensis, F. vesca, F. pentaphylla, F. orientalis, F. moupinensis, and F. gracilis, respectively (Tables S3 and S4). With regard to F. nilgerrensis, the Table S4 showed that we have successfully screened out eight environmental variables under the current scenario for future analysis in the current sheet, such as altitude, mean diurnal range (BIO2), temperature seasonality (BIO4), temperature annual range (BIO7), mean temperature of driest quarter (BIO9), annual precipitation (BIO12), precipitation seasonality (BIO15), and precipitation of coldest quarter (BIO19). Meanwhile, the results of Tables S3 and S4 also illustrated that different wild strawberry species had different environmental variables under different climatic scenarios.

3.2. Model Performance and Contributions of the Selected Environmental Variables

The suitable areas for the six wild strawberry species were predicted using the selected critical environmental variables. According to the ROC curves and AUC values, the accuracy of the distribution models for the six wild strawberry species under the different climate scenarios indicated that they were “good” and “excellent” models [33]. Table 1 showed all mean AUC values for the six wild strawberry species under the different climate scenarios considering the ten replicates. Among them, F. nilgerrensis (AUCmean = 0.947–0.953), F. pentaphylla (AUCmean = 0.915–0.929), F. moupinensis (AUCmean = 0.954–0.957), and F. gracilis (AUCmean = 0.928–0.938) had mean AUC values greater than 0.9 under the five climate scenarios and were thus excellent models, while F. vesca and F. orientalis had average values of between 0.845 and 0.872 and were thus good models. The ROC curves (Figures S1 and S2) indicated that all models could accurately evaluate the distributions of the six wild strawberry species. Therefore, all predictive models and results in this study have high credibility and accuracy, and further results can scientifically reveal the impacts of climate change on the distributions of the six wild strawberry species in Yunnan Province, China.
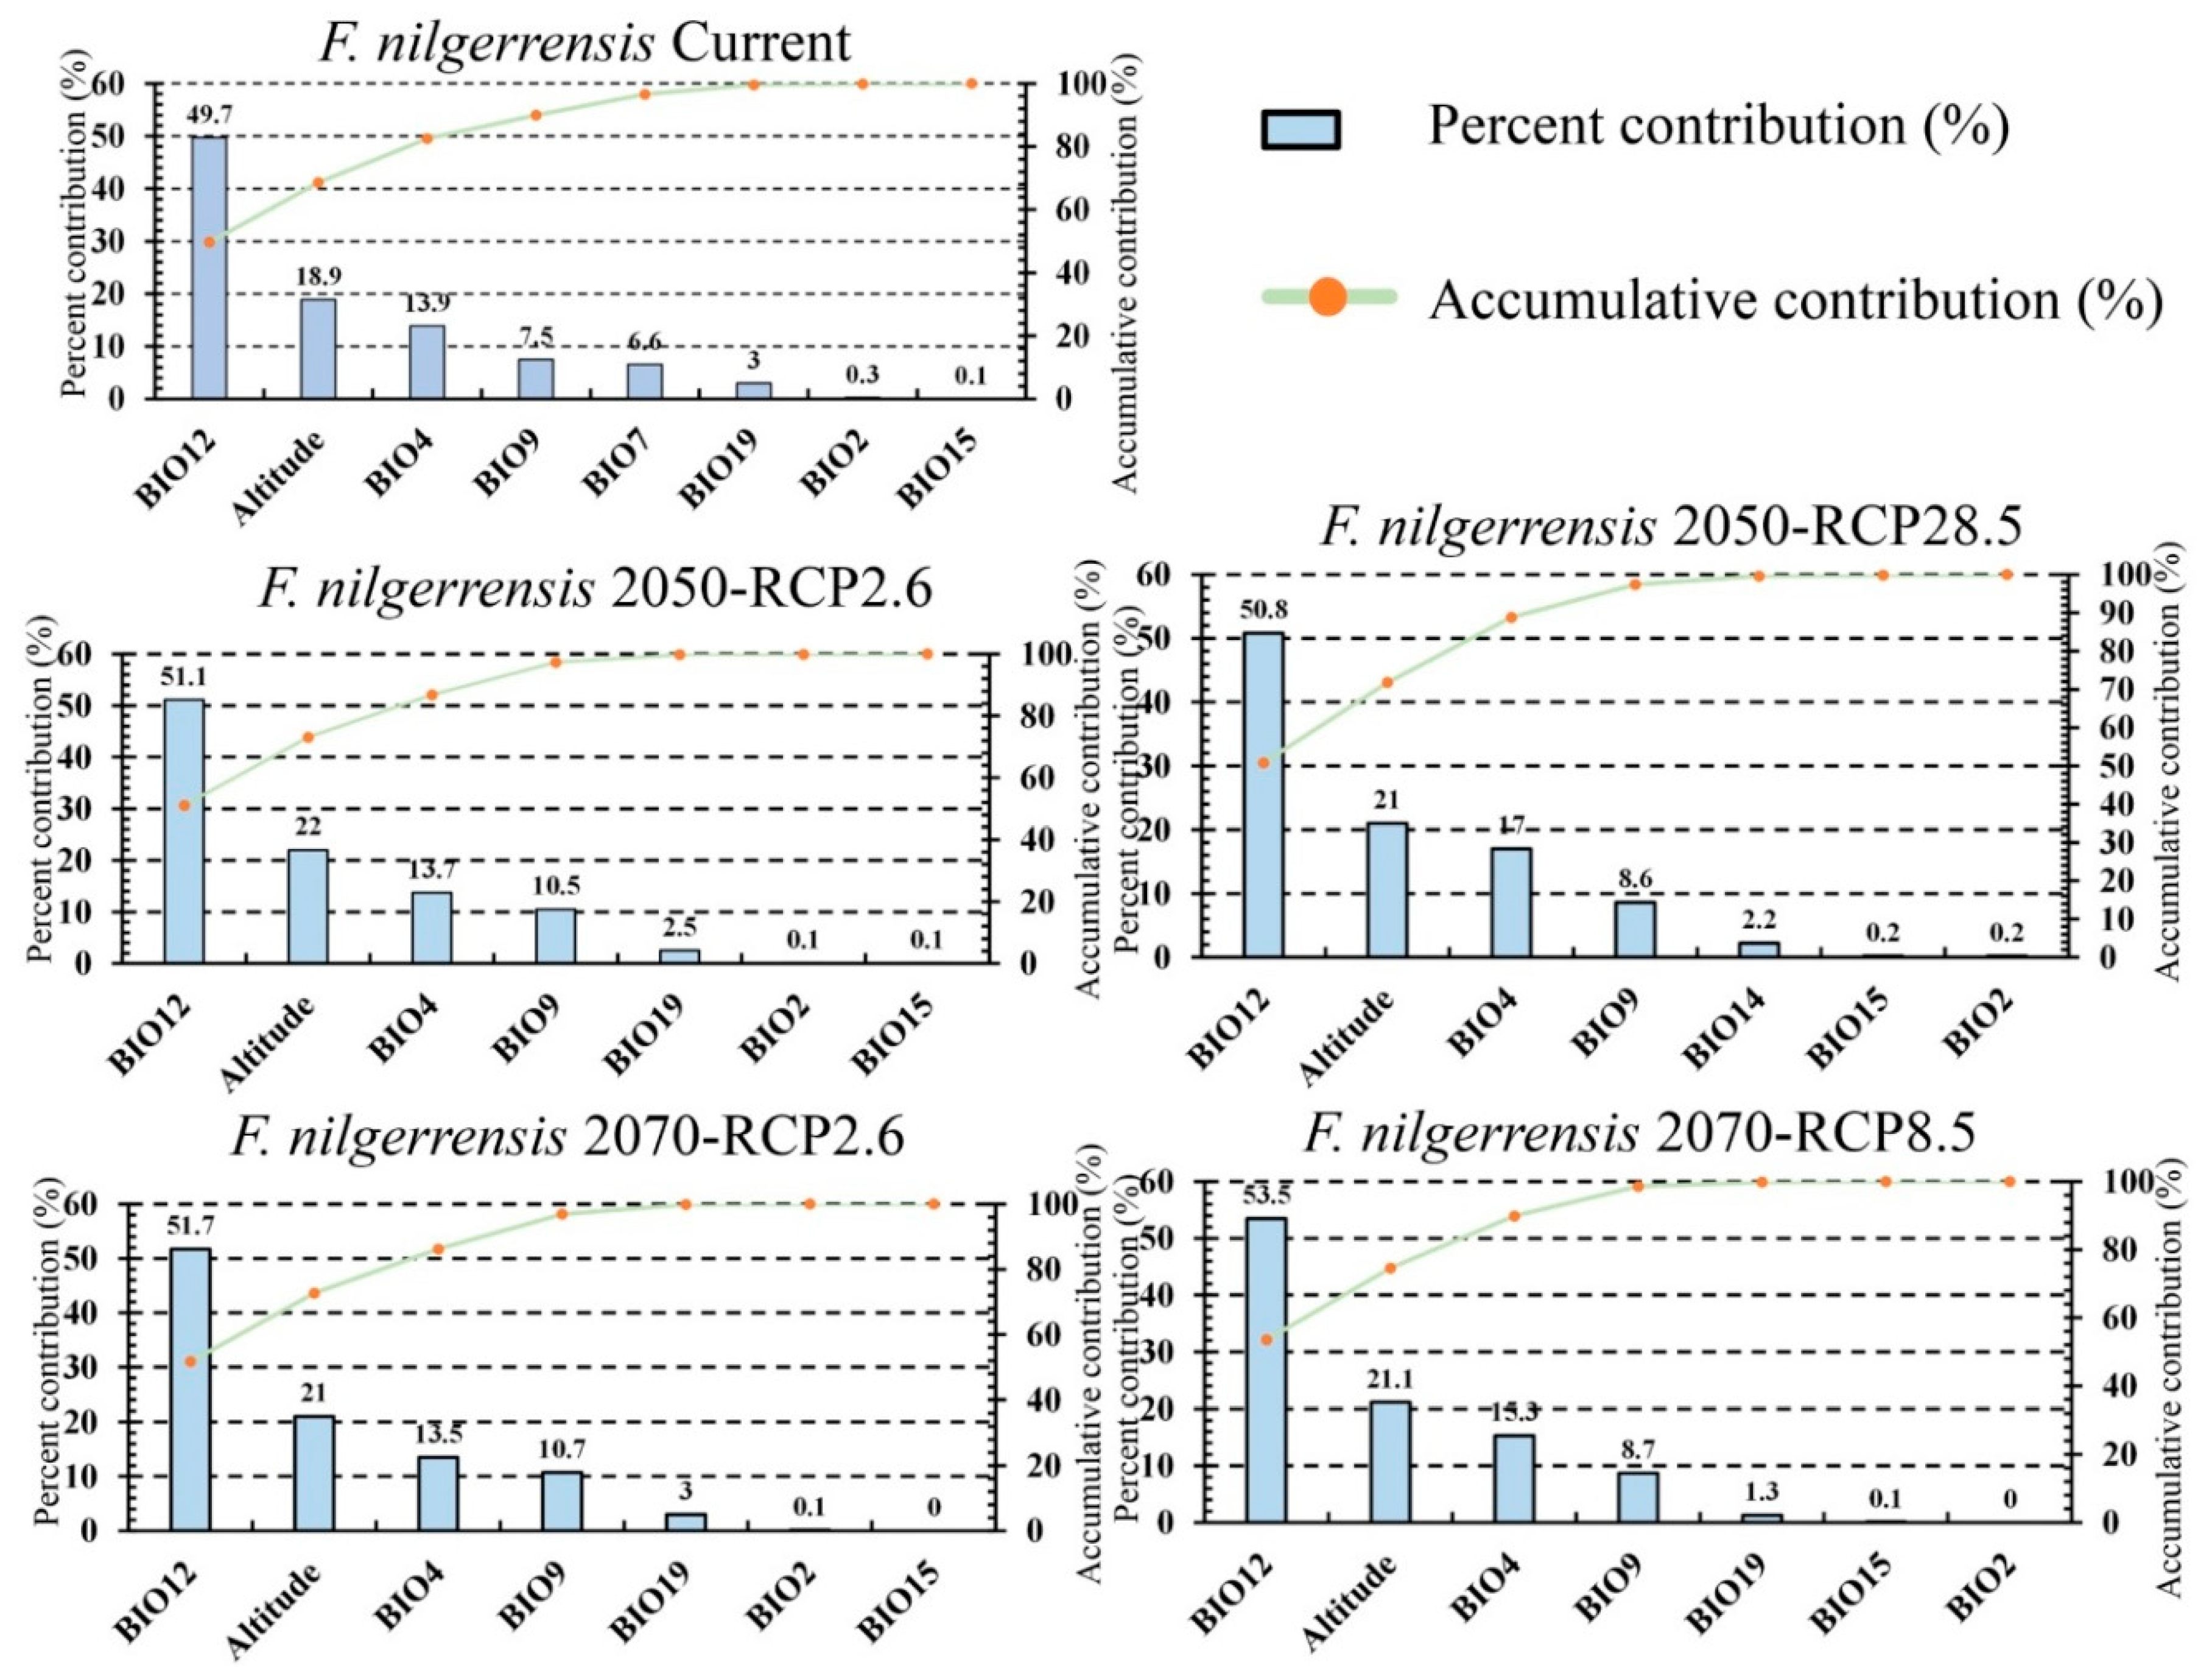
We also found that the top three environmental variables in terms of percent contribution for F. nilgerrensis (Figure 2, Table S2) under the five different climate scenarios were annual precipitation (BIO12), altitude, and temperature seasonality (BIO4), and their total accumulative contribution rate was greater than 82.5%. At the same time, we also found that other wild strawberry species, such as F. vesca (Figure S3), F. pentaphylla (Figure S4), F. orientalis (Figure S5), F. moupinensis (Figure S6), and F. gracilis (Figure S7), were affected by different (top three) environmental variables under different climate scenarios. Under the current and future scenarios, the cumulative contribution rates of all environmental variables screened for each wild strawberry species reached 100%, indicating that the above environmental variables played a crucial role in the modeling process. Meanwhile, it also illustrated that all predictive models and results in the present study had high credibility and accuracy.

3.3. Important Environmental Variables and Their Effects on Chinese Fragaria Distributions

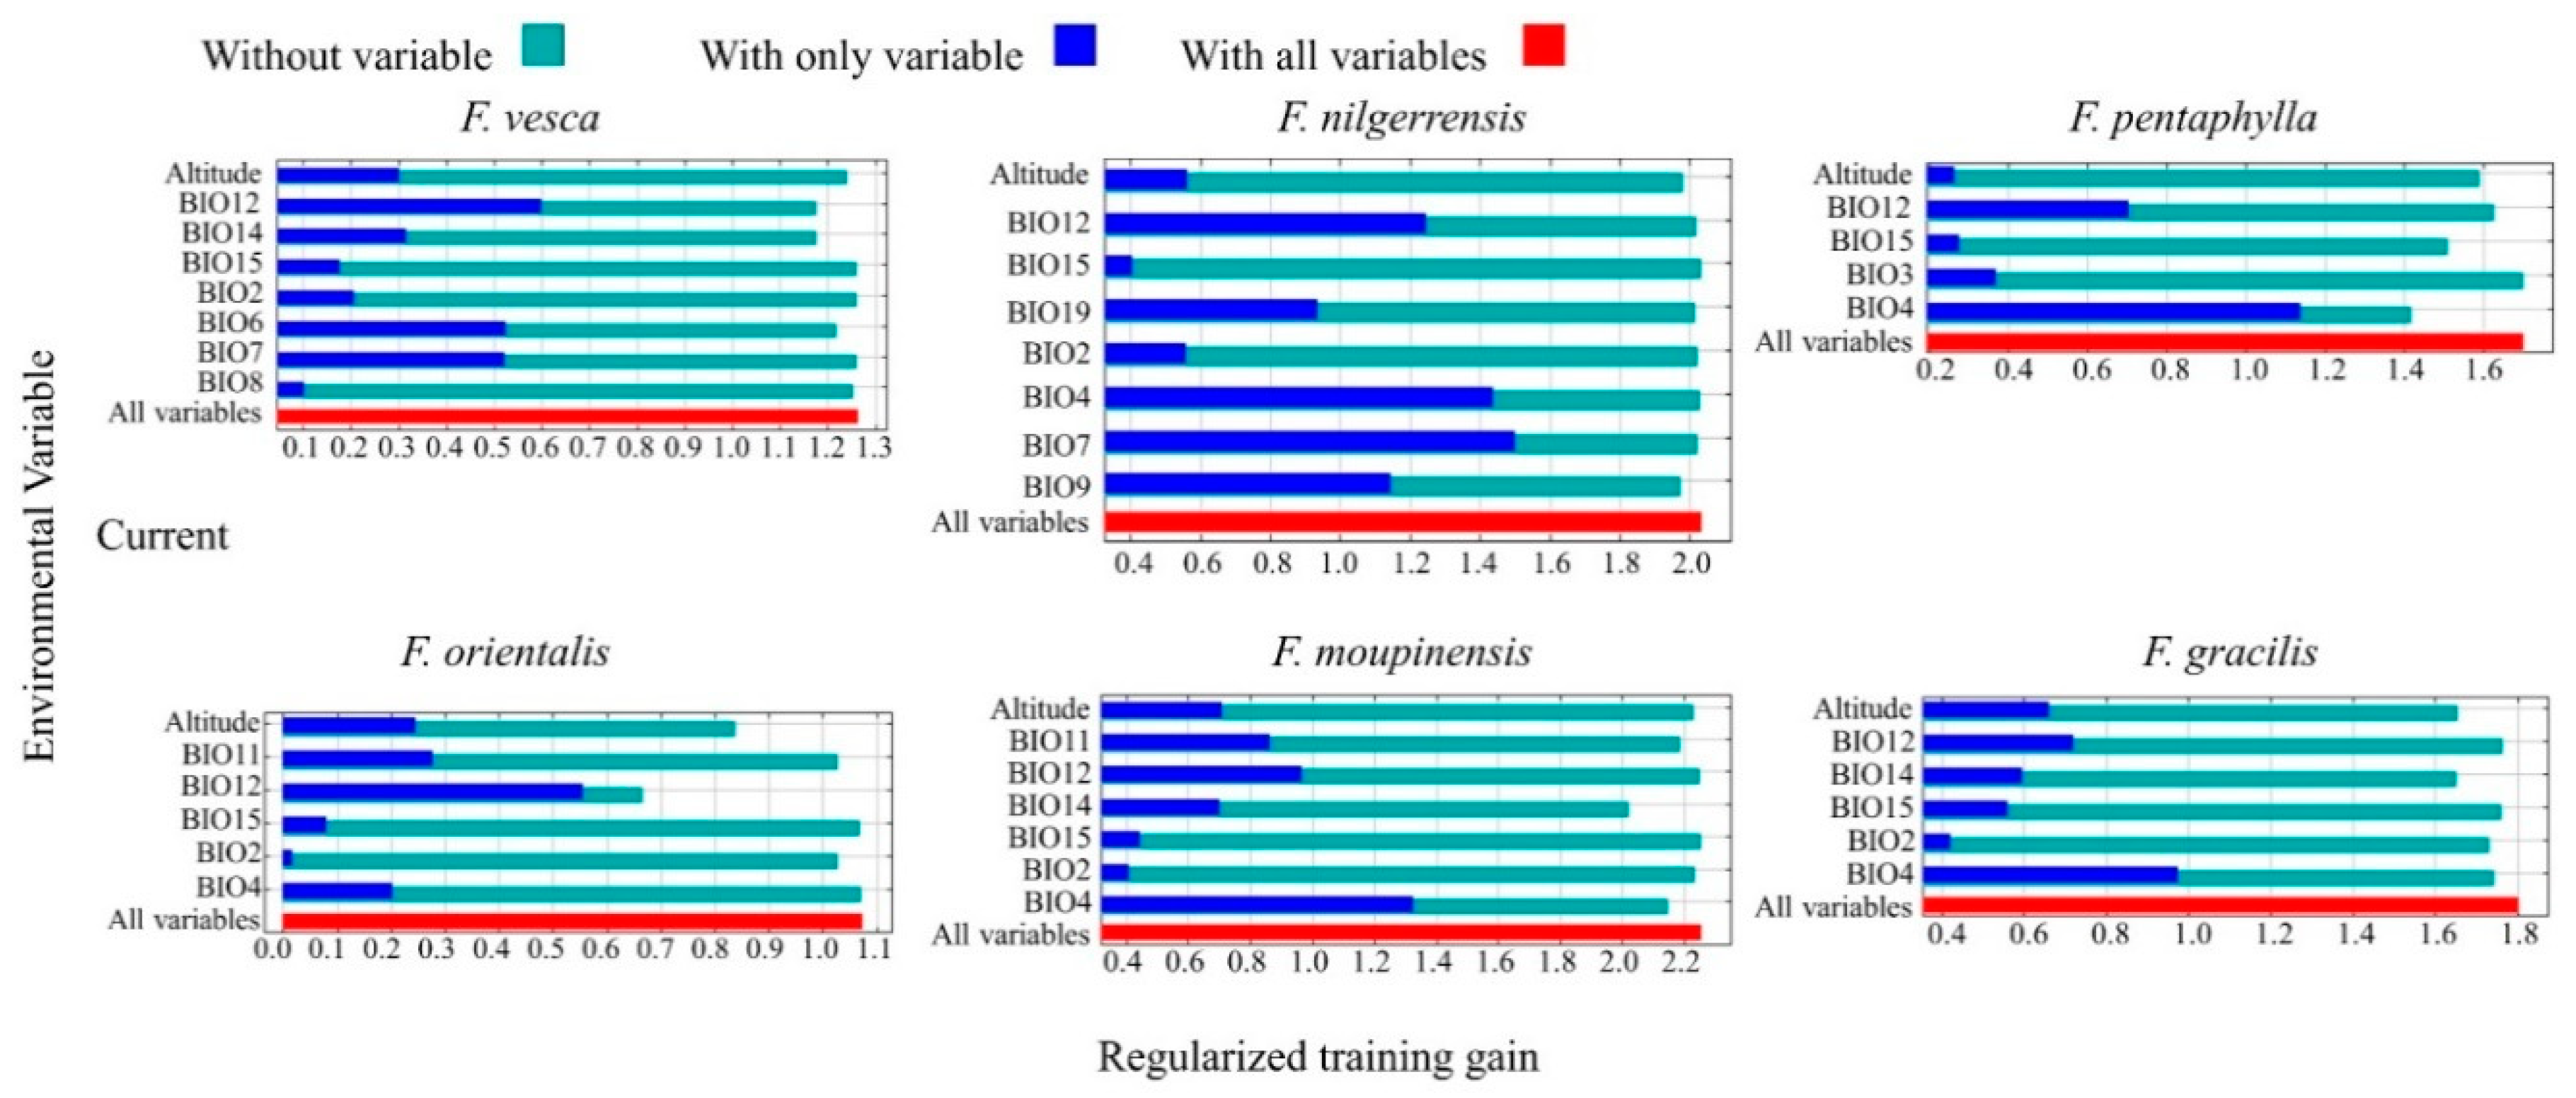
The jackknife test can be used to evaluate the importance of environmental variables by calculating the parameters of regularized training gain. The results of the jackknife test for six strawberry species are shown in Figure 3 (Table S2), showing that altitude, temperature, and precipitation are the dominant environmental variables affecting the spatio-temporal dynamic patterns of the six wild strawberry species, but the effects of the environmental variables varied among the different species and in the context of climate change. In addition, the four main environmental variables affecting the distributions of both diploid and tetraploid wild strawberry species were found to be temperature seasonality (BIO4), min temperature of coldest month (BIO6), precipitation of driest month (BIO14), and altitude. The environmental variables that were unique in regard to influencing the distributions of diploid strawberry species were isothermality (BIO3), temperature annual range (BIO7), and mean temperature of driest quarter (BIO9), and the environmental variables that were unique in regard to affecting the distributions of tetraploid strawberry species were the mean temperature of coldest quarter (BIO11) and precipitation of coldest quarter (BIO19).
The relationship between the probability of the presence of the six wild strawberry species and environmental variables can be demonstrated according to the response curves of the six wild strawberry species for the dominant environmental variables (Figures S8 and S9). It was generally assumed that when the value of the probability of presence was greater than 0.5 [32], the values of the corresponding environmental variables were suitable for the growth of the strawberry species. With regard to F. nilgerrensis, the results showed (Table 2 and Table S2) that the suitable range of temperature seasonality ranged from 3528.1 ± 66.4 to 5415.9 ± 69.8 and that the optimum value of the probability of presence was 4437.1 ± 71.2. The optimum values of temperature annual range and annual precipitation were 23.3 ± 0.1 °C and 1045.3 ± 48.9 mm, respectively. Interestingly, we could find from Table 2 and Table S2 that different wild strawberry species were affected by different suitable ranges of critical environmental variables for the six wild strawberry species. Even if different wild strawberry species were affected by the same climate environmental variables, these values of the probability of presence were different, and the optimal values of critical environmental variables were also different.

3.4. Potential Distribution in Yunnan Province, China, under Five Climate Scenarios

3.4.1. Current Potential Distribution of Six Wild Strawberry Species

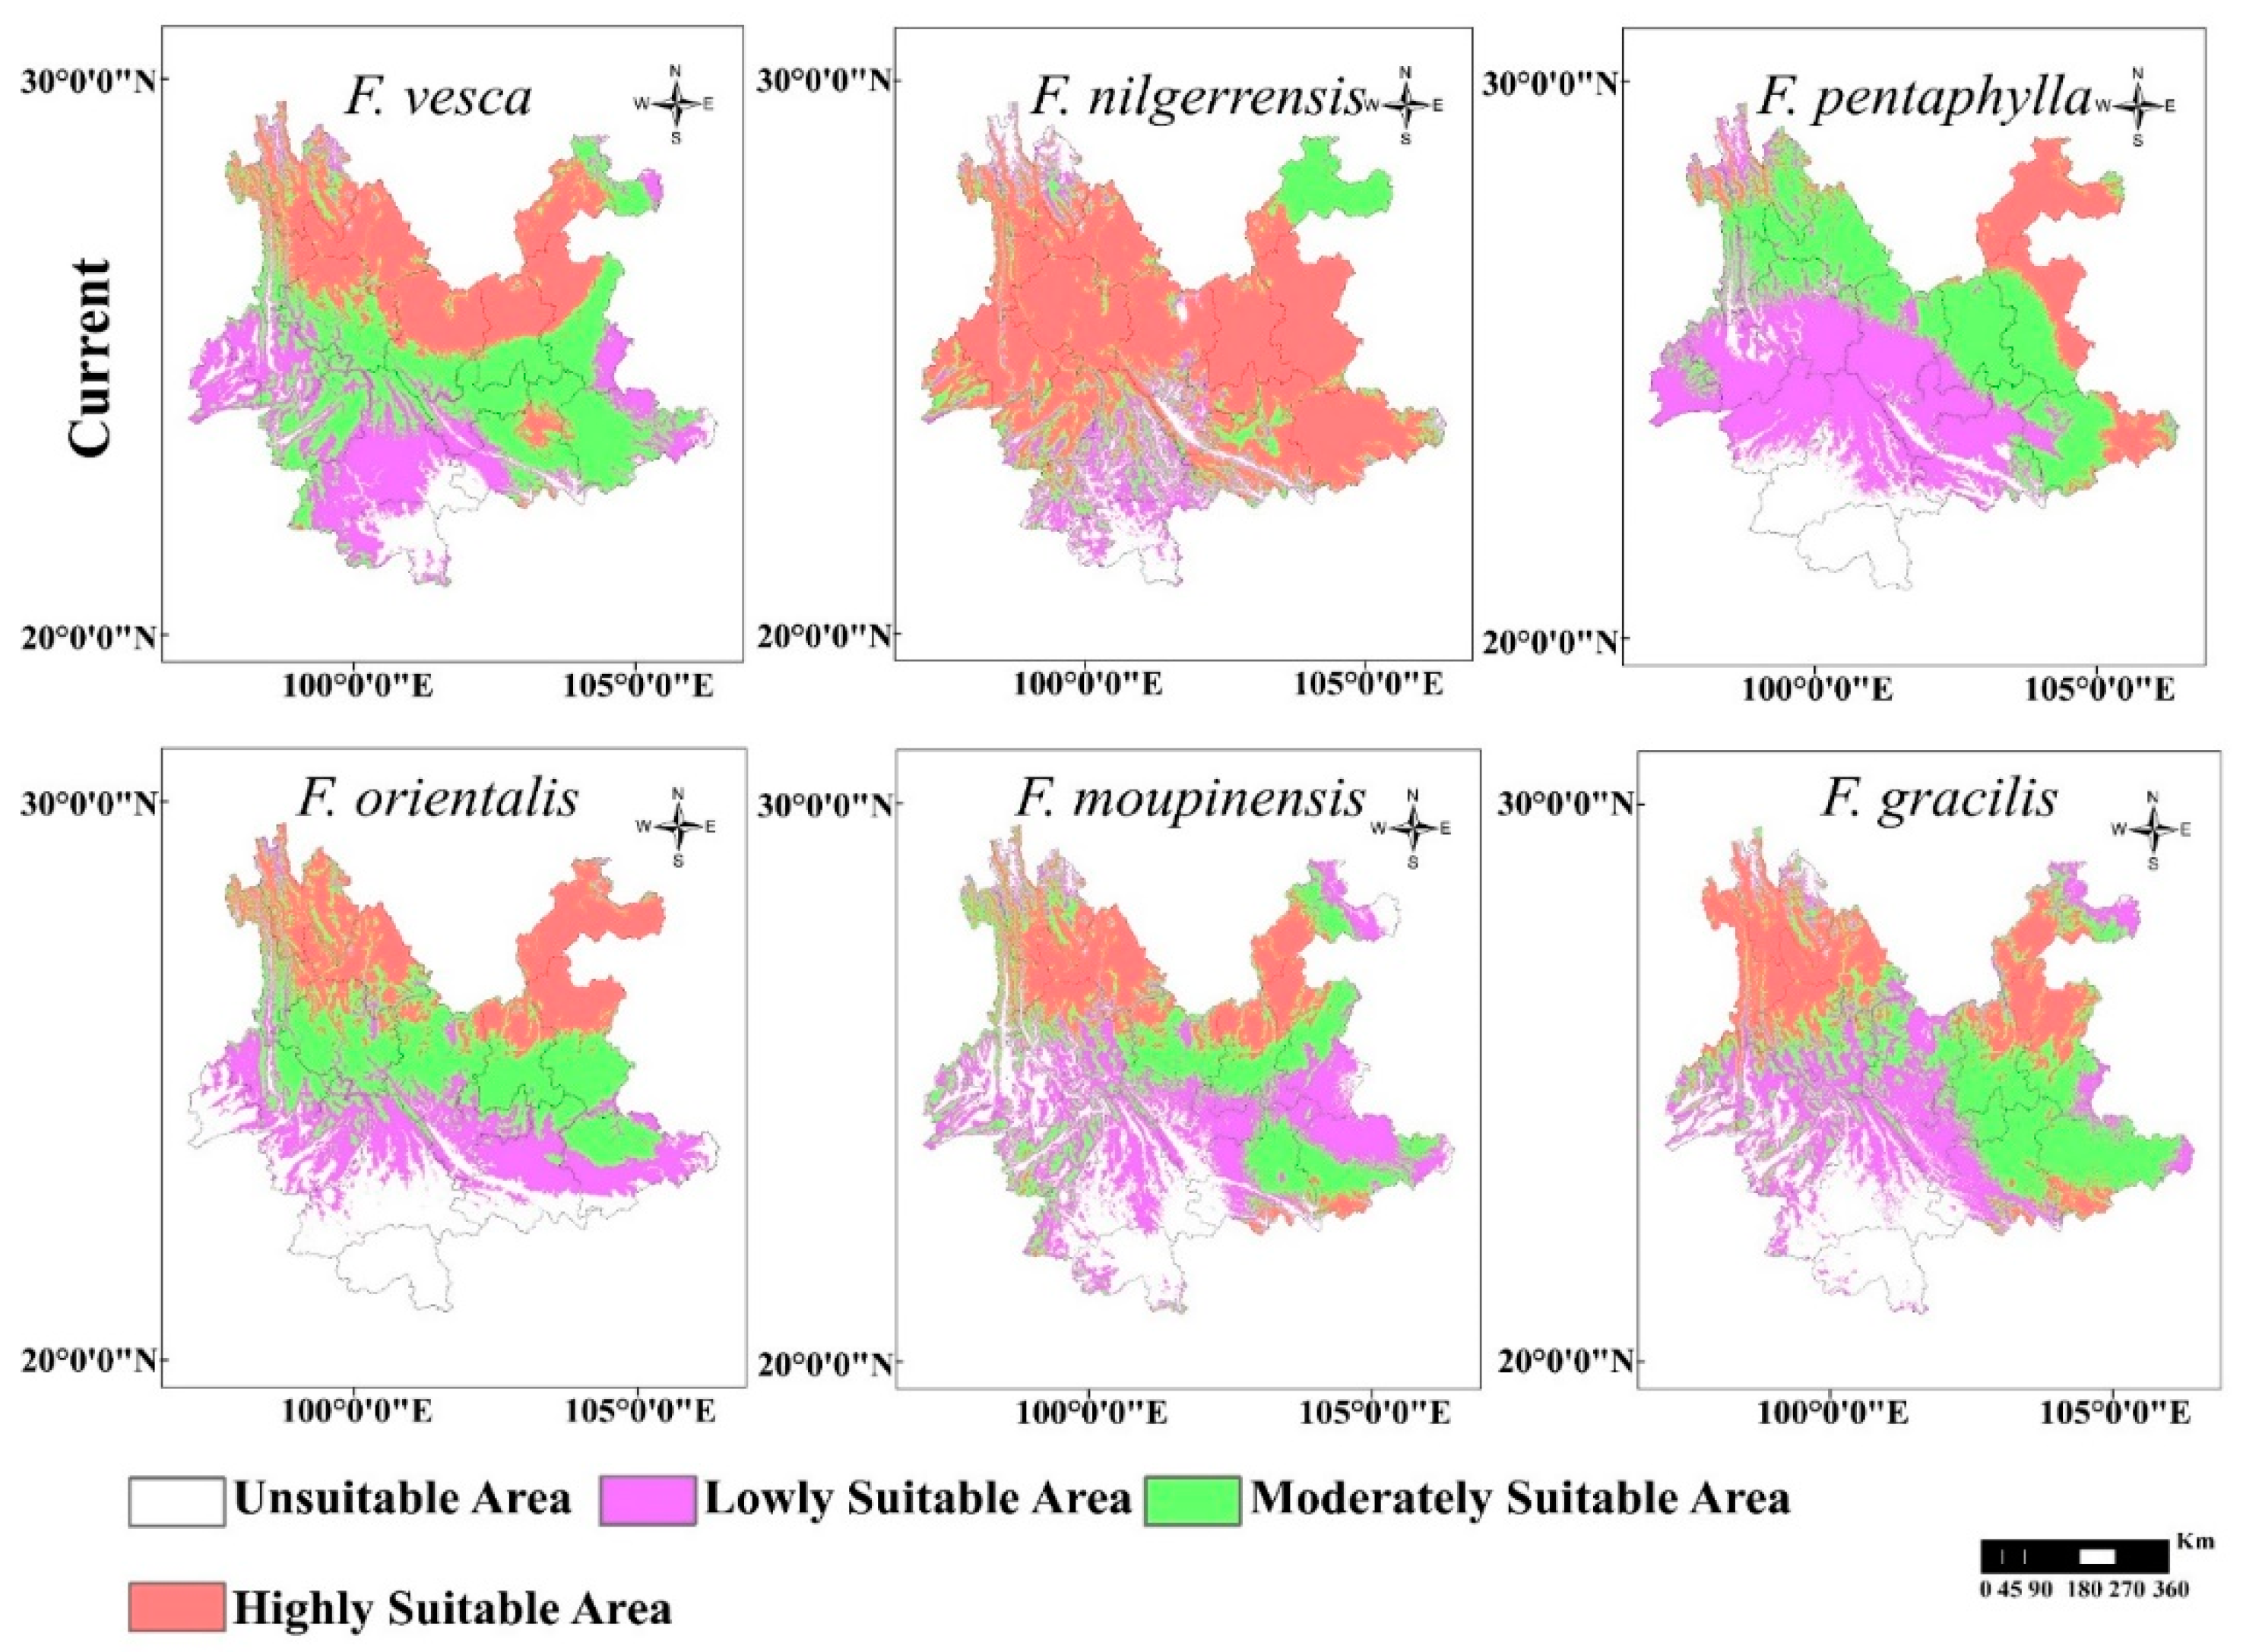
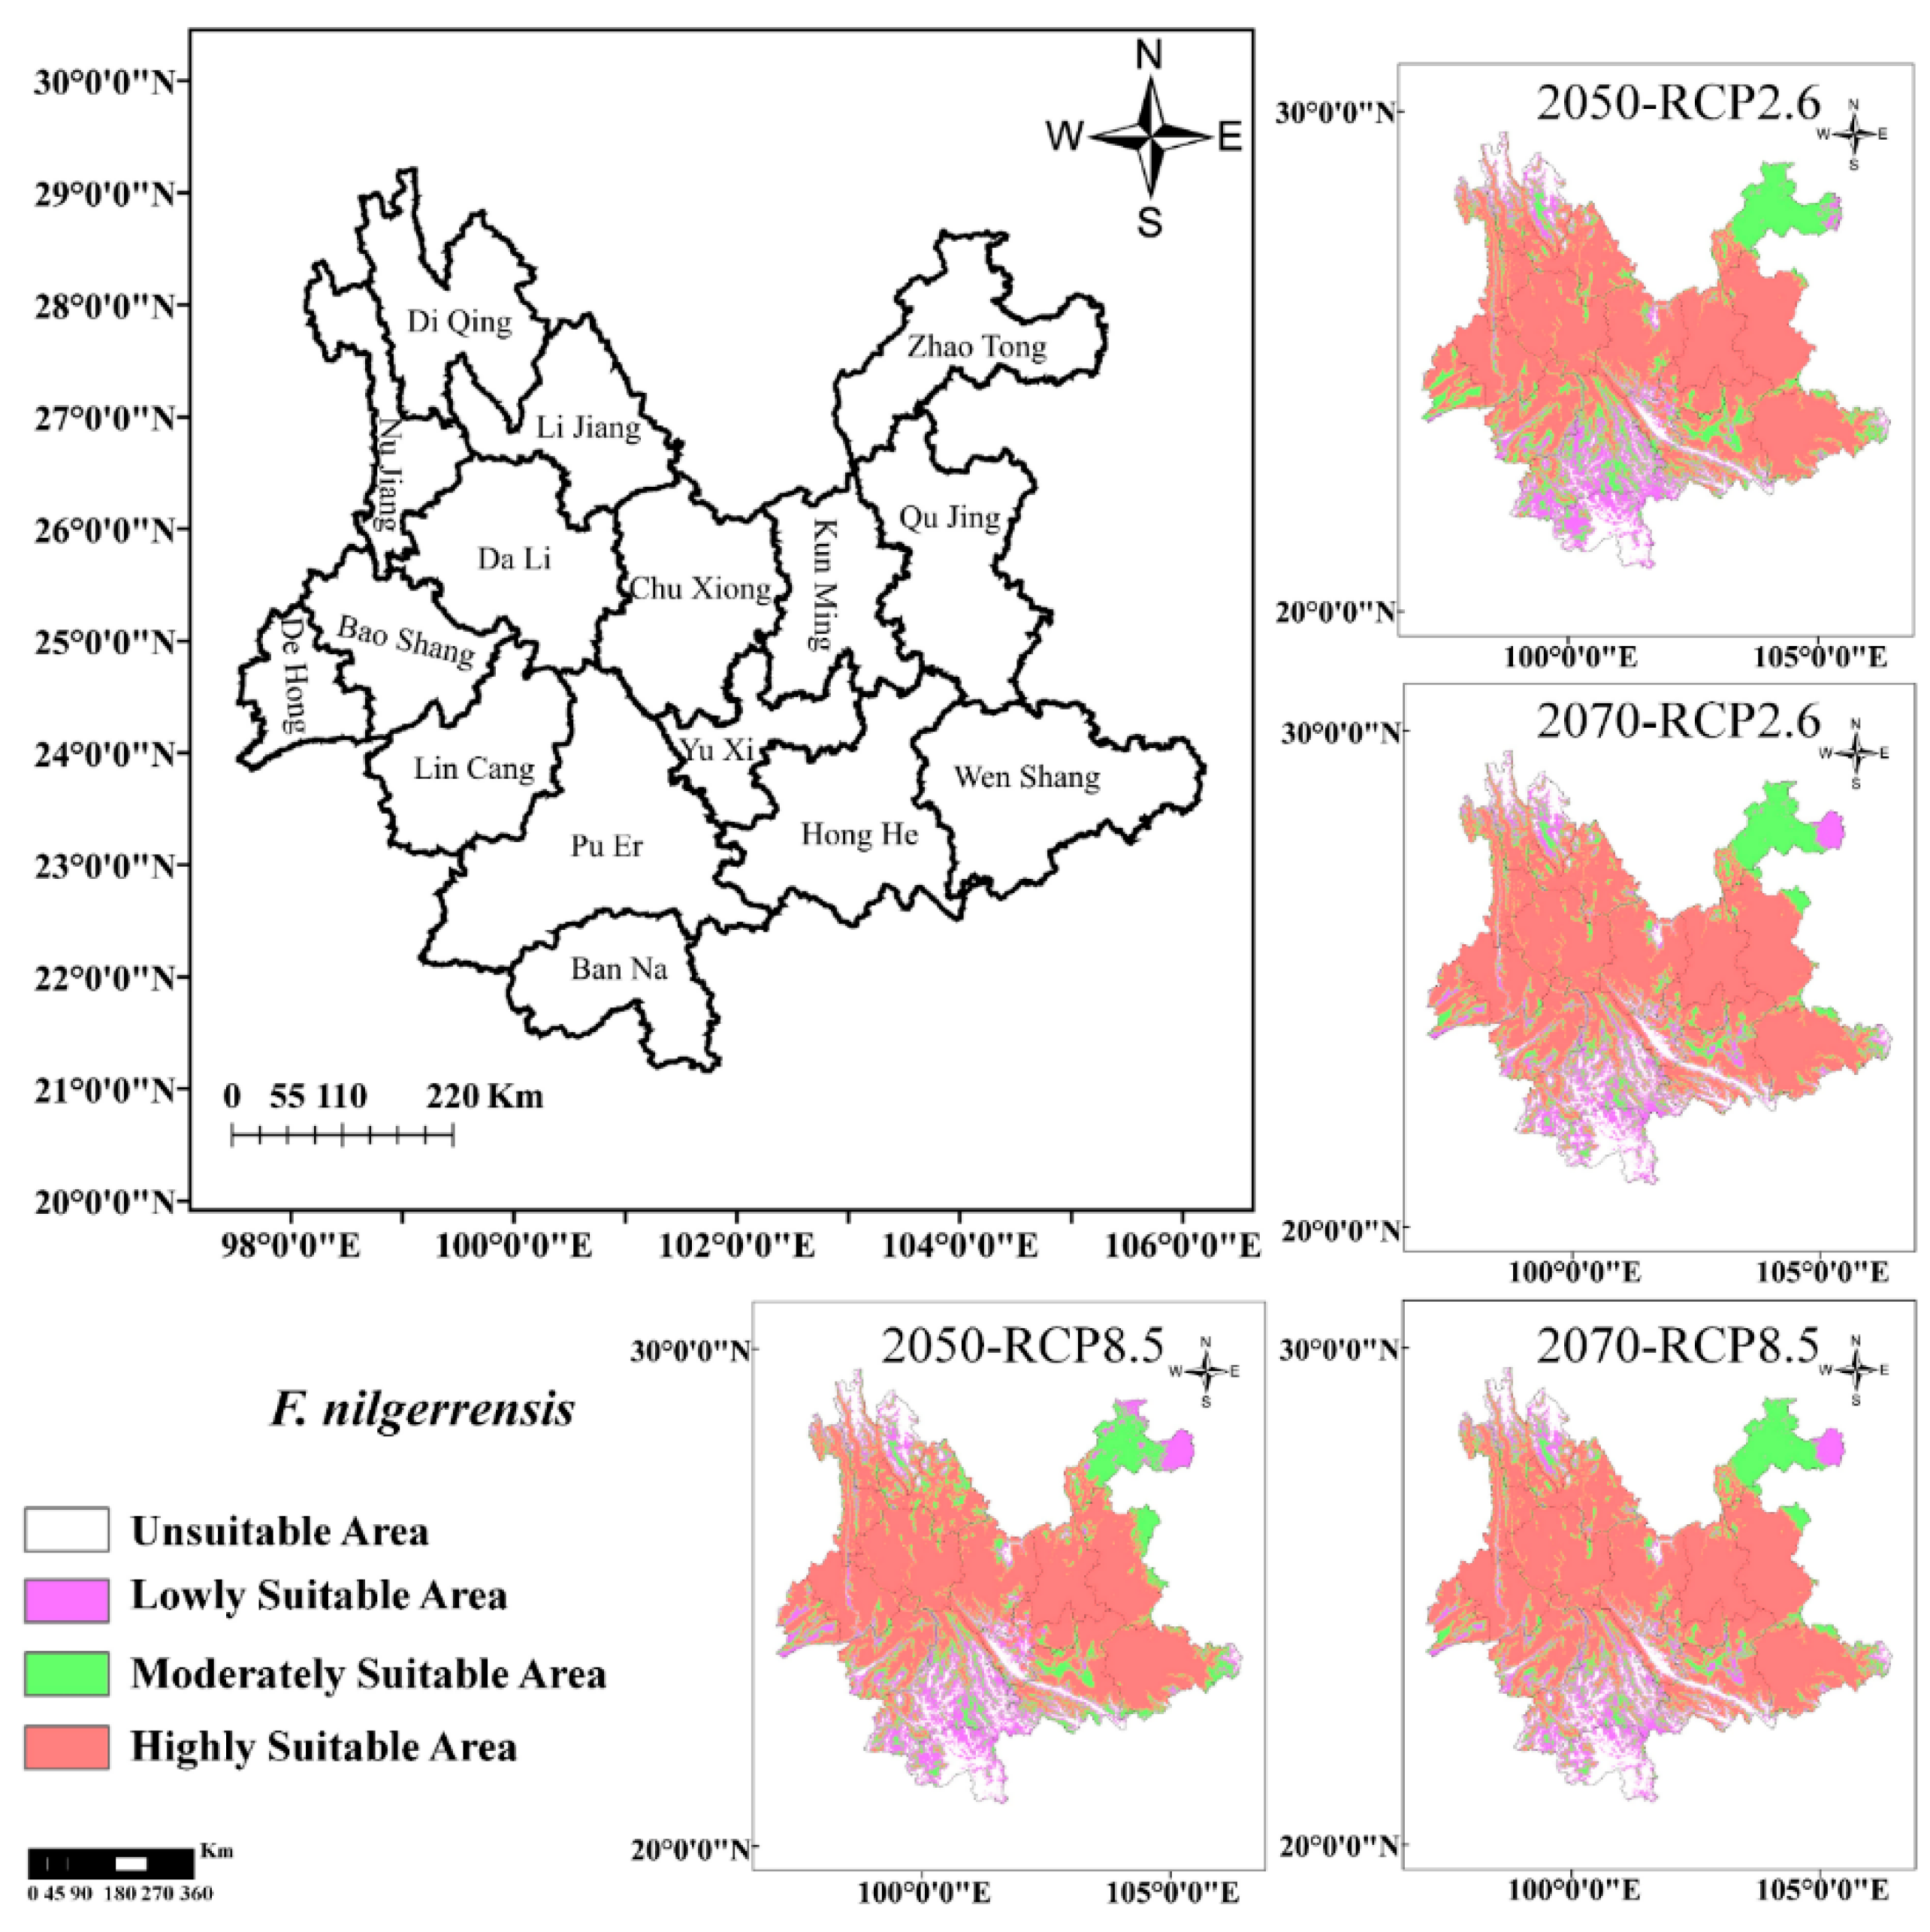
According to the classification criteria of the suitable area of the species in the “Materials and Methods” section, distribution maps for the six wild strawberry species in the suitable areas under the current climate scenario were obtained (Figure 4). Figure 4 and Figure 5 showed that the highly suitable areas for F. nilgerrensis are mainly distributed in the central (Chuxiong and Kunming), eastern (Qujing and Wenshan), north-eastern (Zhaotong), and north-western (Lijiang, Dali, and Diqing) regions of Yunnan Province. This species has the most extensive distribution of the six wild strawberry species in Yunnan Province, and its highly, moderately, and lowly suitable areas are 23.56 × 10⁴ km2, 7.61 × 10⁴ km2, and 4.92 × 10⁴ km2 in total area, respectively (Table 3). The highly suitable area for F. vesca is mainly distributed in the central (Chuxiong and Kunming), north-eastern (Zhaotong), and north-western (Diqing) regions of Yunnan Province; its highly, moderately, and lowly suitable areas are 10.81 × 10⁴ km2, 15.36 × 10⁴ km2, and 9.92 × 10⁴ km2 in size, respectively. The highly suitable areas for F. pentaphylla are mainly distributed in the eastern (Qujing and Wenshan), north-eastern (Zhaotong), and north-western (Diqing) regions of Yunnan Province; its highly, moderately, and lowly suitable areas are 5.01 × 10⁴ km2, 12.92 × 10⁴ km2, and 14.68 × 10⁴ km2 in size, respectively. Figure 4 also shows that the highly suitable areas for F. orientalis, F. moupinensis, and F. gracilis are mainly distributed in the central (Kunming), eastern (Qujing), north-eastern (Zhaotong), and north-western (Lijiang, Dali, and Diqing) regions of Yunnan Province; their highly suitable areas are 8.58 × 10⁴ km2, 7.19 × 10⁴ km2, and 8.76 × 10⁴ km2 in size, respectively. Overall, these results indicate that the north-eastern (Zhaotong) and north-western (Diqing) regions of Yunnan Province are highly suitable areas for the six wild strawberry species. Therefore, these two regions may have abundant wild strawberry resources. In addition, the order of the six wild strawberry species in terms of highly suitable area is F. nilgerrensis > F. vesca > F. gracilis > F. orientalis > F. moupinensis > F. pentaphylla; these results show that the average value of the highly suitable area for diploid strawberry species (13.13 × 10⁴ km2) was higher than that for tetraploid strawberry species (8.18 × 10⁴ km2).

3.4.2. Future Potential Distribution of the Six Wild Strawberry Species

In the present study, two extreme climate models (RCP2.6 and RCP8.5) were selected to assess the potential distributions of and changes in suitable areas for six wild strawberry species in two periods of the 2050s and 2070s. The results are shown below. (1) With regard to F. nilgerrensis, Figure 5 and Table S5 demonstrate that highly suitable areas under the 2050-RCP2.6 and 2070-RCP2.6 scenarios show an increasing trend in comparison to those under the current scenario, increasing by 0.17 × 10⁴ km2 and 0.09 × 10⁴ km2, respectively; however, the highly suitable areas were reduced by 1.19 × 10⁴ km2 and 3.93 × 10⁴ km2 under the 2050-RCP8.5 and 2070-RCP8.5 scenarios, respectively. Overall, the average value of the highly suitable area for F. nilgerrensis decreased by 1.22 × 10⁴ km2. (2) For F. vesca, the highly suitable areas under the 2050-RCP8.5 and 2070-RCP8.5 scenarios showed an increasing trend in comparison to those under the current scenario, increasing by 2.67 × 10⁴ km2 and 3.486 × 10⁴ km2, respectively; the highly suitable area increased by 0.78 × 10⁴ km2 under the 2050-RCP2.6 scenario but decreased by 0.44 × 10⁴ km2 under the 2070-RCP2.6 scenario, as shown in Figure S10 and Table S5. Overall, the average value of the highly suitable area for F. vesca increased by 1.62 × 10⁴ km2. (3) For F. pentaphylla, the highly suitable areas under the 2050-RCP8.5, 2070-RCP2.6, and 2070-RCP8.5 scenarios showed an increasing trend in comparison to those under the current scenario, increasing by 4.37 × 10⁴ km2, 3.10 × 10⁴, and 2.33 × 10⁴ km2, respectively; however, the suitable area declined by 0.82 × 10⁴ km2 under the 2050-RCP2.6 scenario, as shown in Figure S11 and Table S5. Overall, the average value of the highly suitable area for F. pentaphylla increased by 2.25 × 10⁴ km2. (4) For F. orientalis, the highly suitable areas under the 2050-RCP2.6, 2050-RCP8.5, and 2070-RCP8.5 scenarios showed a decreasing trend in comparison to those under the current scenario, decreasing by 0.564 × 10⁴ km2, 0.60 × 10⁴, and 3.08 × 10⁴ km2, respectively; however, the suitable area increased by 2.08 × 10⁴ km2 under the 2070-RCP2.6 scenario, as shown in Figure S12 and Table S5. Overall, the average value of the highly suitable area for F. orientalis decreased by 0.54 × 10⁴ km2. (5) F. moupinensis (Figure S13 and Table S5) and F. gracilis (Figure S14 and Table S5) were the two most extraordinary species; the highly suitable areas under four different scenarios showed an increasing trend and a decreasing trend in comparison to those under the current scenario. Therefore, the average value of the highly suitable area for F. moupinensis increased by 1.86 × 10⁴ km2, and that for F. gracilis decreased by 2.01 × 10⁴ km2. Interestingly, we also found that the average value of the highly suitable area for the diploid wild strawberry species under the four future scenarios increased by 0.88 × 10⁴ km2 in comparison to that under the current scenario, while that for the tetraploid strawberry species decreased by 0.23 × 10⁴ km2. In summary, this study found that the distribution areas of the species are expected to both expand and contract under the four future scenarios and that many distribution regions overlap between the future and current scenarios.

3.5. Shifts in the Centroid of the Total Suitable Areas

Based on the MaxEnt model data, a spatial analysis of the species distributions was carried out to study the characteristics of the shifts of the geometric center (centroid) of the suitable areas for the six wild strawberry species from the current scenario to four future climate scenarios. Figure 6 showed that the five centroids of the suitable areas for five wild strawberry species under the current scenario (F. nilgerrensis, F. vesca, F. pentaphylla, F. gracilis, and F. orientalis) were located in different regions of Pu’er City, while that of F. moupinensis was situated in the region of Yuxi City.
(1) From the current scenario to the future scenarios, the centroids of the suitable area for F. vesca were expected to shift to low latitudes in the southwest; the distance of the shift in the centroid coordinates from the current to the 2070-RCP2.6 and 2070-RCP8.5 climate scenarios were approximately 15.15 km and 60.72 km to the southwest, respectively. (2) For F. nilgerrensis, the centroid of the suitable area was predicted to shift to Chuxiong in the northeast under the four future scenarios, indicating that the centroid coordinates moved to high latitudes. Furthermore, the distances of the shift in the centroid coordinates from the current scenario to the 2070-RCP2.6 and 2070-RCP8.5 climate scenarios were approximately 65.69 km and 51.80 km, respectively. (3) For F. pentaphylla, the centroid of the suitable area under future scenarios, the centroid was expected to shift to high latitudes in the northeast. The distance of the shift in the centroid coordinates from the current scenario to the 2070-RCP2.6 and 2070-RCP8.5 climate scenarios were approximately 6.87 km and 11.08 km to high latitudes in the northeast/north, respectively. (4) For F. orientalis, the four centroids of the suitable areas under the four future scenarios would shift to low latitudes in the southwest, and the distances of the shifts in the centroid coordinates from the current scenario to the 2070-RCP2.6 and 2070-RCP8.5 climate scenarios would be approximately 9.54 km and 17.20 km, respectively. (5) For F. moupinensis, under 2070-RCP2.6 and 2070-RCP8.5, the centroids of the suitable areas would also shift to low latitudes in the southeast (indicating a shift from Yuxi to Pu’er City). The distance of the shifts in the centroid coordinates from the current scenario to the 2070-RCP2.6 and 2070-RCP8.5 climate scenarios were found to be approximately 30.81 km and 55.17 km, respectively. (6) For F. gracilis, the four centroids of the suitable areas under the future scenarios would shift to high latitudes in the northeast (indicating a shift from Pu’er to Yuxi City), and the changes in the centroid coordinates from the current scenario to the 2070-RCP2.6 and 2070-RCP8.5 climate scenarios would be approximately 53.87 km and 72.48 km, respectively.
Overall, from the current scenario to the 2070s under both the RCP2.6 and RCP8.5 models, the centroids of the suitable areas for F. vesca, F. orientalis, and F. moupinensis were expected to shift to low latitudes, while those for F. nilgerrensis, F. pentaphylla, and F. gracilis were expected to shift to high latitudes. We also found that the distance of the shift in the centroid coordinates for F. gracilis from the current scenario to the 2070s under both the RCP2.6 and RCP8.5 models was the longest among the six wild strawberry species, while that for F. pentaphylla was the shortest. Interestingly, we also found that the centroids of the suitable areas for the three diploid species from the current scenario to the 2070s under both the RCP2.6 and RCP8.5 models shift to high latitudes, while those for the three tetraploid species shift to low latitudes. In addition, the average distances of the shifts in the centroid coordinates for the three diploid species from the current scenario to the 2070s under both the RCP2.6 and RCP8.5 models were approximately 24.61 km and 45.83 km, respectively; while those for the three tetraploid species were approximately 31.41 km and 48.28 km, respectively. Therefore, the average distances of the shifts in the centroids for the tetraploid species under both the RCP2.6 and RCP8.5 models were greater than those for the diploid species; in addition, the average distance of the shifts in the centroids for the six wild strawberry species was greater under the RCP8.5 models than under the RCP2.6 models.

4. Discussion

4.1. The Geographical Distribution of Wild Strawberry Species under the Current Scenario

In this study, distribution records and species distribution models for six wild strawberry species in China were used to predict their potentially suitable distribution areas in Yunnan Province, which is a global biodiversity hotspot. The results show that under the current scenario, suitable areas for the six wild strawberry species occur in Yunnan Province, which are mainly distributed in the north-western (Diqing) and north-eastern (Zhaotong) regions of the province. Among the evaluated species, the highly suitable area for F. nilgerrensis is the most widely distributed in Yunnan Province, and highly suitable area for F. pentaphylla is the least among the six wild strawberry species. According to the records of the “Flora of China” and “Flora of Yunnan”, the six wild strawberry species are distributed in Yunnan Province [27,28], which is consistent with the climate of the regions predicted in this study.
The records of the “Flora of Yunnan” show that F. nilgerrensis is distributed in Nujiang, Dali, Kunming, Wenshan and Qujing; F. vesca is mainly distributed in Lijiang and Diqing; F. pentaphylla is distributed primarily in Nujiang and Diqing; F. orientalis is distributed in Lijiang and Diqing; F. moupinensis is distributed in Diqing, Lijiang, Qujing and Nujiang; F. gracilis is distributed in Nujiang, Diqing and Lijiang [28]. In the present study, the identified potentially suitable regions for the six wild strawberry species contain the locations mentioned above, indicating that the prediction method used in this study is reliable and can scientifically and accurately predict the geographical distribution ranges of the six wild strawberry species. However, the highly suitable area for wild strawberry in the prediction results contained the north-eastern region of Yunnan Province, but there are no relevant records in this area in the “Flora of China” and “Flora of Yunnan”. The above results may have been caused by the complex climate and topography of Yunnan Province, which are embodied in the southwest and southeast regions of the province, with low altitude, high temperatures and sufficient heat [2,3,6], while other regions in central, northwest, western, and north-eastern Yunnan have higher altitudes and lower temperatures. Northwest Yunnan Province also has the most abundant plant species in the province [2]. Due to its diverse topography and complex climate, Yunnan Province also represents the intersections of paleontological regions and plant diversity and abundance [3]. Therefore, to fully understand the distribution of wild strawberry resources in Yunnan Province, researchers should conduct field studies and collect resources in the north-eastern regions of the province. Previous studies have shown that tetraploidy, a common ploidy level in plants, might originate as a response of diploid plants to environmental conditions [36,37]. Interestingly, we found that the average size of the highly suitable area for the three diploid wild strawberry species (13.13 × 10⁴ km2) was greater than that for the three tetraploid species (8.18 × 10⁴ km2). Therefore, it is speculated that the tetraploid wild strawberry species in Yunnan Province might have originated from the adaptive response of diploid wild species to the complex environment.

4.2. Effects of Future Climate Change on the Geographical and Dynamic Spatio-Temporal Distribution of Wild Strawberry Species

Climate, as one of the crucial factors affecting plant growth and development, plays an essential role in the geographical distribution of plant species [38]. Global temperature increases and changes of average precipitation are expected to present significant spatial variation under future climate scenarios [39,40]. Climate change will affect the geographical distribution of environmental factors such as temperature and precipitation and ultimately affect the distribution patterns of species [16,37]. Climate change is also predicted to cause species ranges to undergo reduction or expansion to high-altitude and high-latitude regions to different degrees [11,40,41]. The results of this study are consistent with the above predictions. Among them, the average size of the highly suitable area for F. nilgerrensis (diploid), F. orientalis (tetraploid), and F. gracilis (tetraploid) showed a decreasing trend, while that for F. vesca (diploid), F. pentaphylla (diploid), and F. moupinensis (tetraploid) showed an expanding trend. This result may be related to the significant changes in the complex climate types of Yunnan Province under future climate scenarios, as well as the changes in the growth characteristics of the different species of wild strawberry. The future climate of Yunnan Province is characterized by rising temperatures and reduced precipitation [42], which is inconsistent with the humid and low-temperature environments that are suitable for the growth of wild strawberries. In addition, the variation in the suitable areas for the six wild strawberry species indicates that with the change in the complex climate and environment of Yunnan Province, the wild strawberry plants will need to evolve resistance to adapt to environmental changes, possibly promoting the evolution of a wild strawberry from diploid to tetraploid, and thus the results of this study are consistent with those from previous studies [36,37]. At present, tetraploid wild strawberry species in China are mainly distributed in regions with high altitude, low temperatures, and low precipitation in south-western China [22,24,25,26]. The results of this study also illustrate that Yunnan Province, has more suitable regions for the survival of tetraploid than diploid strawberry species. However, under future climate scenarios, the size of the suitable area for tetraploid wild strawberry species in Yunnan Province is expected to decline, and thus awareness regarding the collection and protection of wild strawberry resources should be enhanced.
The overwhelming majority of scientists around the world have concluded that, under climate change, the suitable areas for species will shift to high latitudes, such as insects [41], birds [11,12], vertebrates, and invertebrates [43], plants [10,40], and plant pathogenic microorganisms [19,20]. The results of this study show that under the future RCP2.6 and RCP8.5 climate models, the geometric centers (centroids) of the suitable areas for F. nilgerrensis, F. pentaphylla, and F. gracilis will shift from relatively low latitudes to higher latitudes, while those for F. vesca, F. orientalis, and F. moupinensis will move from relatively high latitudes to lower latitudes. This study found that the geometric centre (centroid) of the suitable area for F. moupinensis moved the longest distance under both the RCP2.6 and RCP8.5 climate models, with distances of 53.87 km and 72.48 km, respectively. F. pentaphylla had the shortest shifting distance of 6.86 km and 11.08 km, respectively. Meanwhile, the results also showed that under the future climate scenarios, due to the differences in climate conditions and the interspecies differences among the wild strawberry species, the trajectories of the centroids of the suitable areas of the six wild strawberry species showed various changes. Therefore, our results also showed that plant species migration under climate change are likely to be more complex than simply from lower to higher latitudes, especially in regions with very complex topographies and climates. Under the different climate scenarios, the distance of the shift in the centroids of the suitable areas of the six wild strawberry species in the RCP8.5 climate models was longer than that in the RCP2.6 climate models. Therefore, these results were consistent with the predictions for Gentian rhodantha in southwest China [44].
Interestingly, this study also found that under both the RCP2.6 and RCP8.5 climate models, the average shifting distance of the geometric centers (centroids) of the suitable areas for the three diploid wild strawberry species were less than the average distance for the three tetraploid wild strawberry species. It is speculated that the structure of the genome changes due to the polyploidy of plants, and new genotypes are generated to increase the genetic diversity and enhance the colonization ability of polyploid plants in a new environment [37]. Therefore, tetraploid wild strawberry species can better adapt to the new environment and show a longer distance of geometric centre shift. Previous studies have reported [45,46] that polyploidization is not only an essential mechanism for the formation of terrestrial flowering plant species but also may affect the ecological tolerance and functional traits of species and ultimately affect their distributions. The exciting phenomenon found in the present study was that the geometric centre (centroid) of the suitable areas of the diploid wild strawberry species shifted to the high-latitude and high-altitude regions of northeast Yunnan, suggesting that the ability of the wild strawberry species to resist harsh environments and withstand the lowest temperatures in the coldest season was enhanced by polyploidization [47,48]. Tetraploid species are generally resistant to cold environments [48], and tetraploid wild strawberry species were more tolerant of low temperatures and drought than diploid wild strawberry species [37]. Furthermore, the reduction in the suitable area for F. nilgerrensis identified in this study also indicated the transformation of diploid wild strawberry species into polyploidy. Our results are consistent with the above findings. However, in the case of global warming, the suitable regions for F. orientalis and F. moupinensis shifted to areas of low latitude and with high temperatures, suggesting that polyploidy results in strong adaptability to new environments; thus the unique ability of these species to adapt to high temperatures and low altitudes warrants further research regarding the physiological, biochemical and genomic aspects of this apparent evolutionary adaptability.

4.3. Environmental Variables Affecting the Potential Geographical Distribution of Wild Strawberry Species

Climate is a significant factor driving the distributions of plant species [13]. Furthermore, climate factors can serve as environmental indicators of the geographical distributions and spatial variation of suitable regions between diploid and tetraploid plant species [36]. Other related studies have shown that the geographical distributions of diploid and tetraploid plants are strictly associated with climate change [49,50]. In this study, unique environmental variables were used for each wild strawberry species for model prediction. A previous study showed that species of the genus Fragaria have similar morphological characteristics and life histories, but different wild strawberry species have different responses to climate factors, and these responses show significant differences [49]. It was also found that the physiological characteristics and climate tolerance of different wild strawberry species are unstable in the process of species evolution [37,49]. Therefore, the unique environmental variables selected for use in modeling in this study can be used to predict the effects of climate change on the six wild strawberry species, indicating that the results of our analysis are accurate and reliable and that the screening results for the environmental variables in this study were consistent with previously reported results [49].
Previous studies confirmed that if a species is conservatively adapted to climate change, it might not be able to adapt or shift in response to the rapidly changing environmental conditions, causing the species to become extinct in the original suitable area [1,51]. The results of this study indicate that different wild strawberry species are associated with different key environmental variables; furthermore, for a single wild species, the environmental variables that play a dominant role will also change under different climate conditions. Therefore, the adaptability of the six wild strawberry species to environmental variables varied, which can allow them to rapidly respond to a suitable living environment under different climate conditions and ensure their continuation. A previous study [49] found that precipitation seasonality (BIO15), annual mean temperature (BIO1), and temperature seasonality (BIO4) are the main environmental variables that affect the distribution range of strawberry plants, while Wan et al. found that BIO15 and the precipitation of the driest quarter (BIO17) were the main environmental variables affecting the distributions of diploid and tetraploid strawberry species in China [37]. However, our results were inconsistent with those of above-mentioned because this study found that the distribution ranges of different wild strawberry species were affected by various environmental variables. The results of the MaxEnt analysis in the present study showed that annual precipitation (BIO12) frequently and significantly affected the six wild strawberry species. Interestingly, a previous study demonstrated that altitude was a key variable affecting tetraploid wild strawberry species [37], and our results also supported this conclusion. According to the above description, we speculate that a tetraploid strawberry can adapt to high altitudes, which is mainly related to plant height and physiological and biochemical characteristics. For example, the species of F. moupinensis had the characteristics of dwarf stature and late-flowering cycles, which can help it grow and propagate at high altitudes.

5. Conclusions

This study demonstrated that under the current climate scenario, six wild strawberry species have suitable areas in Yunnan Province, which were mainly distributed in the high-altitude and low-temperature regions in northwest Yunnan and northeast Yunnan, such as Diqing and Zhaotong. F. nilgerrensis was the species with the highest proportion of highly suitable areas among the six wild species. Furthermore, the average size of the highly suitable area for diploid wild strawberry species was higher than that for tetraploid wild strawberry species. Under the future climate scenarios, the average size of the highly suitable area for diploid strawberry showed an increasing trend, that for the tetraploid species showed a decreasing trend.
Altitude, temperature and precipitation were the dominant environmental variables affecting the potential spatio-temporal dynamics patterns of the six wild strawberry species. The distribution areas of the six wild strawberry species were affected by the common environmental variable of annual precipitation. Each wild strawberry species was influenced by unique environmental variables. Altitude was the critical variable influencing the distribution of tetraploid strawberry species. The average distance of the shift in the suitable area for tetraploid strawberry species was greater than for diploid strawberry species. Most importantly, Yunnan Province, as a global biodiversity hotspot, can also become a region for researchers to conduct ideal geography and climate model research.
Taken as a whole, on a large spatial scale, climate was an important environmental factor determining the potential geographic distribution of species, but the effects of other factors cannot be ignored, such as the physical and chemical properties and types of soil, vegetation types, interactions between species, the ability to adapt to new environments, and human activities. Due to the limitations of the current technical conditions and data, our study only considered the effects of three types of environmental variables, temperature, precipitation and altitude, on the distribution of suitable areas for six wild strawberry species. However, based on the current state of technology, this study predicted the potential areas for wild strawberry species in Yunnan Province under the current scenario and future climate scenarios and explored the main climate factors that restrict their potential geographical distributions. The results of this study also provide valuable information for the breeding and cultivation of wild strawberry species and the establishment of reasonable protection measures.

Supplementary Materials

The following are available online at https://www.mdpi.com/2073-4395/10/7/959/s1, Figure S1: ROC curves and AUC for the diploid species under the five climate scenarios. Figure S2: ROC curves and AUC for the tetraploid species under the five climate scenarios. Figure S3: Key environmental variables affecting the distribution of F. vesca and their percent and accumulative contributions under five different climate scenarios. Figure S4: Key environmental variables affecting the distribution of F. pentaphylla and their percent and accumulative contributions under five different climate scenarios. Figure S5: Key environmental variables affecting the distribution of F. orientalis and their percent and accumulative contributions under five different climate scenarios. Figure S6: Key environmental variables affecting the distribution of F. moupinensis and their percent and accumulative contributions under five different climate scenarios. Figure S7: Key environmental variables affecting the distribution of F. gracilis and their percent and accumulative contributions under five different climate scenarios. Figure S8: Jackknife test of regularized training gain for six wild strawberry species under four different climate scenarios. Figure S9: Response curves of the six wild strawberry species for environmental variables under the current scenario. Figure S10: Potential suitable areas for F. vesca under five different climate scenarios. Figure S11: Potential suitable areas for F. pentaphylla under five different climate scenarios. Figure S12: Potential suitable areas for F. orientalis under five different climate scenarios. Figure S13: Potential suitable areas for F. moupinensis under five different climate scenarios. Figure S14: Potential suitable areas for F. gracilis under five different climate scenarios. Table S1: CSV-format files of all valid distribution locality information for each strawberry species. Table S2: Environmental variables used in this study, with data types and measurement units. Table S3: Percent contributions and permutation importance of 20 environmental variables associated with six wild strawberry species in five climate scenarios using the jackknife test. Table S4: Pearson correlation coefficients of 20 environmental variables associated with six wild strawberry species under five different climate scenarios. Table S5: Comparison of the changes in the potentially suitable areas for six wild strawberry species under current and future different climate scenarios.

Author Contributions

Conceived and designed the experiments: J.Y., D.S., J.T., and X.C. Performed the experiments: all authors. Analyzed the data: J.Y. Wrote the paper: J.Y. All authors have read and agreed to the published version of the manuscript.

Funding

This work was supported by grants from the National Natural Science Foundation of China (31660089 and 31960220).

Acknowledgments

This work was supported by grants from the National Natural Science Foundation of China (NSFC) (31660089 and 31960220).

Conflicts of Interest

There are no conflicts of interest to declare. All of the authors of the manuscript entitled “Current and Future Potential Distribution of Wild Strawberry Species in the Biodiversity Hotspot of Yunnan Province, China” declared that we have no conflicts of interest to this work. We declare that we do not have any commercial or any other associative interest that represents a conflict of interest in connection with the work submitted.

References

  1. Urban, M.C. Accelerating extinction risk from climate change. Science 2015, 348, 571–573. [Google Scholar] [CrossRef] [PubMed] [Green Version]
  2. Chen, L.; Dong, H.; Peng, H. Diversity and distribution of higher plants in Yunnan, China. Biodivers. Sci. 2013, 21, 359–363. [Google Scholar]
  3. Li, R.; Sun, H. Phylofloristics: A case study from Yunnan, China. Biodivers. Sci. 2017, 25, 195–203. [Google Scholar] [CrossRef] [Green Version]
  4. Zhang, M.; Zhou, Z.; Chen, W.; Slik, J.W.F.; Cannon, C.H.; Raes, N. Using species distribution modeling to improve conservation and land use planning of Yunnan, China. Biol. Conserv. 2012, 153, 257–264. [Google Scholar] [CrossRef]
  5. Li, R.; Qian, L.; Sun, H. Current progress and future prospects in phylofloristics. Plant Divers. 2018, 40, 141–146. [Google Scholar] [CrossRef] [PubMed]
  6. Li, R.; Kraft, N.J.; Yang, J.; Wang, Y. A phylogenetically informed delineation of floristic regions within a biodiversity hotspot in Yunnan, China. Sci. Rep. 2015, 5, 9396. [Google Scholar] [CrossRef] [Green Version]
  7. Yi, Y.J.; Cheng, X.; Yang, Z.F.; Zhang, S.H. Maxent modeling for predicting the potential distribution of endangered medicinal plant (H. riparia Lour) in Yunnan, China. Ecol. Eng. 2016, 92, 260–269. [Google Scholar] [CrossRef]
  8. Stocker, T. Climate Change 2013: The Physical Science Basis: Working Group I Contribution to the Fifth Assessment Report of the Intergovernmental Panel on Climate Change; Cambridge University Press: Cambridge, UK, 2014. [Google Scholar]
  9. Zomer, R.J.; Xu, J.; Wang, M.; Trabucco, A.; Li, Z. Projected impact of climate change on the effectiveness of the existing protected area network for biodiversity conservation within Yunnan Province, China. Biol. Conserv. 2015, 184, 335–345. [Google Scholar] [CrossRef]
  10. Boisvert-Marsh, L.; Périé, C.; de Blois, S. Shifting with climate? Evidence for recent changes in tree species distribution at high latitudes. Ecosphere 2014, 5, 1–33. [Google Scholar] [CrossRef]
  11. Freeman, B.G.; Freeman, A.M.C. Rapid upslope shifts in New Guinean birds illustrate strong distributional responses of tropical montane species to global warming. Proc. Natl. Acad. Sci. USA 2014, 111, 4490–4494. [Google Scholar] [CrossRef] [Green Version]
  12. Zuckerberg, B.; Woods, A.M.; Porter, W.F. Poleward shifts in breeding bird distributions in New York State. Glob. Chang. Biol. 2009, 15, 1866–1883. [Google Scholar] [CrossRef]
  13. Thuiller, W.; Lavergne, S.; Roquet, C.; Boulangeat, I.; Lafourcade, B.; Araujo, M.B. Consequences of climate change on the tree of life in Europe. Nature 2011, 470, 531–534. [Google Scholar] [CrossRef] [PubMed]
  14. Wang, Y.; Ma, J.; Li, X.; Wang, Y.; Cao, S.; Xie, A.; Ye, S.; Dong, B.; Zhao, W.; Qin, Y. The distribution of Athetis lepigone and prediction of its potential distribution based on GARP and MaxEnt. J. Appl. Entomol. 2017, 141, 431–440. [Google Scholar] [CrossRef]
  15. Zhang, K.; Zhang, Y.; Zhou, C.; Meng, J.; Sun, J.; Zhou, T.; Tao, J. Impact of climate factors on future distributions of Paeonia ostii across China estimated by MaxEnt. Ecol. Inf. 2019, 50, 62–67. [Google Scholar] [CrossRef]
  16. Zhang, K.; Yao, L.; Meng, J.; Tao, J. Maxent modeling for predicting the potential geographical distribution of two peony species under climate change. Sci. Total Environ. 2018, 634, 1326–1334. [Google Scholar] [CrossRef] [PubMed]
  17. Phillips, S.J.; Dudík, M.; Elith, J.; Graham, C.H.; Lehmann, A.; Leathwick, J.; Ferrier, S. Sample selection bias and presence only distribution models: Implications for background and pseudo absence data. Ecol. Appl. 2009, 19, 181–197. [Google Scholar] [CrossRef] [PubMed] [Green Version]
  18. Ward, D.F. Modelling the potential geographic distribution of invasive ant species in New Zealand. Biol. Invasions 2007, 9, 723–735. [Google Scholar] [CrossRef]
  19. Bebber, D.P.; Ramotowski, M.A.; Gurr, S.J. Crop pests and pathogens move polewards in a warming world. Nat. Clim. Chang. 2013, 3, 985–988. [Google Scholar] [CrossRef]
  20. Wang, R.; Yang, H.; Luo, W.; Wang, M.; Lu, X.; Huang, T.; Zhao, J.; Li, Q. Predicting the potential distribution of the Asian citrus psyllid, Diaphorina citri (Kuwayama), in China using the MaxEnt model. PeerJ 2019, 7, e7323. [Google Scholar] [CrossRef] [Green Version]
  21. Hundessa, S.; Li, S.; Li Liu, D.; Guo, J.; Guo, Y.; Zhang, W.; Williams, G. Projecting environmental suitable areas for malaria transmission in China under climate change scenarios. Environ. Res. 2018, 162, 203–210. [Google Scholar] [CrossRef]
  22. Deng, M.; Lei, J. Chinese Fruit Tree Records Strawberry Rolls; China Forestry Publishing House: Beijing, China, 2005. [Google Scholar]
  23. Njuguna, W.; Liston, A.; Cronn, R.; Ashman, T.L.; Bassil, N. Insights into phylogeny, sex function and age of Fragaria based on whole chloroplast genome sequencing. Mol. Phylogenet. Evol. 2013, 66, 17–29. [Google Scholar] [CrossRef] [PubMed]
  24. Lei, J.; Dai, H.; Tan, C.; Deng, M.; Zhao, M.; Qian, Y. Studies on the taxonomy of the strawberry (Fragaria) species distributed in China. Acta Hortic. Sin. 2006, 33, 1–5. [Google Scholar]
  25. Lei, J.; Zhang, Y.; Zhao, M. Strawberries in China; Liaoning Science and Technology Press: Shenyang, China, 2011. [Google Scholar]
  26. Lei, J.; Xue, L.; Guo, R.; Dai, H. The Fragaria species native to China and their geographical distribution. In Proceedings of the VIII International Strawberry Symposium, Quebec City, QC, Canada, 15 July 2016; pp. 37–46. [Google Scholar]
  27. Editorial Board of Flora of China, CAS. Flora of China; Science Press: Beijing, China, 1995. [Google Scholar]
  28. Kunming Institute of Botany, CAS. Flora of Yunnan; Science Press: Beijing, China, 2006. [Google Scholar]
  29. Jiang, J. Dictionary of Medicinal Plants; Tianjin Science and Technology Press: Tianjin, China, 2005. [Google Scholar]
  30. Qiao, Q.; Xue, L.; Wang, Q.; Sun, H.; Zhong, Y.; Huang, J.; Lei, J.; Zhang, T. Comparative transcriptomics of strawberries (Fragaria spp.) provides insights into evolutionary patterns. Front. Plant Sci. 2016, 7, 1839. [Google Scholar] [CrossRef] [PubMed] [Green Version]
  31. Zhang, M.; Zhou, Z.; Chen, W.; Cannon, C.H.; Raes, N.; Slik, J.F. Major declines of woody plant species ranges under climate change in Yunnan, China. Divers. Distributions 2014, 20, 405–415. [Google Scholar] [CrossRef]
  32. Wang, R.; Li, Q.; He, S.; Liu, Y.; Wang, M.; Jiang, G. Modeling and mapping the current and future distribution of Pseudomonas syringae pv. actinidiae under climate change in China. PLoS ONE 2018, 13, e0192153. [Google Scholar] [CrossRef] [Green Version]
  33. Tang, C.Q.; Dong, Y.F.; Herrando-Moraira, S.; Matsui, T.; Ohashi, H.; He, L.Y.; Nakao, K.; Tanaka, N.; Tomita, M.; Li, X.S. Potential effects of climate change on geographic distribution of the Tertiary relict tree species Davidia involucrata in China. Sci. Rep. 2017, 7, 43822. [Google Scholar] [CrossRef] [Green Version]
  34. Wang, L.; Hu, W.; Magalhaes, R.J.S.; Bi, P.; Ding, F.; Sun, H.; Li, S.; Yin, W.; Wei, L.; Liu, Q. The role of environmental factors in the spatial distribution of Japanese encephalitis in mainland China. Environ. Int. 2014, 73, 1–9. [Google Scholar] [CrossRef]
  35. Duan, Y.Z.; Yu, H.; Wang, H.T.; Du, Z.Y. Geographical distribution and prediction of potentially suitable regions of endangered relict plant Tetraena mongolica. Plant Sci. J. 2019, 37, 337–347. [Google Scholar]
  36. Visger, C.J.; Germain-Aubrey, C.C.; Patel, M.; Sessa, E.B.; Soltis, P.S.; Soltis, D.E. Niche divergence between diploid and autotetraploid Tolmiea. Am. J. Bot. 2016, 103, 1396–1406. [Google Scholar] [CrossRef] [Green Version]
  37. Wan, J.Z.; Chen, L.X.; Gao, S.; Song, Y.B.; Tang, S.L.; Yu, F.H.; Li, J.M.; Dong, M. Ecological niche shift between diploid and tetraploid plants of Fragaria (Rosaceae) in China. S. Afr. J. Bot. 2019, 121, 68–75. [Google Scholar] [CrossRef]
  38. Wiens, J.J. Climate-Related local extinctions are already widespread among plant and animal species. PLoS. Biol. 2016, 14, e2001104. [Google Scholar] [CrossRef] [Green Version]
  39. Bellard, C.; Bertelsmeier, C.; Leadley, P.; Thuiller, W.; Courchamp, F. Impacts of climate change on the future of biodiversity. Ecol. Lett. 2012, 15, 365–377. [Google Scholar] [CrossRef] [Green Version]
  40. Lenoir, J.; Gégout, J.-C.; Marquet, P.; De Ruffray, P.; Brisse, H. A significant upward shift in plant species optimum elevation during the 20th century. Science 2008, 320, 1768–1771. [Google Scholar] [CrossRef]
  41. Wilson, R.J.; Gutierrez, D.; Gutierrez, J.; Monserrat, V.J. An elevational shift in butterfly species richness and composition accompanying recent climate change. Glob. Chang. Biol. 2007, 13, 1873–1887. [Google Scholar] [CrossRef]
  42. Li, Z.; Duan, C.; Jin, L.; Hu, X.; Li, B.; Yang, H. Spatial and temporal variability of climatic potential productivity in Yunnan Province, China. Chin. J. Appl. Ecol. 2019, 30, 2181–2190. [Google Scholar]
  43. Hickling, R.; Roy, D.B.; Hill, J.K.; Fox, R.; Thomas, C.D. The distributions of a wide range of taxonomic groups are expanding polewards. Glob. Chang. Biol. 2006, 12, 450–455. [Google Scholar] [CrossRef]
  44. Shen, T.; Zhang, J.; Shen, S.; Zhao, Y.; Wang, Y. Distribution simulation of Gentiana rhodantha in Southwest China and assessment of climate change impact. Chin. J. Appl. Ecol. 2017, 28, 2499–2508. [Google Scholar]
  45. Wei, N.; Cronn, R.; Liston, A.; Ashman, T.L. Functional trait divergence and trait plasticity confer polyploid advantage in heterogeneous environments. New Phytol. 2019, 221, 2286–2297. [Google Scholar] [CrossRef] [Green Version]
  46. Wood, T.E.; Takebayashi, N.; Barker, M.S.; Mayrose, I.; Greenspoon, P.B.; Rieseberg, L.H. The frequency of polyploid speciation in vascular plants. Proc. Natl. Acad. Sci. USA 2009, 106, 13875–13879. [Google Scholar] [CrossRef] [Green Version]
  47. Glennon, K.; Ritchie, M.E.; Segraves, K. Evidence for shared broad scale climatic niches of diploid and polyploid plants. Ecol. Lett. 2014, 17, 574–582. [Google Scholar] [CrossRef]
  48. Theodoridis, S.; Randin, C.; Broennimann, O.; Patsiou, T.; Conti, E. Divergent and narrower climatic niches characterize polyploid species of European primroses in Primula sect. Aleuritia. J. Biogeogr. 2013, 40, 1278–1289. [Google Scholar] [CrossRef]
  49. Johnson, A.L.; Govindarajulu, R.; Ashman, T.L. Bioclimatic evaluation of geographical range in Fragaria (Rosaceae): Consequences of variation in breeding system, ploidy and species age. Bot. J. Linn. Soc. 2014, 176, 99–114. [Google Scholar] [CrossRef] [Green Version]
  50. Kirchheimer, B.; Schinkel, C.C.; Dellinger, A.S.; Klatt, S.; Moser, D.; Winkler, M.; Lenoir, J.; Caccianiga, M.; Guisan, A.; Nieto-Lugilde, D. A matter of scale: Apparent niche differentiation of diploid and tetraploid plants may depend on extent and grain of analysis. J. Biogeogr. 2016, 43, 716–726. [Google Scholar] [CrossRef] [PubMed] [Green Version]
  51. Wiens, J.J. Speciation and ecology revisited: Phylogenetic niche conservatism and the origin of species. Evolution 2004, 58, 193–197. [Google Scholar] [CrossRef] [PubMed]
Figure 1. Distribution localities of six wild strawberry species in China (F. vesca, F. nilgerrensis, F. pentaphylla, F. orientalis, F. moupinensis, and F. gracilis, respectively). The dates of databases from 1900 to 2020, the collection information for each strawberry species is shown in Table S1.
Agronomy 10 00959 g001
Figure 2. Effects of the selected environmental variables on the distribution of F. nilgerrensis and their percent and accumulative contributions under five climate scenarios. “Current” represents current scenario (1970 to 2000), “RCP2.6” represents the minimum greenhouse gas scenario, and “RCP8.5” represents the maximum greenhouse gas scenario; “2050” and “2070” represent two periods of the 2050s (2041 to 2060) and 2070s (2061 to 2080), respectively. BIO2, mean diurnal range; BIO4, temperature seasonality; BIO7, temperature annual range; BIO9, mean temperature of driest quarter; BIO12, annual precipitation; BIO14, precipitation of driest month; BIO15, precipitation seasonality; BIO19, precipitation of coldest quarter.
Agronomy 10 00959 g002
Figure 3. Jackknife test of regularized training gain for six wild strawberry species under the current climate scenario. “Current” represents current scenario (1970 to 2000). BIO2, mean diurnal range; BIO3, isothermality; BIO4, temperature seasonality; BIO6, min temperature of coldest month; BIO7, temperature annual range; BIO8, mean temperature of wettest quarter; BIO9, mean temperature of driest quarter; BIO11, mean temperature of coldest quarter; BIO12, annual precipitation; BIO14, precipitation of driest month; BIO15, precipitation seasonality; BIO19, precipitation of coldest quarter.
Agronomy 10 00959 g003
Figure 4. Potentially suitable areas for six wild strawberry species under the current climate scenario. “Current” represents current scenario (1970 to 2000).
Agronomy 10 00959 g004
Figure 5. Potentially suitable areas for F. nilgerrensis under four climate scenarios in Yunnan Province (2050-RCP2.6, 2050-RCP8.5, 2070-RCP2.6, and 2070-RCP8.5 were four climate scenarios). “Current” represents current scenario (1970 to 2000); “RCP2.6” represents the minimum greenhouse gas scenario, and “RCP8.5” represents the maximum greenhouse gas scenario; “2050” and “2070” represent two periods of the 2050s (2041 to 2060) and 2070s (2061 to 2080), respectively.
Agronomy 10 00959 g005
Figure 6. Variations in the centroid coordinates of suitable areas for six wild strawberry species under different climate scenarios in the biodiversity hotspot of Yunnan Province, China. “Current” represents current scenario (1970 to 2000); “RCP2.6” represents the minimum greenhouse gas scenario, and “RCP8.5” represents the maximum greenhouse gas scenario; “2050” and “2070” represent two periods of the 2050s (2041 to 2060) and 2070s (2061 to 2080), respectively.
Agronomy 10 00959 g006
Table 1. AUC values for the ten replicates of six wild strawberry species under five different climate scenarios.
PloidySpeciesClimate ScenarioAUC (10 replicates)PloidySpeciesClimate ScenarioAUC (10 Replicates)
MeanStandard DeviationMeanStandard Deviation
Diploid (2n = 2x = 14)F. nilgerrensisCurrent0.9470.014Tetraploid (2n = 4x = 28)F. orientalisCurrent0.8640.051
2050-RCP2.60.9510.0122050-RCP2.60.8720.049
2050-RCP8.50.950.0142050-RCP8.50.8580.055
2070-RCP2.60.9490.0132070-RCP2.60.8610.055
2070-RCP8.50.9530.0142070-RCP8.50.8720.049
F. vescaCurrent0.8450.033F. moupinensisCurrent0.9570.014
2050-RCP2.60.8720.0722050-RCP2.60.9560.019
2050-RCP8.50.8710.0702050-RCP8.50.9570.019
2070-RCP2.60.8640.0722070-RCP2.60.9550.018
2070-RCP8.50.8570.0782070-RCP8.50.9540.016
F. pentaphyllaCurrent0.9290.025F. gracilisCurrent0.9280.032
2050-RCP2.60.9350.0282050-RCP2.60.9290.030
2050-RCP8.50.9150.0262050-RCP8.50.9310.032
2070-RCP2.60.9230.0292070-RCP2.60.9380.026
2070-RCP8.50.9170.0242070-RCP8.50.9370.031
Note: “Current” represents current scenario (1970 to 2000); “RCP2.6” represents the minimum greenhouse gas scenario, and “RCP8.5” represents the maximum greenhouse gas scenario; “2050” and “2070” represent two periods of the 2050s (2041 to 2060) and 2070s (2061 to 2080), respectively. ROC represents the receiver operating characteristic curve, AUC means the area under the ROC curve, mean ± SD (n = 10 replicates).
Table 2. Suitable ranges of critical environmental variables for the six wild strawberry species under the current climate scenario.
SpeciesEnvironmental Variables (Unit)Suitable RangeOptimum Value
(Mean ± SD)
Min (Mean ± SD)Max (Mean ± SD)
F. nilgerrensisTemperature Seasonality3528.1 ± 66.45415.9 ± 69.84437.1 ± 71.2
Temperature Annual Range (°C)20.0 ± 0.626.5 ± 0.223.3 ± 0.1
Annual Precipitation (mm)934.9 ± 47.61406.5 ± 56.71045.3 ± 48.9
F. vescaMin Temperature of Coldest Month (°C)−8.1 ± 1.76.1 ± 1.8−2.3 ± 2.1
Temperature Annual Range (°C)16.8 ± 1.130.7 ± 0.623.8 ± 0.1
Annual Precipitation (mm)662.2 ± 31.21361.4 ± 46.4885.0 ± 91.4
F. pentaphyllaIsothermality37.0 ± 1--45.5 ± 0.3
Temperature Seasonality3767.2 ± 277.76621.0 ± 100.15279.6 ± 699.2
Annual Precipitation (mm)750.8 ± 20.33266.5 ± 865.7914.0 ± 31.2
F. orientalisAltitude (m)1338.5 ± 21.04125.0 ± 12.23469.3 ± 19.4
Mean Temperature of Coldest Quarter (°C)−5.3 ± 1.79.0 ± 1.52.5 ± 1.6
Annual Precipitation (mm)592.9 ± 35.21178.8 ± 48.9765.9 ± 53.6
F. moupinensisTemperature Seasonality3426.5 ± 170.75849.8 ± 51.14505.6 ± 46.0
Mean Temperature of Coldest Quarter (°C)1.9 ± 2.012.9 ± 2.37.4 ± 2.1
Annual Precipitation (mm)829.3 ± 33.41405.1 ± 65.2976.0 ± 41.7
F. gracilisAltitude (m)1688.7 ± 28.73719.8 ± 11.42577.9 ± 274.3
Temperature Seasonality3803.0 ± 50.36014.6 ± 344.54552.7 ± 70.7
Annual Precipitation (mm)762.6 ± 37.21624.0 ± 122.1940.3 ± 33.8
Note: Critical environmental variables represent the top three environmental variables with regularized training gain values under the current climate scenario (1970 to 2000); mean ± SD (n = 10 replicates).
Table 3. Potential distribution areas for six wild strawberry species under five different climate scenarios.
PloidySpeciesClimate ScenarioUnsuitable Area (× 104 km2)Lowly Suitable Area (× 104 km2)Moderately Suitable Area (× 104 km2)Highly Suitable Area (× 104 km2)Percentage of Highly Suitable Area in Yunnan Province
Diploid (2n = 2x = 14)F. nilgerrensisCurrent3.324.927.6123.5659.79%
2050-RCP2.62.644.708.3323.7260.21%
2050-RCP8.53.705.637.7022.3656.76%
2070-RCP2.63.494.917.3623.6560.02%
2070-RCP8.53.086.789.9219.6249.80%
F. vescaCurrent3.329.9215.3610.8027.42%
2050-RCP2.64.739.3413.7411.5829.40%
2050-RCP8.56.367.0012.5713.4734.19%
2070-RCP2.65.079.4214.5510.3626.30%
2070-RCP8.55.776.2813.0514.2936.27%
F. pentaphyllaCurrent6.7914.6812.925.0112.72%
2050-RCP2.65.7716.9112.534.2010.65%
2050-RCP8.54.1810.2615.589.3823.81%
2070-RCP2.63.5612.9614.768.1120.59%
2070-RCP8.55.6013.4113.057.3418.63%
Tetraploid (2n = 4x = 28)F. orientalisCurrent9.209.0612.568.5821.78%
2050-RCP2.68.868.8013.728.0220.35%
2050-RCP8.58.498.9913.947.9820.26%
2070-RCP2.67.788.5312.4310.6627.05%
2070-RCP8.59.8910.4813.525.5113.98%
F. moupinensisCurrent8.4812.3311.417.1918.24%
2050-RCP2.67.6212.4611.208.1220.60%
2050-RCP8.55.0311.6314.238.5121.61%
2070-RCP2.64.8814.4111.868.2520.94%
2070-RCP8.55.489.6912.9511.2928.65%
F. gracilisCurrent7.7210.1812.748.7622.23%
2050-RCP2.67.1210.6113.797.8820.00%
2050-RCP8.58.189.9914.596.6416.86%
2070-RCP2.66.5312.4613.117.2918.51%
2070-RCP8.58.3313.7712.155.1613.09%
Note: “Current” represents current scenario (1970 to 2000); “RCP2.6” represents the minimum greenhouse gas scenario, and “RCP8.5” represents the maximum greenhouse gas scenario; “2050” and “2070” represent two periods of the 2050s (2041 to 2060) and 2070s (2061 to 2080), respectively.