Abstract
Silicon (Si) exerts beneficial effects in mitigating aluminum (Al) toxicity in different plant species. These include attenuating oxidative damage and improving structural strengthening as a result of the increased production of secondary metabolites such as phenols. The aim of this research was to evaluate the effect of Si on phenol production and composition in two barley cultivars under Al stress. Our conceptual approach included a hydroponic experiment with an Al-tolerant (Sebastian) and an Al-sensitive (Scarlett) barley cultivar treated with two Al doses (0 or 0.2 mM of Al) and two Si doses (0 or 2 mM) for 21 days. Chemical, biochemical and growth parameters were assayed after harvest. Our results indicated that the Al and Si concentration decreased in both cultivars when Al and Si were added in combination. Silicon increased the antioxidant activity and soluble phenol concentration, but reduced lipid peroxidation irrespective of the Al dose. Both barley cultivars showed changes in culm creep rate, flavonoids and flavones concentration, lignin accumulation and altered lignin composition in Si and Al treatments. We concluded that Si fertilization could increase the resistance of barley to Al toxicity by regulating the metabolism of phenolic compounds with antioxidant and structural functions.
1. Introduction
Silicon (Si) is a beneficial element that improves the growth, development and yield of plants subjected to different stresses [1,2,3]. However, the beneficial effects of Si depend on the capacity of plants to take up Si from the growth media, and transport it to the plant tissues [4]. To date, numerous studies have indicated that Si uptake and accumulation in plants are modulated by different influx and efflux transporters [5,6,7,8]. Most of the Si taken up by plants is deposited in the cell walls, where it increases mechanical strength [9,10].
In recent years, it has been suggested that Si can alter the secondary metabolism of plants [2,11,12,13,14]. In this regard, Si appears to stimulate the production of phenols in plants subjected to salinity, drought, temperature stress, UV radiation, cadmium, chromium [2], manganese [15], aluminum [16,17], nickel [11], soil acidity [18] and biotic [12,19,20] stresses. There is some evidence showing that the positive effects of Si on phenol metabolism in plants growing in stressful environments is due to (i) the regulation of the gene expression or activity of key enzymes in the phenylpropanoid pathway [21,22], (ii) the enhancement of total phenol production [17,23], and/or (iii) the formation of complexes involving lignin and carbohydrates [24,25] or Si-polyphenol in the cell wall [15]. However, there is still no information about the impact of Si on the production and composition of phenolic compounds with either antioxidant capacity or structural action.
Barley is one of the most cultivated cereals around the world due to the high nutritional value of its grains, which provide complex carbohydrates, proteins, minerals, fiber and antioxidants, including phenols [26]. The main phenolic compounds in barley grains belong to the group of flavonoids (cyanidin-3-glucoside, petunidin-3-glucoside, delphinidin-3-glucoside) and phenolic acids (ferulic acid, p-coumaric acid, vanillic acid, sinapic acid), which benefit human health by reducing the risk of various diseases such as cancer and coronary heart diseases [27,28]. However, in acid soils, barley growth is limited due to its high sensitivity to Al3+, which reduces both the yield and quality of the grains. In this context, some reports have demonstrated an improvement in the Al tolerance of barley following Si addition [17,29,30].
For various other plant species, it has been suggested that Si attenuates Al phytotoxicity by means of (i) increasing the pH in the growth media, (ii) the formation of aluminosilicate complexes, (iii) enhancement of the chlorophyll and carotenoids content in plant tissues (iv) the stimulation of antioxidant enzyme activities and production of antioxidant compounds, and (vi) the exudation of phenolic compounds with Al chelation ability by plant roots [7,8,18,31,32,33].
Nevertheless, to the best of our knowledge only a few reports have described the effects of Si on the phenolic metabolism of barley subjected to Al stress. Moreover, the influence of Si on the phenolic metabolism of barley cultivars with contrasting Al tolerance has rarely been studied [17]. Therefore, the general objective of this research was to evaluate the effect of Si on phenol production and composition in tolerant and sensitive barley cultivars under Al stress. To address this objective, we carried out a hydroponic experiment with both types of cultivars grown under Al toxicity with and without Si addition and investigated the barley growth and the antioxidant as well as the structural phenol composition. We hypothesized that Si addition would improve barley’s resistance to Al stress due to enhanced phenol production.
2. Materials and Methods
2.1. Plant Material and Growth Conditions
Seeds of the barley cultivars Sebastian (Al-tolerant) and Scarlet (Al-sensitive) were germinated (10 days) on filter paper moistened with deionized water. After germination, 48 seedlings of each barley cultivar were transferred to plastic containers filled with 8 L of nutrient solution [34], and grown for 15 days under controlled conditions. Thereafter, Al and Si were applied in combination according to the following treatments: −Al/−Si (0 mM Al and 0 mM Si; control), +Al/−Si (0.2 mM Al and 0 mM Si), −Al/+Si (0 mM Al and 2 mM Si), +Al/+Si (0.2 mM Al and 2 mM Si). These treatments were selected from our previous kinetic study concerning the effect of Si on barley under Al stress [17]. The nutrient solutions were replaced every 5 days, and the pH was adjusted (HCl or NaOH) daily to 4.5. For the experiment, barley cultivars were arranged in a factorial design with three replicates per treatment. Plants were harvested 21 days after the initiation of the experimental treatments and subjected to chemical and biochemical analyses.
2.2. Plant Growth Traits and Chemical Analyses
2.2.1. Growth Traits
Plant tissues (shoots and roots) were dried (65 °C for 48 h) to determine the dry weight (DW). Barley growth was determined by measuring the length of the longest root and the shoot of 10 plants randomly selected from each plastic container.
2.2.2. Aluminum and Si Concentration in Barley
The Al concentration in barley tissue (shoots and roots) was determined with the method described by Sadzawka et al. [35]. Briefly, dried samples were heated at 500 °C for 8 h, and treated with 2 M hydrochloric acid. The Al concentration was quantified by flame atomic absorption spectrophotometry (FAAS) at 324.7 nm. For Si concentration, dried shoots and roots (0.1 g) were digested with 5 mL of nitric acid (HNO3) at 70 °C for 5 h. Thereafter, 1 mL of hydrofluoric acid (HF, 40%) and 10 mL of deionized water were added, and left overnight. The next day, the solutions were treated with 5 mL boric acid (H3BO3, 2% w/v), and the solution was made up to 25 mL by adding distilled water. Silicon concentration of the digested samples was determined by FAAS at 251.6 nm as described in Pavlovic et al. [36].
2.3. Biochemical Analyses
2.3.1. Total Soluble Phenols in Plants
Total soluble phenols were determined in root and shoot samples according to the Slinkard and Singleton method [37] using Folin–Ciocalteu reagent. The standard curve was calculated using chlorogenic acid as standard, and the absorbance was measured spectrophotometrically at 765 nm.
2.3.2. Identification and Quantification of Phenolic Compounds in Barley
Barley roots and shoots (0.1 g) were milled with liquid nitrogen and macerated in methanol as described by Slinkard and Singleton [37]. Phenolic compounds were determined by high performance liquid chromatography with a diode array detector (HPLC-DAD) using a Shimadzu HPLC system (Tokyo, Japan) with a LC-20AT quaternary pump, a DGU-20A5R degassing unit, a CTO-20A oven, a SIL-20a automatic injector and an SPD-M20A UV-Vis diode spectrophotometer. Data were analyzed using Lab solutions (Shimadzu, Duisburg, Germany) for DAD analysis. Identification was performed by LC-MSD Trap VL, model G2445C VL with electrospray ionization (ESI-MS/MS) detectors (Agilent, Waldbronn, Germany); control and data analyses were carried out by the Agilent ChemStation (version B.01.03) data processing station and Agilent LC-MS Trap Software (version 1.3, Santa Clara, CA, USA). The chromatographic separation method (HPLC-DAD) for the determination of phenolic compounds used a Kromasil ClassicShell-2.5-C18 (4.6 × 100 mm, 2.5 μm) column and a C18 precolumn (Novapak; Waters, Milford, MA, USA; 22 × 3.9 mm, 4 μm) as reported by Santander et al. [38]. The samples were injected using water:acetonitrile:formic acid (92:3:5 v/v/v) and water:acetonitrile:formic acid (45:50:5 v/v/v) as A and B mobile phases, respectively, with an elution gradient between 6% and 50% B over 30 min at 0.55 mL min−1 and 40 °C. Quantification was carried out by external calibration using chlorogenic acid for the roots and apigenin for the shoots as standards at 320 nm.
2.3.3. Antioxidant Capacity in Barley Plants
The antioxidant capacity of the roots and shoots was analyzed by the method described by Chinnici et al. [39] using DPPH (2,2-diphenyl-1-picrylhydrazyl) radical, and Trolox as standard. The absorbance of samples was measured in spectrophotometer at 515 nm.
2.3.4. Lipid Peroxidation Assay
Lipid peroxidation was assayed on fresh root and shoot samples by following the thiobarbituric acid reactive substances (TBARS) procedure reported by Du and Bramlage [40]. The absorbance of the samples was registered spectrophotometrically at 532, 600 and 440 nm.
2.4. Plant Stretching
The creep rate of culm was measured as an index of plant stretching. The extension of the first 5 cm of culm was measured with a constant load extensometer as described by Perini et al. [41]. Briefly, the fresh culms were scraped with carborundum to break the cuticle and then were placed in hot water for 15 min. Subsequently, the tissue was inserted between two clamps under a constant tension of 10 g per 30 min. The extension was measured through the movement of the upper clamp, detected by an electronic sensor and recorded in a microcomputer. All extension tests reported here were repeated at least three times for each sample.
2.5. Lignin Accumulation and Composition in Plants
To visualize the lignin distribution in the plant tissues, fresh roots and leaf sections were stained with Safranine O, and analyzed by Laser Scanning Confocal Microscopy (CLSM; Olympus FV1000, Arquimed, Tokyo, Japan) at λ emission/excitation of 543/590 nm according to the method described by Sant’ Anna et al. [42]. The images were processed using Image Processing software (software FV10-ASW v0.200c; Arquimed).
A quantitative analysis of the total lignin composition (calculated as the sum of monomers vanillyl [V], syringyl [S] and cinnamyl [C]) was carried out by means of the alkaline cupric oxide (CuO) oxidation method proposed by Kögel and Bochter [43]. Briefly, 0.05 g of roots or shoots were oxidized in teflon vials for 2 h under N2. Thereafter, the CuO oxidation products were purified by acidification and solid phase extraction using a C18 inverted column. Samples were derivatized by the addition of BSTFA (N, O-Bis (trimethylsilyl) trifluoroacetamide) before being analyzed by gas chromatography. For the separation and quantification of the monomers (V, S and C), a HP 6890 gas chromatograph (Agilent Technologies, Santa Clara, CA, USA) equipped with a SGE BPX-5 column and a flame ionization detector (GC/FID) was used. Phenylacetic acid was used as an internal standard for quantification.
2.6. Data Analysis
Experimental data were checked for normality by the Shapiro-Wilk test and for homogeneity of variance by the Levene test. Statistical differences of means (95% significance level) were analyzed using two-way (cultivar and treatment) analyses of variance (two-way ANOVA). Post hoc tests were performed with a Tukey-test to determine the explanatory variables independently when the ANOVA detected significant differences. For each data set, the standard deviation (SD) was also determined. In addition, the relationship between two response variables was analyzed through Pearson correlation at a significance level of 5%.
3. Results
3.1. Plant Growth and Concentrations of Al and Si
3.1.1. Plant Growth Traits
The interaction between cultivar and treatment had a significant effect on the growth traits of roots, but dry weight (DW) and length of shoots were not significantly affected by the interaction (Table 1). Aluminum toxicity led to a significant reduction in DW and the tissue length of the plants. For the Al-tolerant Sebastian cultivar, the DW of the shoots and roots decreased by about 30% when grown under Al toxicity (Table 1). Greater reductions were recorded for the Al-sensitive Scarlett cultivar ranging from 36% for shoots to 52% for roots. However, DW was enhanced in Sebastian (roots) and Scarlett (roots and shoots) when Al and Si were supplied together. The root length of Sebastian was greater than that of Scarlett, and both cultivars showed strong diminution of root length under +Al/−Si compared to the control treatment (−Al/−Si; Table 1). In plants growing under Al supply, the addition of 2 mM Si improved root length by 10% (Sebastian) and 17% (Scarlett).

Table 1.
Dry weight (DW) and length of roots and shoots of barley cultivars (Sebastian and Scarlett). Treatments were 0 or 0.2 mM Al, combined with 0 or 2 mM Si. Values represent the mean of three replicates per treatment ± SD.
3.1.2. Aluminum and Si Concentration
We observed that the interaction between cultivar and treatment had a significant effect on the Al and Si concentration in shoots and roots (Table 2). Roots of barley treated with 0.2 mM Al accumulated 5232 ± 417 mg of Al kg−1 DW for the Sebastian cultivar and 5285 ± 167 mg Al kg−1 DW for the Scarlett cultivar. Sebastian shoots showed 3153 ± 417 mg Al kg−1 DW and 4876 ± 581 mg Al kg−1 DW was recorded for Scarlett shoots. However, Si addition decreased the Al concentration in roots by 45% (Sebastian) and 68% (Scarlett), while the Al reduction in shoots was 49% (Sebastian) and 42% (Scarlett) as compared to the Al treatment without Si addition (Table 2). On the other hand, the Si concentration in plant tissues increased when plants were exposed to 2 mM of Si as compared to the control (Table 2). However, shoot Si concentration decreased with Al supply in both barley cultivars. Thus, Al addition reduced Si concentration in the shoots by 47% (Sebastian) and 37% (Scarlett), and by 55% (Sebastian) and 13% (Scarlett) in the roots.
Table 2.
Aluminum and silicon concentrations in roots and shoots of the two barley cultivars (Sebastian and Scarlett). Treatments were 0 or 0.2 mM Al, combined with 0 or 2 mM Si. Values represent the mean of three replicates per treatment ± SD.
3.2. The Effect of Al and Si on Phenol Production and Antioxidant Performance
3.2.1. Total Soluble Phenols and Phenolic Profile
In general, the phenol concentration in plant tissues was affected by the interaction between the barley cultivar and Al/Si treatment (Figure 1A,B). Silicon addition did not alter the total phenol concentration in the Sebastian shoots (Figure 1A). However, when plants were exposed to 0.2 mM Al, lower concentrations of soluble phenols were recorded. Conversely, Sebastian roots showed an increase in phenols when Si was applied (Figure 1B). On the other hand, for Scarlett shoots, the highest phenol concentrations were observed in the +Al/−Si treatment (Figure 1A). Similarly, total phenols increased by 24% in Scarlet as a consequence of Si addition to the growth media, and it increased by 57% in the +Al/+Si treatment (Figure 1B).

Figure 1.
Total phenols (A,B), free radical scavenging activity (C,D) and lipid peroxidation (E,F) in shoots and roots of barley cultivars. Treatments were 0 or 0.2 mM Al, combined with 0 or 2 mM Si. Different letters indicate statistically significant differences (p ≤ 0.05) among treatments. The lower case letters represent significant differences between treatments for same barley cultivar. The upper case letters indicate significant differences between barley cultivars for the same treatment. When uppercase letters do not appear, no significant differences between the same treatment were found for different cultivars.
Seven flavonoids (flavone-glucosides) were identified in barley shoots (Table 3), but only four compounds reached quantifiable levels: (1) isoorientin-7-O-glucoside (lutonarin), (2) apigenin-pentoxide-hexoside isomer 1, (3) isovitexin-7-O-[6-sinapoyl]-glucoside, and (4) isovitexin-7-O-[6-feruloyl]-glucoside (Figure 2C). Caffeoylquinic acid isomer, a phenolic acid belonging to the chlorogenic acid family, was detected in barley roots (Table 3 and Figure 2A).
Table 3.
Identification of phenolics from barley extracts by using HPLC–DAD–ESI-MS/MS.
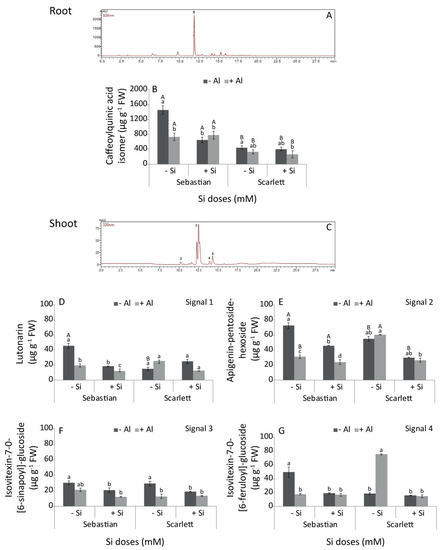
Figure 2.
HPLC-DAD chromatograms (A,C) and individual phenolic concentration in shoots (D–G) and roots (B) of barley cultivars. Treatments were 0 or 0.2 mM Al, combined with 0 or 2 mM Si. Phenolic concentration values represent the mean of three replicates per treatment ± SD. Different letters indicate statistically significant differences (p ≤ 0.05) among treatments. The lower case letters represent significant differences between treatments for the same barley cultivar. The upper case letters indicate significant differences between barley cultivars for the same treatment. When uppercase letters do not appear, no significant differences between the same treatment in different cultivars were found.
The interaction between cultivar and treatment also had a significant effect on lutonarin, apigenin-pentoxide-hexoside and isovitexin-7-O-[6-sinapoyl]-glucoside concentrations (Figure 2D–F), but isovitexin-7-O-[6-feruloyl]-glucoside concentration was not affected by the interaction (Figure 2G). There were no differences in the lutonarin concentration in the shoots of Scarlett among treatments (Figure 2D). However, it decreased in all treatments for Sebastian shoots with respect to the control (Figure 2D). Similarly, apigenin-pentoxide-hexoside and isovitexin-7-O-[6-sinapoyl]-glucoside decreased in the shoots of both cultivars with the application of Si alone or in combination with Al (Figure 2E,F). Moreover, isovitexin-7-O-[6-feruloyl]-glucoside significantly increased in Scarlett shoots when the plants were exposed to the Al treatment (Figure 2G). In contrast, Sebastian plants treated with Si showed a decrease in the concentration of this phenol, irrespective of Al addition (Figure 2G).
In addition, we observed that the interaction between cultivar and treatment significantly affected the caffeoylquinic acid isomer (CQA) concentration. In the roots, a higher concentration of CQA was found for Sebastian compared to Scarlett in all treatments (Figure 2B). Sebastian showed a decrease in its concentration compared to control when plants were treated with Si and Al alone or in combination. Scarlett did not show any difference in the CQA concentration among the different treatments.
3.2.2. Radical Scavenging Activity
The interaction between cultivar and treatment significantly affected radical scavenging activity in shoots and roots (Figure 1C,D). In fact, radical scavenging activity in plant tissues of both cultivars increased following the addition of 0.2 mM Al compared to the control. A further increase was found in roots and shoots of barley cultivars simultaneously supplied with Al and Si. For Sebastian, the highest antioxidant capacity was observed in the roots (Figure 1D) of plants treated with Al and Si, showing a 22-fold increase as compared to the control. For Scarlett, the highest antioxidant capacity was also observed in shoots (Figure 1C) and roots (Figure 1D) as a consequence of the simultaneous addition of Si and Al, with a 13-fold and 1.7-fold increase, respectively, as compared to the control.
3.2.3. Oxidative Damage
Lipid peroxidation was not significantly affected by the interaction between cultivar and treatment, but a significant effect of Al/Si treatments on oxidative damage was observed. Barley cultivars showed an increase in lipid peroxidation as a result of the application of 0.2 mM Al. For Sebastian this increase was about 44% in shoots and 29% in roots, whereas for Scarlett the oxidative damage increased by 28% in shoots and 57% in roots in Al-treated plants (Figure 1E,F). By contrast, lipid peroxidation decreased in Sebastian shoots (Figure 1E) when Si was applied alone (38%) or in combination with Al (35%). Likewise, in roots, this reduction was about 75% and 60%, respectively (Figure 1F). Similarly, a reduction in lipid peroxidation was observed in Scarlett following Si addition (29% in shoots and 60% in roots) compared to control. Moreover, plants supplied with 0.2 mM Al and 2 mM Si showed a reduction in lipid peroxidation of about 37% in shoots and 68% in roots, compared to plants exposed to 0.2 mM Al (Figure 1E,F).
3.3. Silicon Influence on Plant Structure
3.3.1. Plant Stretching
We measured hypocotyl stretching by using an extensometer to evaluate cell wall creep in culms of plants cultivated under the different experimental treatments. Barley culm stretching was significantly influenced by the interaction between cultivar and treatment (Figure 3). For both cultivars, when Al was applied alone, greater stretching was evidenced compared to the control. However, Si addition decreased the stretching independent of added Al, thus improving the strength of the tissues.
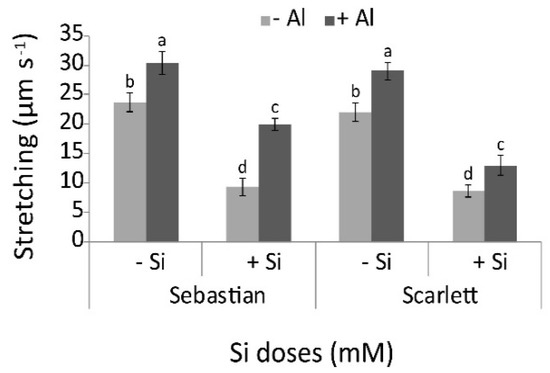
Figure 3.
Stretching culm of the two barley cultivars in all treatments (0 or 0.2 mM Al, combined with 0 or 2 mM Si). Values represent the mean of three replicates per treatment ± SD. Different letters indicate statistically significant differences (p ≤ 0.05) among treatments. The lower case letters represent significant differences between treatments for the same barley cultivar. The upper case letters indicate significant differences between barley cultivars for the same treatment. When uppercase letters do not appear, no significant differences between the same treatment in different cultivars were found.
3.3.2. Lignin Content and Composition
Sebastian and Scarlett shoots and roots showed greater lignin accumulation when Al or Si was applied (Figure 4). The highest accumulation was observed in both cultivars under the +Al/+Si treatment.
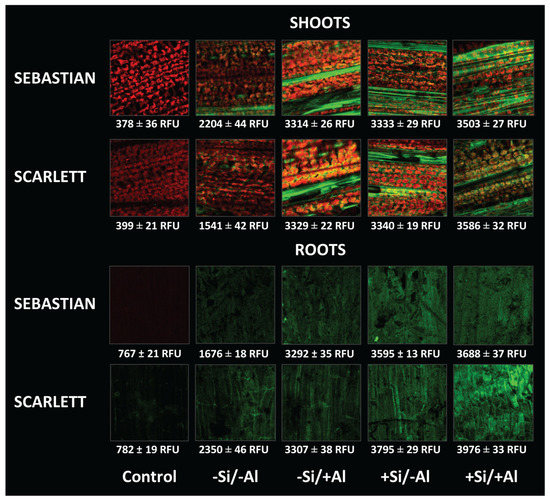
Figure 4.
Visualization of lignin contents (green color) in barley roots and shoots of Sebastian and Scarlett cultivars, harvested after 21 days. Treatments were 0 or 0.2 mM Al, combined with 0 or 2 mM Si. The detection of safranine fluorescence was expressed as relative fluorescence unit (RFU). Values represent the mean of three replicates per treatment ± SD.
The effect of Al and Si on the total lignin calculated as the sum of monomers vanillyl (V), syringyl (S) and cinnamyl (C) and its composition were determined. The interaction between cultivar and treatment had a significant effect on lignin monomers and total lignin concentration of shoots and roots. Accordingly, Sebastian shoots showed an increase in cinnamyl and total lignin concentration (Figure 5A) as a consequence of Al addition. In the roots, the lignin concentration was reduced in the +Al/+Si treatment (Figure 6A). For Scarlett, increased concentrations of vanillyl phenols (shoots), cinnamyl phenols (roots) and total lignin (roots) were recorded in the +Al/+Si treatment compared to control (Figure 5B and Figure 6B).
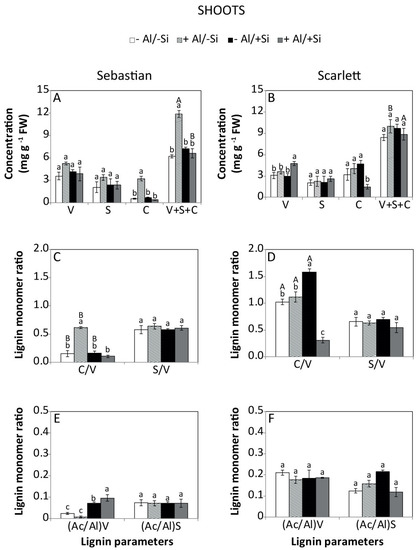
Figure 5.
Lignin parameters of the shoots of Sebastian and Scarlett barley cultivars. The main lignin groups (A,B), comprising vanillyl [V], syringyl [S] and cinnamyl [C] phenols, and total lignin concentration [S + V + C]; their ratios (C,D); and acid to aldehyde ratios (E,F) of vanillyl [(Ac/Al)v] and syringyl [(Ac/Al)s]. Treatments were 0 or 0.2 mM Al, combined with 0 or 2 mM Si. Values represent the mean of three replicates per treatment ± SD. Different letters indicate statistically significant differences (p ≤ 0.05) among treatments. The lower case letters represent significant differences between treatments for the same barley cultivar. The upper case letters indicate significant differences between barley cultivars for the same treatment. When uppercase letters do not appear, no significant differences between the same treatment in different cultivars were found.
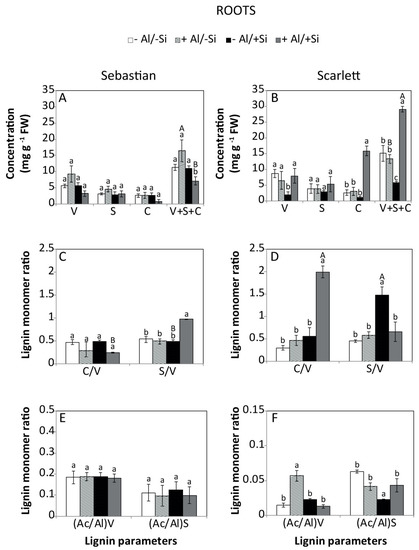
Figure 6.
Lignin parameters of the roots of Sebastian and Scarlett barley cultivars. The main lignin groups (A,B), comprising vanillyl [V], syringyl [S] and cinnamyl [C] phenols, and total lignin concentration [S + V + C]; their ratios (C,D); and acid to aldehyde ratios (E,F) of vanillyl [(Ac/Al)v], and syringyl [(Ac/Al)s]. Treatments were 0 or 0.2 mM Al, combined with Si (0 or 2 mM). Values represent the mean of three replicates per treatment ± SD. Different letters indicate statistically significant differences (p ≤ 0.05) among treatments. The lower case letters represent significant differences between treatments for the same barley cultivar. The upper case letters indicate significant differences between barley cultivars for the same treatment. When uppercase letters do not appear, no significant differences between the same treatment in different cultivars were found.
Sebastian shoots showed an increased cinnamyl:vanillyl (C/V) ratio when Al was supplied (Figure 5C), whereas the syringyl:vanillyl (S/V) ratio of roots exhibited higher values for the +Al/+Si treatment (Figure 6C). In contrast, the C/V (shoots) and S/V (roots) ratios of Scarlett were enhanced by 2 mM Si. Moreover, the C/V ratio of shoots was reduced when 0.2 mM Al and 2 mM Si were added, whereas it was increased in roots (Figure 5D and Figure 6D). The acid to aldehyde ratio of vanillin in Sebastian shoots was enhanced by Si supply, irrespective of the Al dose (Figure 5E). Similarly, Scarlett roots in the +Al/−Si treatment increased the acid to aldehyde ratio of vanillin (Figure 6F). Conversely, plants treated with −Al/+Si reduced the acid to aldehyde ratio of syringyl (Figure 6F).
4. Discussion
It is well known that the effects of Al on plant growth vary markedly among plant species and cultivars [44]. In this respect, the Scarlett cultivar was more sensitive to Al than the Sebastian cultivar, and showed a higher Al concentration in the roots and shoots and a much lower plant dry weight (DW) than Sebastian (Table 1 and Table 2). These findings agree with the greater Al-tolerance of Sebastian, and with earlier research showing different Al sensitivity for both barley cultivars in the short-term [17]. On the other hand, Si supply increased root DW in Sebastian and Scarlett cultivars. Nevertheless, both Si and Al concentrations were reduced in plant tissues when Al and Si were added simultaneously. Thus, our findings confirmed the improvement in plant growth and Al detoxification in plant tissues due to Si addition, which is in agreement with similar studies of other plant species [8,18,33,45,46].
In previous investigations, Si resulted in an improvement in the antioxidant system of plants subjected to abiotic stresses [1,2,3,11,12,14,47]. Under Si supply, different biochemical responses during Al exposure such as an increment in antioxidant compounds (e.g. phenols compounds, vitamins) and enzyme activities have been reported [30,48,49,50,51]. We observed an increase in both soluble phenol concentration and free radical scavenging activity in roots exposed to the +Al/+Si treatment (Figure 1B,D). This increase was accompanied by a reduction in lipid peroxidation (Figure 1F), which was more evident in the Al-sensitive (Scarlett) than in the Al-tolerant (Sebastian) cultivar. These responses could be at least partially associated with either the mitigation of Al stress through Al chelation by flavonoids at the cell wall level [16,52] or the incorporation of soluble phenols into the lignin biosynthetic pathway as demonstrated by the increase in lignin content under Al supply (Figure 4).
Additionally, we identified caffeoylquinic acid isomer (CQA), which belongs to the group of chlorogenic acids, in the roots of both barley cultivars (Figure 2A). In this context, chlorogenic acids function as intermediates in the lignin biosynthesis pathway, and they are regarded as powerful antioxidant compounds [53]. In all treatments, a higher CQA concentration was found in Sebastian roots as compared to those of Scarlett (Figure 2B). Nevertheless, Sebastian showed a reduction in CQA concentration compared to the control when plants were treated with either Si or Al alone or in combination, whereas in Scarlett the decrease in CQA was only found in the +Al/+Si treatment. Since chlorogenic acids are one of the main building blocks of lignin, the decrease of CQA due to the combined application of Si and Al might be associated with the greater accumulation of lignin in the roots (Figure 4).
The phenolic compounds identified in shoots belong to the group of flavonoids, specifically flavone-glucosides (i.e., compounds (1) to (7) mentioned above). Briefly, lutonarin, apigenin derivate (apigenin-pentoxide-hexoside) and saponarin derivatives (isovitexin-7-O-[6-sinapoyl]-glucoside, isovitexin-7-O-[6-feruloyl]-glucoside) were identified and quantified (Figure 2C). These compounds were similar to those already described for barley shoots [54,55]. In our study, the concentration of lutonarin and apigenin-pentoxide-hexoside was decreased in Sebastian shoots in all treatments compared to control, but no changes in lutonarin were observed in Scarlett (Figure 2D,E). However, the concentration of isovitexin-7-O-[6-feruloyl]-glucoside was increased 2.7-fold by Al addition (Figure 2G). Despite the reduction in flavones as a result of Al or Si addition, high antioxidant activity by flavonoids such as saponarin and lutonarin has been reported in barley shoots [56].
On the other hand, increased lignin accumulation in shoots following Al and Si supply was observed for both cultivars (Figure 4). In fact, a reduction in culm stretching after Si addition in barley plants confirmed there was an improvement in lignin accumulation in shoots irrespective of Al addition (Figure 3). In the Al-sensitive cultivar (Scarlett) total lignin concentration in roots, quantified as the sum of the monomers (V + C + S), was improved by Si addition under Al stress. This increase is in agreement with the higher intensity of safranine staining (Figure 4), and supports previous findings showing that Si has a mitigating effect due to increased production of lignin under stressful conditions [19,22,57]. Such an effect may be associated with either increased hydrogen peroxide production or peroxidase activity in cell walls [58,59]. Likewise, it has been demonstrated that Si increases the activities of enzymes such as peroxidase, polyphenol oxidase, and phenylalanine ammonia lyase, which are involved in the lignin biosynthesis pathway [18,60].
Moreover, differences in lignin composition have been observed under stress conditions [61,62,63,64,65], but little is known about the role that lignin with different compositions might exert in vascular plants [66]. While the monomer composition allows us to distinguish the origin of vegetation (i.e., angiosperms or gymnosperms), C/V and S/V ratios could be used as indicators of the origin and degradability of lignin [67,68]. Thus, the range of individual monomers (V, C, S) obtained here (Figure 5A,B and Figure 6A,B) agree with those reported in grasses [69]. In Scarlett roots, increased C/V and S/V ratios were observed in plants treated with Si, irrespective of the Al addition (Figure 6D). A similar trend in the S/V ratio in Sebastian roots was found due to the combined application of 0.2 mM Al and 2 mM Si (Figure 6C). In addition, Si decreased the acid to aldehyde ratio of V in Scarlett roots (Figure 6F). Higher proportions of C and S units indicate lower lignin stability and may influence biogeochemical cycling differently after it is returned to soil. Further studies under field conditions are needed to confirm this hypothesis.
Hence, Si fertilization in barley can be envisaged as a key strategy for counteracting Al toxicity. Changes in soluble phenols and lignin production/composition mediated by Si appear to be involved in improving the performance of barley cultivars, since an enhancement in root growth and plant antioxidant ability was observed when Si was supplied to Al stressed plants. Some hypotheses have been proposed to explain the possible linkage between Si and phenol metabolism. For example, Williams [70] proposed that OH groups of phenols are condensed with Si(OH) in biological systems, and Inanaga et al. [24] suggested that Si may be associated with lignin-carbohydrate complexes in the wall of epidermal cells. Silicon might also be involved in signal transduction pathways, thus inducing lignin production [21]. Despite the evidence regarding the impact of Si supply on the production of antioxidant or structural phenolic compounds, the mechanisms implicated in the modulation of phenolic metabolism by Si need to be investigated further.
Author Contributions
Data curation, I.V.; Formal analysis, I.V., C.R., A.R. and D.F.C.; Funding acquisition, P.C.; Methodology, I.V.; Supervision, P.C.; Visualization, I.V.; Writing—original draft, I.V.; Writing—review & editing, I.V., C.R., A.R., D.F.C., M.d.l.L.M. and P.C. All authors have read and agreed to the published version of the manuscript.
Funding
This research was funded by FONDECYT projects 1161326 and 1201257.
Acknowledgments
The authors gratefully acknowledge the Institute of Ecology and Environmental Sciences of Paris, Institute of Plant Production and Protection of Universidad Austral de Chile, University of Castilla-La Mancha, Spain, Centro de Investigación en Micorrizas y Sustentabilidad Agroambiental and Scientific and Technological Bioresource Nucleus of Universidad de La Frontera, for providing access to specialized equipment used in phenolics, lignin and plant stretching analyses. The authors also thank the Maltexco company for contributing the barley seeds used in this research and Dirección de Investigación of Universidad de La Frontera. CR acknowledges the MEC-CONICYT project 80180025.
Conflicts of Interest
The authors declare no conflict of interest.
References
- Liang, Y.; Wong, J.W.C.; Wei, L. Silicon-mediated enhancement of cadmium tolerance in maize (Zea mays L.) grown in cadmium contaminated soil. Chemosphere 2005, 58, 475–483. [Google Scholar] [CrossRef] [PubMed]
- Kim, Y.H.; Khan, A.L.; Waqas, M.; Lee, I.J. Silicon regulates antioxidant activities of crop plants under abiotic-induced oxidative stress: A review. Front. Plant Sci. 2017, 8, 510. [Google Scholar] [CrossRef] [PubMed]
- Wang, M.; Gao, L.; Dong, S.; Sun, Y.; Shen, Q.; Guo, S. Role of silicon on plant–pathogen interactions. Front. Plant Sci. 2017, 8, 701. [Google Scholar] [CrossRef] [PubMed]
- Ma, J.F.; Yamaji, N. Silicon uptake and accumulation in higher plants. Trends Plant Sci. 2006, 11, 392–397. [Google Scholar] [CrossRef]
- Ma, J.F.; Tamai, K.; Yamaji, N.; Mitani, N.; Konishi, S.; Katsuhara, M.; Yano, M. A silicon transporter in rice. Nature 2006, 440, 688–691. [Google Scholar] [CrossRef]
- Ma, J.F.; Yamaji, N.; Mitani, N.; Tamai, K.; Konishi, S.; Fujiwara, T. An efflux transporter of silicon in rice. Nature 2007, 448, 209–212. [Google Scholar] [CrossRef]
- Pontigo, S.; Ribera, A.; Gianfreda, L.; Mora, M.D.L.L.; Nikoli, M.; Cartes, P. Silicon in vascular plants: Uptake, transport and its influence on mineral stress under acidic conditions. Planta 2015, 242, 23–37. [Google Scholar] [CrossRef]
- Pontigo, S.; Godoy, K.; Jiménez, H.; Gutiérrez-Moraga, A.; Mora, M.L.; Cartes, P. Silicon-mediated alleviation of aluminum toxicity by modulatin of Al/Si uptake and antioxidant performance in ryegrass plants. Front. Plant Sci. 2017, 8, 642. [Google Scholar] [CrossRef]
- Guerriero, G.; Hausman, J.F.; Legay, S. Silicon and the Plant Extracellular Matrix. Front. Plant Sci. 2016, 7, 463. [Google Scholar] [CrossRef]
- Luyckx, M.; Hausman, J.F.; Lutts, S.; Guerriero, G. Silicon and Plants: Current Knowledge and Technological Perspectives. Front. Plant Sci. 2017, 8, 411. [Google Scholar] [CrossRef]
- Abd_Allah, E.F.; Hashem, A.; Alam, P.; Ahmad, P. Silicon alleviates nickel-induced oxidative stress by regulating antioxidant defense and glyoxalase systems in mustard plants. J. Plant Growth Regul. 2019, 38, 1260–1273. [Google Scholar] [CrossRef]
- Lukacova, Z.; Svubova, R.; Janikovicova, S.; Volajova, Z.; Lux, A. Tobacco plants (Nicotiana benthamiana) were influenced by silicon and were not infected by dodder (Cuscuta europaea). Plant Physiol. Biochem. 2019, 139, 179–190. [Google Scholar] [CrossRef] [PubMed]
- Schaller, J.; Heimes, R.; Ma, J.F.; Meunier, J.D.; Shao, J.F.; Fujii-Kashino, M.; Knorr, K.H. Silicon accumulation in rice plant aboveground biomass affects leaf carbon quality. Plant Soil. 2019, 444, 399–407. [Google Scholar] [CrossRef]
- Ahanger, M.A.; Bhat, J.A.; Siddiqui, M.H.; Rinklebe, J.; Ahmad, P. Silicon and secondary metabolites integration in plants: A Significant association in stress tolerance. J. Exp. Bot. 2020. [Google Scholar] [CrossRef] [PubMed]
- Maksimović, J.; Bogdanović, J.; Maksimović, V.; Nikolic, M. Silicon modulates the metabolism and utilization of phenolic compounds in cucumber (Cucumis sativus L.) grown at excess manganese. J. Soil Sci. Plant Nutr. 2007, 170, 739–744. [Google Scholar] [CrossRef]
- Kidd, P.S.; Llugany, M.; Poschenrieder, C.H.; Gunse, B.; Barcelo, J. The role of root exudates in aluminium resistance and silicon-induced amelioration of aluminium toxicity in three varieties of maize (Zea mays L.). J. Exp. Bot. 2001, 52, 1339–1352. [Google Scholar] [CrossRef][Green Version]
- Vega, I.; Nikolic, M.; Pontigo, S.; Godoy, K.; Mora, M.D.L.L.; Cartes, P. Silicon improves the production of high antioxidant or structural phenolic compounds in barley cultivars under aluminum stress. Agronomy 2019, 9, 388. [Google Scholar] [CrossRef]
- Ribera-Fonseca, A.; Rumpel, C.; Mora, M.L.; Nikolic, M.; Cartes, P. Sodium silicate and calcium silicate differentially affect silicon and aluminium uptake, antioxidant performance and phenolics metabolism of ryegrass in an acid Andisol. Crop. Pasture Sci. 2018, 69, 205–215. [Google Scholar] [CrossRef]
- Filha, M.X.; Rodrigues, F.A.; Domiciano, G.P.; Oliveira, H.V.; Silveira, P.R.; Moreira, W.R. Wheat resistance to leaf blast mediated by silicon. Australas. Plant Pathol. 2011, 40, 28–38. [Google Scholar] [CrossRef]
- Shetty, R.; Fretté, X.; Jensen, B.; Shetty, N.P.; Jensen, J.D.; Jørgensen, H.J.L.; Christensen, L.P. Silicon-induced changes in antifungal phenolic acids, flavonoids, and key phenylpropanoid pathway genes during the interaction between miniature roses and the biotrophic pathogen Podosphaera pannosa. Plant Physiol. 2011, 157, 2194–2205. [Google Scholar] [CrossRef]
- Fleck, A.T.; Nye, T.; Repenning, C.; Stahl, F.; Zahn, M.; Schenk, M.K. Silicon enhances suberization and lignification in roots of rice (Oryza sativa). J. Exp. Bot. 2010, 62, 2001–2011. [Google Scholar] [CrossRef] [PubMed]
- Hussain, S.; Shuxian, L.; Mumtaz, M.; Shafiq, I.; Iqbal, N.; Brestic, M.; Bing, C. Foliar application of silicon improves stem strength under low light stress by regulating lignin biosynthesis genes in soybean (Glycine max (L.) Merr.). J. Hazard. Mater. 2020, 123256. [Google Scholar] [CrossRef]
- Shahnaz, G.; Shekoofeh, E.; Kourosh, D.; Moohamadbagher, B. Interactive effects of silicon and aluminum on the malondialdehyde (MDA), proline, protein and phenolic compounds in Borago officinalis L. J. Med. Plant Res. 2011, 5, 5818–5827. [Google Scholar]
- Inanaga, S.; Okasaka, A.; Tanaka, S. Does silicon exist in association with organic compounds in rice plant? J. Soil Sci. 1995, 41, 111–117. [Google Scholar] [CrossRef]
- Watteau, F.; Villemin, G. Ultrastructural study of the biogeochemical cycle of silicon in the soil and litter of a temperate forest. Eur. J. Soil Sci. 2001, 52, 385–396. [Google Scholar] [CrossRef]
- Baik, B.K.; Ullrich, S.E. Barley for food: Characteristics, improvement, and renewed interest. J. Cereal Sci. 2008, 48, 233–242. [Google Scholar] [CrossRef]
- Lahouar, L.; El Arem, A.; Ghrairi, F.; Chahdoura, H.; Salem, H.B.; El Felah, M.; Achour, L. Phytochemical content and antioxidant properties of diverse varieties of whole barley (Hordeum vulgare L.) grown in Tunisia. Food Chem. 2014, 145, 578–583. [Google Scholar] [CrossRef]
- Stuper-Szablewska, K.; Perkowski, J. Phenolic acids in cereal grain: Occurrence, biosynthesis, metabolism and role in living organisms. Crit. Rev. Food Sci. 2019, 59, 664–675. [Google Scholar] [CrossRef]
- Hammond, K.E.; Evans, D.E.; Hodson, M.J. Aluminium/silicon interactions in barley (Hordeum vulgare L.) seedlings. Plant Soil 1995, 173, 89–95. [Google Scholar] [CrossRef]
- Balakhnina, T.I.; Matichenkov, V.V.; Wlodarczyk, T.; Borkowska, A.; Nosalewicz, M.; Fomina, I.R. Effects of silicon on growth processes and adaptive potential of barley plants under optimal soil watering and flooding. Plant Growth Regul. 2012, 67, 35–43. [Google Scholar] [CrossRef]
- Cocker, K.M.; Evans, D.E.; Hodson, M.J. The amelioration of aluminium toxicity by silicon in higher plants: Solution chemistry or an in planta mechanism? Physiol. Plant. 1998, 104, 608–614. [Google Scholar] [CrossRef]
- Khandekar, S.; Leisner, S. Soluble silicon modulates expression of Arabidopsis thaliana genes involved in copper stress. J. Plant Physiol. 2011, 168, 699–705. [Google Scholar] [CrossRef] [PubMed]
- Dorneles, A.O.S.; Pereira, A.S.; Sasso, V.M.; Possebom, G.; Tarouco, C.P.; Schorr, M.R.W.; Tabaldi, L.A. Aluminum stress tolerance in potato genotypes grown with silicon. Bragantia 2019. [Google Scholar] [CrossRef]
- Taylor, G.J.; Foy, C.D. Effects of aluminum on the growth and element composition of 20 winter cultivars of Triticum aestivum L. (wheat) grown in solution culture. J. Plant Nutr. 1985, 8, 811–824. [Google Scholar] [CrossRef]
- Sadzawka, A.; Carrasco, M.; Demane, R.; Flores, H.; Grez, R.; Mora, M.L.; Neaman, A. Métodos de análisis de tejidos vegetales. Serie Actas INIA 2007, 40, 140. [Google Scholar]
- Pavlovic, J.; Samardzic, J.; Maksimović, V.; Timotijevic, G.; Stevic, N.; Laursen, K.H.; Nikolic, M. Silicon alleviates iron deficiency in cucumber by promoting mobilization of iron in the root apoplast. N. Phytol. 2013, 198, 1096–1107. [Google Scholar] [CrossRef]
- Slinkard, K.; Singleton, V.L. Total phenol analysis: Automation and comparison with manual methods. Am. J. Enol. Vitic. 1977, 28, 49–55. [Google Scholar]
- Santander, C.; Ruiz, A.; García, S.; Aroca, R.; Cumming, J.; Cornejo, P. Efficiency of two arbuscular mycorrhizal fungal inocula to improve saline stress tolerance in lettuce plants by changes of antioxidant defense mechanisms. J. Sci. Food Agric. 2020, 100, 1577–1587. [Google Scholar] [CrossRef]
- Chinnici, F.; Bendini, A.; Gaiani, A.; Riponi, C. Radical scavenging activities of peels and pulps from cv. Golden Delicious apples as related to their phenolic composition. J Agric. Food Chem. 2004, 52, 4684–4689. [Google Scholar] [CrossRef]
- Du, Z.; Bramlage, W.J. Modified thiobarbituric acid assay for measuring lipid oxidation in sugar-rich plant tissue extracts. J Agric. Food Chem. 1992, 40, 1566–1570. [Google Scholar] [CrossRef]
- Perini, M.A.; Sin, I.N.; Martinez, G.A.; Civello, P.M. Measurement of expansin activity and plant cell wall creep by using a commercial texture analyzer. Electron J. Biotechnol. 2017, 26, 12–19. [Google Scholar] [CrossRef]
- Sant’Anna, V.; Gurak, P.D.; Marczak, L.D.F.; Tessaro, I.C. Tracking bioactive compounds with colour changes in foods–A review. Dyes Pigments 2013, 98, 601–608. [Google Scholar] [CrossRef]
- Kögel, I.; Bochter, R. Characterization of lignin in forest humus layers by high-performance liquid chromatography of cupric oxide oxidation products. Soil Biol. Biochem. 1985, 17, 637–640. [Google Scholar] [CrossRef]
- Singh, S.; Tripathi, D.K.; Singh, S.; Sharma, S.; Dubey, N.K.; Chauhan, D.K.; Vaculík, M. Toxicity of aluminium on various levels of plant cells and organism: A review. Environ. Exp. Bot. 2017, 137, 177–193. [Google Scholar] [CrossRef]
- De Freitas, L.B.; Fernandes, D.M.; Maia, S.C.M.; Fernandes, A.M. Effects of silicon on aluminum toxicity in upland rice plants. Plant Soil. 2017, 420, 263–275. [Google Scholar] [CrossRef]
- De Jesus, L.R.; Batista, B.L.; da Silva Lobato, A.K. Silicon reduces aluminum accumulation and mitigates toxic effects in cowpea plants. Acta Physiol. Plant. 2017, 39, 138. [Google Scholar] [CrossRef]
- Vaculík, M.; Lukačová, Z.; Bokor, B.; Martinka, M.; Tripathi, D.K.; Lux, A. Alleviation mechanisms of metal (loid) stress in plants by silicon: A review. J. Exp. Bot. 2020. [Google Scholar] [CrossRef]
- Zhang, Y.M.; Li, Y.; Chen, W.F.; Wang, E.T.; Tian, C.F.; Li, Q.Q.; Chen, W.X. Biodiversity and biogeography of rhizobia associated with soybean plants grown in the North China Plain. Appl. Environ. Microbiol. 2011, 77, 6331–6342. [Google Scholar] [CrossRef]
- Zhu, Z.; Wei, G.; Li, J.; Qian, Q.; Yu, J. Silicon alleviates salt stress and increases antioxidant enzymes activity in leaves of salt-stressed cucumber (Cucumis sativus L.). Plant Sci. 2004, 167, 527–533. [Google Scholar] [CrossRef]
- Farooq, M.A.; Ali, S.; Hameed, A.; Ishaque, W.; Mahmood, K.; Iqbal, Z. Alleviation of cadmium toxicity by silicon is related to elevated photosynthesis, antioxidant enzymes; suppressed cadmium uptake and oxidative stress in cotton. Ecotoxicol. Environ. Saf. 2013, 96, 242–249. [Google Scholar] [CrossRef]
- Farooq, M.A.; Saqib, Z.A.; Akhtar, J.; Bakhat, H.F.; Pasala, R.K.; Dietz, K.J. Protective role of silicon (Si) against combined stress of salinity and boron (B) toxicity by improving antioxidant enzymes activity in rice. Silicon 2019, 11, 1–5. [Google Scholar] [CrossRef]
- Wang, Y.; Stass, A.; Horst, W.J. Apoplastic binding of aluminum is involved in silicon-induced amelioration of aluminum toxicity in maize. Plant Physiol. 2004, 136, 3762–3770. [Google Scholar] [CrossRef] [PubMed]
- Silva, N.; Mazzafera, P.; Cesarino, I. Should I stay or should I go: Are chlorogenic acids mobilized towards lignin biosynthesis? Phytochemistry 2019, 166, 112063. [Google Scholar] [CrossRef] [PubMed]
- Ferreres, F.; Andrade, P.B.; Valentao, P.; Gil-Izquierdo, A. Further knowledge on barley (Hordeum vulgare L.) leaves O-glycosyl-C-glycosyl flavones by liquid chromatography-UV diode–array detection-electrospray ionisation mass spectrometry. J. Chromatogr. A 2008, 1182, 56–64. [Google Scholar] [CrossRef] [PubMed]
- Piasecka, A.; Jedrzejczak-Rey, N.; Bednarek, P. Secondary metabolites in plant innate immunity: Conserved function of divergent chemicals. N. Phytol. 2015, 206, 948–964. [Google Scholar] [CrossRef] [PubMed]
- Kamiyama, M.; Shibamoto, T. Flavonoids with potent antioxidant activity found in young green barley leaves. J. Agric. Food Chem. 2012, 60, 6260–6267. [Google Scholar] [CrossRef]
- Zhang, J.L.; Shi, H. Physiological and molecular mechanisms of plant salt tolerance. Photosynth. Res. 2013, 115, 1–22. [Google Scholar] [CrossRef]
- Yang, Y.F.; Liang, Y.C.; Lou, Y.S.; Sun, W.C. Influences of silicon on peroxidase, superoxide dismutase activity and lignin content in leaves of wheat Tritium aestivum L. and its relation to resistance to powdery mildew. Sci. Agric. Sin. 2003, 36, 813–817. [Google Scholar]
- Ma, J.F.; Yamaji, N.; Mitani, N. Transport of silicon from roots to panicles in plants. Proc. Jpn. Acad. Ser. B Phys. Biol. Sci. 2011, 87, 377–385. [Google Scholar] [CrossRef]
- Cai, X.N.; Davis, E.J.; Ballif, J.; Liang, M.X.; Bushman, E.; Haroldsen, V.; Torabinejad, J.; Wu, Y.J. Mutant identification and characterization of the laccase gene family in Arabidopsis. J. Exp. Bot. 2006, 57, 2563–2569. [Google Scholar] [CrossRef]
- Betz, G.A.; Knappe, C.; Lapierre, C.; Olbrich, M.; Welzl, G.; Langebartels, C.; Ernst, D. Ozone affects shikimate pathway transcripts and monomeric lignin composition in European beech (Fagus sylvatica L.). Eur. J. For. Res. 2009, 128, 109–116. [Google Scholar] [CrossRef]
- Cabané, M.; Pireaux, J.C.; Léger, E.; Weber, E.; Dizengremel, P.; Pollet, B.; Lapierre, C. Condensed lignins are synthesized in poplar leaves exposed to ozone. Plant Physiol. 2004, 134, 586–594. [Google Scholar] [CrossRef] [PubMed]
- Finger-Teixeira, A.; Ferrarese, M.D.L.L.; Soares, A.R.; da Silva, D.; Ferrarese-Filho, O. Cadmium-induced lignification restricts soybean root growth. Ecotoxicol. Environ. Saf. 2010, 73, 1959–1964. [Google Scholar] [CrossRef] [PubMed]
- Frankenstein, C.; Schmitt, U.; Koch, G. Topochemical studies on modified lignin distribution in the xylem of poplar (Populus spp.) after wounding. Ann. Bot. 2006, 97, 195–204. [Google Scholar] [CrossRef] [PubMed]
- Pitre, F.; Cooke, J.; Mackay, J. Short-term effects of nitrogen availability on wood 1056 formation and fibre properties in hybrid poplar. Trees Struct. Funct. 2007, 1057, 249–259. [Google Scholar] [CrossRef]
- Liu, Q.; Luo, L.; Zheng, L. Lignins: Biosynthesis and biological functions in plants. Int. J. Mol. Sci. 2018, 19, 335. [Google Scholar] [CrossRef]
- Thevenot, M.; Dignac, M.F.; Rumpel, C. Fate of lignins in soils: A review. Soil Biol. Biochem. 2010, 42, 1200–1211. [Google Scholar] [CrossRef]
- Abiven, S.; Heim, A.; Schmidt, M.W. Lignin content and chemical characteristics in maize and wheat vary between plant organs and growth stages: Consequences for assessing lignin dynamics in soil. Plant Soil 2011, 343, 369–378. [Google Scholar] [CrossRef]
- Otto, A.; Shunthirasingham, C.; Simpson, M.J. A comparison of plant and microbial biomarkers in grassland soils from the Prairie Ecozone of Canada. Org. Geochem. 2005, 36, 425–448. [Google Scholar] [CrossRef]
- Williams, R.J.P. Introduction to Silicon Chemistry and Biochemistry. In Silicon Biochemistry; John Wiley & Sons: Hoboken, NJ, USA, 1986; pp. 24–29. [Google Scholar]


© 2020 by the authors. Licensee MDPI, Basel, Switzerland. This article is an open access article distributed under the terms and conditions of the Creative Commons Attribution (CC BY) license (http://creativecommons.org/licenses/by/4.0/).