Abstract
Soils represent the largest terrestrial sink of carbon (C) on Earth, yet the quantification of the amount of soil organic carbon (SOC) is challenging due to the spatial variability inherent in agricultural soils. Our objective was to use a grid sampling approach to assess the magnitude of SOC variability and determine the current SOC stocks in three typical agricultural fields in Maryland, United States. A selected area in each field (4000 m2) was divided into eight grids (20 m × 25 m) for soil sample collection at three fixed depth intervals (0–20 cm, 20–40 cm, and 40–60 cm). Soil pH in all fields was significantly (p < 0.05) greater in the surface soil layer (6.2–6.4) than lower soil layers (4.7–5.9). The mean SOC stocks in the surface layers (0–20 cm: 1.7–2.5 kg/m2) were 47% to 53% of the total SOC stocks at 0–60 cm depth, and were significantly greater than sub-surface layers (20–40 cm: 0.9–1.3 kg/m2; 40–60 cm: 0.8–0.9 kg/m2). Carbon to nitrogen (C/N) ratio and stable C isotopic composition (δ13C) were used to understand the characteristics of SOC in three fields. The C/N ratio was positively corelated (r > 0.96) with SOC stocks, which were lower in sub-surface than surface layers. Differences in C/N ratios and δ13C signatures were observed among the three fields. The calculated values of SOC stocks at 0–60 cm depth ranged from 37 to 47 Mg/ha and were not significantly different in three fields likely due to the similar parent material, soil types, climate, and a short history of changes in management practices. A small variability (~10% coefficient of variation) in SOC stocks across eight sampling grids in each field suggests that re-sampling these grids in the future can lead to accurately determining and tracking changes in SOC stocks.
1. Introduction
Soils are the largest sink of carbon (C) on Earth and store ~1500 petagrams (1 Pg = 1015 g) of C up to 1 m depth, which is two times higher than the atmosphere (750–950 Pg C) and three times higher than total vegetation (600 Pg C) [1,2,3]. A part of the stored C in soils is lost to the atmosphere as carbon dioxide (CO2) and methane, which contributes to greenhouse gas emissions. Agricultural activities such as enteric fermentation in animals, manure management, urea fertilization, and liming accounted for 619 million metric tons of CO2 equivalents or ~10% of total greenhouse gas emissions in the United States in 2018 [4], whereas enteric fermentation and manure management contributed 28% and 10% of total methane emissions from anthropogenic activities, respectively. Other agricultural soil management activities, such as fertilizer application, deposition of livestock manure, and growing N-fixing plants contribute more than 75% of nitrous oxide (N2O) emissions. On the other hand, there are positive aspects of agriculture. For example, it was estimated that global croplands could sequester 0.90 to 1.85 Pg C/yr; this corresponds to 26% to 53% of the soil C sequestration target of the “4 per 1000” initiative established for climate mitigation [5]. Thus, enhancing soil organic C (SOC) sequestration using agricultural management practices can potentially mitigate a part of the greenhouse gas emissions.
Multiple factors, such as land use, soil type, and climate, influence SOC [6,7]. Conversion of native land to agricultural land often results in a decline in SOC due to an increase in erosion, decomposition, and leaching [8,9]. Sanderman et al. [10] used data collected over a 50-year period and estimated that globally 133 Pg of C was lost from the upper 2 m of soil due to agricultural land use. It is widely known that the amount of SOC is greater in surface than sub-surface layers and in fine-textured than medium- and coarse-textured soils [11]. Further, the amount of SOC generally increases with an increase in annual precipitation due to the availability of more water for plant growth and a decrease in temperature due to a reduction in the decomposition of organic matter [6].
Soil quality is linked to the physical, chemical, and biological properties of soil, and is affected by management practices. Recent reviews and meta-analyses have provided insights on how agricultural management practices, such as tillage, crop rotations, cover crops within rotations, and fertilization management, alter the amount of SOC [12,13,14]. For example, a meta-analysis by Poeplau and Don [13] concluded that the use of cover crops led to a significant increase in SOC. Accumulation of SOC is associated with physical protection and chemical interactions with clay minerals [15]. Many field studies have shown that no-tillage generally increases soil organic matter (which contains ~58% of SOC) and aggregate stability in the upper soil layer compared with conventional tillage [16,17]. Luo et al. [18] synthesized the data from 69 global studies and reported that no-tillage enhanced SOC stocks in the top 10 cm of soil, but decreased SOC in the 20 to 40 cm layer, and did not increase SOC below 40 cm. Other meta-analysis indicated that SOC stocks can vary at soil depths between no-tillage and tillage systems [19,20]. Angers and Eriksen-Hamel [19] pointed out that greater SOC content may occur at the bottom of the plow layer under full-inversion tillage. In terms of fertilization, manure application is the most effective way to increase SOC sequestration in agricultural fields [21]. Studies have suggested that it could take several years (more than five years) to change the overall soil functional capacity and determine a significant change in SOC after the alteration of management practices [22].
The carbon to nitrogen (C/N) ratio influences microbial activity in soils and has been used to estimate the quality of soil organic matter and the subsequent decomposition [23]. In general, the C/N ratio of soil has a negative relationship with the decomposition of soil organic matter [24]. Stable C isotopic composition (δ13C) in SOC has been widely used to investigate the sources of organic C and relative contribution of C3 and C4 plants to SOC [25]. Thus, the use of isotopic techniques may allow us to determine SOC dynamics in agricultural soils under different management practices.
Variability in the methods used to assess the changes in SOC stocks present a challenge to accurately determine the magnitude and direction of SOC stock change in agricultural soils. Understanding the current amount and spatial distribution of SOC can help to quantify and track C, which can help to sequester more C in soils to mitigate climate change concerns. Knowledge of a precise amount of SOC can then be used by policymakers to incentivize the adoption of practices that will maximize SOC stocks. At the state level in Maryland, United States, the legislation passed a bill in 2017 to promote soil health programs and practices [26]. This policy defined a need to develop local capacity to measure SOC and other soil health metrics for the successful implementation of soil health programs. Ellert et al. [27] and Conant et al. [28] suggested a “benchmark site” approach that can be optimized to quantify SOC stocks change over time.
Our objective in this study was to use a grid sampling approach to assess the magnitude of SOC variability and determine the current (baseline) SOC stocks in three typical agricultural fields in Maryland. The results from this study may provide information on ways to quantify and track SOC and how different management practices can be implemented and optimized to enhance C sequestration and increase SOC stocks in soils.
2. Materials and Methods
2.1. Study Sites
The study site consisted of three adjacent fields (hereafter referred to as field A, B, or C) covering a total of 8.34 ha in Prince George’s County, Maryland, United States (Figure 1). The physical characteristics and cropping history of the fields are summarized in Table 1. In brief, fields A (no-tillage) and B (tillage) followed the same cropping history of corn in 2015, wheat and double-cropped soybean (planted after winter wheat harvest) in 2017, whereas field C was under no-tillage and had soybean in 2015, corn in 2016, and wheat and double-cropped soybean in 2017. The field site soils are aquatic hapludults and typic endoaqualts belonging to Adelphi-Holmdel complex and Shrewsbury loam [29]. The soil profile in the three fields consists of the following horizons: A: 0–15 cm: sandy loam, E: 15–48 cm: loamy fine sand, BE: 48–56 cm: fine sandy loam, Bt: 56–119 cm: loam, and BC1: 119–180 cm: fine sandy loam. The elevation at the study site ranges from 34 m to 44 m (Figure S1). The climate in the area is temperate, with a 2018 average annual air temperature of 26 °C and an annual rainfall of 1090 mm [30].
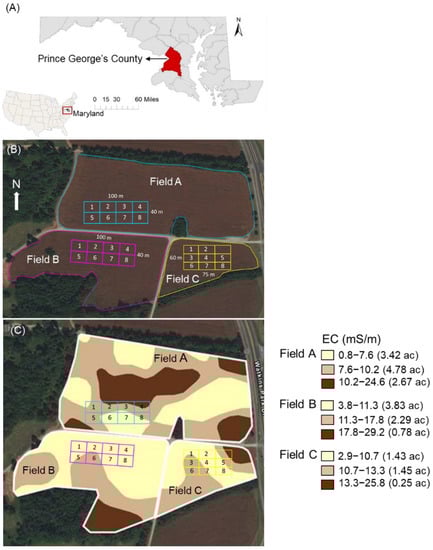
Figure 1.
Location maps of (A) field sites in Prince George’s County, Maryland, United States, (B) sampling sites with marked grids, and (C) spatial distribution of soil electrical conductivity (EC) in three fields (ac: acre). Total area of three adjacent fields is 8.34 ha.

Table 1.
Current and proposed management practices and soil physical characteristics of three field sites.
2.2. Soil Sampling
The three fields were mapped using Veris U-Series equipped with an electrical conductivity (EC) sensor (https://www.veristech.com/the-soil/soil-ec), as shown in Figure 1. The Veris EC sensor unit physically scanned over the surface soil layer of the fields in uniform grids to measure variation in EC, which is based on soil properties as smaller clay soil particles conduct more current than larger silt and sand particles. This means that soils with a high clay content have more EC than soils that contain more sand and silt. Following the identification of areas in the fields with a similar EC range, a part of the field (4000 m2) was selected for soil sampling (Figure 1). The sampling area in each field covers at least two EC ranges to have an area representative of the field and to minimize variability in selected fields. The selected area (500 m2) was then divided into 8 grids of 20 m × 25 m for each field. In each grid, nine sampling locations were identified for soil sample collection. Soil samples were collected from three depths (0−20 cm, 20−40 cm, and 40−60 cm) in December 2018. A composite soil sample for each depth and grid was taken, which resulted in the collection of 24 soil samples for each field.
2.3. Soil Analysis and Soil Organic Carbon Stocks Calculation
All collected soil samples were dried, ground, and sieved through a 2 mm sieve. Soil pH was determined using a 1:2 soil to water weight ratio [31]. Total organic C, total N, 13C, and 15N in soils was determined using high-temperature combustion using a Eurovector® Elemental Analyzer coupled with an Elementar Isoprime® Isotope Ratio Mass Spectrometer (EA-IRMS; Elementar Ltd, Cheadle, UK). A detailed description of the analysis can be found in Hantsoo et al. [32]. In brief, homogenized soils were weighted (5 mg for 13C; 30 mg for 15N) and folded into tin capsules, which were dropped sequentially into a quartz combustion column packed with cobaltous/cobaltic oxides and heated to 1040 °C. For quality assurance and quality control, two urea standards (CH4N2O; 20% C abundance with δ13C = −29.39‰) were run between every 10 soil samples. The δ13C values are measured in standard permil notation according to the following formula:
where R = 13C/12C, the standard for organic C isotopes is Vienna Pee Dee Belemnite, and measurements are reported as ‰ deviations (±0.1‰). Similarly, δ15N values were determined by the same formula for C, where R = 15N/14N, and the accepted standard is atmospheric N2.
δ13C = [(Rsample − Rstandard)/Rstandard] × 1000
Soil bulk density was measured at two locations in each field at three depths. The limited data of soil bulk density collected from three fields (1.3–1.7 g/cm3) falls within the range (1.4–1.7 g/cm3) of the National Resources Conservation Service Soil Survey Geographic Database (NRCS SSURGO). Accurate bulk density values are critical to determining the change in SOC stocks. As we have limited values for field bulk density and these values are similar to the SSURGO database, the bulk density values in three fields at three depths from the SSURGO database were used to calculate total organic C (hereafter referred to as SOC) stocks based on the fixed depth intervals for each field site, as shown in the following equations [33].
The SOC stocks were calculated by adding SOC stocks for each of the three depths for each field as follows.
We also calculated SOC stocks at equivalent soil mass, according to Ellert and Bettany [34]. The equations are as follows:
The additional soil thickness for each field was calculated using the following equation:
For this study, soil mass of the heaviest layer refers to the lowest soil depth (40–60 cm), whereas the soil mass of the fixed depth layer refers to the upper layers (0–20 cm or 20–40 cm). After determining the additional soil thickness (Equation (5)), the SOC value (Mg/ha) for the additional soil thickness was calculated using Equations (1) and (2). This calculated value was then added to the SOC stock value (Equation (3)) determined for fixed depth intervals to compute SOC stocks at equivalent soil mass.
2.4. Statistical Analysis
All statistical analysis was performed with the JMP statistical software package (JMP Pro 13, SAS Institute). Soil pH, SOC stocks at fixed depth and equivalent soil mass, N, δ13C, and δ15N were compared as a function of depth and fields using the one-way Analysis of Variance (ANOVA) Tukey-Kramer HSD test. Differences with p < 0.05 were considered statistically significant. The coefficient of variation (CV) of SOC variability among sampling grids was calculated using distribution function in JMP.
3. Results and Discussion
3.1. Soil pH across Depths and Fields
In three fields, significantly (p < 0.05) higher soil pH values were observed in the surface 0−20 cm layer (mean: 6.2 ± 0.11 to 6.4 ± 0.22) as compared to the 20−40 cm (mean: 5.0 ± 0.30 to 5.9 ± 0.31), and 40−60 cm (mean: 4.7 ± 0.23 to 5.2 ± 0.15) layers (Figure 2A). The soil pH decreased from the surface (0−20 cm) to sub-surface layers in all fields. The pH values in these fields are typical of the pH range (5.5–6.5) commonly found in agricultural soils in the mid-Atlantic region, which includes Maryland [35,36]. No significant differences (p > 0.05) were observed in soil pH in the surface layer among the three fields. In contrast, soil pH in the sub-surface layers was significantly different (p < 0.05) among the three fields. Many agricultural soils become acidic over time due to the leaching of base cations caused by rainfall, the use of nitrogen fertilizers, and the production of organic acids in the rhizosphere [35]. Thus, lime application is commonly recommended and used in the area for soil fertility management. Greater soil pH in the surface soil layer was due to lime application in the fields to raise soil pH. Other studies have shown lime application helps to maintain soil pH at optimum levels (e.g., de Queiroz et al. [37]). Overall, our results of pH decrease with soil depth are similar to previous research by Viscarra Rossel et al. [38] and Hall and Lemon [39].
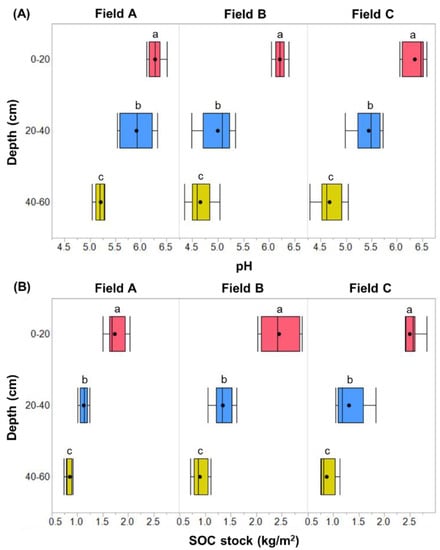
Figure 2.
Median, mean (point), 25th, and 75th percentile of (A) soil pH and (B) soil organic carbon (SOC) stocks (fixed depth) at three depths for each field (n = 8 grids for each depth). The different letters indicate significant differences among three depths (p < 0.05) in each field.
3.2. Depthwise Distribution of Soil Organic Carbon
A significant (p < 0.05) reduction in SOC stocks with depth was observed in all fields (Figure 2B). For example, mean SOC stocks were 1.7 ± 0.18 to 2.5 ± 0.24 kg/m2 at 0−20 cm, 1.1 ± 0.08 to 1.3 ± 0.18 kg/m2 at 20−40 cm, and 0.8 ± 0.14 to 0.9 ± 0.15 kg/m2 at 40−60 cm. The range of SOC stocks in the three fields are comparable to other croplands studies, such as those conducted in Ohio, United States (mean: 0.41–2.24 kg/m2) [40] and southern Germany (mean: 2.0–2.9 kg/m2) [41], but lower than croplands in western Minnesota, United States (mean: 3.27 kg/m2) [42], north-eastern Spain (mean: 3.5–14.7 kg/m2) [33] and western Australia (mean: 3.1 kg/m2) [6]. In general, the mean SOC stocks decreased by 35−47% from 0–20 cm to 20–40 cm and by 25−33% from 20–40 cm to 40−60 cm. Other studies, such as Conant et al. [28] in the southeastern United States, Li et al. [43] in southwestern China, Tsozué et al. [44] in central Africa, Funes et al. [33] in north-eastern Spain, Chen [45] in central Taiwan, and Parras-Alcántara et al. [46] in southern Spain, have also reported a decrease in SOC with depth.
Numerous studies have measured SOC stocks at fixed depth intervals, while a few studies have measured SOC stocks at equivalent soil mass [47,48]. We calculated SOC stocks using both fixed depth and equivalent soil mass (Figure 3). The mean SOC stocks based on fixed depth were 17.4 to 25.0 Mg/ha at 0−20 cm, 11.3 to 13.5 Mg/ha at 20−40 cm, and 8.5 to 9.0 Mg/ha at 40−60 cm, whereas the mean SOC stocks based on the equivalent soil mass were 18.8 to 27.9 Mg/ha at 0−20 cm, 11.9 to 14.3 at 20−40 cm, and 8.5 to 9.0 at 40−60 cm. Overall, the results showed no significant difference in SOC stocks between the fixed depth and equivalent soil mass methods in Maryland soils.
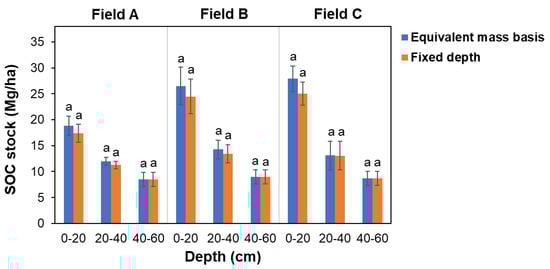
Figure 3.
Soil organic carbon (SOC) stocks calculated based on the equivalent mass and fixed depth at three depths in three fields. The similar letters for each depth indicate no significant differences in SOC stocks between equivalent mass and fixed depth (p < 0.05) for each field.
Soil properties affect SOC as C is stabilized by physical protection (e.g., aggregation, density) and chemical mechanisms (e.g., solubility, mineralogy) [7,15]. The reduction of SOC stocks with depth is linked to the reduction in the amount of soil organic matter, an increase in bulk density, and changes in soil texture. The inverse relationship between soil bulk density and SOC has been well recognized [38,45]. Studies have reported that SOC tends to be higher in soils with high clay and silt than soil with more sand [42,49]. In all fields, the soil bulk density increased with increasing soil depth and soil texture changed from silt loam in the surface layer to loamy sand and sandy loam in the sub-surface layers (Table 1). The higher bulk density with depth indicated that soil compaction and less pore space for root growth likely contributed to lower root biomass and C input in the sub-surface layers. In terms of soil texture, the fine silt particles in the surface layer in the three fields can stabilize and protect soil organic matter from microbial decomposition [50], resulting in higher SOC stocks (Figure 2B). In addition, fine-textured soils tend to have greater nutrient- and water-holding capacities; thereby, these soils can enhance biomass production which consequently increases C input to soils. Future studies to elucidate the dominant mechanisms and soil characteristics linked to the stabilization of SOC are needed to enhance SOC stocks.
3.3. Carbon to Nitrogen Ratios and Stable Isotopes in Agricultural Fields
The mean soil C/N ratios across three fields varied from 6.6 ± 3.75 to 19.9 ± 12.77, with significantly lower C/N ratios in field A than fields B and C (Figure 4A). The variability of C/N ratios among three fields could be affected by cropping history and management practices such as the use of cover crops, which can influence the physical and biological properties of soil. For example, Haruna et al. [51] reported that the use of cover crops improved macropores by 24% as compared to no cover crops, which increased soil hydraulic conductivity. Further, non-leguminous crops such as corn tend to have higher C/N ratios, which favors N immobilization over mineralization [52,53]. In contrast, leguminous crops such as soybean have lower C/N ratios and therefore favor N mineralization. Crop residues on the soil surface can further affect the decomposition of soil organic matter and thus soil C/N ratios. We observed a significant positive correlation (r > 0.96) between C/N ratios and SOC stocks, implying that residues from aboveground leaf litter and below-ground roots are likely the main source of SOC input into the soil (Figure S2). A significant declining trend was observed in soil C/N ratios with soil depth likely due to the decrease in SOC (Figure 4A). Other researchers have also found that the C/N ratios of most soils decrease with soil depth due to lower organic matter content [54]. In addition, the C/N ratio was significantly positively correlated with SOC following vegetation restoration, including farmland. Deng et al. [55] and Shi et al. [25] also found that a low soil C/N ratio was associated with low SOC in the cropping system of the North China Plain.
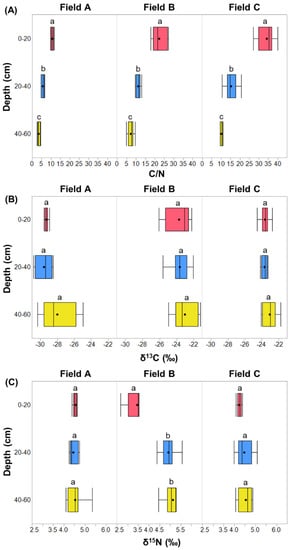
Figure 4.
Median, mean (point), 25th, and 75th percentile of (A) C/N ratios, (B) δ13C, and (C) δ15N across depths in three fields. The different letters indicate significant differences among the three depths (p < 0.05) for each field.
The mean values of δ13C and δ15N at 0–60 cm depth in three fields were −25.3‰ and 4.5‰, respectively (Figure 4B,C), which fall well within the reported values (δ13C: −22.1‰ to −27.2‰ and δ15N: 4.1‰) for agricultural soils [56,57,58]. No significant increasing or decreasing trends of δ13C were observed at three depths in three fields. The values of δ13C in field A (mean: −29.0 ± 1.41‰) were more negative and significantly (p < 0.05) lower than fields B (−23.4 ± 1.31‰) and C (−23.4 ± 0.64‰) (Figure 4B). In contrast, the mean δ15N values at 0–60 cm depth (field A: 4.5 ± 0.26‰; field B: 4.5 ± 0.90‰; field C: 4.4 ± 0.31‰) were not significantly different among three fields (Figure 4C). The lower values of δ13C in field A are likely due to the use of cover crops, as the δ13C signatures of SOC can be affected by different crops. For example, Schaefer et al. [57] reported that cover crops resulted in a decrease of 0.3‰ in δ13C and an increase of 0.1‰ in δ15N as compared to no cover crop soils in California. Overall, the results suggest that the C/N ratio and isotopic 13C signatures could provide useful information for understanding the biogeochemistry of C in agricultural soils with different management practices. The C/N ratios and isotopic signatures obtained in this work provide information about the current levels in mid-Atlantic soils, which can be useful in the future to determine how management practices may alter SOC dynamics.
3.4. Magnitude of Total Soil Organic Carbon Stocks
The mean SOC stocks at 0–60 cm depth ranged from 37 ± 2.6 to 47 ± 6.4 Mg/ha in three fields (Figure 5), whereas the SOC stocks across eight grids were 33–41 Mg/ha in field A, 38–56 Mg/ha in field B, and 42–55 Mg/ha in field C. The standard deviation of SOC stocks across eight grids in fields ranged from 2.6 to 6.4 Mg/ha. The spatial variability of SOC within a plot was observed in other regions of the United States [27,28]. In our three fields, the elevation decreased from northeast to southwest; and fields A and B have a 0–2% slope, and field C has a 2–5% slope (Table 1 and Figure S1). The topography in the three fields likely affected water flow direction, soil moisture content, decomposition of organic matter, and depth of soil formation; these factors then likely contributed to the variability in SOC stocks in fields.
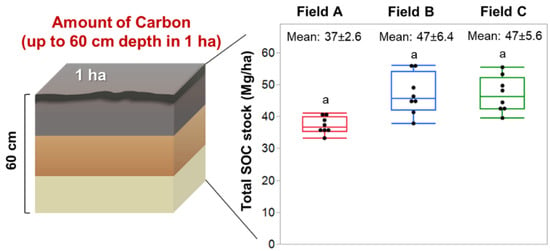
Figure 5.
Median, mean (point), 25th, and 75th percentile of soil organic carbon stocks at 0–60 cm depth in eight sampled grids for each field. Similar letters indicate no significant (p < 0.05) differences in SOC stocks among three fields.
The three fields are typical agricultural fields, with corn-soybean as the main rotation (Table 1). Studies have shown that the average amount of SOC in agricultural soils in Maryland between 2006 and 2011 was 53 to 60 Mg/ha up to 100 cm depth [59]. As the SOC decreases exponentially with depth [33,40,60], the depth from 60 to 100 cm will only add a small amount of SOC stocks. In the surface layer, SOC accounted for 47%, 52%, and 53% of the total SOC stocks for fields A, B, and C, respectively. The contribution of the surface soil layer to SOC has been reported to vary across different climatic regions. For example, the contributions of the top 0–30 cm soil layer to SOC (up to 100 cm depth) was 43–61% in Spain [33], 56–69% in Denmark [61], 59% in Iran [62], and 33% in France [63]. Several studies have reported the importance of climate and soil properties in SOC stocks [6,60,64], whereas other studies have indicated that management practices and land use plays a critical role in SOC stocks [9,16,65]. In summary, the relative contribution of surface and sub-surface layers to total SOC stocks across regions is different, implying that impacts of drivers at regional scales should be taken into consideration in adopting management practices for maximizing SOC sequestration.
A difference in total SOC stocks among the fields with different long-term cropping history and management practices can be expected due to the differences in the amount of C inputs and decomposition dynamics. For example, SOC stocks have been reported to generally increase when no-tillage and cover crops are used [16]. We did not observe any significant differences in SOC in our three adjacent fields likely due to the similar soils, parent material, climate, and a short history (less than two years) of changes in management practices. It is known that a longer period of time is required to detect differences in SOC after the establishment of management practices. For example, the influence of no-tillage on the amount of decomposed C and microbial biomass C was observed after four or eight years of practices in southern Georgia, United States by Adl et al. [22]. Piccoli et al. [66] compared conventional and conservation agriculture management systems for SOC stocks in north-eastern Italy and concluded that soil tillage did not affect microbial C. A meta-analysis to derive SOC stocks in croplands from 30 studies worldwide reported no difference in changes of SOC stocks between tillage and no-tillage treatments [13]. These studies suggest that the management practices used in agricultural ecosystems need sufficient time to allow significant changes in the amount of SOC. Further long-term studies are needed to evaluate how different management practices can be implemented and optimized to enhance C sequestration and increase SOC stocks in soils.
3.5. Spatial Variability and Guidance for Determining Soil Organic Carbon Stocks
The spatial distribution of SOC in three fields is shown in the units of kg/m2 in Figure S3 and in Mg/ha in Figure 6. A significant difference (p < 0.05) in SOC stocks was observed in the surface soil layer among three fields, whereas no statistically significant difference (p > 0.05) was found in sub-surface layers. In the surface layer (0–20 cm), the coefficient of variation (CV) of SOC stocks within eight grids was 11% in field A, 15% in field B, and 9% in field C. In contrast, the CV of SOC stocks within eight grids in the sub-surface layers was 7–17% in field A, 14–16% in field B, and 17–22% in field C. In this study, all three fields were under similar crop rotations (corn-soybean). The amount of above- and below-ground residues in cropping systems are governed by different management practices that can lead to variability in SOC in the surface layer. Spatial variability in the surface soil layer and sub-surface layers is attributed to the variable C inputs of plant materials from crops, residues, and roots. For example, root C input was identified as a major factor affecting SOC stocks in the topsoil profile (0–30 cm) in agricultural systems [66]. In addition, multiple factors such as tillage, crop diversification, and fertilization can influence SOC stocks [16]. A recent review of the impacts of agricultural management practices on soil quality indicated that no-tillage generally enhances aggregate stability and leads to greater soil organic matter and SOC in the upper soil layer [16,23]. Johnson et al. [67] reported that C input in aboveground biomass and root systems varied among crop species (e.g., corn, soybean, wheat) and cropping practices (tillage vs. no-tillage).
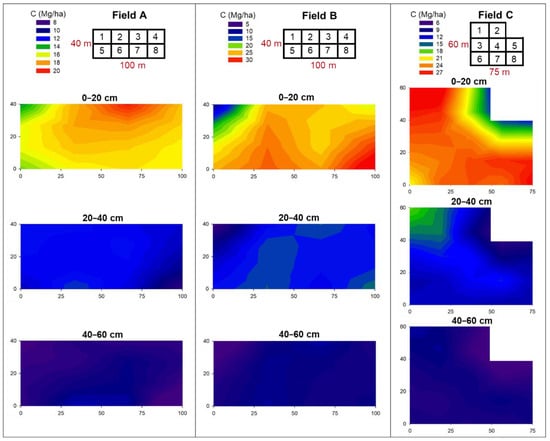
Figure 6.
Spatial distribution of soil organic carbon (Mg/ha) stocks (fixed depth interval) in three fields at three depths (n = 8 grids for each depth and field).
The higher variability in SOC stocks in some of the grids in the surface layer (0–20 cm) implies that the identification of the “benchmark site” approach, as suggested by Ellert et al. [27] and Conant et al. [28], is needed to accurately determine changes in SOC stocks after implementation of cropping and management practices. When considering SOC at 0–60 cm, the CV within eight grids was 7% for field A, 14% for field B, and 12% for field C. The spatial variability within each field can be reduced when eliminating two grids in the fields (e.g., A: grid 1 and 5; B: grid 1 and 6; C: grid 2 and 5; Figure 6), which resulted in a slight reduction (1–3% of CV) to 6–11% across three fields. Based on this, we suggest that a part of the area (about 0.4 ha or 4000 m2) in each field, as done in this study, can be identified and divided into eight grids (0.05 ha or 500 m2) for collecting soil samples to determine SOC stocks in the surface layer. Since SOC stocks were similar in the lower soil layers, as also reported in other studies, we suggest collecting soil samples from only select grids (e.g., three of eight grids) to determine SOC stocks at lower depths. This will minimize the resources and effort needed for deep soil sample collection. Since SOC changes slowly, long-term measurements and re-sampling of previously sampled locations over a period of time can provide valuable information for understanding the changes in SOC stocks [68].
4. Conclusions
We determined the variability and current SOC stocks in three typical Maryland agricultural fields. The C/N ratio and δ13C were used to understand the SOC characteristics in these soils. The pH and SOC stocks in three fields significantly decreased from the surface soil layer (0–20 cm) to sub-surface layers (20–40 and 40–60 cm). Mean SOC stocks at 0–60 cm ranged from 37 to 47 Mg/ha. In addition, the higher SOC stocks and spatial variability observed in the surface layer in the three fields were likely due to the variable C inputs of plant materials (e.g., from corn, wheat, soybean, cover crops) and crop residues. SOC stocks at 0–60 cm depth in the three adjacent fields were not significantly different, suggesting that long-term studies are needed to determine changes in SOC after the alteration of management practices. The values of δ13C were lower in a field that used cover crops, implying that isotopic 13C signatures could provide useful information for understanding SOC biogeochemistry in agricultural soils. We suggest that future research should measure and track SOC stocks in fields using a geo-referenced grid-sampling approach in a small area (4000 m2). After the agricultural practices to optimize SOC stocks are implemented, the same grids should be re-sampled in a time frame of three to five years to detect changes in SOC. This would allow researchers and practitioners to accurately determine if the implementation of those practices resulted in any measurable changes in SOC and other metrics for soil health.
Supplementary Materials
The following are available online at https://www.mdpi.com/2073-4395/10/8/1139/s1. Figure S1. Digital elevation map prepared using ArcGIS for the (A) study location showing all fields and (B) separate elevation map for three individual fields. Figure S2. Correlation between soil organic carbon stocks (kg/m2) and C/N ratio in three fields. Figure S3. Spatial distribution of soil organic carbon stocks (kg/m2) in three fields at three depths (n = 8 grids for each depth and field).
Author Contributions
Conceptualization, Y.-Y.Y. and G.S.T.; Data curation, Y.-Y.Y.; Formal analysis, Y.-Y.Y.; Funding acquisition, G.S.T.; Investigation, A.G., I.H. and S.L.; Methodology, Y.-Y.Y. and G.S.T.; Project administration, G.S.T.; Resources, G.S.T.; Software, Y.-Y.Y.; Supervision, Y.-Y.Y. and G.S.T.; Validation, Y.-Y.Y.; Visualization, Y.-Y.Y.; Writing—original draft, Y.-Y.Y.; Writing—review and editing, Y.-Y.Y. and G.S.T. All authors have read and agreed to the published version of the manuscript.
Funding
Gurpal S. Toor received partial funding from USDA NIFA, Hatch project 1014496. We would like to thank the Harry R. Hughes Center for Agroecology for funding our ongoing research on soil organic carbon and soil health.
Acknowledgments
We thank Maryland National Capital Parks and Planning Commission for allowing us access to the fields for the collection of soil samples. We thank Haley Taroli and Remington Sand for their assistance in collecting and preparing soil samples for analysis. We also thank Srabani Das and Stan Schlosnagle for analysis of soil samples. This manuscript was conceived during earlier discussions about soil health with Suzanne Dorsey, formerly of the Harry R. Hughes Center of Agroecology, and now with the Maryland Department of Environment.
Conflicts of Interest
The authors declare no conflict of interest. The funders had no role in the design of the study; in the collection, analyses, or interpretation of data; in the writing of the manuscript, or in the decision to publish the results.
References
- Vicente-Vicente, J.L.; García-Ruiz, R.; Francaviglia, R.; Aguilera, E.; Smith, P. Soil carbon sequestration rates under Mediterranean woody crops using recommended management practices: A meta-analysis. Agric. Ecosyst. Environ. 2016, 235, 204–214. [Google Scholar] [CrossRef]
- Batjes, N. Total carbon and nitrogen in the soils of the world. Eur. J. Soil Sci. 2014, 65, 10–21. [Google Scholar] [CrossRef]
- Scharlemann, J.P.W.; Tanner, E.V.; Hiederer, R.; Kapos, V. Global soil carbon: Understanding and managing the largest terrestrial carbon pool. Carbon Manag. 2014, 5, 81–91. [Google Scholar] [CrossRef]
- United States Environmental Protection Agency. Inventory of U.S. Greenhouse Gas Emissions and Sinks: 1990–2018; United States Environmental Protection Agency: Washington, DC, USA, 2020.
- Zomer, R.J.; Bossio, D.A.; Sommer, R.; Verchot, L.V. Global Sequestration Potential of Increased Organic Carbon in Cropland Soils. Sci. Rep. 2017, 7, 15554. [Google Scholar] [CrossRef] [PubMed]
- Hoyle, F.C.; O’Leary, R.A.; Murphy, D.V. Spatially governed climate factors dominate management in determining the quantity and distribution of soil organic carbon in dryland agricultural systems. Sci. Rep. 2016, 6, 31468. [Google Scholar] [CrossRef]
- Lawrence, C.R.; Harden, J.; Xu, X.; Schulz, M.S.; Trumbore, S. Long-term controls on soil organic carbon with depth and time: A case study from the Cowlitz River Chronosequence, WA USA. Geoderma 2015, 247, 73–87. [Google Scholar] [CrossRef]
- VandenBygaart, B.; Gregorich, E.; Angers, D.A. Influence of agricultural management on soil organic carbon: A compendium and assessment of Canadian studies. Can. J. Soil Sci. 2003, 83, 363–380. [Google Scholar] [CrossRef]
- Guo, L.B.; Gifford, R.M. Soil carbon stocks and land use change: A meta analysis. Glob. Chang. Boil. 2002, 8, 345–360. [Google Scholar] [CrossRef]
- Sanderman, J.; Hengl, T.; Fiske, G.J. Soil carbon debt of 12,000 years of human land use. Proc. Natl. Acad. Sci. USA 2017, 114, 9575–9580. [Google Scholar] [CrossRef]
- Jian, J.; Du, X.; Reiter, M.S.; Stewart, R.D. A meta-analysis of global cropland soil carbon changes due to cover cropping. Soil Boil. Biochem. 2020, 143, 107735. [Google Scholar] [CrossRef]
- Kaye, J.P.; Quemada, H.D. Using cover crops to mitigate and adapt to climate change. A review. Agron. Sustain. Dev. 2017, 37, 4. [Google Scholar] [CrossRef]
- Poeplau, C.; Don, A. Carbon sequestration in agricultural soils via cultivation of cover crops—A meta-analysis. Agric. Ecosyst. Environ. 2015, 200, 33–41. [Google Scholar] [CrossRef]
- Aguilera, E.; Lassaletta, L.; Gattinger, A.; Gimeno, B.S. Managing soil carbon for climate change mitigation and adaptation in Mediterranean cropping systems: A meta-analysis. Agric. Ecosyst. Environ. 2013, 168, 25–36. [Google Scholar] [CrossRef]
- Jha, P.; Hati, K.; Dalal, R.C.; Dang, Y.P.; Kopittke, P.M.; Menzies, N.W. Soil carbon and nitrogen dynamics in a Vertisol following 50 years of no-tillage, crop stubble retention and nitrogen fertilization. Geoderma 2020, 358, 113996. [Google Scholar] [CrossRef]
- Bai, Z.; Caspari, T.; Gonzalez, M.R.; Batjes, N.; Mäder, P.; Bünemann, E.K.; De Goede, R.G.; Brussaard, L.; Xu, M.; Ferreira, C.; et al. Effects of agricultural management practices on soil quality: A review of long-term experiments for Europe and China. Agric. Ecosyst. Environ. 2018, 265, 1–7. [Google Scholar] [CrossRef]
- Aziz, I.; Mahmood, T.; Islam, K.R. Effect of long term no-till and conventional tillage practices on soil quality. Soil Tillage Res. 2013, 131, 28–35. [Google Scholar] [CrossRef]
- Luo, Z.; Wang, E.; Sun, O.J. Can no-tillage stimulate carbon sequestration in agricultural soils? A meta-analysis of paired experiments. Agric. Ecosyst. Environ. 2010, 139, 224–231. [Google Scholar] [CrossRef]
- Angers, D.A.; Eriksen-Hamel, N.S. Full-Inversion Tillage and Organic Carbon Distribution in Soil Profiles: A Meta-Analysis. Soil Sci. Soc. Am. J. 2008, 72, 1370–1374. [Google Scholar] [CrossRef]
- Mondal, S.; Chakraborty, D.; Bandyopadhyay, K.; Aggarwal, P.; Rana, D.S. A global analysis of the impact of zero-tillage on soil physical condition, organic carbon content, and plant root response. Land Degrad. Dev. 2020, 31, 557–567. [Google Scholar] [CrossRef]
- Tian, K.; Zhao, Y.; Xu, X.; Hai, N.; Huang, B.; Deng, W. Effects of long-term fertilization and residue management on soil organic carbon changes in paddy soils of China: A meta-analysis. Agric. Ecosyst. Environ. 2015, 204, 40–50. [Google Scholar] [CrossRef]
- Adl, S.M.; Coleman, D.C.; Read, F. Slow recovery of soil biodiversity in sandy loam soils of Georgia after 25 years of no-tillage management. Agric. Ecosyst. Environ. 2006, 114, 323–334. [Google Scholar] [CrossRef]
- Stockmann, U.; Adams, M.A.; Crawford, J.W.; Field, D.; Henakaarchchi, N.; Jenkins, M.; Minasny, B.; McBratney, A.B.; Courcelles, V.D.R.D.; Singh, K.; et al. The knowns, known unknowns and unknowns of sequestration of soil organic carbon. Agric. Ecosyst. Environ. 2013, 164, 80–99. [Google Scholar] [CrossRef]
- Wang, J.; Wang, X.; Xu, M.; Feng, G.; Zhang, W.; Yang, X.; Huang, S. Contributions of wheat and maize residues to soil organic carbon under long-term rotation in north China. Sci. Rep. 2015, 5, 11409. [Google Scholar] [CrossRef] [PubMed]
- Shi, H.; Wang, X.; Xu, M.; Zhang, H.; Luo, Y. Characteristics of soil C:N ratio and δ13C in wheat-maize cropping system of the North China Plain and influences of the Yellow River. Sci. Rep. 2017, 7, 16854. [Google Scholar] [CrossRef] [PubMed]
- Stein, D. Department of Legislative Services, Maryland General Assembly 2017 Session. House Bill 1063. 2017. Available online: http://mgaleg.maryland.gov/2017RS/fnotes/bil_0003/hb1063.pdf (accessed on 1 May 2020).
- Ellert, B.H.; Janzen, H.H.; Entz, T. Assessment of a Method to Measure Temporal Change in Soil Carbon Storage. Soil Sci. Soc. Am. J. 2002, 66, 1687–1695. [Google Scholar] [CrossRef]
- Conant, R.T.; Smith, G.R.; Paustian, K. Spatial variability of soil carbon in forested and cultivated sites: Implications for change detection. J. Environ. Qual. 2003, 32, 278–286. [Google Scholar] [CrossRef]
- United States Department of Agriculture, Web Soil Survey. 2019. Available online: https://websoilsurvey.sc.egov.usda.gov/App/HomePage.htm (accessed on 1 May 2020).
- National Weather Service. 2020. Available online: https://www.weather.gov/ (accessed on 1 May 2020).
- Eckert, D.; Sims, J.T. Recommended Soil pH and Lime Requirement Tests. In Recommended Soil Testing Procedures for the Northeastern United States. Northeast Regional Bulletin #493, 3rd ed.; Sims, J.T., Wolf, A., Eds.; Agricultural Experiment Station, University of Delaware: Newark, DE, USA, 2011; pp. 19–25. [Google Scholar]
- Hantsoo, K.G.; Kaufman, A.J.; Cui, H.; Plummer, R.E.; Narbonne, G.M. Effects of bioturbation on carbon and sulfur cycling across the Ediacaran–Cambrian transition at the GSSP in Newfoundland, Canada. Can. J. Earth Sci. 2018, 55, 1240–1252. [Google Scholar] [CrossRef]
- Funes, I.; Savé, R.; Rovira, P.; Molowny-Horas, R.; Alcañiz, J.M.; Ascaso, E.; Herms, I.; Herrero, C.; Boixadera, J.; Vayreda, J. Agricultural soil organic carbon stocks in the north-eastern Iberian Peninsula: Drivers and spatial variability. Sci. Total. Environ. 2019, 668, 283–294. [Google Scholar] [CrossRef]
- Ellert, B.H.; Bettany, J.R. Calculation of organic matter and nutrients stored in soils under contrasting management regimes. Can. J. Soil Sci. 1995, 75, 529–538. [Google Scholar] [CrossRef]
- Daniels, W.; Haering, K. The Mid-Atlantic Nutrient Management Handbook; Chapter 3. Concepts of Basic Soil Science; Virginia Cooperative Extension Service: Blacksburg, VA, USA, 2015.
- Islam, K.R.; Weil, R.R. Soil quality indicator properties in mid-Atlantic soils as influenced by conservation management. J. Soil Water Conserv. 2000, 55, 69–78. [Google Scholar]
- De Queiroz, J.F.; Nicolella, G.; Wood, C.W.; Boyd, C.E. Lime application methods, water and bottom soil acidity in fresh water fish ponds. Sci. Agric. 2004, 61, 469–475. [Google Scholar] [CrossRef]
- Viscarra Rossel, R.A.; Lobsey, C.R.; Sharman, C.; Flick, P.; McLachlan, G. Novel proximal sensing for monitoring soil organic C stocks and condition. Environ. Sci. Technol. 2017, 51, 5630–5641. [Google Scholar] [CrossRef] [PubMed]
- Hall, D.; Lemon, J. Changes in soil pH as a result of lime addition as affected by rates, time and incorporation method. In Proceedings of the 19th World Congress of Soil Science, Soil Solutions for a Changing World, Brisbane, Australia, 1–6 August 2010. [Google Scholar]
- Kumar, S.; Lal, R.; Liu, D.; Rafiq, R. Estimating the spatial distribution of organic carbon density for the soils of Ohio, USA. J. Geogr. Sci. 2013, 23, 280–296. [Google Scholar] [CrossRef]
- Wiesmeier, M.; Hübner, R.; Barthold, F.; Spörlein, P.; Geuß, U.; Hangen, E.; Reischl, A.; Schilling, B.; Von Lützow, M.; Kögel-Knabner, I. Amount, distribution and driving factors of soil organic carbon and nitrogen in cropland and grassland soils of southeast Germany (Bavaria). Agric. Ecosyst. Environ. 2013, 176, 39–52. [Google Scholar] [CrossRef]
- Mclauchlan, K.K. Effects of soil texture on soil carbon and nitrogen dynamics after cessation of agriculture. Geoderma 2006, 136, 289–299. [Google Scholar] [CrossRef]
- Li, Q.; Li, A.; Dai, T.; Fan, Z.; Luo, Y.; Li, S.; Yuan, D.; Zhao, B.; Tao, Q.; Wang, C.; et al. Depth-dependent soil organic carbon dynamics of croplands across the Chengdu Plain of China from the 1980s to the 2010s. Glob. Chang. Boil. 2020, 26, 4134–4146. [Google Scholar] [CrossRef]
- Tsozué, D.; Nghonda, J.P.; Tematio, P.; Basga, S.D. Changes in soil properties and soil organic carbon stocks along an elevation gradient at Mount Bambouto, Central Africa. Catena 2019, 175, 251–262. [Google Scholar] [CrossRef]
- Chen, C.P.; Juang, K.W.; Cheng, C.H.; Pai, C.W. Effects of adjacent land-use types on the distribution of soil organic carbon stocks in the montane area of central Taiwan. Bot. Stud. 2016, 57, 32. [Google Scholar] [CrossRef]
- Parras-Alcántara, L.; García, B.L.; Galán-Espejo, A. Soil organic carbon along an altitudinal gradient in the Despeñaperros Natural Park, southern Spain. Solid Earth 2015, 6, 125–134. [Google Scholar] [CrossRef]
- Bambrick, A.D.; Whalen, J.K.; Bradley, R.L.; Cogliastro, A.; Gordon, A.M.; Olivier, A.; Thevathasan, N.V. Spatial heterogeneity of soil organic carbon in tree-based intercropping systems in Quebec and Ontario, Canada. Agrofor. Syst. 2010, 79, 343–353. [Google Scholar] [CrossRef]
- Wendt, J.W.; Hauser, S. An equivalent soil mass procedure for monitoring soil organic carbon in multiple soil layers. Eur. J. Soil Sci. 2013, 64, 58–65. [Google Scholar] [CrossRef]
- Hassink, J. Effects of soil texture and grassland management on soil organic C and N and rates of C and N mineralization. Soil Boil. Biochem. 1994, 26, 1221–1231. [Google Scholar] [CrossRef]
- Lützow, M.V.; Kögel-Knabner, I.; Ekschmitt, K.; Matzner, E.; Guggenberger, G.; Marschner, P.; Flessa, H. Stabilization of organic matter in temperate soils: Mechanisms and their relevance under different soil conditions—A review. Eur. J. Soil Sci. 2006, 57, 426–445. [Google Scholar] [CrossRef]
- Haruna, S.I.; Anderson, S.H.; Nkongolo, N.V.; Zaibon, S. Soil Hydraulic Properties: Influence of Tillage and Cover Crops. Pedosphere 2018, 28, 430–442. [Google Scholar] [CrossRef]
- Sainju, U.M.; Whitehead, W.F.; Singh, B.P. Biculture Legume-Cereal Cover Crops for Enhanced Biomass Yield and Carbon and Nitrogen. Agron. J. 2005, 97, 1403–1412. [Google Scholar] [CrossRef]
- Haruna, S.I.; Nkongolo, N.V. Tillage, Cover Crop and Crop Rotation Effects on Selected Soil Chemical Properties. Sustainability 2019, 11, 2770. [Google Scholar] [CrossRef]
- Rumpel, C.; Kögel-Knabner, I. Deep soil organic matter—A key but poorly understood component of terrestrial C cycle. Plant Soil 2010, 338, 143–158. [Google Scholar] [CrossRef]
- Deng, L.; Wang, K.; Tang, Z.; Shangguan, Z. Soil organic carbon dynamics following natural vegetation restoration: Evidence from stable carbon isotopes (δ13C). Agric. Ecosyst. Environ. 2016, 221, 235–244. [Google Scholar] [CrossRef]
- Schiedung, H.; Tilly, N.; Hütt, C.; Welp, G.; Brüggemann, N.; Amelung, W. Spatial controls of topsoil and subsoil organic carbon turnover under C3–C4 vegetation change. Geoderma 2017, 303, 44–51. [Google Scholar] [CrossRef]
- Schaefer, M.V.; Bogie, N.A.; Rath, D.; Marklein, A.R.; Garniwan, A.; Haensel, T.; Lin, Y.; Avila, C.C.E.; Nico, P.S.; Scow, K.M.; et al. Effect of cover crop on carbon distribution in size and density separated soil aggregates. Soil Syst. 2020, 4, 6. [Google Scholar] [CrossRef]
- Wang, Y.; Fang, N.; Tong, L.; Shi, Z. Source identification and budget evaluation of eroded organic carbon in an intensive agricultural catchment. Agric. Ecosyst. Environ. 2017, 247, 290–297. [Google Scholar] [CrossRef]
- Cavigelli, M.A.; Nash, P.R.; Gollany, H.T.; Rasmann, C.; Polumsky, R.W.; Le, A.N.; Conklin, A.E. Simulated soil organic carbon changes in maryland are affected by tillage, climate change, and crop yield. J. Environ. Qual. 2018, 47, 588–595. [Google Scholar] [CrossRef] [PubMed]
- Hobley, E.U.; Wilson, B. The depth distribution of organic carbon in the soils of eastern Australia. Ecosphere 2016, 7, e01214. [Google Scholar] [CrossRef]
- Adhikari, K.; Hartemink, A.E.; Minasny, B.; Kheir, R.B.; Greve, M.B.; Greve, M.H. Digital mapping of soil organic carbon contents and stocks in denmark. PLoS ONE 2014, 9, e105519. [Google Scholar] [CrossRef]
- Chakan, A.A.; Taghizadeh-Mehrjardi, R.; Kerry, R.; Kumar, S.; Khordehbin, S.; Khanghah, S.Y. Spatial 3D distribution of soil organic carbon under different land use types. Environ. Monit. Assess. 2017, 189, 131. [Google Scholar] [CrossRef] [PubMed]
- Lacoste, M.; Minasny, B.; McBratney, A.; Michot, D.; Viaud, V.; Walter, C. High resolution 3D mapping of soil organic carbon in a heterogeneous agricultural landscape. Geoderma 2014, 213, 296–311. [Google Scholar] [CrossRef]
- Rabbi, S.M.F.; Tighe, M.; Delgado-Baquerizo, M.; Cowie, A.; Robertson, F.; Dalal, R.; Page, K.; Crawford, D.; Wilson, B.R.; Schwenke, G.; et al. Climate and soil properties limit the positive effects of land use reversion on carbon storage in Eastern Australia. Sci. Rep. 2015, 5, 17866. [Google Scholar] [CrossRef]
- Schillaci, C.; Acutis, M.; Lombardo, L.; Lipani, A.; Fantappiè, M.; Märker, M.; Saia, S. Spatio-temporal topsoil organic carbon mapping of a semi-arid Mediterranean region: The role of land use, soil texture, topographic indices and the influence of remote sensing data to modelling. Sci. Total. Environ. 2017, 601, 821–832. [Google Scholar] [CrossRef]
- Piccoli, I.; Chiarini, F.; Carletti, P.; Furlan, L.; Lazzaro, B.; Nardi, S.; Berti, A.; Sartori, L.; Dalconi, M.C.; Morari, F. Disentangling the effects of conservation agriculture practices on the vertical distribution of soil organic carbon. Evidence of poor carbon sequestration in North- Eastern Italy. Agric. Ecosyst. Environ. 2016, 230, 68–78. [Google Scholar] [CrossRef]
- Johnson, J.M.F.; Allmaras, R.R.; Reicosky, D.C. estimating source carbon from crop residues, roots and rhizodeposits using the national grain-yield database. Agron. J. 2006, 98, 622–636. [Google Scholar] [CrossRef]
- Smith, P.; Soussana, J.; Angers, D.; Schipper, L.A.; Chenu, C.; Rasse, D.; Batjes, N.; Van Egmond, F.; McNeill, S.; Kuhnert, M.; et al. How to measure, report and verify soil carbon change to realize the potential of soil carbon sequestration for atmospheric greenhouse gas removal. Glob. Chang. Boil. 2019, 26, 219–241. [Google Scholar] [CrossRef] [PubMed]


© 2020 by the authors. Licensee MDPI, Basel, Switzerland. This article is an open access article distributed under the terms and conditions of the Creative Commons Attribution (CC BY) license (http://creativecommons.org/licenses/by/4.0/).