Article

Development of a Building Energy Simulation Model for Control of Multi-Span Greenhouse Microclimate

1
Department of Agricultural Engineering, Kyungpook National University, Daegu 41566, Korea
2
Smart Farm System Department, Culti Labs Co. Ltd., Gangneung 25440, Korea
3
Institute of Agricultural Science & Technology, Kyungpook National University, Daegu 41566, Korea
4
Department of Horticulture Environment System, Korea National College of Agriculture and Fisheries, Jeonju-si, Jeollabuk-do 54874, Korea
5
Department of Bio-Industrial Machinery Engineering, Gyeongsang National University, Jinju 52828, Korea
6
Smart Agriculture Innovation Center, Kyungpook National University, Daegu 41566, Korea
*
Author to whom correspondence should be addressed.
Agronomy 2020, 10(9), 1236; https://doi.org/10.3390/agronomy10091236
Submission received: 20 July 2020 / Revised: 18 August 2020 / Accepted: 19 August 2020 / Published: 21 August 2020
(This article belongs to the Special Issue Greenhouse Technology)

Abstract

:
In this study, we propose a building energy simulation model of a multi-span greenhouse using a transient system simulation program to simulate greenhouse microenvironments. The proposed model allows daily and seasonal control of screens, roof vents, and heating setpoints according to crop needs. The proposed model was used to investigate the effect of different thermal screens, natural ventilation, and heating setpoint controls on annual and maximum heating loads of a greenhouse. The experiments and winter season weather conditions of greenhouses in Taean Gun (latitude 36.88° N, longitude 126.24° E, elevation 45 m) Chungcheongnam-do, South Korea was used for validation of our model. Nash–Sutcliffe efficiency coefficients of 0.87 and 0.71 showed good correlation between the computed and experimental results; thus, the proposed model is appropriate for performing greenhouse thermal simulations. The results showed that the heating loads of the triple-layered screen were 70% and 40% lower than that of the single-screen and double-screen greenhouses, respectively. Moreover, the maximum heating loads without a screen and for single-, double-, and the triple-layered screens were 0.65, 0.46, 0.41, and 0.34 MJ m−2, respectively. The analysis of different screens showed that Ph-77 (shading screen) combined with Ph-super (thermal screen) had the least heating requirements. The heating setpoint analysis predicted that using the designed day- and nighttime heating control setpoints can result in 3%, 15%, 14%, 15%, and 40% less heating load than when using the fixed value temperature control for November, December, January, February, and March, respectively.

1. Introduction

In the greenhouse sector, energy saving is one of the most significant challenges since heating costs have increased to more than 40% of total production costs [1]. In the agriculture sector, various technologies are being used to fulfill energy requirements. Besides applying different heating systems, energy-saving measures must be considered [2]. Reduction in energy consumption in greenhouse farming is the most significant challenge faced by both researchers and growers. Among passive heating modes, the use of thermal insulation in buildings helps achieve high-energy performance [3]. Night thermal screens are widely used inside greenhouses to save energy by reducing heat loss to the ambient environment during winter. Unfortunately, researchers have little information about the performance of thermal screens [4]. During nighttime in winter seasons, thermal screens are controlled transiently. During nighttime, screens are deployed to reduce heat loss and retracted during the day to allow more solar radiation to enter the greenhouse. Therefore, this passive heating method provides an effective and low-cost approach to decrease heating energy demand. Generally, ventilation is controlled in a greenhouse by an inside greenhouse temperature setpoint. When the greenhouse inside temperature goes above the optimal level, the vents open automatically. Furthermore, the heating setpoint of a greenhouse also controls the day and night setpoint values. To the best of our knowledge and from the literature review, no study has been conducted using any tool to simulate greenhouse microenvironments that considers all control parameters together and depends on the real-time greenhouse condition as operated in the field.
In the literature, many studies have attempted to evaluate the performance of thermal screens by using a variety of methods. Shakir et al. [5] estimated the heat loss of different moveable night thermal screens by calculating the inside temperature of a greenhouse. The study was conducted using a mathematical model using heat loss equations, and validation of the model was conducted with experimentally obtained greenhouse inside-air and soil temperatures. Other studies conducted by Park et al. Kim et al. and Kittas et al. [6,7,8] experimentally measured the greenhouse inside temperature with and without thermal screens and calculated the heat loss of the greenhouse to estimate energy savings. Geoola et al. [9] and Rasheed et al. [10] measured the overall heat transfer coefficients of the greenhouse screens using the laboratory hot box method. One report conducted by Hemming et al. [4] detailed the measuring method of greenhouse screens’ properties, which were further used in a KASPRO model to calculate the total energy savings of different screens. The results of this study were under specific controlled and predefined weather conditions. Other studies conducted by Gupta et al., Sethi et al., and Rasheed et al. [11,12,13,14] analyzed single-span greenhouse design parameters, including shape, orientation, and north-wall insulation from an energy conservation viewpoint. There are many studies conducted for multi-span greenhouses for natural ventilation analysis using CFD (Computational Fluid Dynamics); some of them are cited here for reference. Kwon et al., Lee at al., Short et al., Baeza et al., and Villagran et al. [15,16,17,18,19] conducted research on the natural ventilation efficiency of multi-span greenhouses. Other studies including Kim et al. and Bronkhorst et al. [20,21,22] were conducted on the calculation of the wind pressure coefficient of a multi-span greenhouse using CFD. Ahamed et al. [23] conducted a review on energy-saving techniques for reducing heating costs of greenhouses, detailing all studies focusing on greenhouse design including energy-efficient cover, thermal screen selection of heating systems, and orientation of single-span greenhouses. A study conducted by Lopez-Cuz et al. [24] conducted a review of dynamic mathematical models of greenhouse climate, revealing that studies were conducted mainly to increase knowledge and optimal control of the greenhouse. All studies primarily focused on greenhouse air temperature and energy load calculation using the fixed design and control parameters and ignored comparisons of the different design and control parameters, which could help to improve understanding of the specific parameters. Ahamed et al. [25,26,27,28] conducted many studies to analyze the greenhouse thermal environment and heat energy demand of greenhouses. They used MATLAB and TRNSYS for mathematical modeling of single-span greenhouse design parameters and the internal environment using fixed conditions. The study used only the U-value of greenhouse screens. The studies also lacked greenhouse screen control for real-time simulation of greenhouses. Lee at al. [29] conducted a study to estimate the annual and maximum heating and cooling loads of multi-span greenhouses. In that study, the greenhouse had only glass coverings and no use and control of thermal screens was considered. In one of our previous studies, [30] we provided a comprehensive review about other studies conducted for greenhouse energy management focusing on energy-supplying techniques, especially use of renewable energies to provide a low-cost heating solution.
The literature gives valuable information on thermal screens as well as greenhouse heating loads and microenvironments. However, these studies were experimental and the mathematical models were site-specific and limited to the use of one specific screen. Heating and cooling energy should be quantitatively estimated according to system characteristics. Building energy simulation (BES) is a promising method to investigate real-time energy demand considering that time-dependency changes during external weather conditions [31]. As many BES models have been developed and validated, BES tools allow researchers to efficiently analyze agricultural buildings and to evaluate different parameters while accounting for local weather conditions [14]. In one of our previous studies, [30] we provided a comprehensive review of the application of the transient system simulation (TRNSYS) program in agricultural greenhouses. It is a versatile component-based program, providing tools to simulate both simple and complex energy flows in buildings [14]. The University of Wisconsin’s Solar Energy Lab developed TRNSYS, and it has been commercially available since 1975 for the simulation of thermal systems. However, it has since undergone continuous development to become a hybrid simulator by including photovoltaic, thermal solar, and other energy systems [32]. It consists of two parts. The first part is an engine that is used to process the input files, and the second part is the library components. The standard library contains more than 150 models. This program is used in many applications, including energy building simulation, energy system research, technology assessment, solar thermal process, solar applications, geothermal heat pumps systems, ground-coupled heat transfer, airflow modeling, system calibration, wind and photovoltaic (PV) systems, hydrogen fuel cells, and power plants [33]. The dynamic simulations of the greenhouse involve complex heat transfer and airflow equations; these should be addressed considering all the thermal process involved. Regarding this issue, Choab et al. [34] detailed in a recent review article the existing thermal modeling programs for greenhouse and concluded that the most common and widespread used simulation tool for greenhouse thermal modeling is TRNSYS and Design Builder. Baglivo et al. [35] further reported that, compared to Design Builder, TRNSYS is more convenient and flexible to use. It can be easily connected to many other programs, such as ANSYS Fluent, MATLAB, and Excel for coupled simulations and pre- and postprocessing. Such versatility has made TRNSYS an effective program with which to conduct energy simulations.
Therefore, to address the abovementioned issue, this study proposes a BES (Building Energy Simulation) model that can simulate the greenhouse microenvironment by considering all control systems together and by estimating the annual and maximum heating loads. Moreover, the performance of different thermal screens available in the market by considering their thermal properties is evaluated. This tool allows researchers and growers to analyze multi-span greenhouse efficiency by transiently controlling natural vents, heating setpoints, and thermal screens while considering their local weather conditions.

2. Materials and Methods

2.1. Experimental Greenhouse

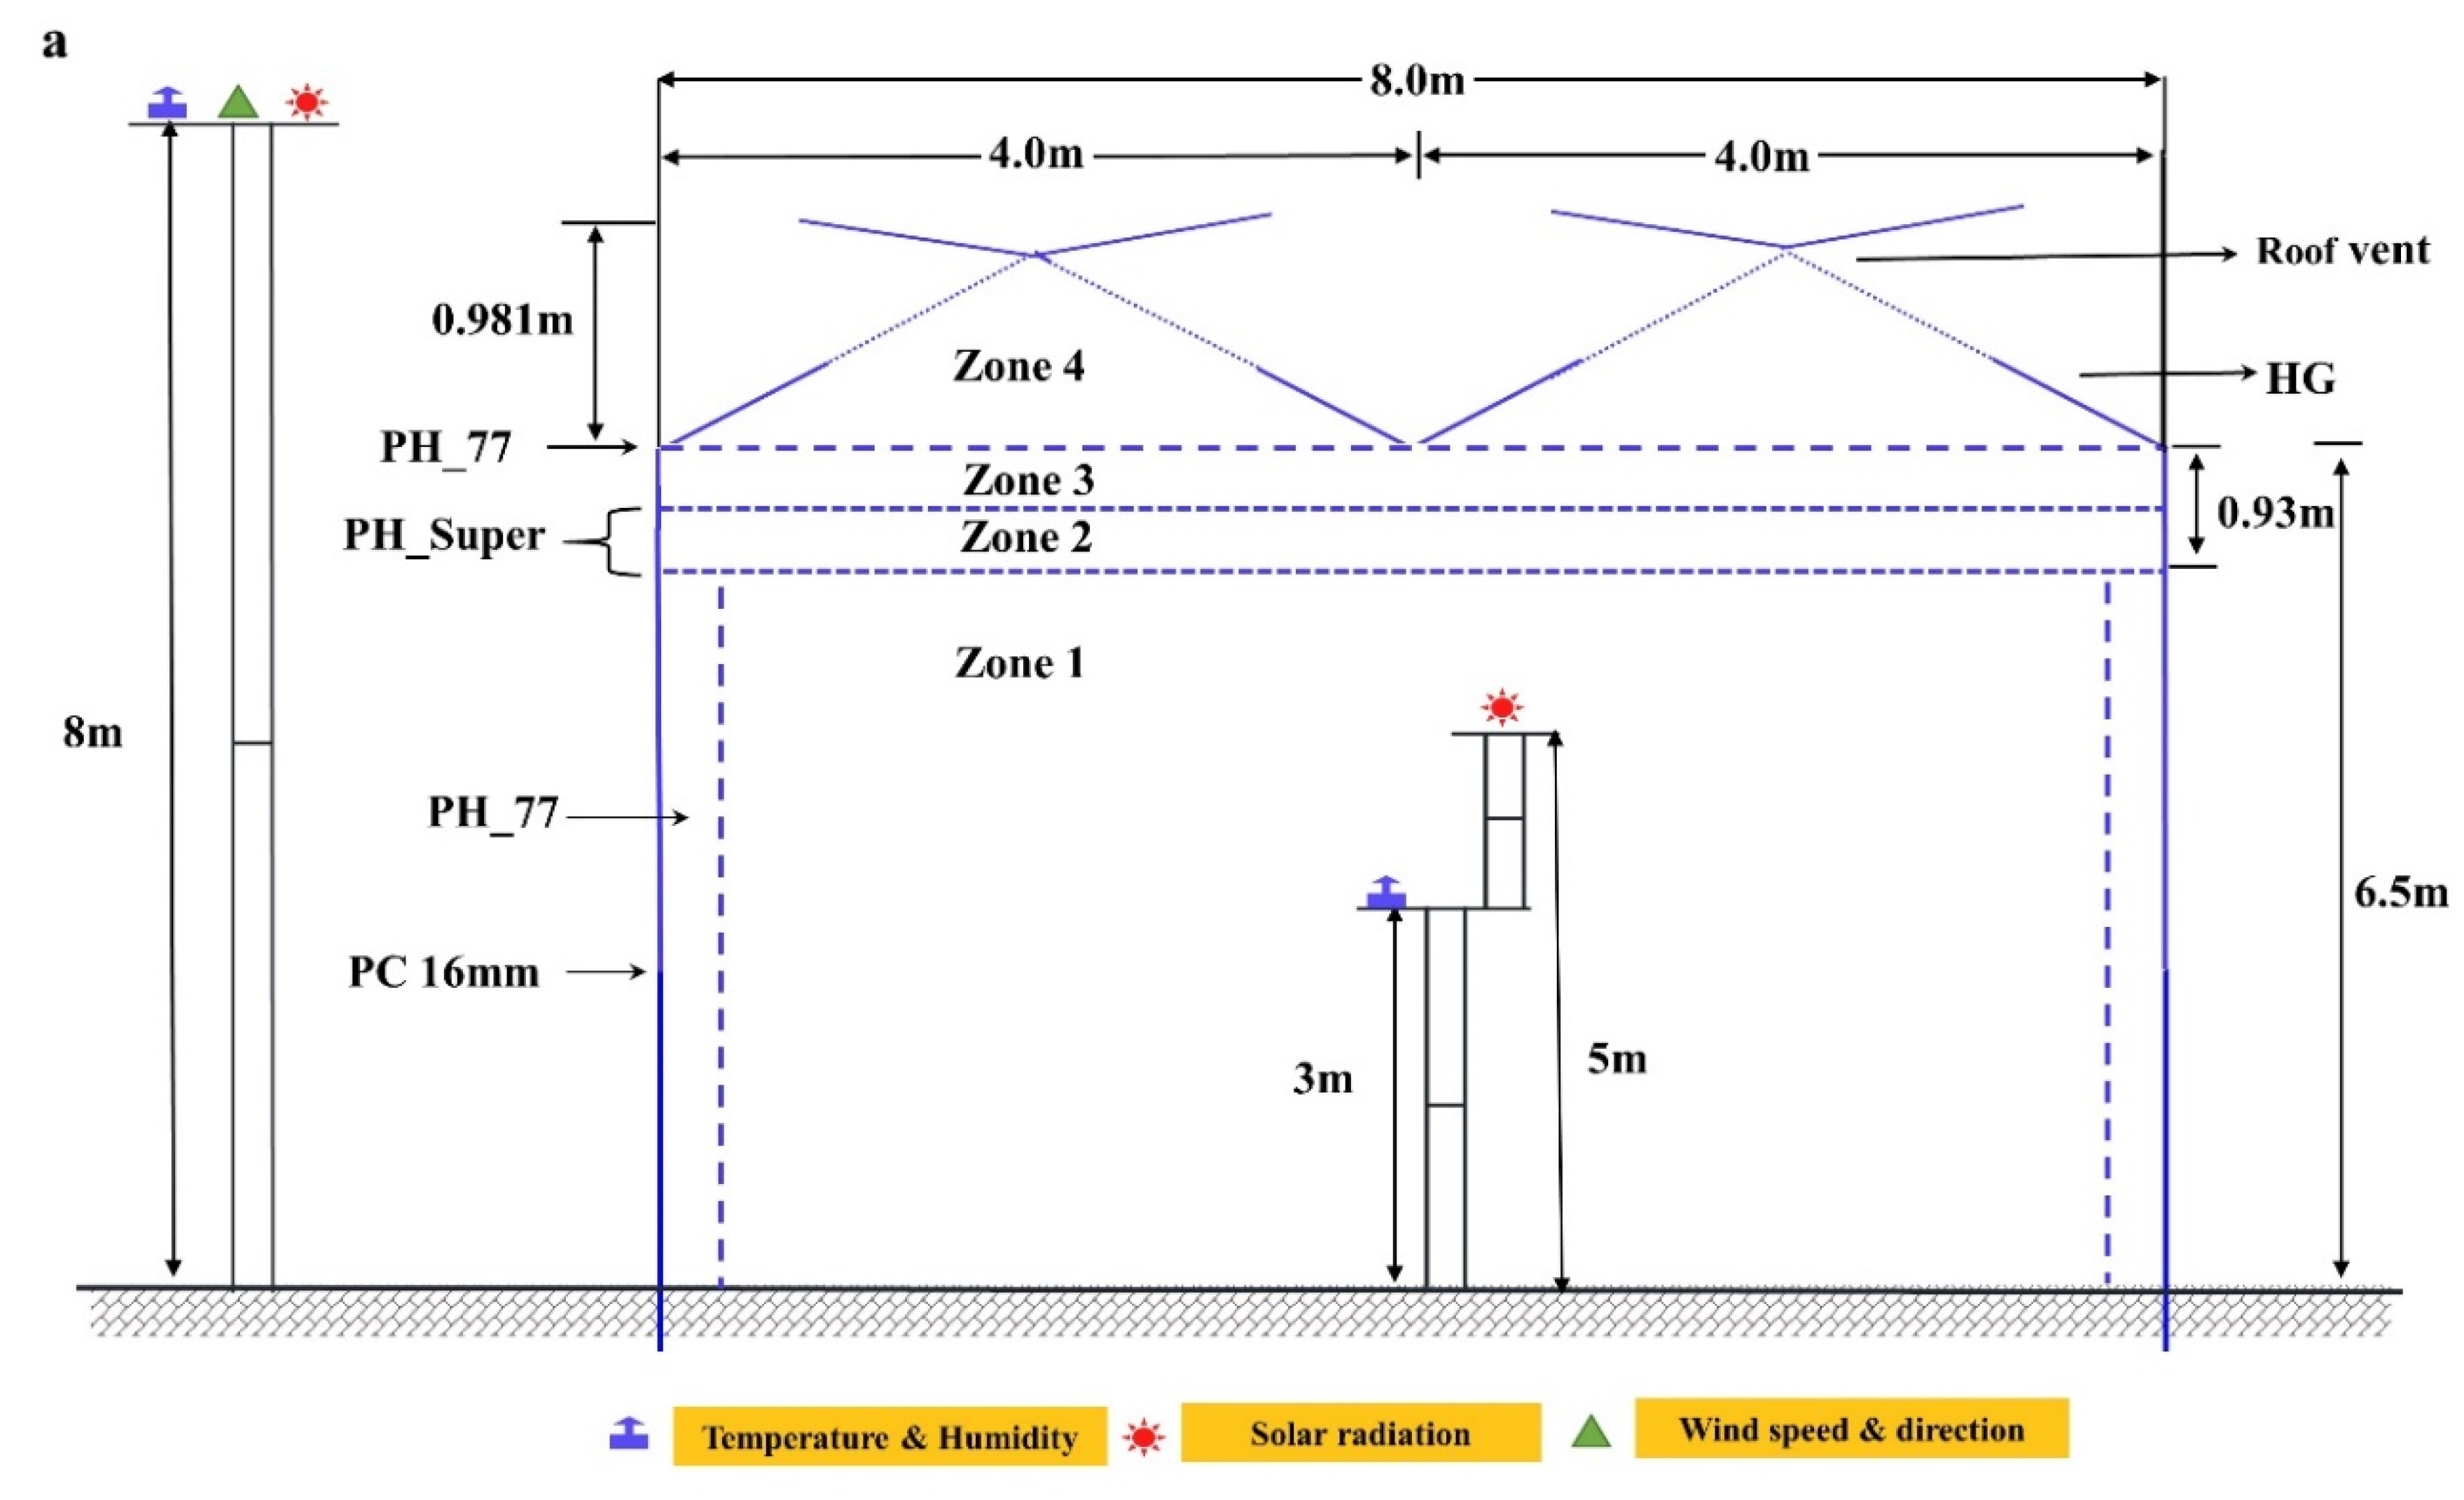
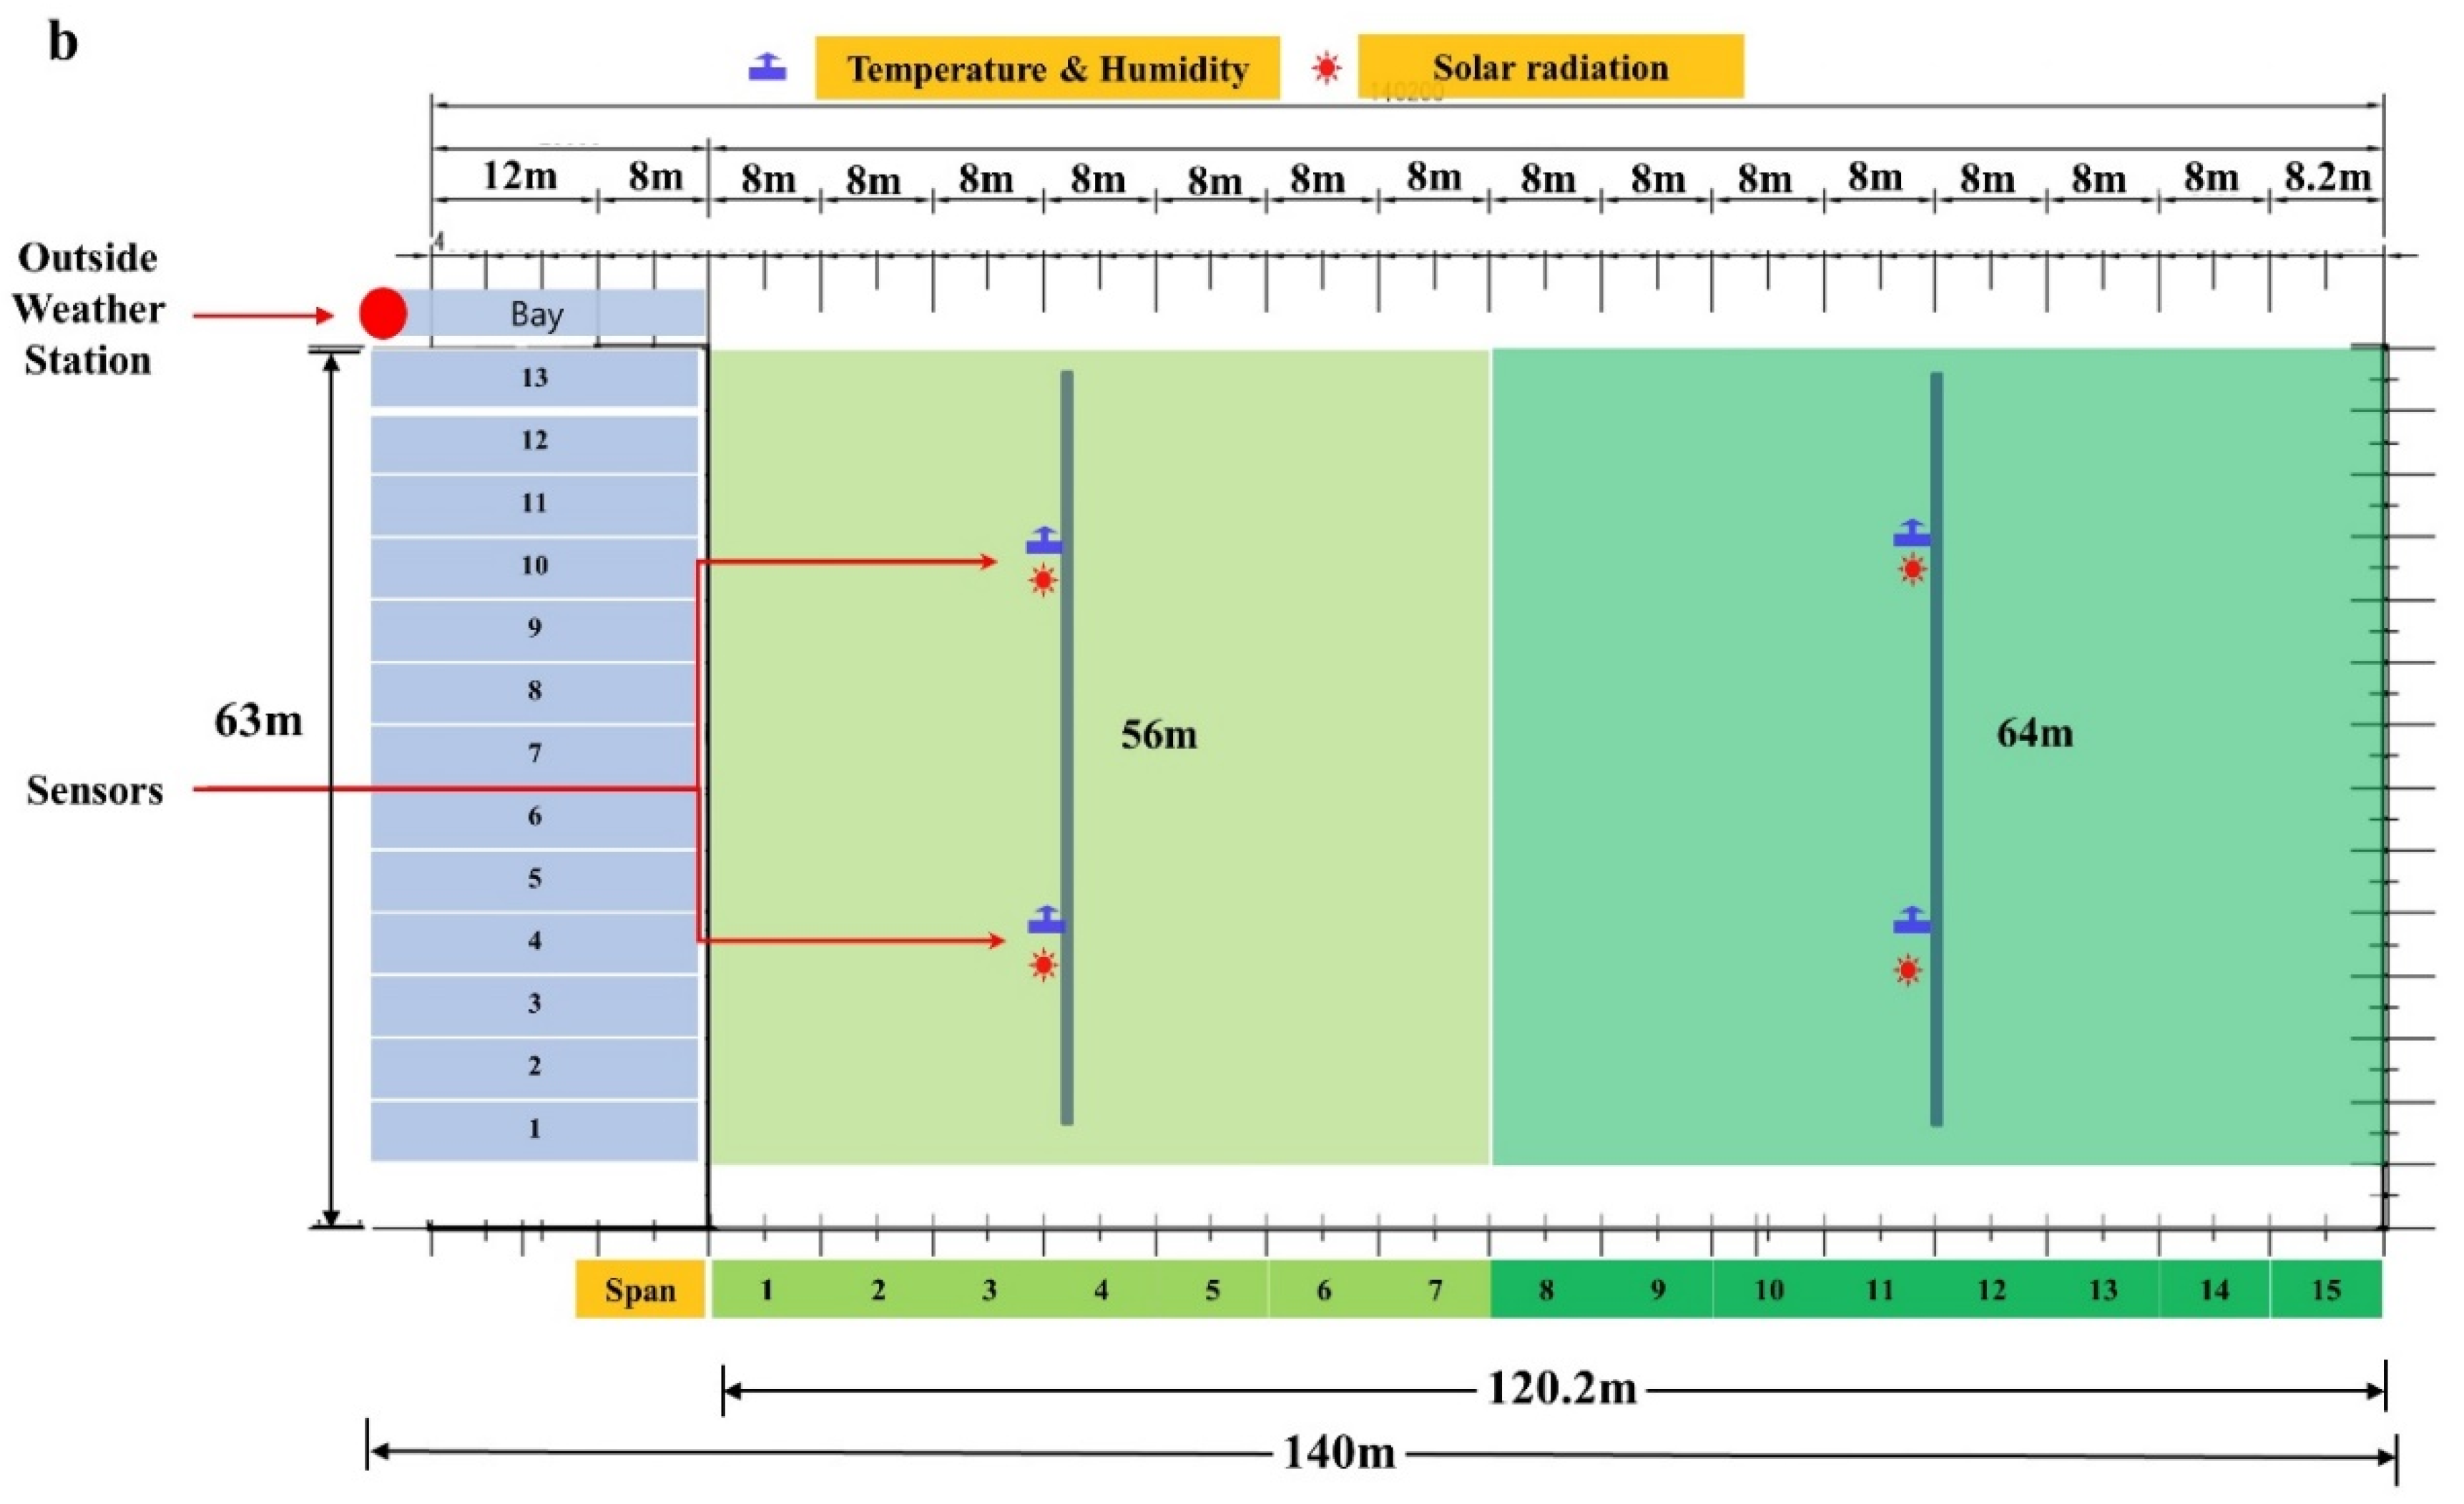
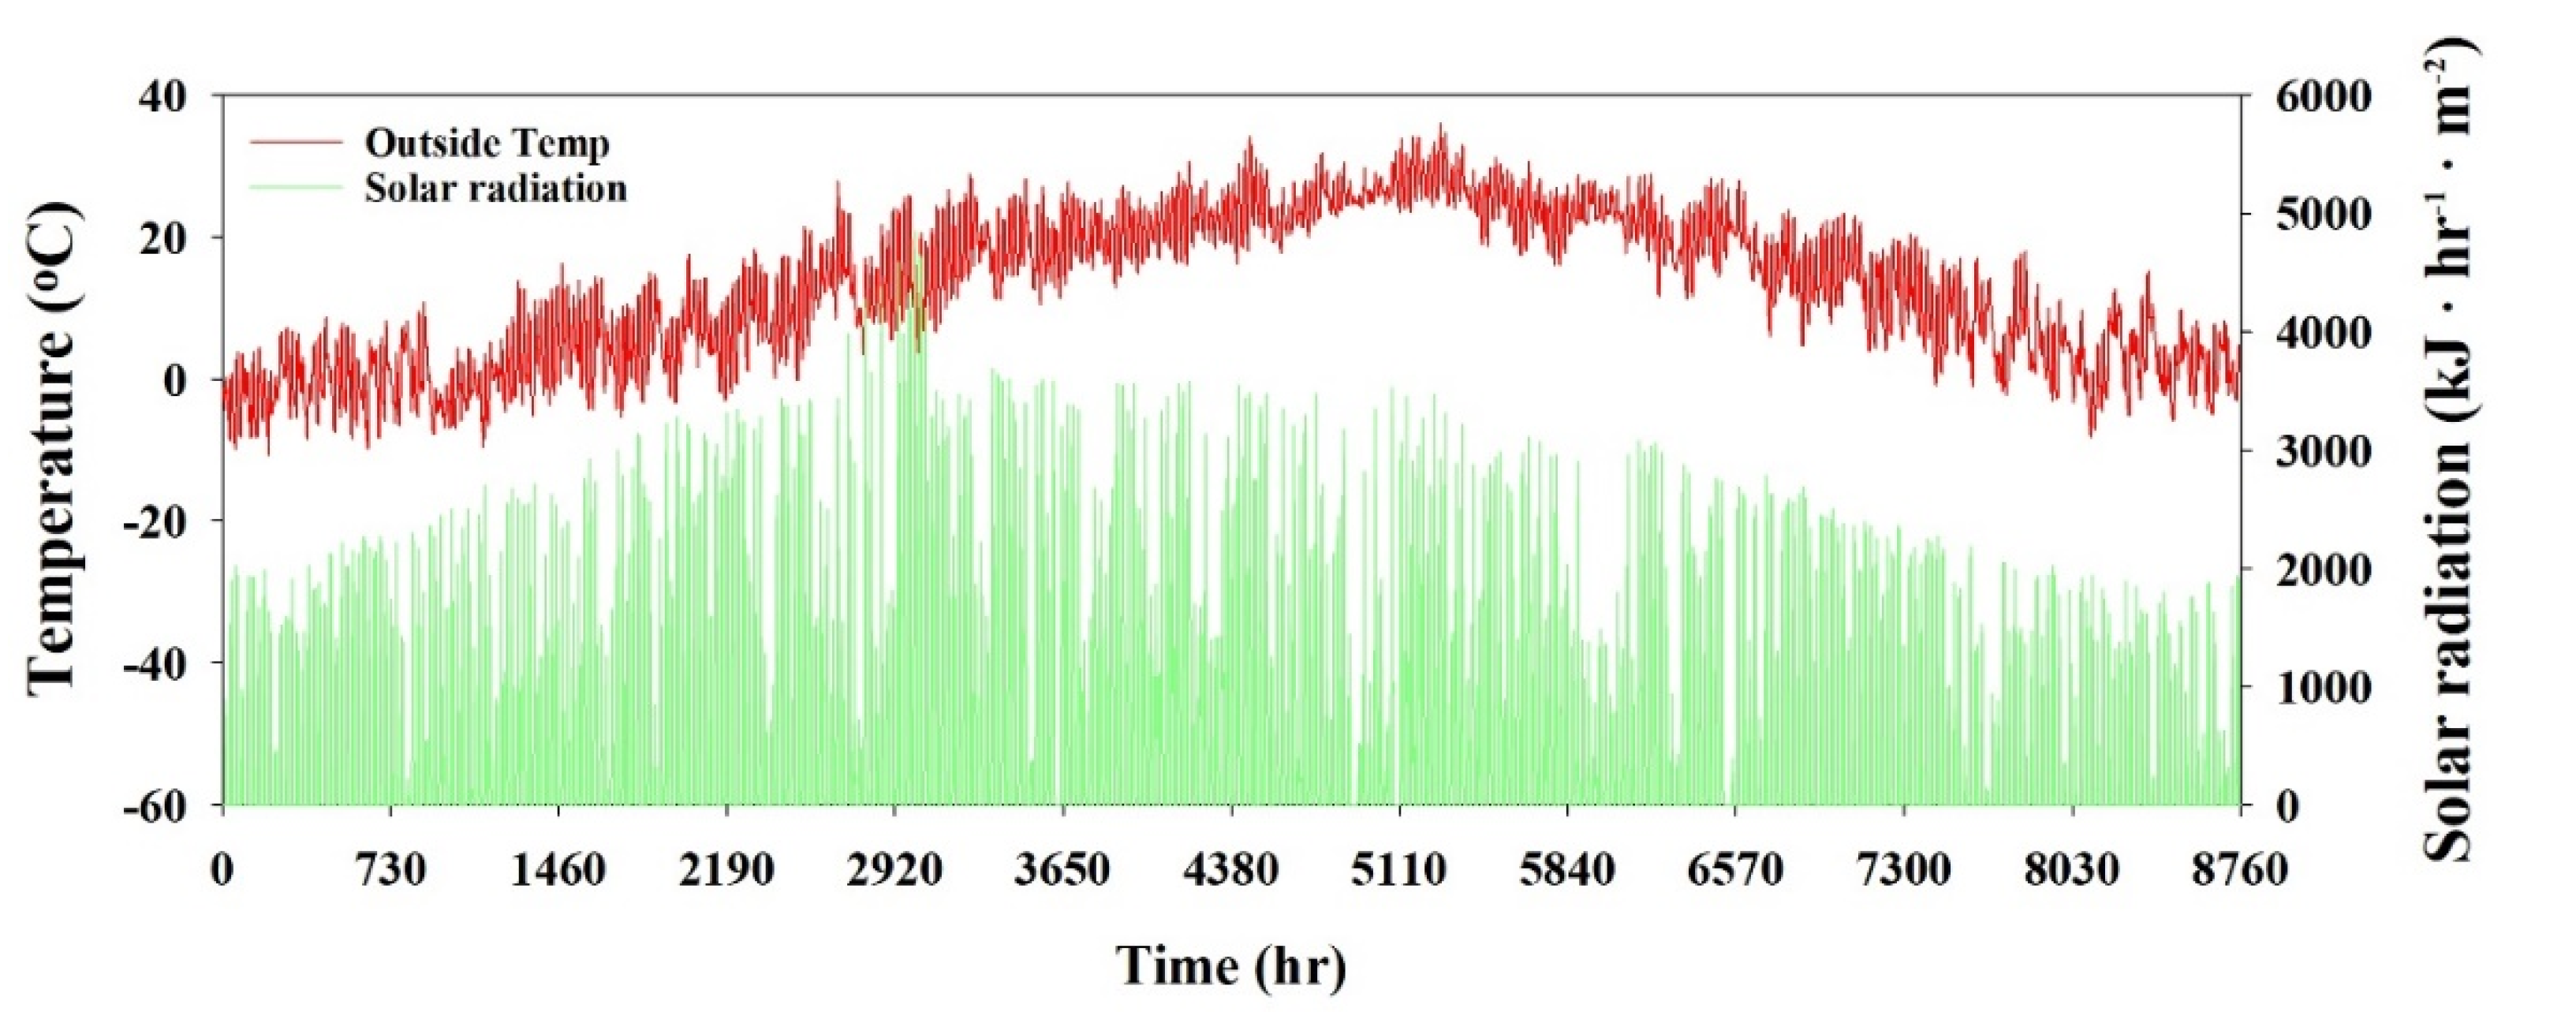
The experimental multi-span greenhouse was in Taean Gun (latitude 36.88° N, longitude 126.24° E, elevation 45 m) Chungcheongnam-do, South Korea. Figure 1 shows the geographic location of the experiment site. The experimental greenhouse had a rectangular-based, 15-span Venlo-type roof structure. Figure 2a,b shows exterior and interior views of the experimental greenhouse, respectively. The sides and roof of the greenhouse were covered with 16-mm polycarbonate (PC) and 4-mm horticulture glass (HG), respectively. Furthermore, it had three thermal screens under the roof and one thermal screen on the sides of the greenhouse. The dimensions of the greenhouse were 63 m × 120.2 m × 7.48 m with a total floor area of 7572.6 m2, and the width of each span was 8 m. Figure 3a,b shows, respectively, the vertical and horizontal views of the complete specifications. Weather data were recorded outside the experimental greenhouse between January and December 2019. The monitored variables were air temperature, solar radiation, relative outdoor humidity, air pressure, wind speed, and wind direction (Table 1). Figure 4 shows the hourly mean ambient temperature and solar radiation. Outside weather data were used as inputs in the BES model, and inside temperature data were recorded and used for comparison with the BES model results for validation. The ambient pressure data were not recorded in the field but obtained from the Korean Meteorological Administration (KMA). Wind speeds were recorded at a height of 10 m in the field, but considering the height of our greenhouse, the wind speed data were modified to the vent heights using the following power-law Equation (1) [36]:
W = W s ( h H ) α
where W is the wind speed in ms−1 at the required height h (in m), Ws is the wind speed at the given height H (in m·s−1), and α is an empirically derived coefficient (2/9).

2.2. Material Properties

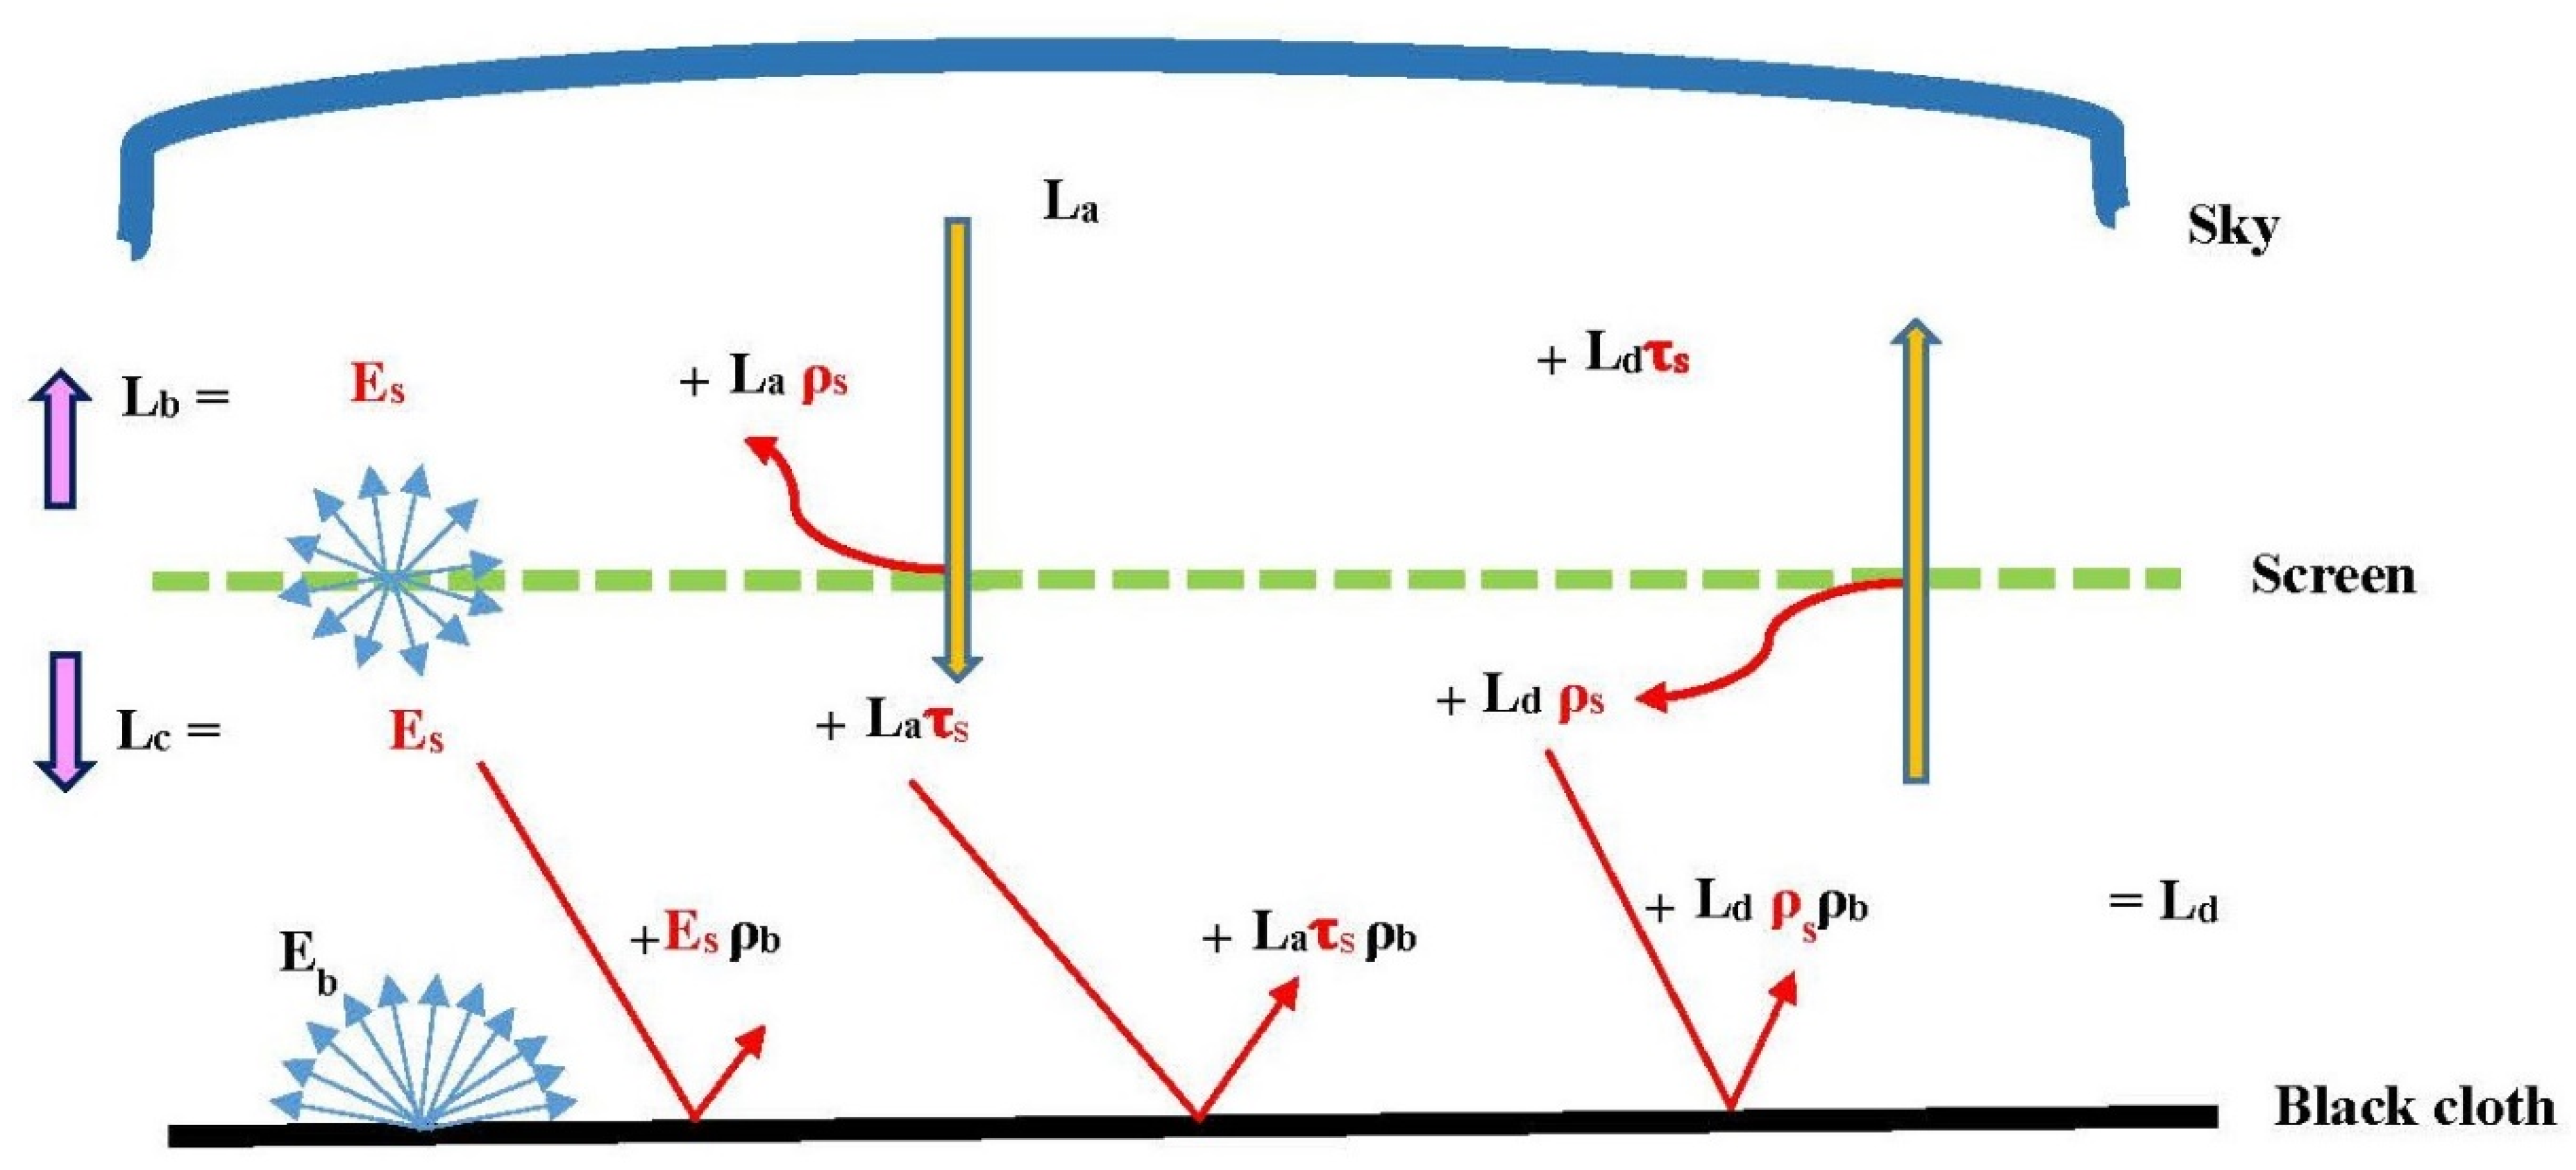
To simulate the greenhouse thermal environment, the used covering material and screen’s physical and thermal properties are critical and must be used as input in the BES model. Therefore, greenhouse covering material (PC and HG) properties were taken from a study by Valera et al. [37] (Table 2). To measure the thermal conductivity of the thermal screen materials used in this study, a Kemtherm (QTM-500) thermal conductivity meter manufactured by Kyoto electronics was used. The complete measurement procedure is detailed in our previous study [38]. Table 2 and Table 3 present the results of the thermal conductivities of thermal screens. Furthermore, the thermal screen data used in this study were unavailable in the literature, and we measured the thermal screen data by a methodology described in one of our previous studies [39]. This study used simplified energy-balance equations to measure the transmittivity, emissivity, and reflectivity of the screens. Table 2 and Table 3 show the results, and Figure 5 describes the concept of the measurement procedure for the used screen’s radiometric properties.
The outgoing long-wave radiation equation above the screen surface (Lb) in W·m−2 is calculated using Equation (2):
L b   = E s + ρ s L a + τ s L d
where ρ s is the screen reflectivity, Es is the screen’s emissive power in W·m−2, τ s is the screen’s transmissivity, and La is the downward sky radiation in W·m−2.
The outgoing long-wave radiation leaving the cover towards the black cloth (Lc) in W·m−2 and below the screen surface for symmetric materials is given in Equation (3):
L c   = E s + τ s L a + ρ s L d
The reflected portion of the incoming long-wave radiation toward the screen above the black cloth (Ld) depends on the screen’s physical condition. The incoming radiation (Ld) in W·m−2 of the transparent and semitransparent materials or of the materials with partial porosities is given in Equation (4):
L d   = E b +   ρ b E s + ρ b ρ s L d + ρ b τ s L a
where ρ b is the black cloth’s reflectivity and Eb is the black cloth’s emissive power in W·m−2, calculated using Stefan–Boltzmann’s law Equation (5).
E b   = σ   T b 4 ε b
where σ is Stefan–Boltzmann’s constant, Tb is the black cloth’s surface temperature, and ε b is emissivity of the black cloth at 0.93.

2.3. BES Modeling

The proposed BES model of a multi-span greenhouse was created using the TRNSYS 18 program to simulate a greenhouse microenvironment. Preprocessing of the model was conducted using the following programs and add-ons: Google SketchUp™, Transys3d, and Berkeley Lab Window 7.4. Google SketchUp™ is a 3-D modeling software and was used in combination with Transys3d, which is an add-on of TRNSYS software for Google SketchUp™, to prepare the 3-D model of the multi-span greenhouse. The complete modeling process is described in a flow diagram in Figure 6. The 3-D model in Figure 7 of the greenhouse was divided into four zones as described in Figure 3a to simulate the thermal screens of the greenhouse. Moreover, the greenhouse zone 1 is divided into many parts by using virtual windows which make it able to observe the temperature at different required locations. Furthermore, Berkeley Lab Window 7.4 software was used to prepare a DOE-2 (readable by TRNSYS) file of greenhouse coverings and thermal screen materials using the physical and thermal properties of all materials described in Table 2 and Table 3.
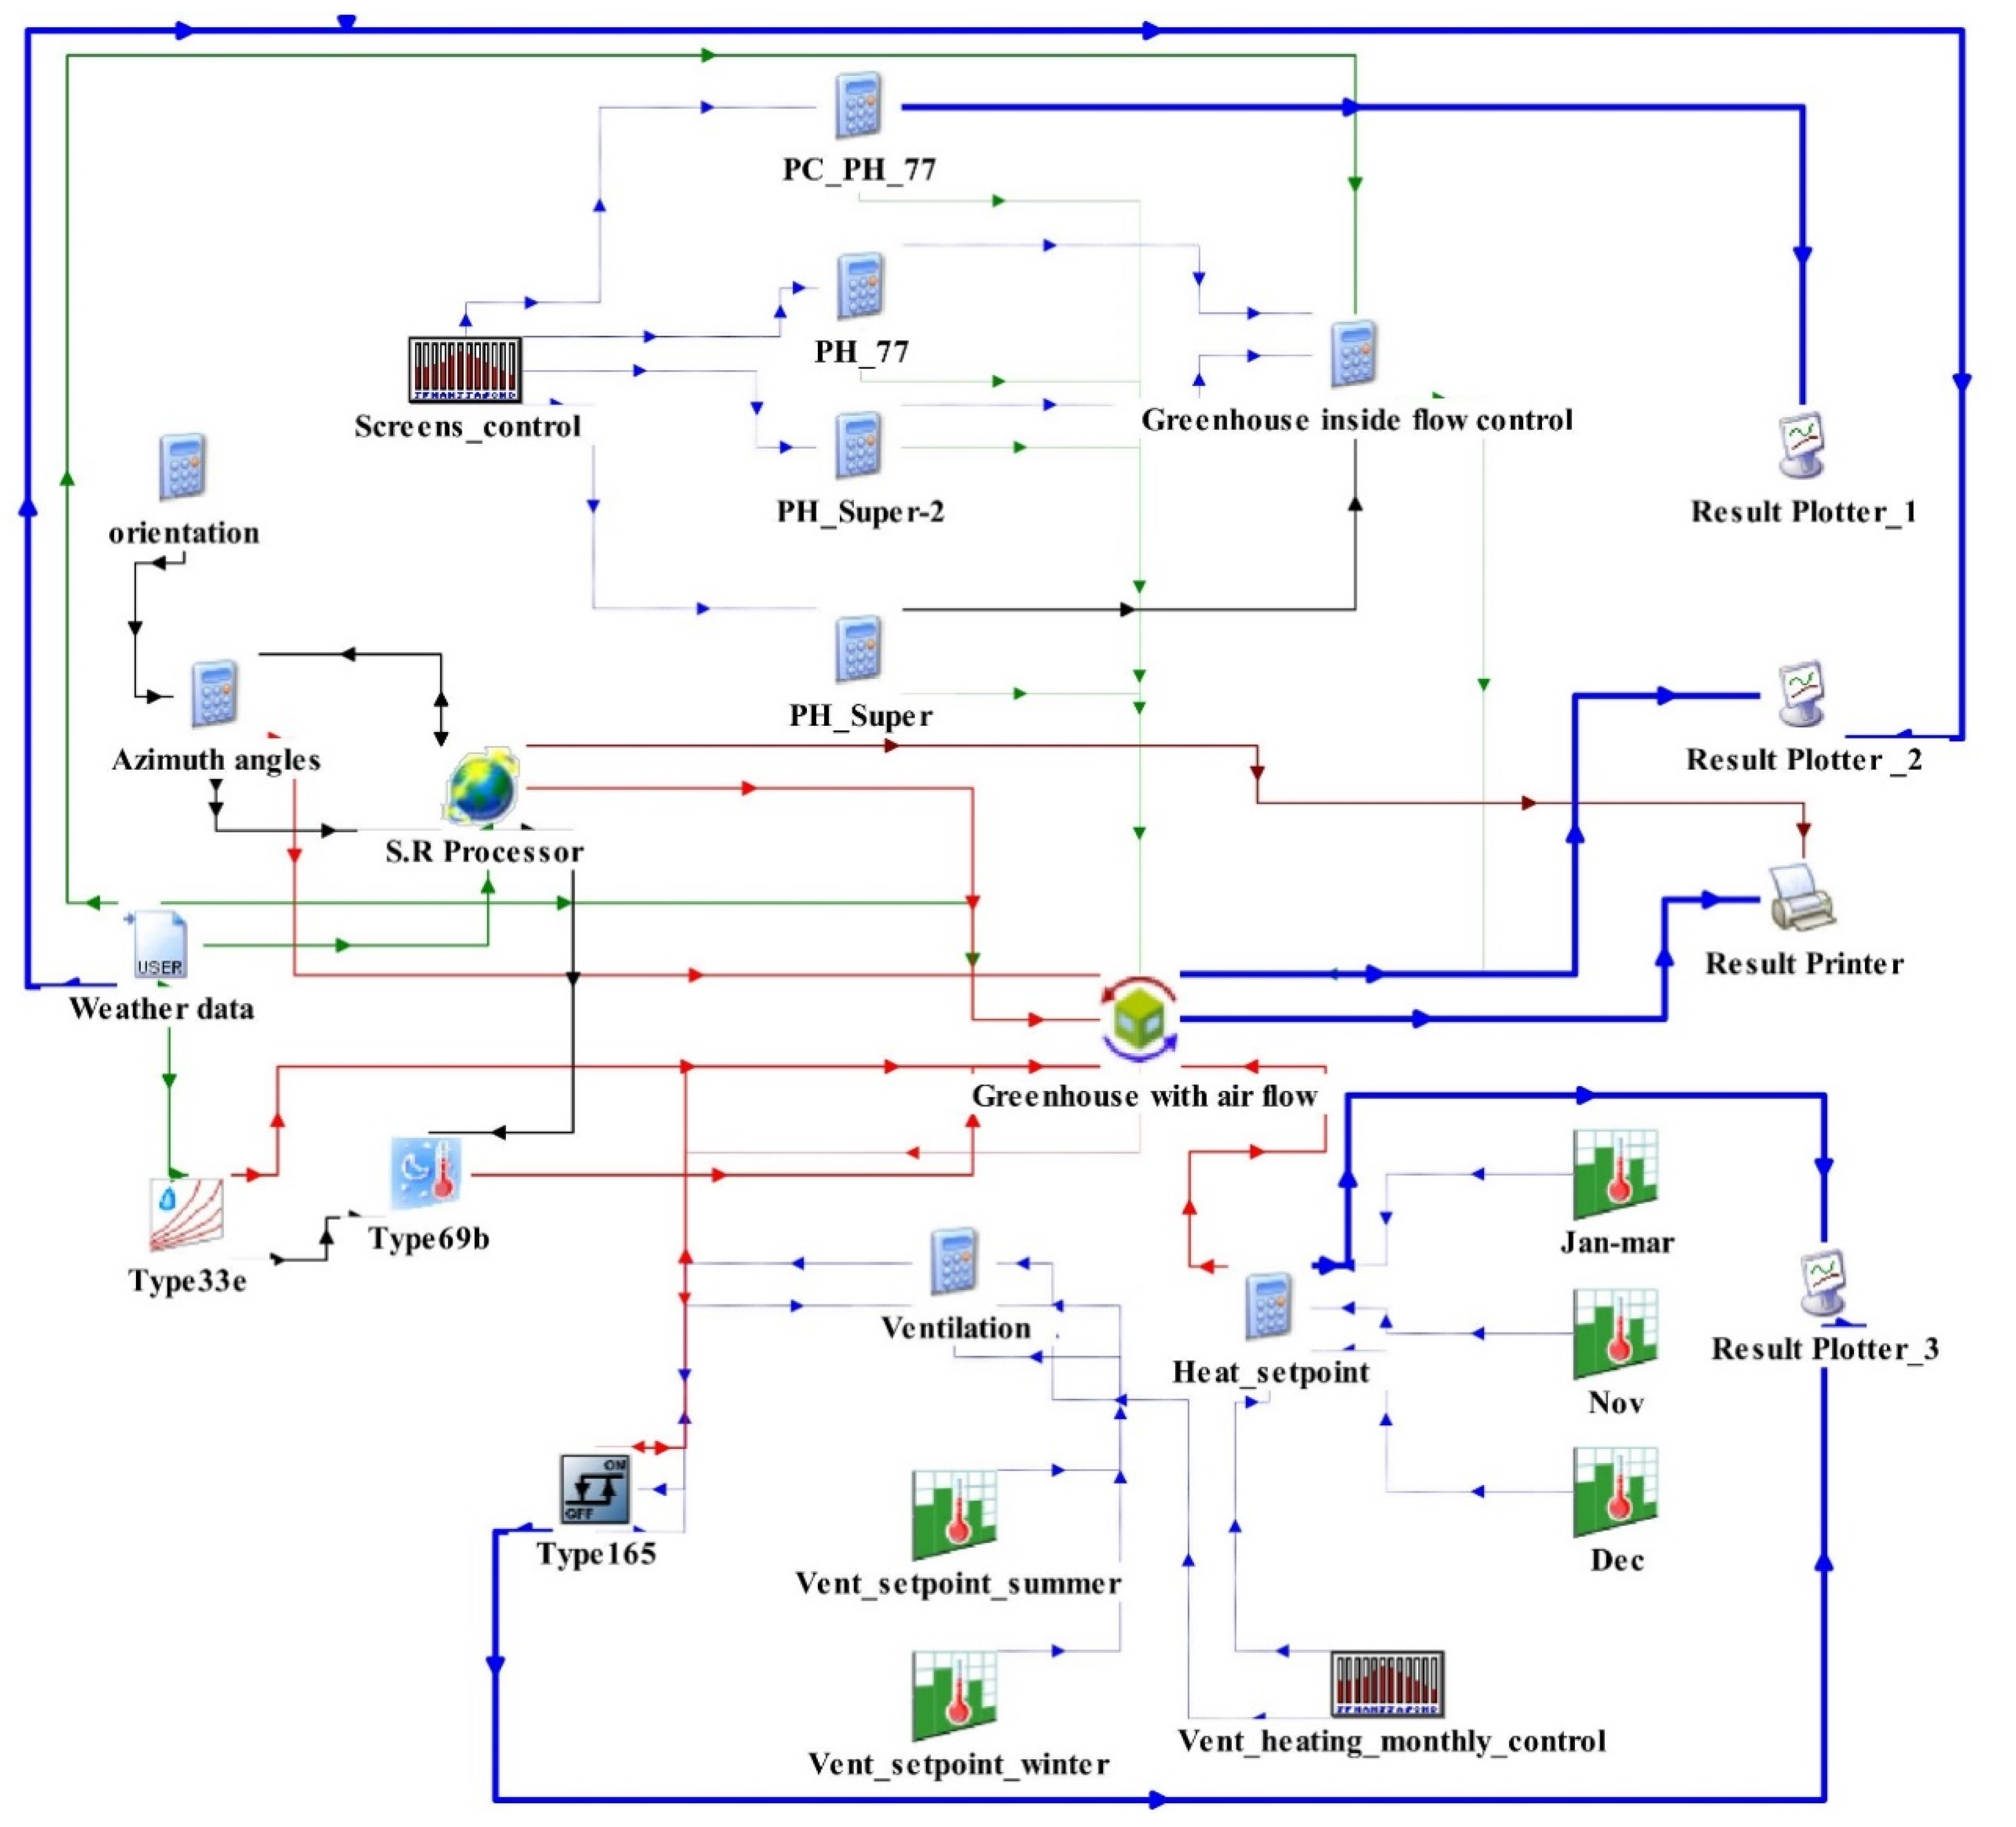
After preprocessing the simulation studio, the main interface of the TRNSYS-18 program was used for modeling. In this interface, we connected all components, including the greenhouse building 3-D model, weather data, and all processors to lead the simulations. Figure 8 shows a diagram of the simulation studio, where all inputs and outputs are connected. Details of all components used in the simulation studio for the proposed model are described in Table 4. The 3-D model input as well as the selection of outputs and complete description of the 3-D model were done in TRNBuild, which is a multizone building model component of the TRNSYS-18 program. It allows basic input data of the project. The 3-D model file prepared by Transys3d was imported here, and the DOE-2 file of the materials’ properties was also used in TRNBuild to prepare the input data. Moreover, to simulate the natural ventilation effect in the greenhouse, TRNFLOW was used, which is an add-on to TRNSYS used to design the airflow network of natural ventilation of the greenhouse. This used the airspeed, air direction, and ambient pressure as inputs to calculate airflow inside the greenhouse.

2.4. Validation

To validate the proposed BES model, the computed internal temperature was compared with those obtained experimentally. To validate the model, two periods including summer and winter were chosen, as greenhouse operating conditions are different in these periods. In both cases, simulations were conducted with the same greenhouse just by changing operating conditions of the greenhouse for both periods. Table 5 presents the details of the physical and operating conditions of the greenhouse for both validation results. Furthermore, statistical analyses were performed to predict the BES model’s accuracy using the Nash–Sutcliffe efficiency coefficient (NSE). We compared the experimentally observed greenhouse inside temperature with the output of the BES. This coefficient quantitatively shows how well the plot of the observed versus simulated data fits 1:1. Its value ranges from −∞ to 1, and values closer to 1 show a better predictive power of the model. Equation (6) mathematically expresses the NSE.
NSE = 1   [ i = 0 n ( T i exp T i sim ) 2 i = 0 n ( T i exp T i mean ) 2 ]
where T i exp (°C) is the experimentally obtained internal temperature of the greenhouse, T i sim (°C) is the simulated internal temperature of the greenhouse, T i mean (°C) is the mean of the experimental temperature, and n is the total number of observations.

2.5. Simulation

After successfully modeling and validating the BES model, several simulations were performed:
  • to predict the greenhouse heating load without thermal screens and with single-, double-, and triple-layered thermal screens and to compare them;
  • to estimate the temperature of the greenhouse below and above each screen. All simulations were run with the 18 °C heating temperature setpoint; all other setpoints for ventilation and the thermal screen opening and closing were the same, as detailed in Table 4 in the Validation section;
  • to predict the maximum heating load without thermal screens and with single, double, and triple thermal screens;
  • to predict the heating load when using a combination of different thermal screens; and
  • to predict the heating load with month-based day and night temperature setpoints.

3. Results and Discussion

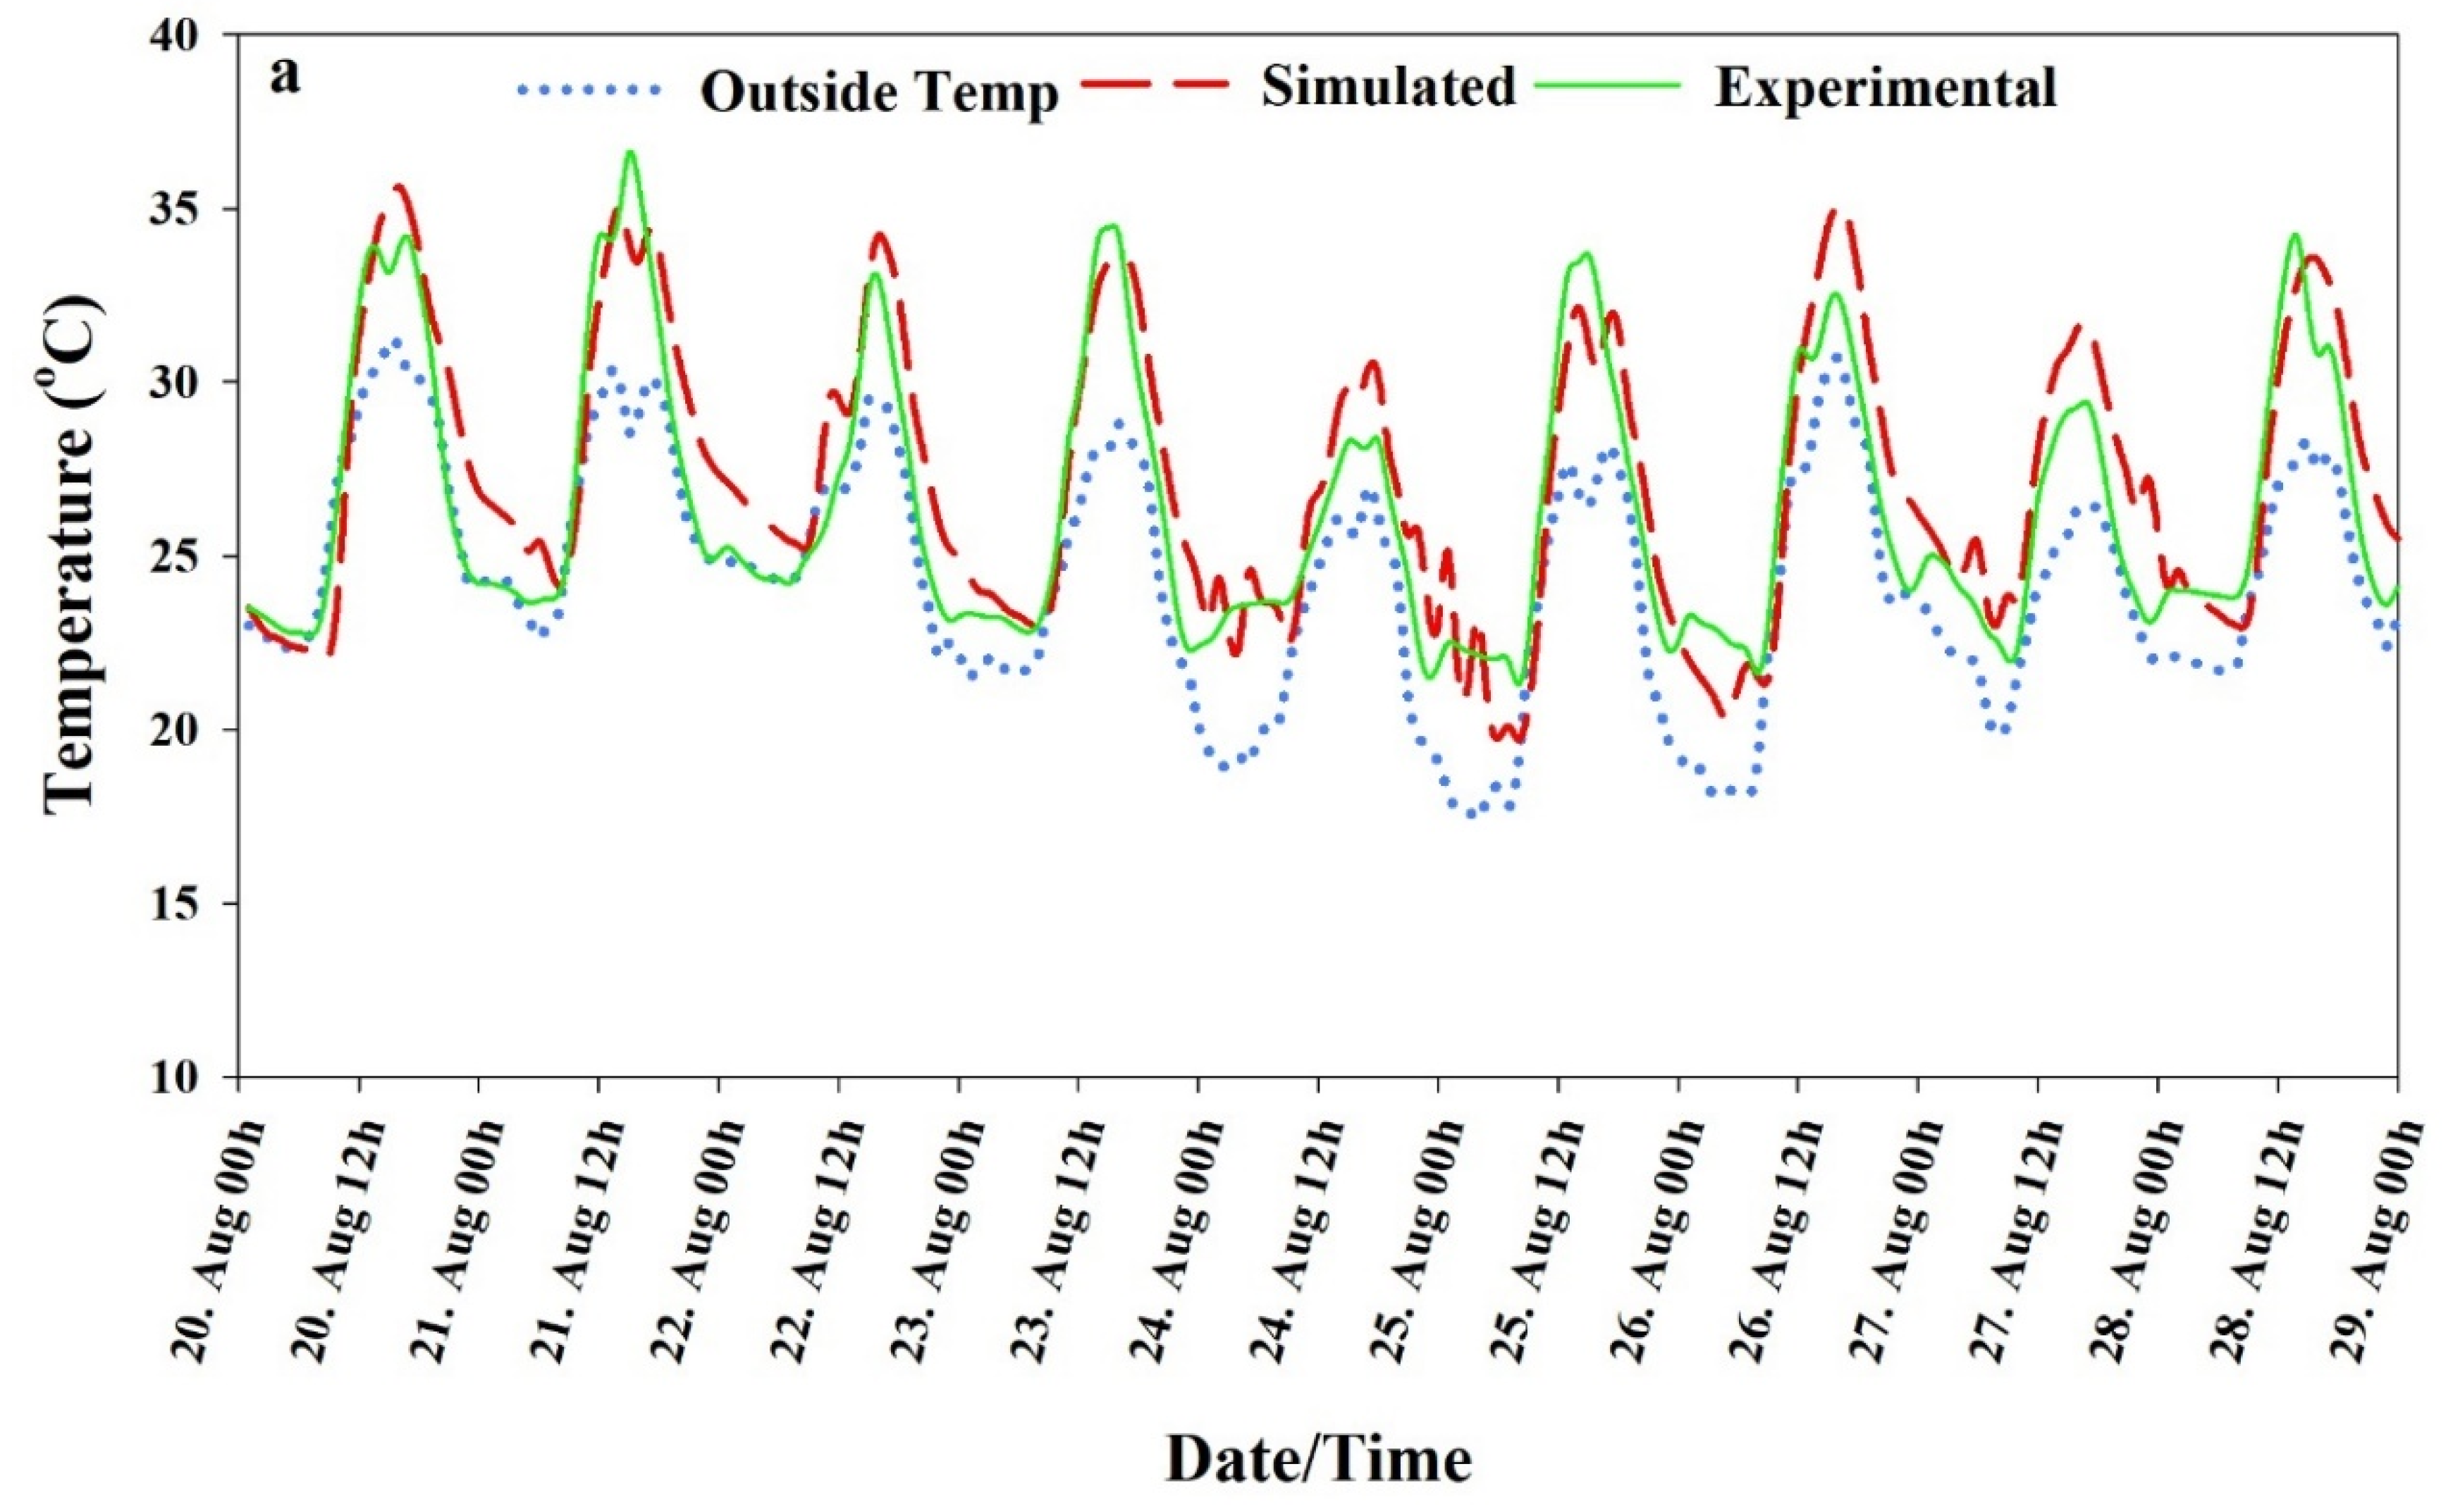
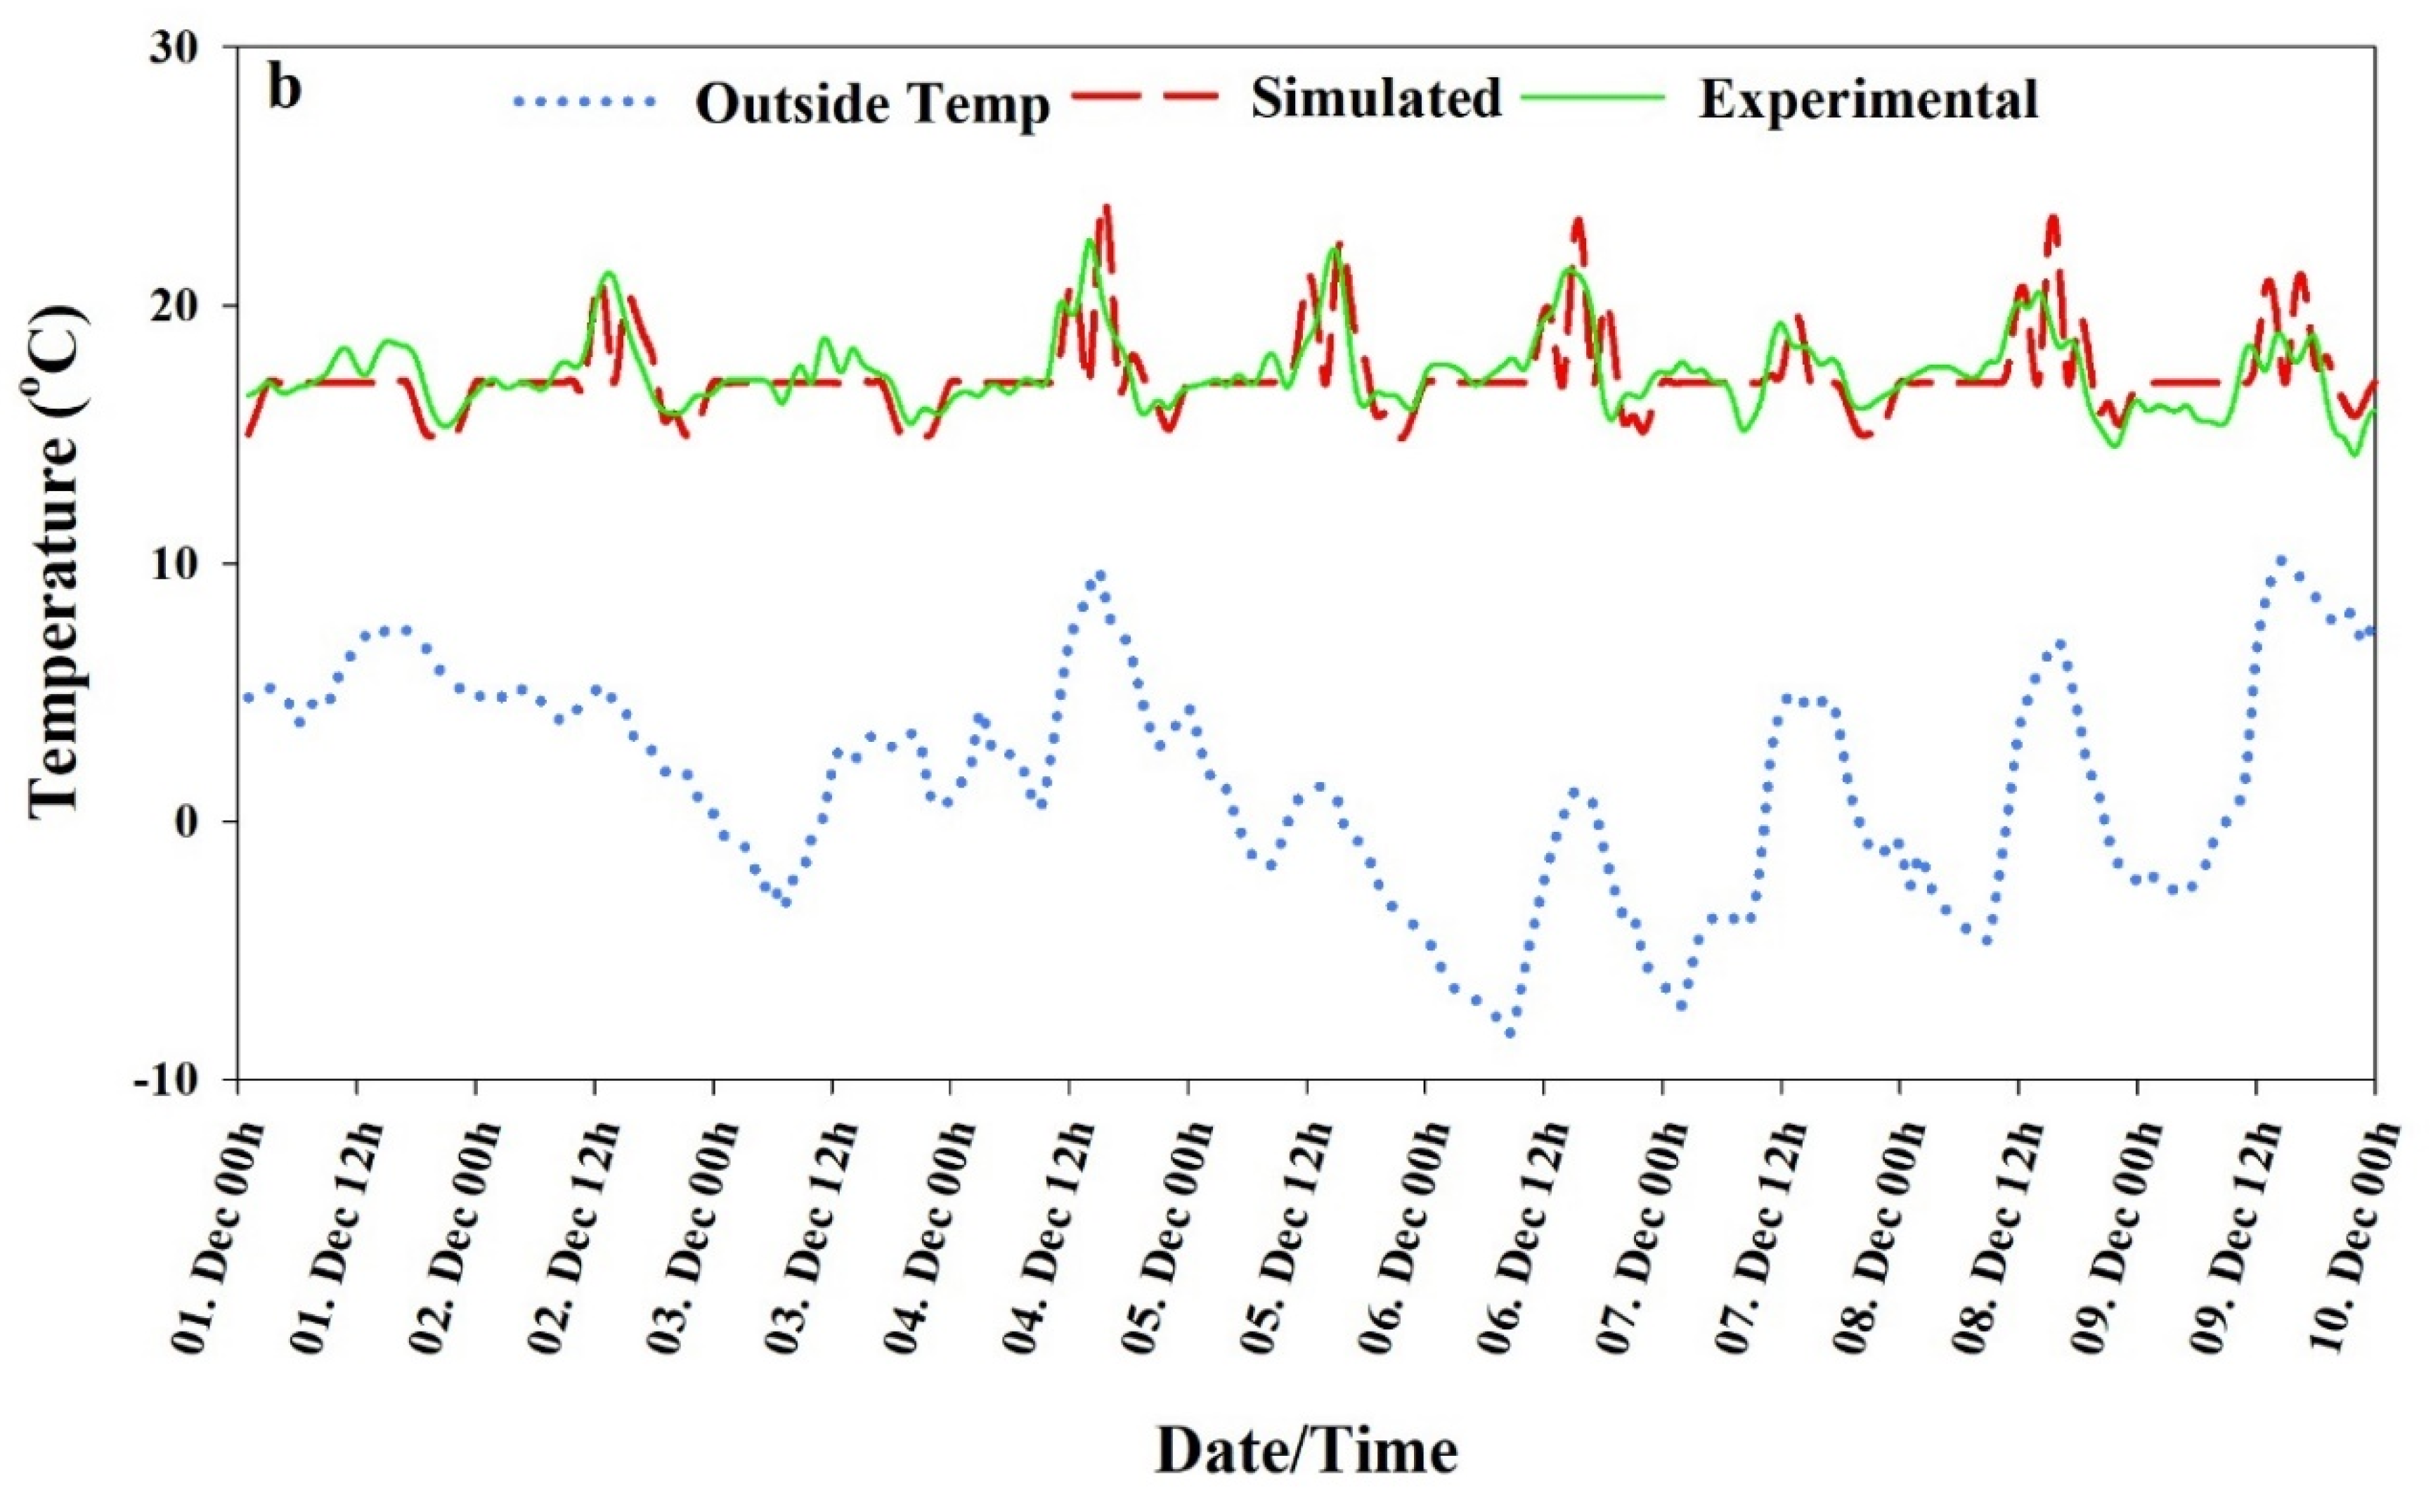
Validation analyses were done for the greenhouse-controlled system. The computed inside-air temperatures of greenhouses were compared with those experimentally obtained from temperature-controlled natural ventilation, heating setpoint, and solar-radiation-controlled thermal screens. Figure 9a,b shows both validation results. Table 4 details the greenhouse operating conditions for both cases. In Figure 9a,b, the maximum temperature differences were 2 °C and 4 °C, respectively, occurring during day time when the greenhouse temperature was controlled by natural ventilation. The NSE values of 0.87 and 0.71 for both validation results show the goodness-of-fit between the experimental and BES computed results. Agreement between the experimental and computed results under both conditions encourages adoption of the proposed BES model.
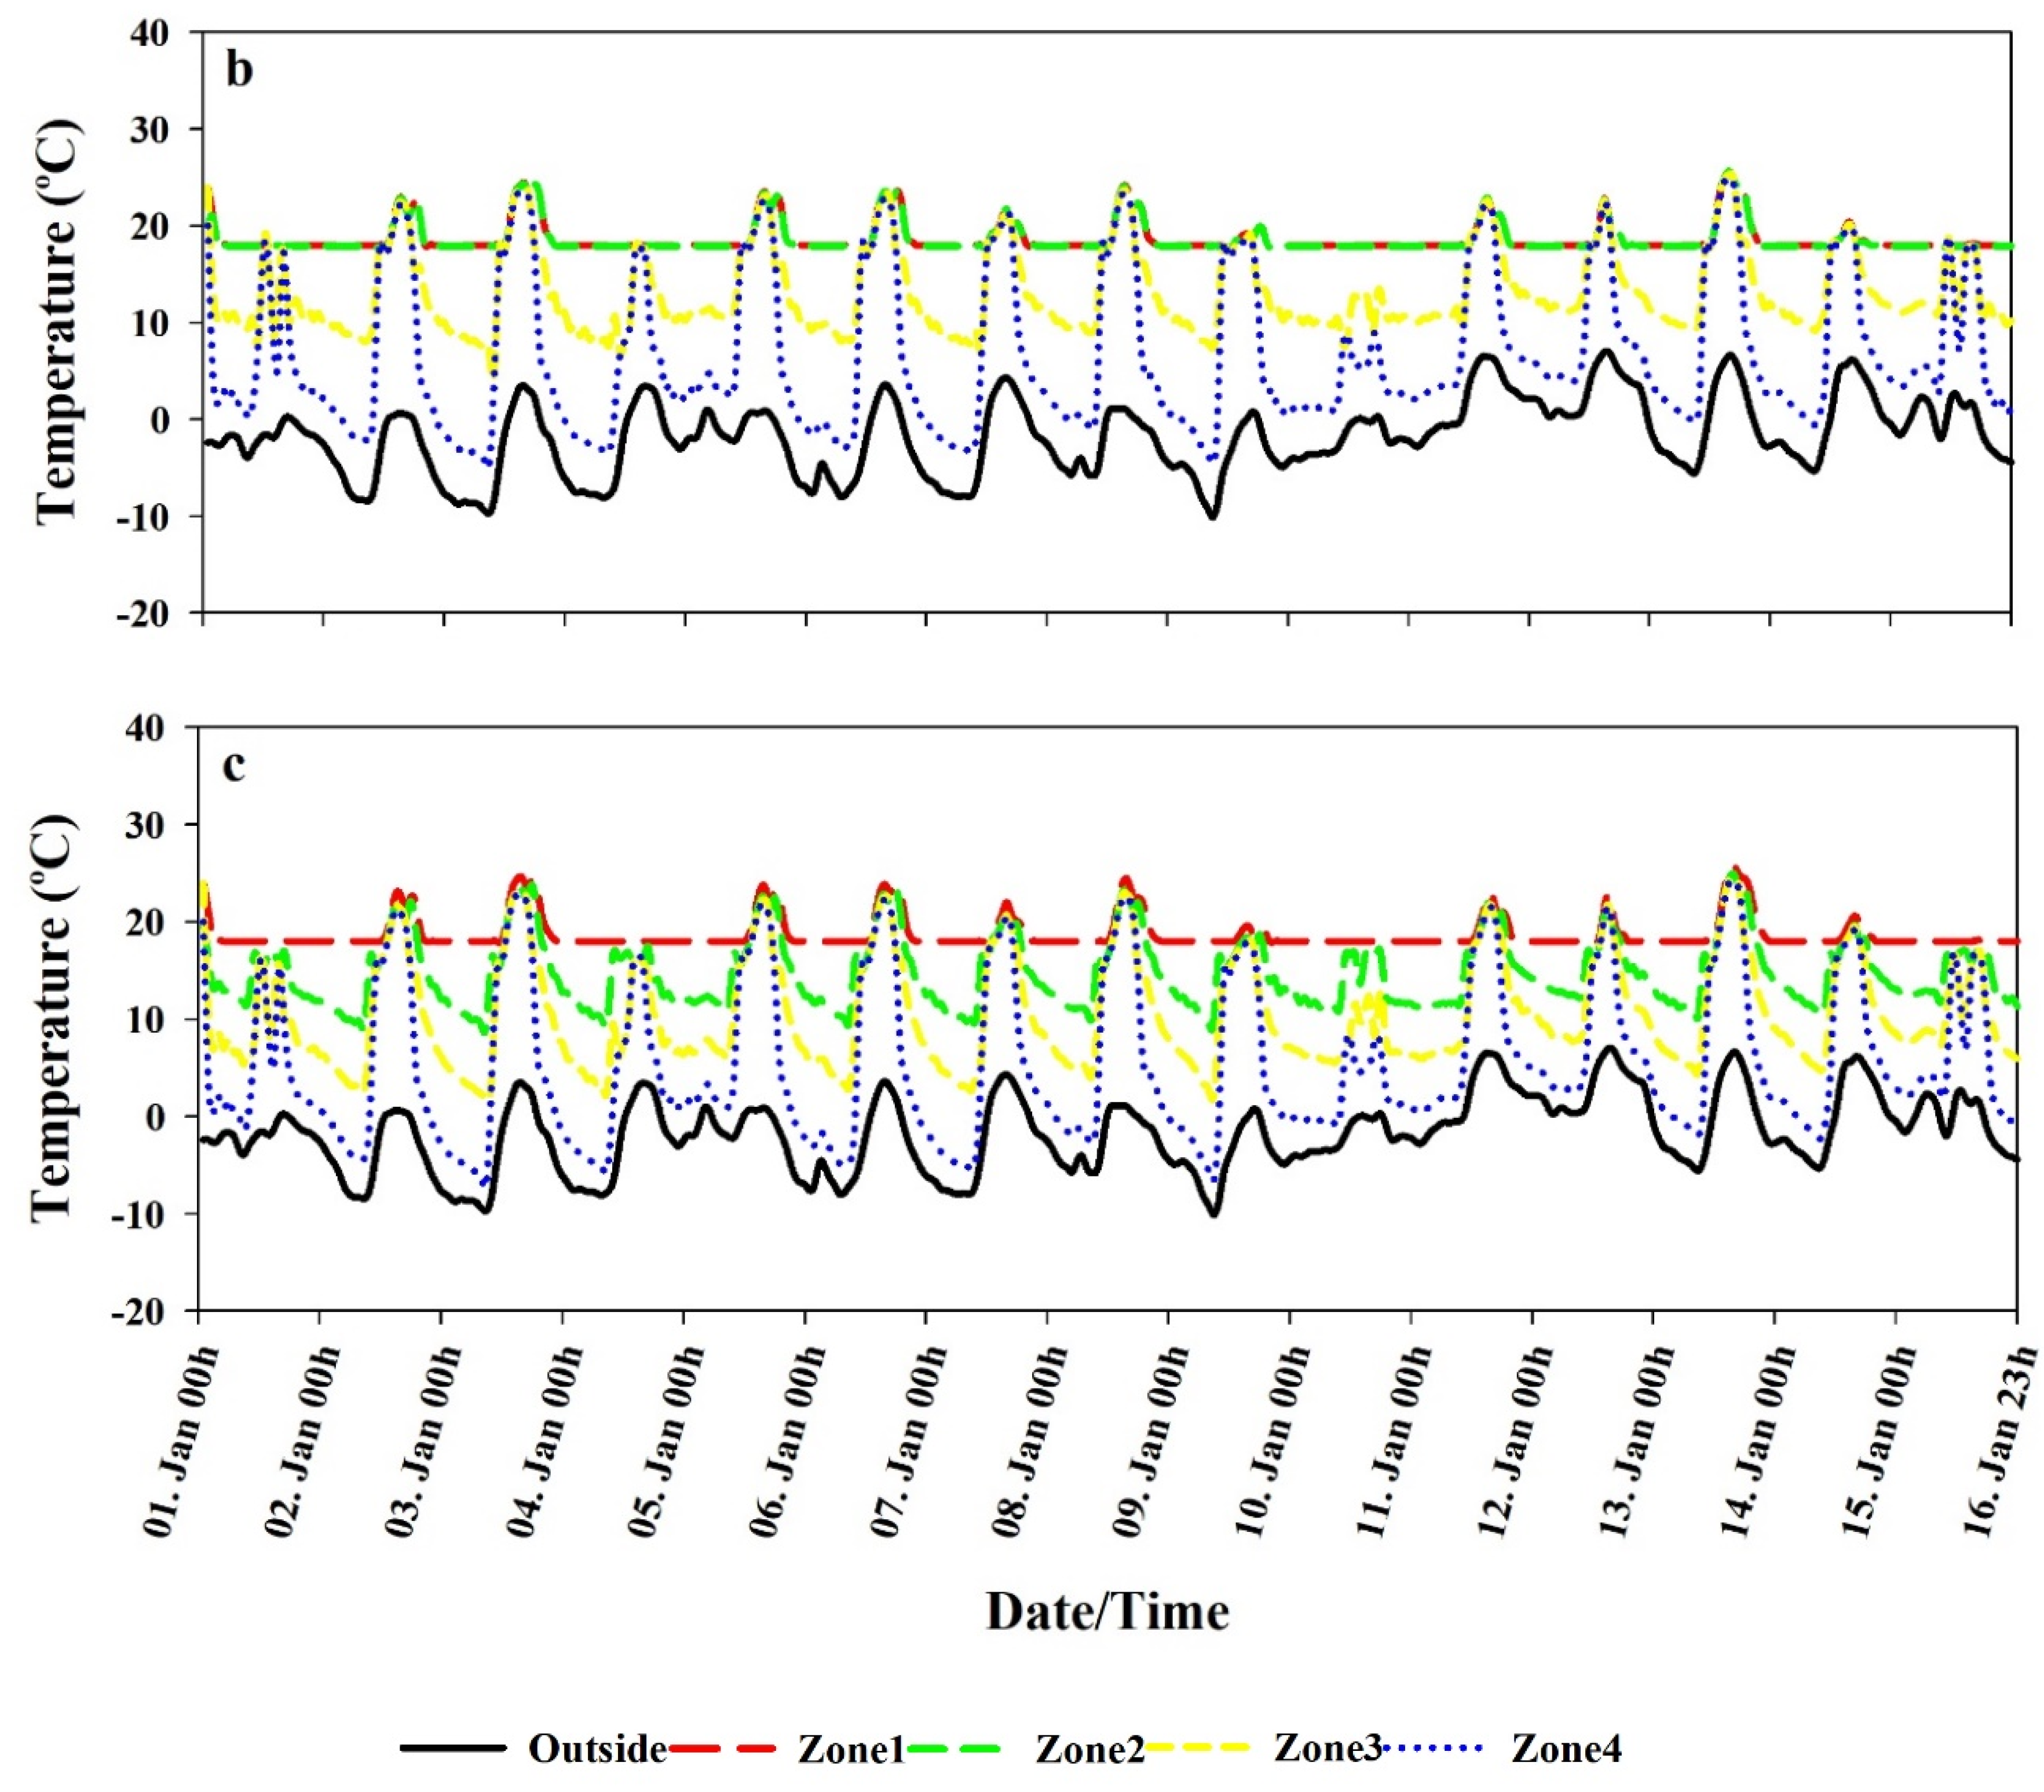
The greenhouse was divided into four zones (Figure 3a) to calculate the air temperature inside the greenhouse at all zones, and the control screens were deployed and retracted during day and night. Figure 10 shows the greenhouse inside temperature in all zones. Figure 10a–c shows the inside temperature results when using single, double, and triple screens, respectively. Figure 10a shows that zones 1, 2, and 3 have the same night temperature (18 °C) and that, above the screen (zone 4), the temperature is different. Likewise, Figure 10b,c shows the results when using double and triple screens, showing that all zone temperatures are different. The results also show that the screens placed above (zone 4) were 10 °C, 5 °C, and 2 °C higher in temperature than the outside temperature for single, double, and triple screens, respectively, because of lower heat loss as the number of screens increased. A study conducted by Lee et al. [40] using an air-heated plastic greenhouse installed with two thermal screens measured the air temperature above and below the screen and confirmed the trend of our results.
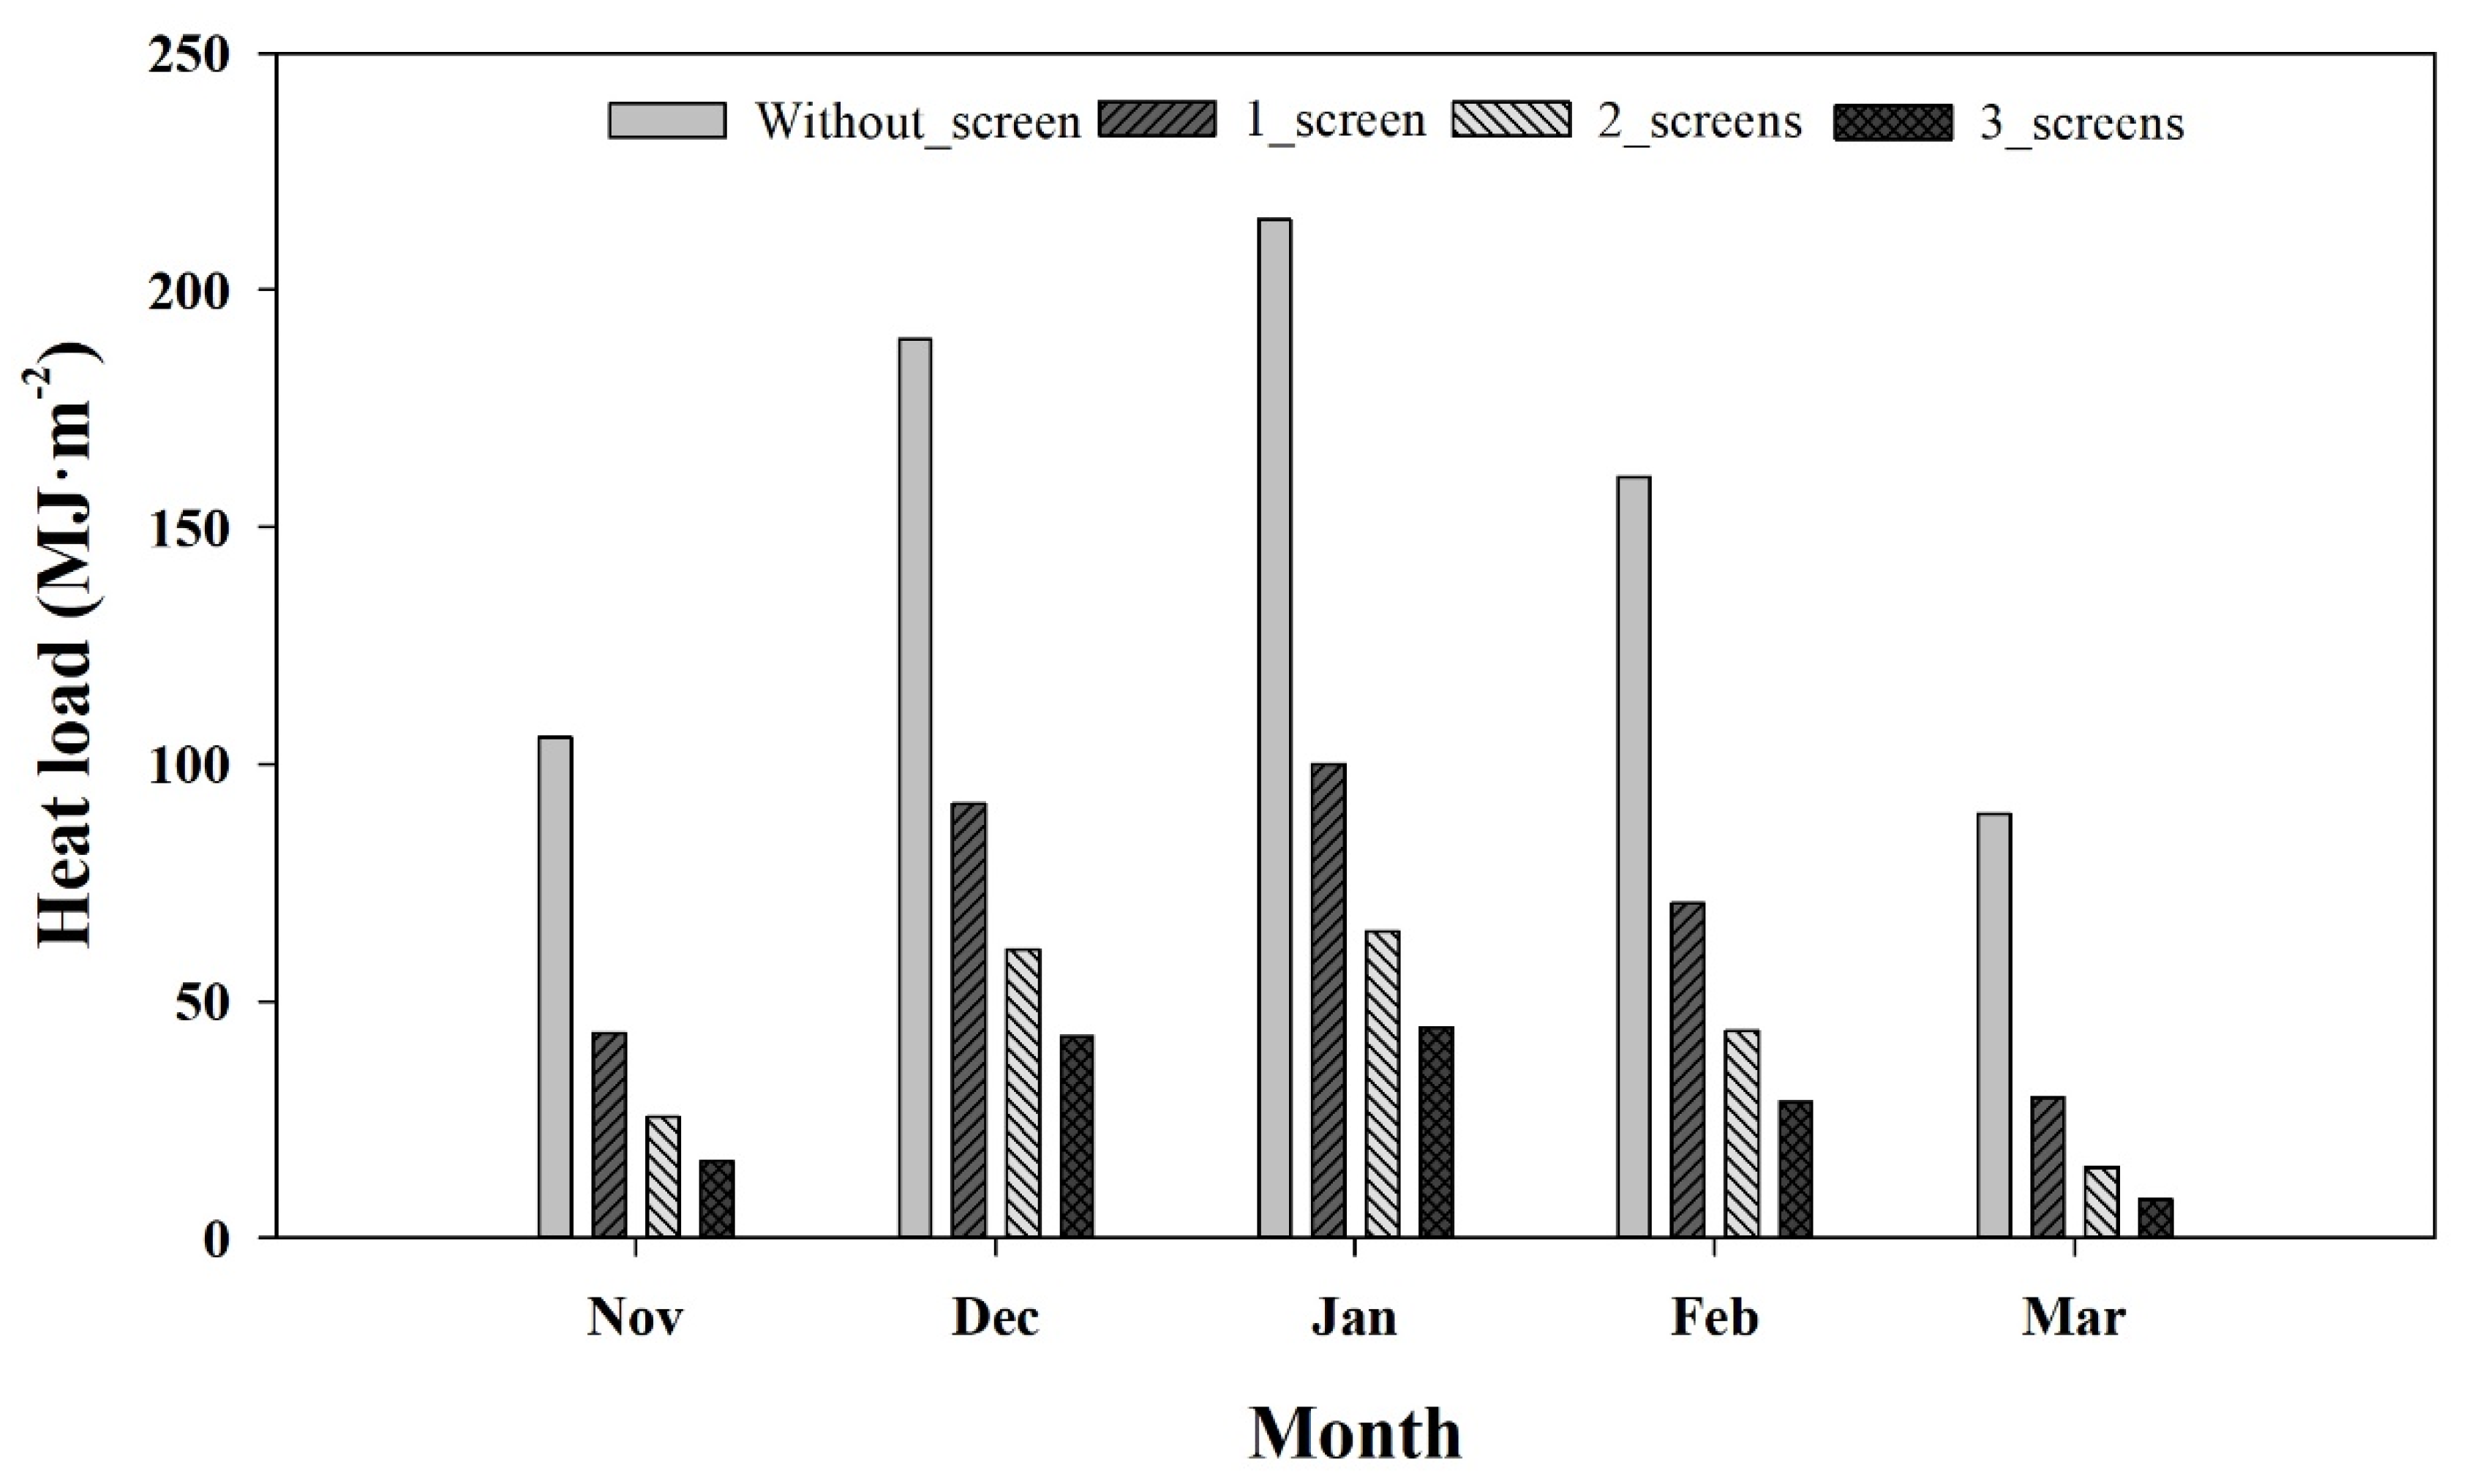
Figure 11 shows the monthly heating load of the greenhouse without a screen and with single, double, and triple screens during winter. Three layers of screens showed the least heating load during every month compared to others. The results also show that, when using two and three layers of screens, the heating load difference is less than that of the single and double layers of screens. As expected, when using the night thermal screen, the heating load is less than that of the heating load of the greenhouse without a screen. Therefore, using two and three layers of screens could save a significant amount of energy during winter because thermal screens retain heat in the canopy by serving as heat barriers between the canopy and roof of the greenhouse. Using the screens also reduces the volume of the greenhouse to be heated.
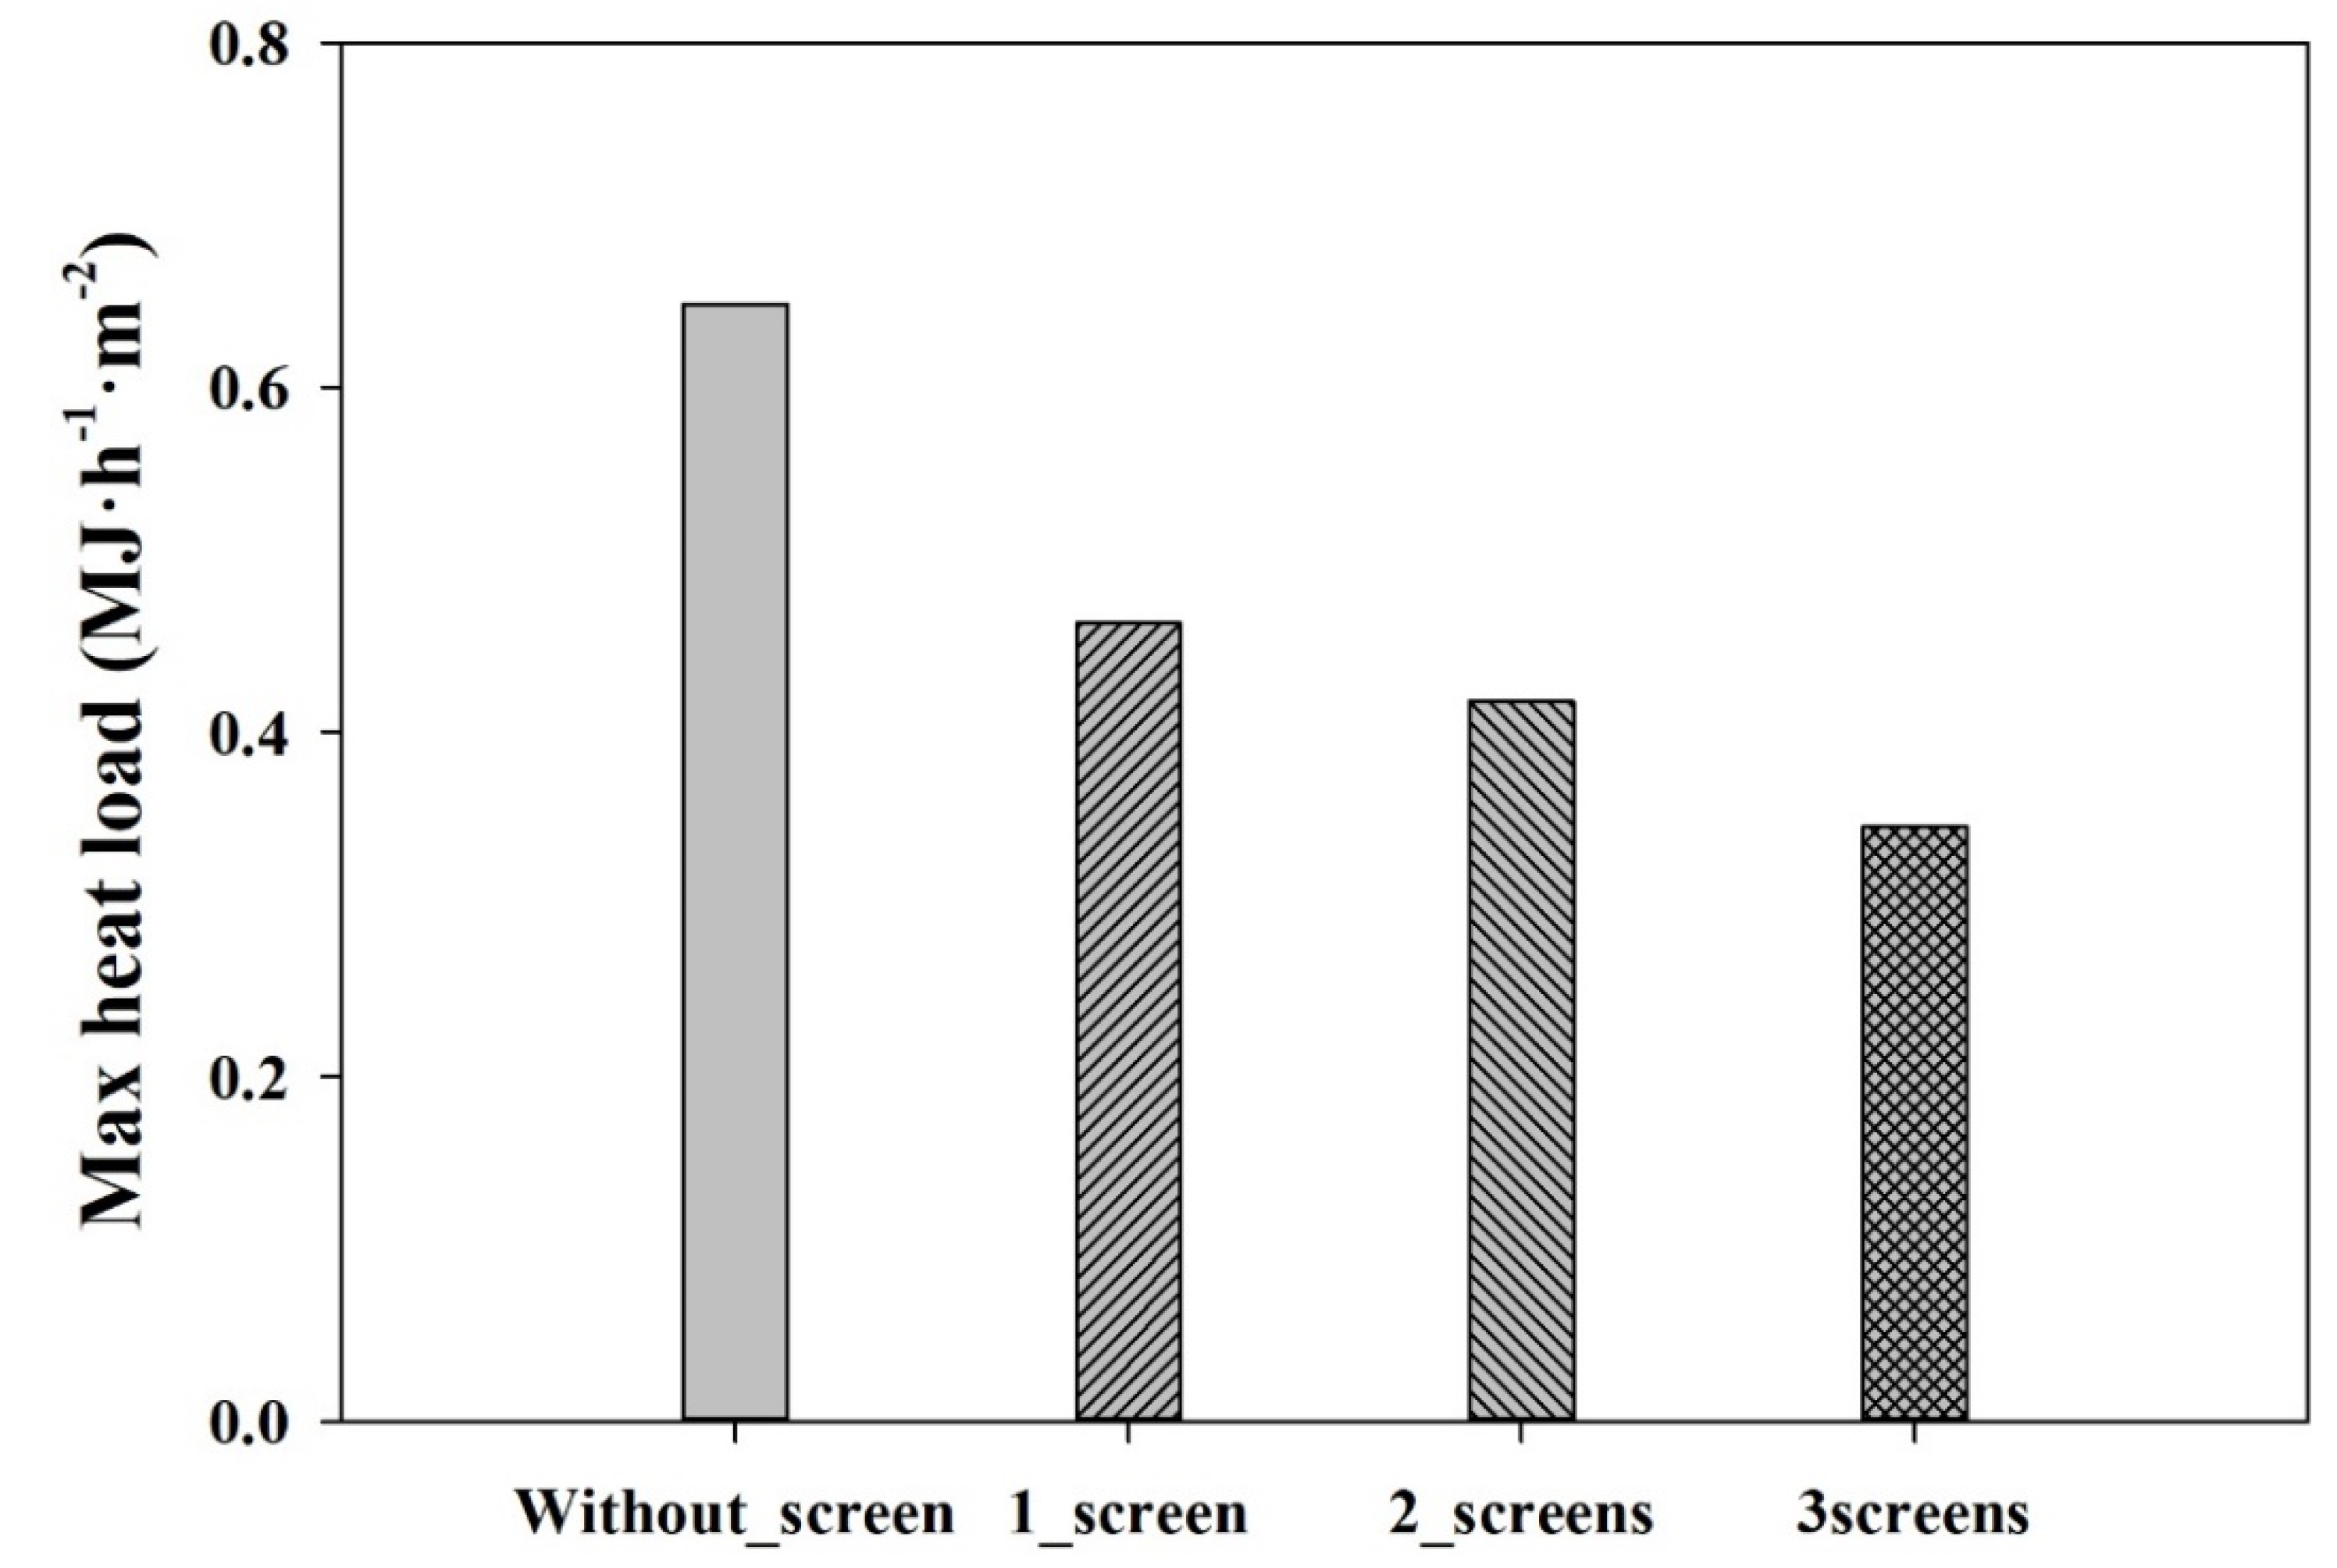
Figure 12 shows the maximum annual heating load of the greenhouse without a screen and with single, double, and triple screens. The total heating load by using three screens shows the lowest maximum heating load of the greenhouse. Calculating the maximum heating load of the greenhouse with fully controlled systems helps to design a heating facility for greenhouse heating. The maximum heating load occurred at 8:00 AM on January 9 when the outside temperature was −10.5 °C. This was the lowest temperature of the day, and solar radiation was zero. One study [29] about the estimation of heating and cooling loads of greenhouses also used TRNSYS to estimate the maximum heating and cooling loads of the multi-span greenhouse to provide data for design of the heating and cooling facilities for the greenhouse.
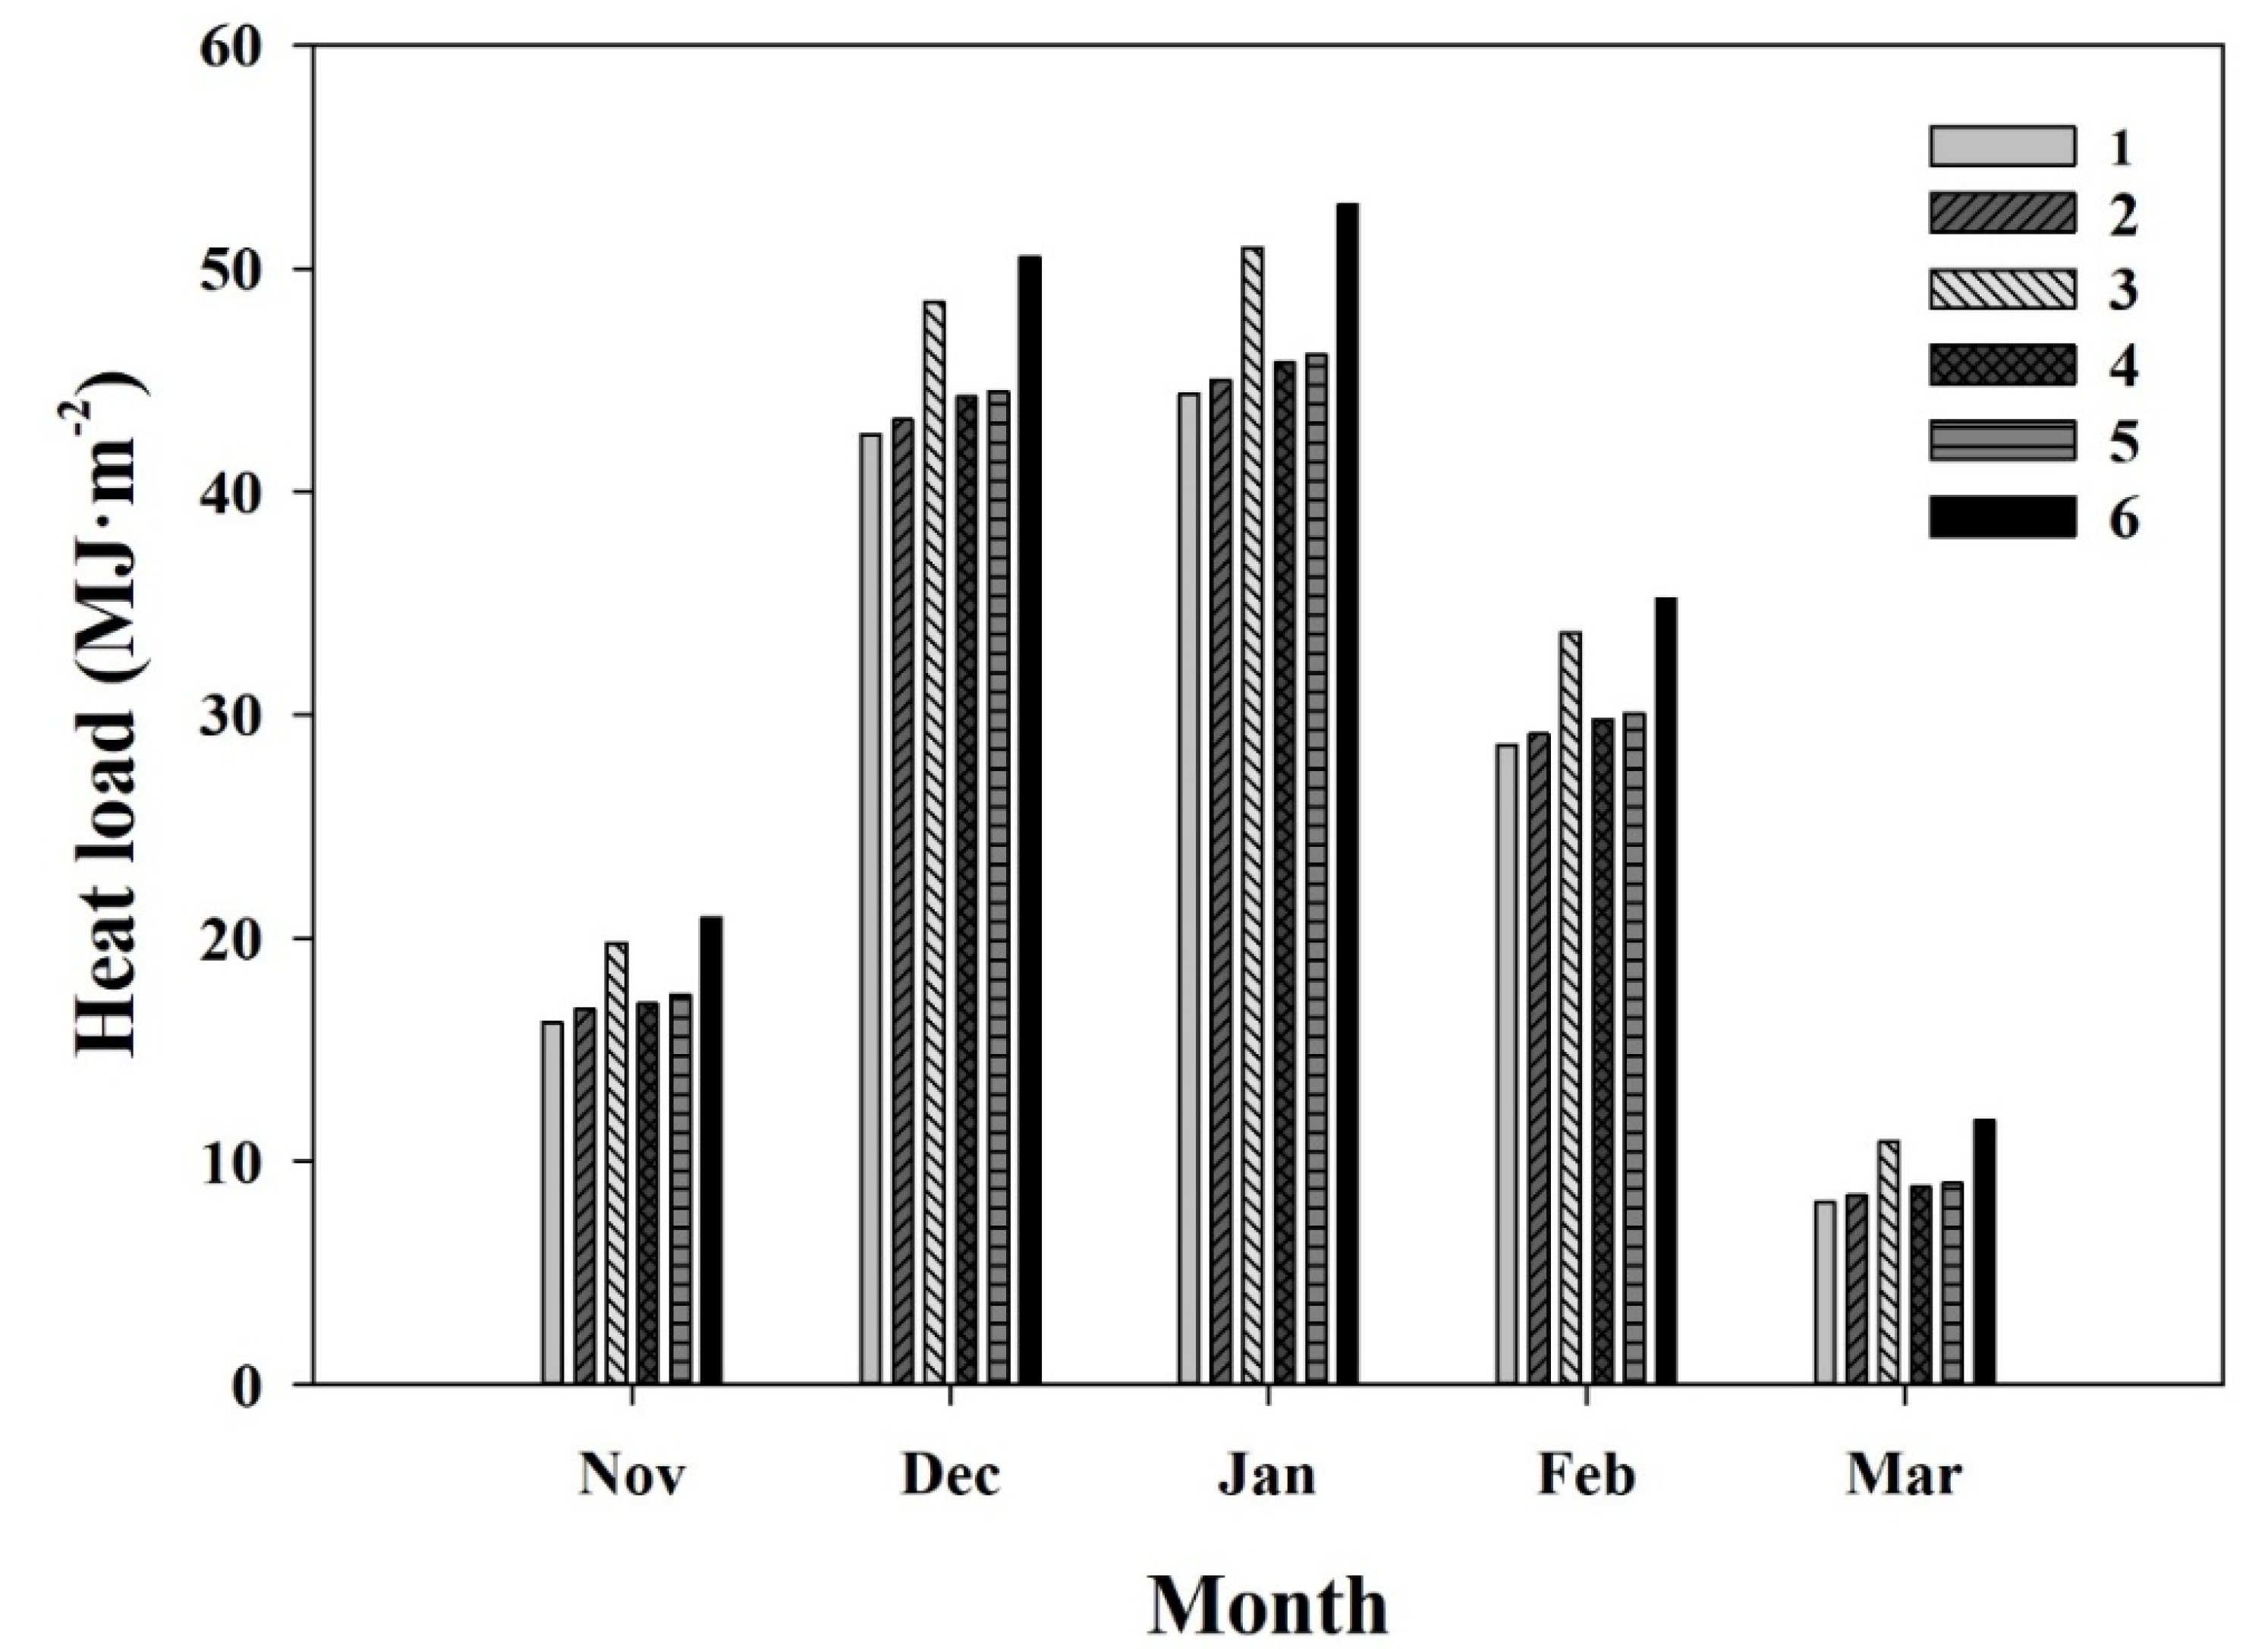
Further analyses were conducted with different screens available in the market. Compression of the screens was necessary to select one according to our specific requirements. We compared different screens by considering their thermal properties described in Table 2 and Table 3. Figure 13 depicts the monthly heating load of a combination of different screens. Combination 1 (Ph-77 combined with Ph-super) shows the lowest heating load, leading to maximum energy saving compared with the others; they were 2%, 15%, 4%, 5%, and 20% less than the other combinations (2, 3, 4, 5, and 6). The detail of all combinations of screens used in Figure 13 are explained in Table 6.
Figure 14 shows control of the greenhouse heating setpoint according to the optimal growth temperature of the crop. The results show the monthly heating load of the multi-span greenhouse according to the heating setpoint. When a fixed heating setpoint of 18 °C was used, the heating load was higher than that of the designed day- and nighttime heating setpoints for every month. The fixed and day and night time temperature controls are detailed in Table 7. The model predicted that using the designed day- and nighttime heating control setpoints can reduce the heating load by 3%, 15%, 14%, 15%, and 40% than when using a fixed value temperature control for November, December, January, February, and March, respectively. One study [41] investigated the energy-saving measure on the greenhouse and confirmed our result’s trend.

4. Conclusions

This study proposed a more accurate and convenient thermal model of a multi-span greenhouse using the TRNSYS 18 program as a BES, which can simulate the transient thermal environment of a greenhouse. We calculated the heating load of the multi-span greenhouse influenced by transient control of the microenvironment of the greenhouse. The proposed model can predict the greenhouse’s microclimate and heat load while considering different thermal screens, natural ventilation, and heating setpoint, combined with daily automatic control of these parameters, which was lacking in the literature.
The results showed that the heating load of the triple-layered screen was 70% and 40% lower than the single-screen and double-screen greenhouse, respectively. Moreover, the maximum heating loads of the greenhouse without a screen and with single-, double-, and triple-layered screens were 0.65, 0.46, 0.41, and 0.34 MJ·m−2, respectively. Analysis of the different screens showed that Ph-77 combined with Ph-super had the least heating requirements. The heating setpoint analysis predicts that using the designed day- and nighttime heating control setpoints can reduce the heating load by 3%, 15%, 14%, 15%, and 40% compared to when using a fixed value temperature control for November, December, January, February, and March, respectively.
The proposed model showed high flexibility. The validation results encourage adoption of the model when investigating the greenhouse dynamic environment with an underlying aim to control the greenhouse microenvironment and designing a heating facility for the greenhouse. It also considers the local environment and specific needs, helping to reduce operational costs with pre-design decisions. Various types of thermal screens are available in the market. Researchers can use the proposed model to analyze the different thermal screens available in their local market to help growers select the best thermal screens and control strategies based on total energy-saving potential. Screen producers can choose the more energy-efficient thermal screen based on screen properties to fulfill the specific needs of the growers. The result of the different studies can be different according to location and crop need. However, analysis of control strategies and greenhouse structural designs, use of energy-efficient screens, and ventilation control can help adjust for crop need and local location. Future studies will analyze the effect of design parameters of a multi-span greenhouse on heating and cooling loads.

Author Contributions

Conceptualization, A.R., H.W.L., C.S.K. and H.T.K.; methodology, A.R., W.H.N. and H.W.L.; software, A.R. and J.W.L.; validation, J.W.L., W.H.N. and H.T.K.; investigation, A.R. and C.S.K.; resources, W.H.L.; writing—original draft preparation, A.R.; writing—review and editing, C.S.K., W.H.N., H.T.K. and H.W.L.; supervision, H.W.L. All authors have read and agreed to the published version of the manuscript.

Funding

This research was supported by Basic Science Research Program through the National Research Foundation of Korea (NRF) funded by the Ministry of Education (NRF-2019R1I1A3A01051739). This work was supported by Korea Institute of Planning and Evaluation for Technology in Food, Agriculture, Forestry, and Fisheries (IPET) through Agriculture, Food, and Rural Affairs Convergence Technologies Program for Educating Creative Global Leader, funded by Ministry of Agriculture, Food and Rural Affairs (MAFRA) (717001-7).

Conflicts of Interest

There is no conflict of interest regarding the publication of this research.

Nomenclature

Abbreviations
TRNSYSTransient Systems Simulation
HGHorticulture glass
PCPolycarbonate
Ph-77Screen’s specific name
Ph-superScreen’s specific name
BESBuilding energy simulation
KMAKorean Meteorological Administration
NSENash–Sutcliffe efficiency coefficient
expExperimental
simSimulated
CFDComputational Fluid Dynamics
Symbols
WWind speed (m·s−1)
WsWind speed at the given height (ms−1)
HHight (m)
αEmpirically derived coefficient (2/9
LbLong-wave radiation above the screen (W·m−2)
LaDownward sky radiation (W·m−2)
LcLong-wave radiation equation over the black surface (W·m−2)
LdIncoming radiation above the black cloth (W·m−2)
ρ S Screen reflectivity
EsScreen’s emissive power (W·m−2)
τ s Screen’s transmissivity
ρ b Black cloth’s reflectivity
EbBlack cloth’s emissive power (W·m−2)
TiAir Temperature (°C)
TbBlack cloth surface temperature (K)
ε b emissivity of black cloth
σ Stefan–Boltzmann constant ((W·m−2·K4)

References

  1. Rasheed, A.; Lee, J.W.; Lee, H.W. Development of a model to calculate the overall heat transfer coefficient of greenhouse covers. Span. J. Agric. Res. 2017, 15, 1–11. [Google Scholar] [CrossRef] [Green Version]
  2. Ghosal, M.K.; Tiwari, G.N. Mathematical modeling for greenhouse heating by using thermal curtain and geothermal energy. Sol. Energy 2004, 76, 603–613. [Google Scholar] [CrossRef]
  3. Kassai, M.; Al-Hyari, L.J.E. Investigation of ventilation energy recovery with polymer membrane material-based counter-flow energy exchanger for nearly zero-energy buildings. Energies 2019, 12, 1727. [Google Scholar] [CrossRef] [Green Version]
  4. Hemming, S.; Romero, E.B.; Mohammadkhani, V.; van Breugel, B. Energy Saving Screen Materials: Measurement Method of Radiation Exchange, Air Permeability and Humidity Transport and a Calculation Method for Energy Saving; Wageningen University & Research: Wageningen, The Netherlands; BU Greenhouse Horticulture: Wageningen, The Netherlands, 2017. [Google Scholar]
  5. Shakir, S.M.; Farhan, A.A. Movable thermal screen for saving energy inside the greenhouse. Assoc. Arab Univ. J. Eng. Sci. 2019, 26, 106–112. [Google Scholar] [CrossRef]
  6. Park, B.-S.; Kang, T.-H.; Han, C.-S. Analysis of heating characteristics using aluminum multi-layer curtain for protected horticulture greenhouses. J. Biosyst. Eng. 2015, 40, 193–200. [Google Scholar] [CrossRef] [Green Version]
  7. Kim, H.-K.; Kang, G.-C.; Moon, J.-P.; Lee, T.-S.; Oh, S.-S. Estimation of thermal performance and heat loss in plastic greenhouses with and without thermal curtains. Energies 2018, 11, 578. [Google Scholar] [CrossRef] [Green Version]
  8. Kittas, C.; Katsoulas, N.; Baille, A. Influence of an aluminized thermal screen on greenhouse microclimate and canopy energy balance. Trans. ASAE 2003, 46, 1653–1663. [Google Scholar] [CrossRef]
  9. Geoola, F.; Kashti, Y.; Levi, A.; Brickman, R. A study of the overall heat transfer coefficient of greenhouse cladding materials with thermal screens using the hot box method. Polym. Test. 2009, 28, 470–474. [Google Scholar] [CrossRef]
  10. Rasheed, A.; Lee, J.W.; Lee, H.W. Evaluation of overall heat transfer coefficient of different greenhouse thermal screens using building energy simulation. Prot. Hortic. Plant Fact. 2018, 27, 294–301. [Google Scholar] [CrossRef]
  11. Gupta, M.J.; Chandra, P. Effect of greenhouse design parameters on conservation of energy for greenhouse environmental control. Energy 2002, 27, 777–794. [Google Scholar] [CrossRef]
  12. Gupta, R.; Tiwari, G.; Kumar, A.; Gupta, Y. Calculation of total solar fraction for different orientation of greenhouse using 3d-shadow analysis in auto-cad. Energy Build. 2012, 47, 27–34. [Google Scholar] [CrossRef]
  13. Sethi, V.P. On the selection of shape and orientation of a greenhouse: Thermal modeling and experimental validation. Sol. Energy 2009, 83, 21–38. [Google Scholar] [CrossRef]
  14. Rasheed, A.; Lee, J.; Lee, H. Development and optimization of a building energy simulation model to study the effect of greenhouse design parameters. Energies 2018, 11, 2001. [Google Scholar] [CrossRef] [Green Version]
  15. Kwon, S.-H.; Jung, S.-W.; Kwon, S.-G.; Park, J.-M.; Choi, W.-S.; Kim, J.-S. Comparative study on efficiencies of naturally-ventilated multi-span greenhouses in korea. J. Korean Soc. Ind. Converg. 2017, 20, 8–18. [Google Scholar] [CrossRef]
  16. Lee, I.-B.; Short, T.H. Two-dimensional numerical simulation of natural ventilation in a multi-span greenhouse. Trans. ASAE 2000, 43, 757. [Google Scholar]
  17. Short, T.H. Analysis of the efficiency of natural ventilation in a multi-span greenhouse using cfd simulation. Prot. Hortic. Plant Fact. 1999, 8, 9–18. [Google Scholar]
  18. Baeza, E.; Pérez-Parra, J.; Montero, J. Effect of ventilator size on natural ventilation in parral greenhouse by means of cfd simulations. In Proceedings of the International Conference on Sustainable Greenhouse Systems-Greensys2004, Leuven, Belgium, 12–16 September 2004; pp. 465–472. [Google Scholar]
  19. Villagrán, E.A.; Baeza Romero, E.J.; Bojacá, C.R. Transient cfd analysis of the natural ventilation of three types of greenhouses used for agricultural production in a tropical mountain climate. Biosyst. Eng. 2019, 188, 288–304. [Google Scholar] [CrossRef]
  20. Kim, R.-W.; Hong, S.-W.; Lee, I.-B.; Kwon, K.-S. Evaluation of wind pressure acting on multi-span greenhouses using cfd technique, part 2: Application of the cfd model. Biosyst. Eng. 2017, 164, 257–280. [Google Scholar] [CrossRef]
  21. Bronkhorst, A.J.; Geurts, C.P.W.; van Bentum, C.A.; van der Knaap, L.P.M.; Pertermann, I. Wind loads for stability design of large multi-span duo-pitch greenhouses. Front. Built Environ. 2017, 3, 18. [Google Scholar] [CrossRef] [Green Version]
  22. Kim, R.-W.; Lee, I.-B.; Kwon, K.-S. Evaluation of wind pressure acting on multi-span greenhouses using cfd technique, part 1: Development of the cfd model. Biosyst. Eng. 2017, 164, 235–256. [Google Scholar] [CrossRef]
  23. Ahamed, M.S.; Guo, H.; Tanino, K. Energy saving techniques for reducing the heating cost of conventional greenhouses. Biosyst. Eng. 2019, 178, 9–33. [Google Scholar] [CrossRef]
  24. López-Cruz, I.; Fitz-Rodríguez, E.; Salazar-Moreno, R.; Rojano-Aguilar, A.; Kacira, M. Development and analysis of dynamical mathematical models of greenhouse climate: A review. Eur. J. Hortic. Sci. 2018, 83, 269–279. [Google Scholar] [CrossRef]
  25. Ahamed, M.S.; Guo, H.; Taylor, L.; Tanino, K. Heating demand and economic feasibility analysis for year-round vegetable production in canadian prairies greenhouses. Inf. Process. Agric. 2019, 6, 81–90. [Google Scholar] [CrossRef]
  26. Ahamed, M.S.; Guo, H.; Tanino, K. A quasi-steady state model for predicting the heating requirements of conventional greenhouses in cold regions. Inf. Process. Agric. 2018, 5, 33–46. [Google Scholar] [CrossRef]
  27. Ahamed, M.S.; Guo, H.; Tanino, K. Development of a thermal model for simulation of supplemental heating requirements in chinese-style solar greenhouses. Comput. Electron. Agric. 2018, 150, 235–244. [Google Scholar] [CrossRef]
  28. Ahamed, M.S.; Guo, H.; Tanino, K. Energy-efficient design of greenhouse for canadian prairies using a heating simulation model. Int. J. Energy Res. 2018, 42, 2263–2272. [Google Scholar] [CrossRef]
  29. Lee, M.; Lee, I.-B.; Ha, T.-H.; Kim, R.-W.; Yeo, U.-H.; Lee, S.-Y.; Park, G.; Kim, J.-G.; Factory, P. Estimation on heating and cooling loads for a multi-span greenhouse and performance analysis of pv system using building energy simulation. Prot. Hortic. Plant Fact. 2017, 26, 258–267. [Google Scholar] [CrossRef]
  30. Rasheed, A.; Lee, J.W.; Lee, H.W. A review of greenhouse energy management by using building energy simulation. Prot. Hortic. Plant Fact. 2015, 24, 317–325. [Google Scholar] [CrossRef]
  31. Seo, I.-H.; Lee, I.-B.; Kwon, K.-S.; Park, S.-J.J.A.H. Bes computation for periodical energy load of greenhouse with geothermal heating system. Acta Hortic. 2014, 1037, 113–118. [Google Scholar]
  32. Chargui, R.; Sammouda, H.; Farhat, A. Geothermal heat pump in heating mode: Modeling and simulation on trnsys. Int. J. Refrig. 2012, 35, 1824–1832. [Google Scholar] [CrossRef]
  33. Klein, S.A. Trnsys, a Transient System Simulation Program; Solar Energy Laborataory, University of Wisconsin: Madison, WI, USA, 2012. [Google Scholar]
  34. Choab, N.; Allouhi, A.; El Maakoul, A.; Kousksou, T.; Saadeddine, S.; Jamil, A. Review on greenhouse microclimate and application: Design parameters, thermal modeling and simulation, climate controlling technologies. Sol. Energy 2019, 191, 109–137. [Google Scholar] [CrossRef]
  35. Baglivo, C.; Mazzeo, D.; Panico, S.; Bonuso, S.; Matera, N.; Congedo, P.M.; Oliveti, G. Complete greenhouse dynamic simulation tool to assess the crop thermal well-being and energy needs. Appl. Therm. Eng. 2020, 179, 115698. [Google Scholar] [CrossRef]
  36. Watts, D.; Jara, D. Statistical analysis of wind energy in chile. Renew. Energy 2011, 36, 1603–1613. [Google Scholar] [CrossRef]
  37. Valera, M.D.; Molina, A.F.; Alvarez, M.A. Protocolo de Auditoría Energética en Invernaderos. Auditoría Energética de un Invernadero para Cultivo de flor Cortada en Mendigorría; Instituto para la diversificacion y ahorro de la energia: Madrid, Spain, 2008. [Google Scholar]
  38. Rasheed, A.; Na, W.H.; Lee, J.W.; Kim, H.T.; Lee, H.W. Optimization of greenhouse thermal screens for maximized energy conservation. Energies 2019, 12, 3592. [Google Scholar] [CrossRef] [Green Version]
  39. Rafiq, A.; Na, W.H.; Rasheed, A.; Kim, H.T.; Lee, H.W.; Factory, P. Determination of thermal radiation emissivity and absorptivity of thermal screens for greenhouse. Prot. Hortic. Plant Fact. 2019, 28, 311–321. [Google Scholar] [CrossRef]
  40. Lee, H.-W.; Kim, Y.-S.; Sim, S.-Y.; Lee, J.-W.; Factory, P. Variation of vapor pressure deficit and condensation flux of air heating plastic greenhouse installed with two layers thermal curtain in winter. Prot. Hortic. Plant Fact. 2013, 22, 35–41. [Google Scholar] [CrossRef]
  41. Elings, A.; Kempkes, F.; Kaarsemaker, R.; Ruijs, M.; Van de Braak, N.; Dueck, T. The energy balance and energy-saving measures in greenhouse tomato cultivation. In Proceedings of the International Conference on Sustainable Greenhouse Systems-Greensys2004, Leuven, Belgium, 12–16 September 2004; pp. 67–74. [Google Scholar]
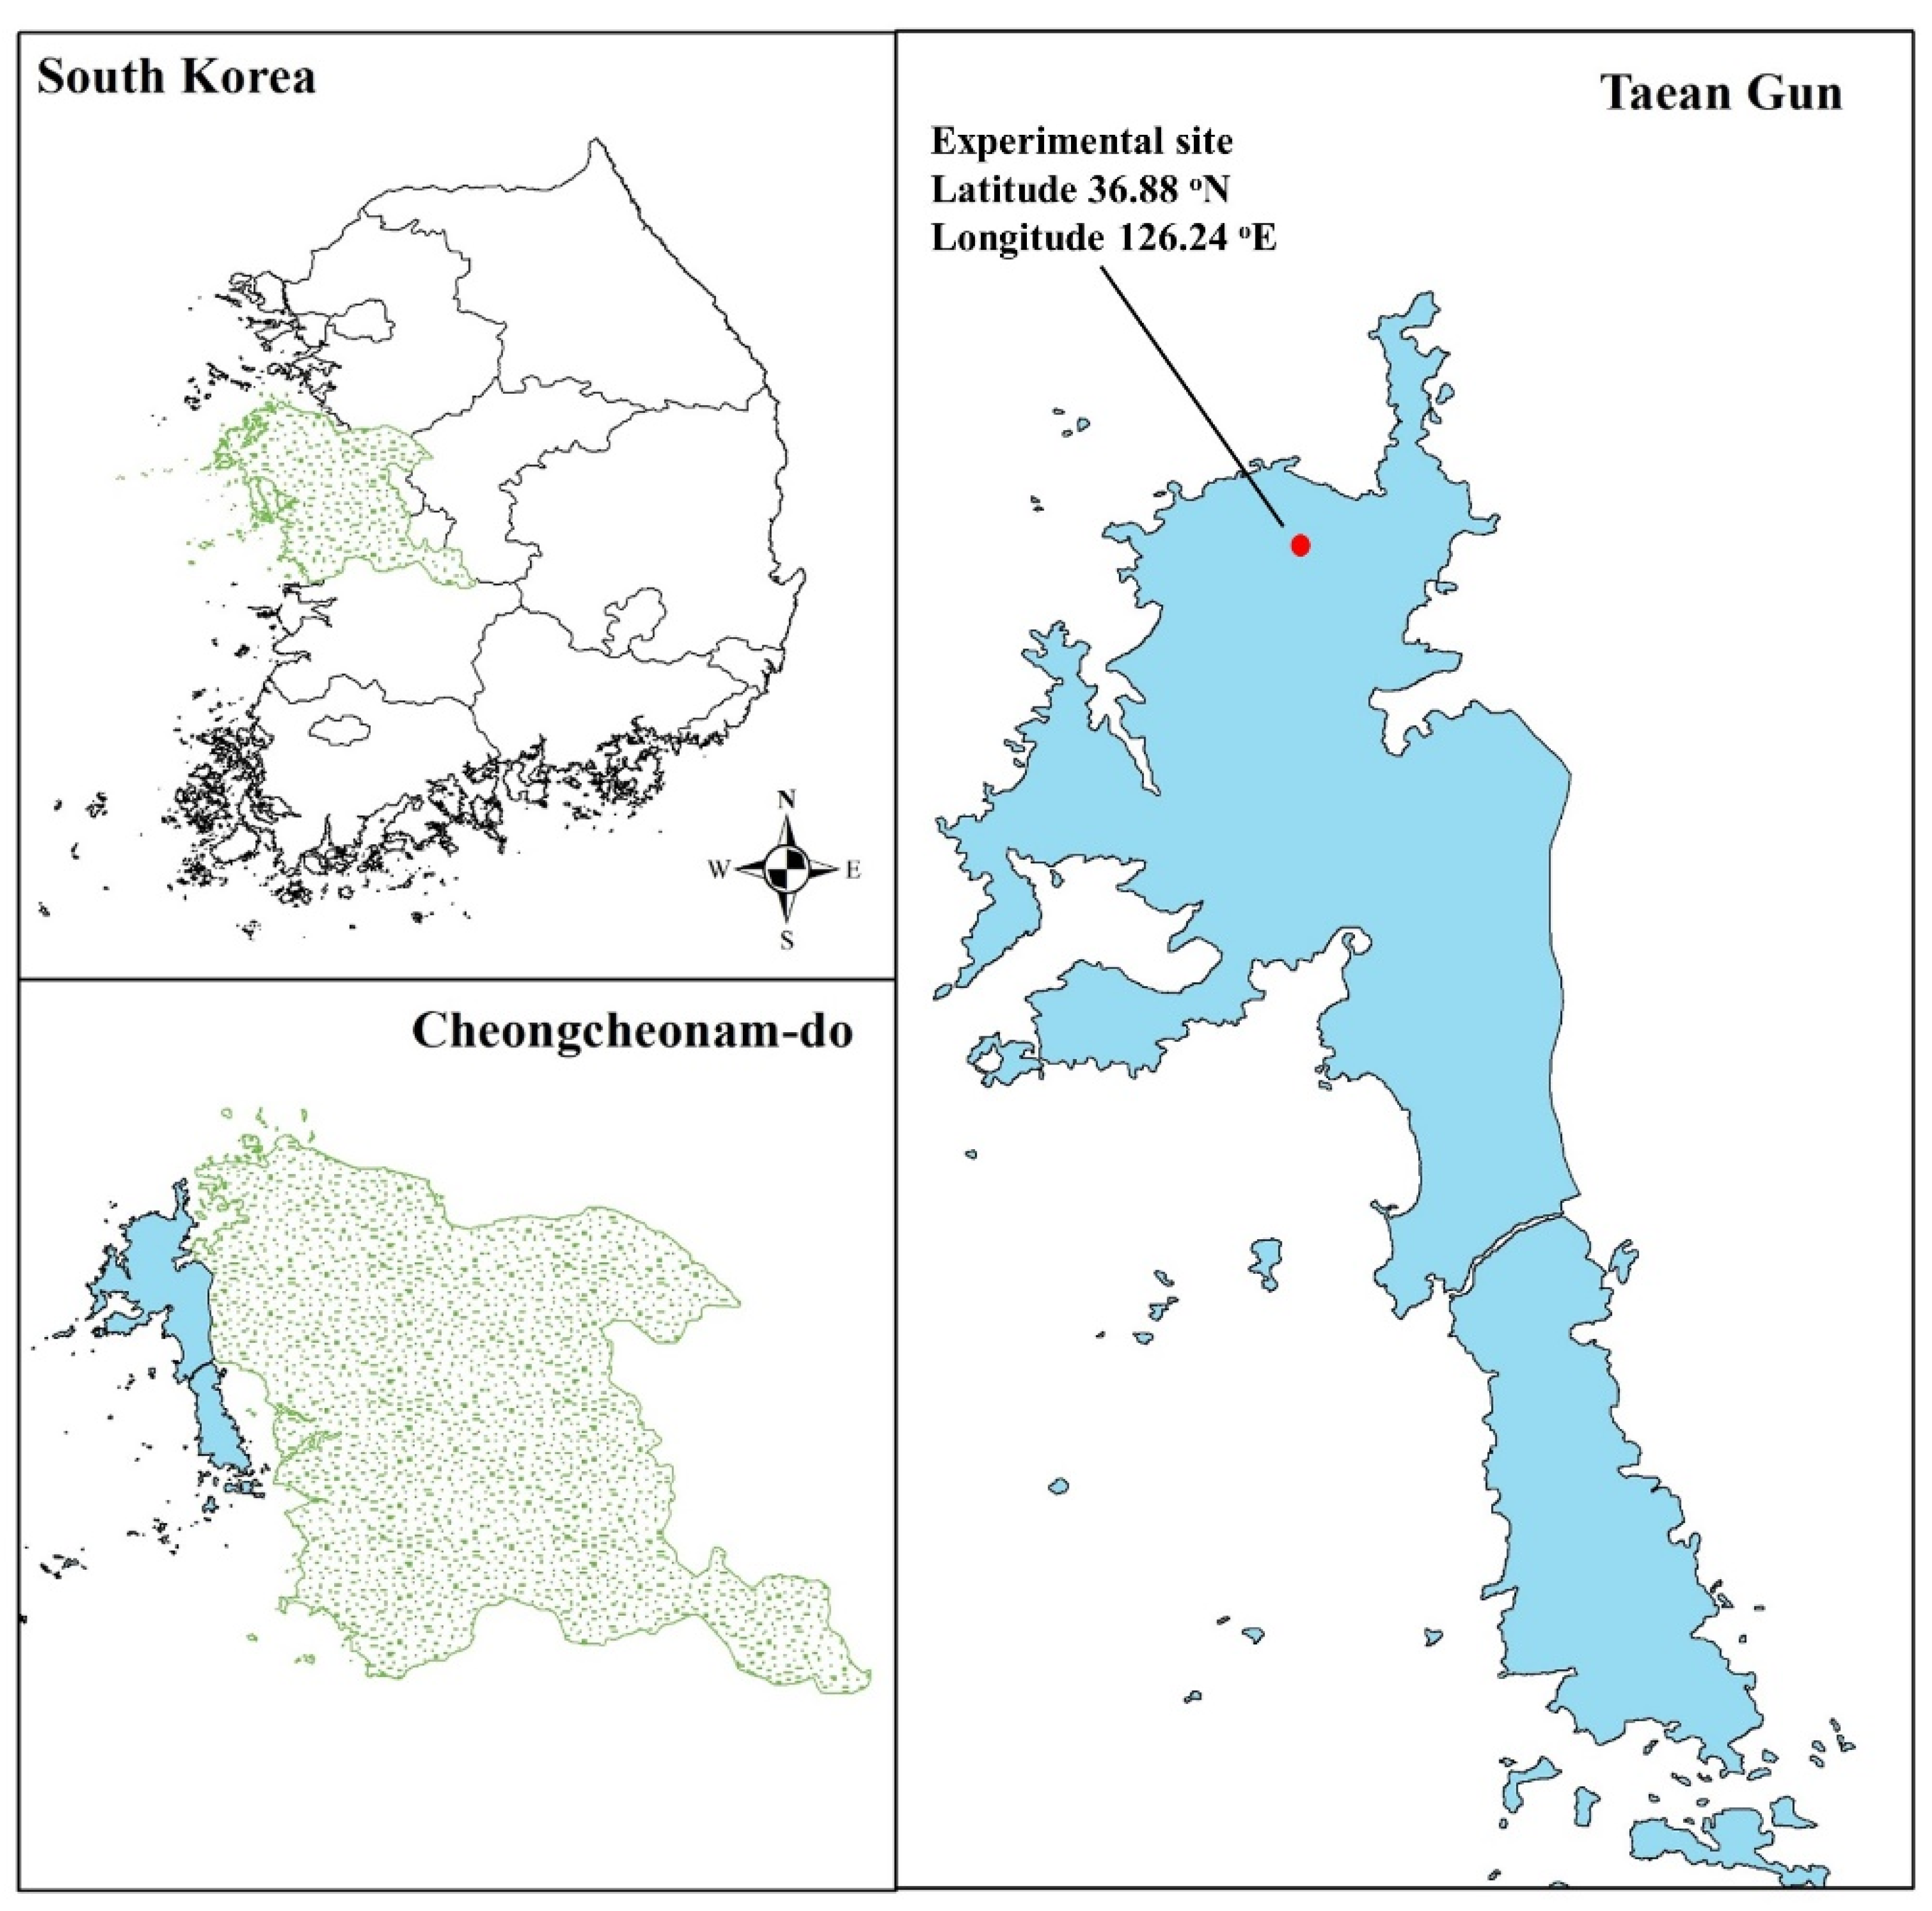
Figure 1. Geographic location of experimental greenhouse site.
Agronomy 10 01236 g001
Figure 2. Experimental greenhouse at Taean Gun (latitude 36.88° N, longitude 126.24° E): (a) exterior view and (b) interior view.
Agronomy 10 01236 g002
Figure 3. Greenhouse dimensions and positions of sensors in the experimental greenhouse: (a) vertical view and (b) horizontal view. (PC) Polycarbonate, (HG) Horticulture Glass, (Ph_77) Shading screen 1, (Ph_Super) Thermal screen 2.
Agronomy 10 01236 g003aAgronomy 10 01236 g003b
Figure 4. Temperature and solar radiation outside the greenhouse from January to December 2019.
Agronomy 10 01236 g004
Figure 5. Schematic diagram of the setup to measure used screen’s radiometric properties.
Agronomy 10 01236 g005
Figure 6. Flow diagram of multi-span greenhouse building energy simulation (BES) model.
Agronomy 10 01236 g006
Figure 7. Three-dimensional (3-D) model of the studied multi-span greenhouse using Transys3d.
Agronomy 10 01236 g007
Figure 8. TRNSYS simulation studio multi-span greenhouse model.
Agronomy 10 01236 g008
Figure 9. Computed versus measured internal air temperature of the greenhouse for validation. (a) summer conditions (b) winter conditions.
Agronomy 10 01236 g009aAgronomy 10 01236 g009b
Figure 10. Internal air temperature of a greenhouse: (a) single screen, (b) double screen, and (c) triple screen.
Agronomy 10 01236 g010aAgronomy 10 01236 g010b
Figure 11. Monthly heating load of a greenhouse without a screen and with single, double, and triple screens.
Agronomy 10 01236 g011
Figure 12. Maximum annual heating load of a greenhouse without a screen and with single, double, and triple screens.
Agronomy 10 01236 g012
Figure 13. Monthly heating load of greenhouse using different thermal screens.
Agronomy 10 01236 g013
Figure 14. Monthly day- and nighttime heating setpoint effects on the heating load of the greenhouse.
Agronomy 10 01236 g014
Table 1. Weather data variables used in the simulations.
Weather ParameterUnitTime IntervalSensorPrecision of SensorData Recorded
Temperature°C1 minIC, SHT75, SENSIRION±0.3 °CField recorded
Relative humidity%1 minIC, SHT75, SENSIRION±1.8%Field recorded
Solar radiationWm−210 minML-01C, Technox Inc±2%Field recorded
Wind speedm s−110 minModel_Vantage Pro 2 6152CEU (Davis)±5%Field recorded
Wind directiondegree 10 minModel_Vantage Pro 2 6152CEU (Davis)±5%Field recorded
Ambient pressurehPa10 minPTB-220TS, VAISALA±0.15 hPaKMA
Table 2. Physical and thermal properties of the greenhouse coverings and thermal screens.
Cover CharacteristicsGreenhouse Materials
PCHGPh_77Ph_Super
Solar transmittance front0.780.890.170.66
Solar transmittance back0.780.890.170.66
Solar reflectance front0.140.080.590.29
Solar reflectance back0.140.080.510.29
Visible radiation transmittance front0.750.910.170.66
Visible radiation transmittance back0.750.910.170.66
Visible radiation reflectance front0.150.080.590.29
Visible radiation reflectance back0.150.080.510.29
Thermal radiation transmittance0.020.10.200.38
Thermal radiation emission front0.890.900.380.60
Thermal radiation emission back0.890.900.480.60
Conductivity (W m−1 K−1)0.1900.760.590.08
Thickness (mm)1640.40.3
(PC) Polycarbonate, (HG) Horticulture Glass, (Ph_77) Shading screen name, (Ph_Super) Thermal screen name.
Table 3. Long-wave radiation properties of the thermal screens.
Screen TypesThickness (mm)Conductivity
(W·m1·K1)
Transmittance (—)Reflectance (—)Emittance (—)
Polyester0.40.05100.020.040.94
Luxous13470.220.04630.380.180.44
Tempa 86720.250.21330.010.320.67
Table 4. Components of the greenhouse model in TRNSYS 18.
ComponentTypeDescription
Weather data reader9Process outside weather data to simulate real outside weather
Solar radiation processor16eProcess the total direct solar radiation on a horizontal surface provided by a weather data reader as input to calculate, beam, reflected, and diffuse radiation on all greenhouse surfaces
Psychrometric chart33Use dry bulk temperature and humidity ration and calculate dew point temperature
Sky temperature calculator69bCalculate sky temperature by using dew point, dry bulk, temperature, beam, and diffuse radiation
Equation editor This type was used to insert an equation.
Greenhouse building model56-TRNFlow
  • This type uses TRNBuild to process a physical greenhouse 3D model.
  • All used materials properties and boundary conditions of the real greenhouse construction
  • Process heat transfer equations process convection, conduction, and radiation
  • TRNFlow calculates natural ventilation airflow incorporation with the thermal model.
Controller165This type is used to control signals for deployed and retracted screens and for opening and closing of vents for natural ventilation.
Monthly Function Scheduler518This type gives daily and monthly control signals to the controller.
Printer25dThis type was used to print results on the external file.
Plotter65cThis type was used to plot the results in an online plotter.
Table 5. Summary of reference greenhouse.
ParameterCondition (a)Condition (b)
Greenhouse typeMulti-spanMulti-span
No. of span1515
Roof typeVenloVenlo
Roof GlazingHG-4mmHG-4mm
Side GlazingPC-16mmPC-16mm
Dimension120 m × 63 m × 7.5 m120 m × 63 m × 7.5 m
Floor area7560 m27560 m2
OrientationNorth-SouthNorth-South
PeriodAugust 20–29, 2019Dec 1–10, 2019
ScreenShading (Ph-77)Ph-77, Ph-Super
Screen controlSunrise: 10:30 AMPh-77 retract
(After sunrise, OR Temp 10, OR S.R 100W)
Ph-77 Deploy
(After sunset, OR Temp 12, AND S.R 100W
Ph-Super_1 retract
(After sunrise, OR Temp 5, OR S.R 50W)
Ph-Super_1 deploy
(After sunset, OR Temp 12, AND S.R 50W
Ph-Super_2 retract
(After sunrise, OR Temp 12, OR S.R 150W)
Ph-Super_2 deploy
(After sunset, OR Temp 14, AND S.R 150W
Natural ventilationRoof vents Roof vents
Natural vents control set point temperature18 °C (00:00–04:00)
20 °C (04:00–10:00)
26 °C (10:00–18:00)
18 °C (18:00–240:00)
18 °C (00:00–05:30)
19 °C (05:30–16:15)
15 °C (16:15–21:30)
18 °C (21:30–24:00)
HeatingNo17 °C (00:00–16:15)
15 °C (16:15–21:30)
17 °C (21:30–24:00)
a—validation condition 1, b—validation condition 2.
Table 6. Detail of Figure 13.
123456
Ph-77 + Ph-SuperPh-77 + LuxousPh-77 + PolyesterTempa + Ph-SuperTempa + LuxousTempa + Polyester
Table 7. Detail of temperature control used in Figure 14.
Day and Night Temperature Control
TimeNovDecJan–Mar
(00:00–16:15)18 °C17 °C17 °C
(16:15–21:30)15 °C15 °C14 °C
(21:30–24:00)18 °C17 °C17 °C
Fixed Temperature Control
(00:00–24:00)18 °C18 °C18 °C