Article

Cotton Genotypic Variability for Transpiration Decrease with Progressive Soil Drying

by
Mura Jyostna Devi
* and
Vangimalla Reddy
USDA-ARS-NEA, Adaptive Cropping Systems Laboratory, Beltsville Agriculture Research Center, USDA-ARS, 10300 Baltimore Avenue, Bldg 001, Rm 342, BARC-W, Beltsville, MA 20705, USA
*
Author to whom correspondence should be addressed.
Agronomy 2020, 10(9), 1290; https://doi.org/10.3390/agronomy10091290
Submission received: 23 May 2020 / Revised: 20 August 2020 / Accepted: 26 August 2020 / Published: 31 August 2020

Abstract

:
Drought is a major abiotic stress factor limiting cotton yield. It is important to identify the genotypes that can conserve water under drought stress conditions and improve yield. The objective of the current study was to evaluate cotton genotypes for water conservation traits, i.e., high FTSW (Fraction of Transpirable Soil Water) threshold for transpiration. Plants utilize water slowly by declining transpiration at high FTSW and conserving soil water, which can be used by the plant later in the growing season to improve yield. Fifteen cotton varieties were selected based on their differences in transpiration response to elevated vapor pressure deficit (VPD) to study drought responses. Two pot experiments were carried out in the greenhouse to determine the FTSW threshold for the transpiration rate as the soil dried. A significant variation (p < 0.01) in the FTSW threshold values for transpiration decline was observed, ranging from 0.35 to 0.60 among cotton cultivars. Genotypes with high FTSW thresholds also displayed low transpiration under well-watered conditions. Further studies with four selected genotype contrasts in FTSW threshold values for transpiration showed differences (p < 0.05 to 0.001) in gas exchange parameters and water potentials. This study demonstrated that there are alternate traits among the cotton genotypes for enhancing soil water conservation to improve yield under water-limited conditions.

1. Introduction

The recent climate change investigations have reported an escalation in extreme weather events, such as droughts, floods, storms, and high temperatures, disrupting crop production. Drought is an extreme weather event and is one of the major constraints to the crop yield worldwide, including the United States [1,2]. Cotton is an important natural fiber used in the textile industry. Severe lint yield reductions in cotton due to drought stress has become a significant challenge for sustainable crop production under water-limited environments. Drought stress affects many plant physiological processes, causing plants to close their stomata to limit the transpiration rate, reducing carbon uptake, and decreasing yield [3].
Despite growing interest in developing drought-tolerant cultivars to water deficit, there are still many challenges to breeding and deploying such varieties [4,5]. Identifying a genotypic variation within a species for the drought-tolerant traits is necessary to enhance tolerance through selection and breeding [6]. Past efforts in improving germplasm for water-limited environments focused on specific traits for particular crops and drought conditions [7]. While these studies have given useful insights into the potential effects of drought, they are based primarily on deterministic methods reporting yield losses. Despite extensive studies on plant sensitivity to drought stress, less attention has been paid to plant traits that conserve water under water-limited conditions [8].
Recently, some studies have focused on the plant traits resulting in soil water conservation early in the growing season so that the effects of soil water deficits later in the growing season can be evaded. These traits include limiting the transpiration rate under high vapor pressure deficit (VPD) and restricting the transpiration rate early in the soil-drying cycle [8]. In cotton, we have previously shown variations in transpiration rate limitations under high atmospheric VPD [9]. There was a significant difference between genotypes that expressed no limitation in the transpiration rate and that restricted transpiration as atmospheric VPD increased for their gas exchange and stomatal properties. Other water conservation trait restrictions in the transpiration rate early in the soil-drying cycle have not been studied in cotton [9].
Ritchie [
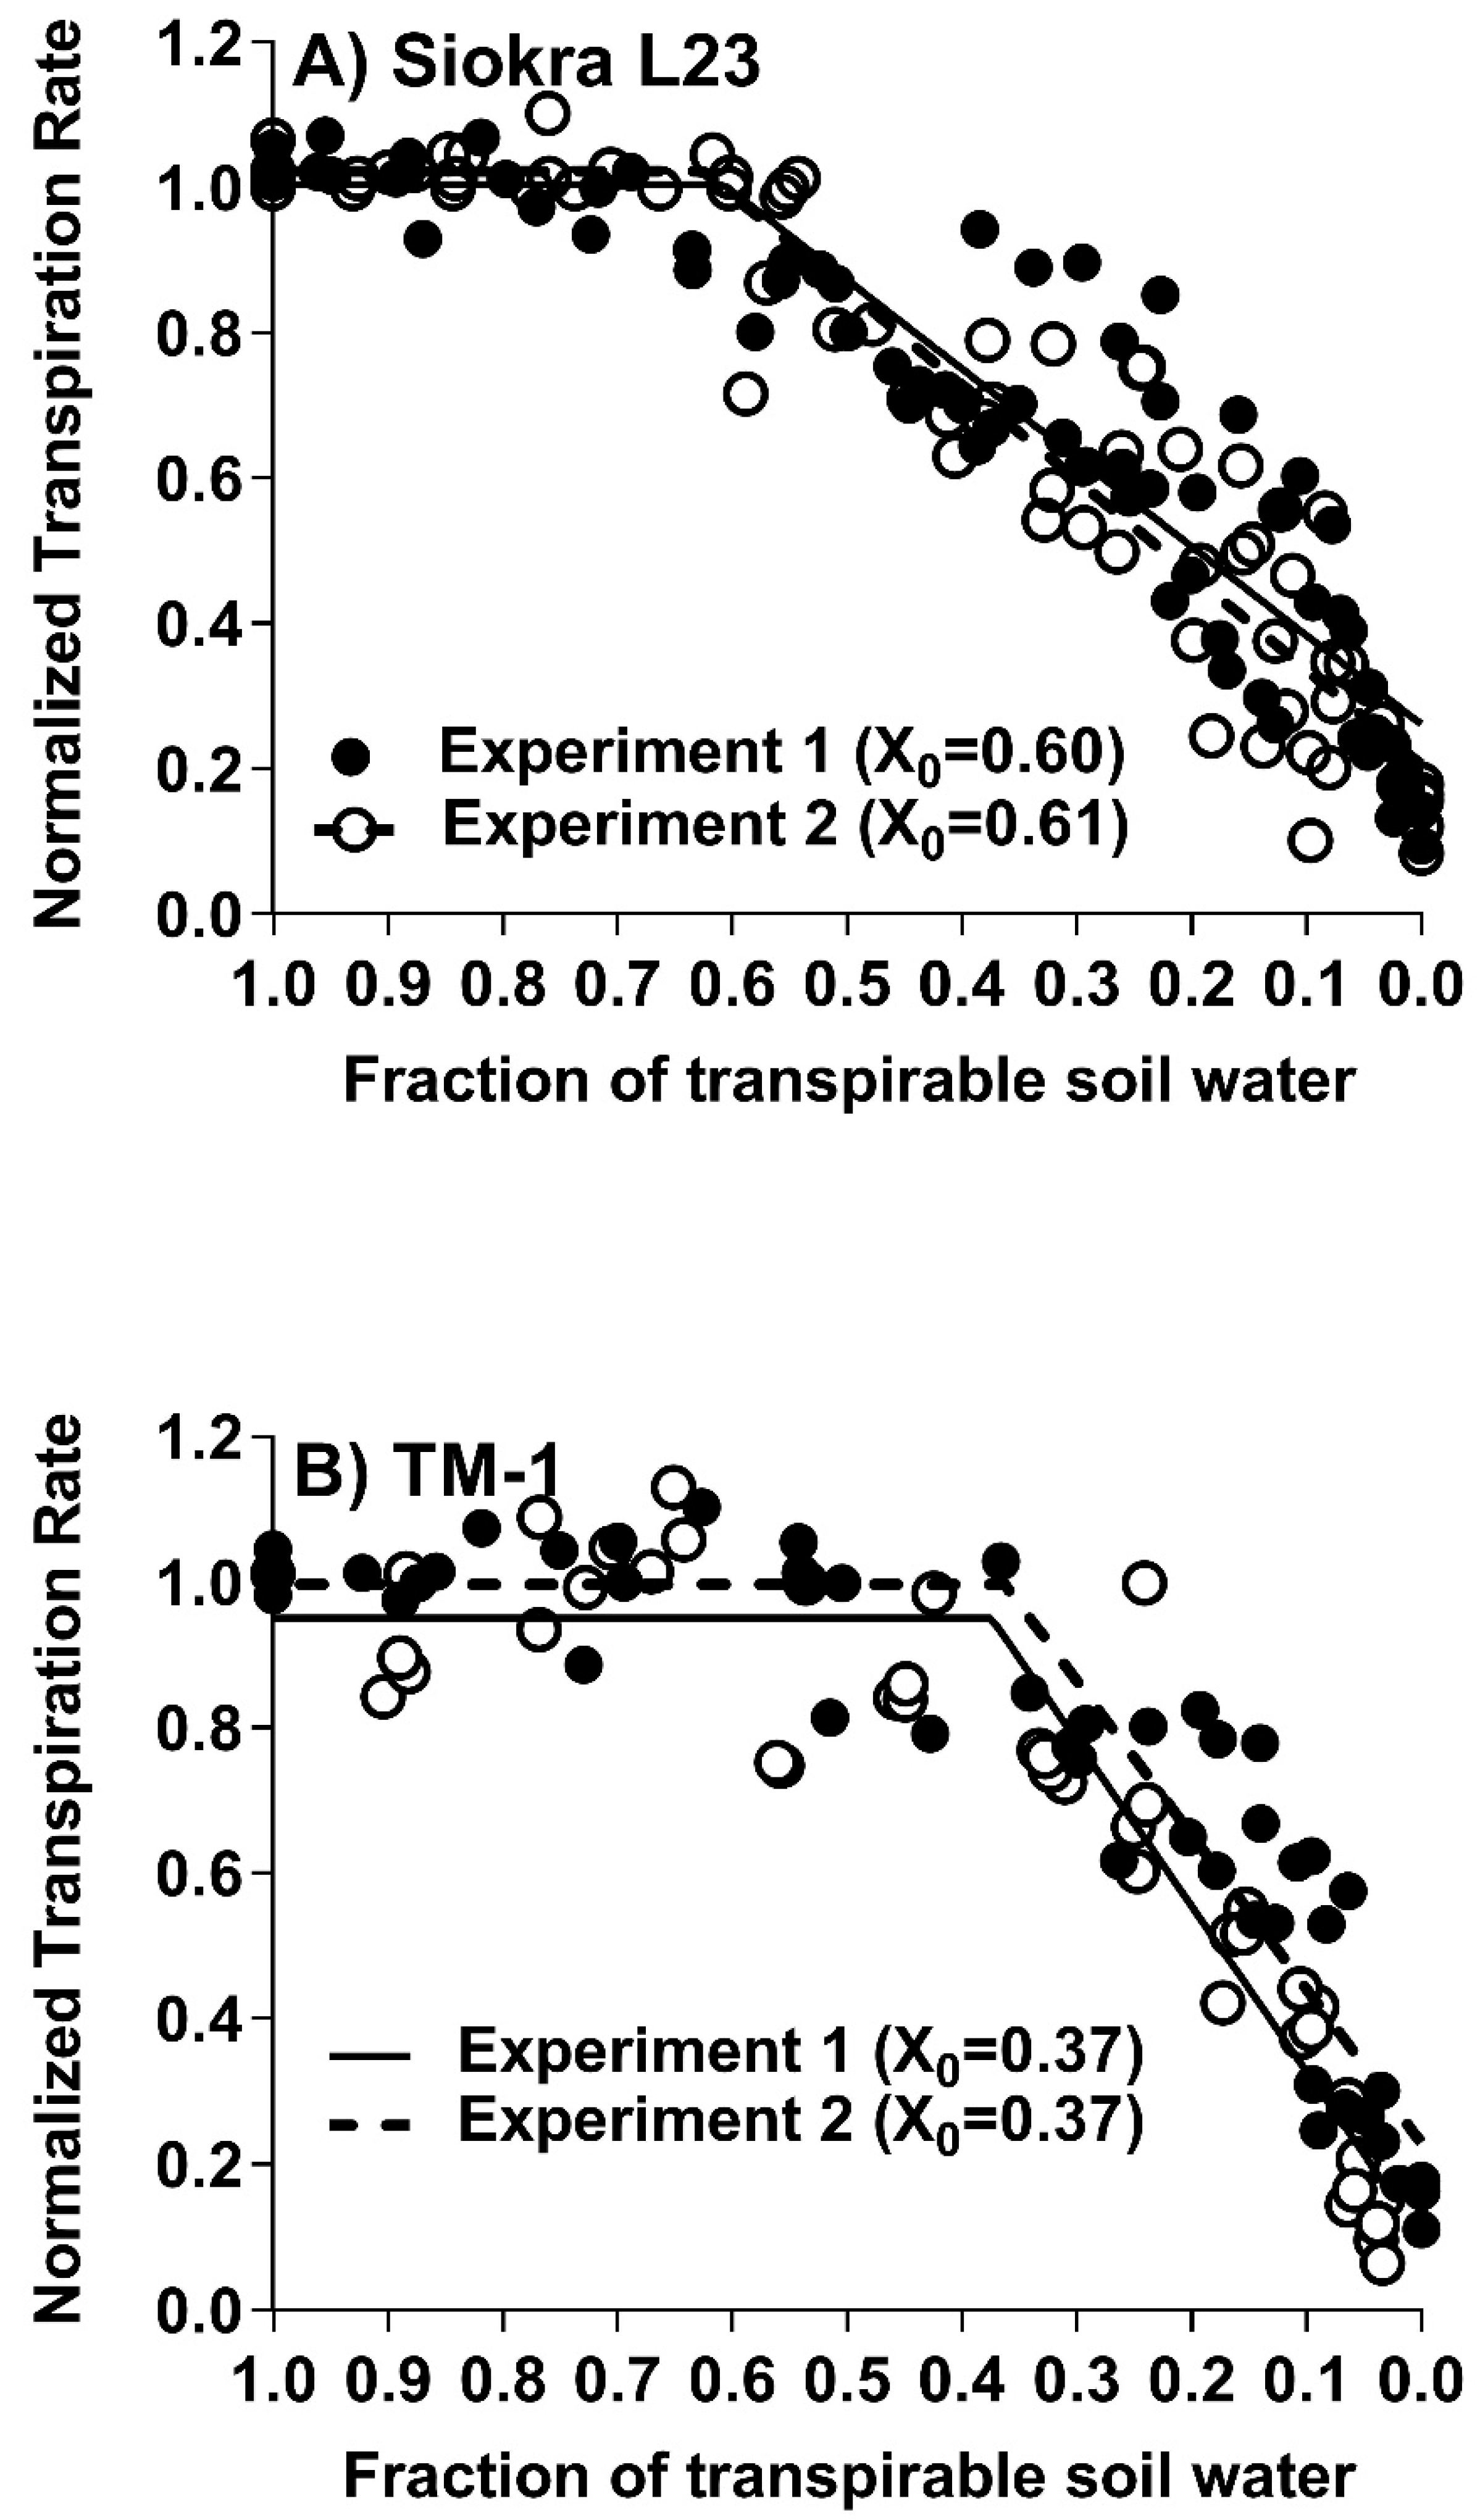
10] proposed that a conservative approach to describe crop responses to soil drying was to express the transpiration rate as a function of the extractable soil water content, i.e., FTSW (Fraction of Transpirable Soil Water). The plant undergoes three phases of response: phase 1—abundant soil water, and the plant continues its transpiration without any limitation, phase 2—soil water eventually dries and reaches 1/3 FTSW, where the plant begins to decline its transpiration rate, and phase 3—survival phase, where the stomatal closure allows very low amounts of water loss. Until recently, there was little evidence of genetic variation in the threshold soil water content at which the reduction in the transpiration rate was initiated. Sadras and Milroy [11] summarized reports on the plant transpiration responses to soil drying for several crop species. In nearly all cases, transpiration rates began declining when the fraction of available soil water reached 0.25 to 0.40. Once the available soil water content reached these thresholds, the transpiration rate declined linearly with the further reduced soil water content.
The latest reports have shown that genetic variation in the transpiration response to drying soil does occur within some crop species, such as soybean, maize, peanut, and sorghum [12]. These studies identified variations in the FTSW-threshold values, where the plant begins to decline its transpiration rate. However, there are no studies to identify the genetic variations for transpiration threshold values of the fraction of transportable soil water in cotton. Hence, the objective of the current study was to explore the possible variations in the FTSW threshold for the transpiration rate in cotton cultivars under drought stress. The FTSW threshold values for transpiration were estimated by subjecting cotton cultivars to progressive soil-drying conditions. This allowed us to identify cotton cultivars with water conservation ability under drought stress conditions. The other objective of the study was to examine the gas exchange response of selected cotton genotypes to progressive soil drying, along with the FTSW threshold for transpiration. The plants were sampled periodically to explore the water potential differences to understand the physiological mechanisms to drought in cotton.

2. Materials and Methods

2.1. Dry-Down Experiment

The dry-down study was conducted with fifteen cotton cultivars that were selected based on the results observed by Devi and Reddy [9] for transpiration responses to increasing the VPD. Some of the cultivars exhibited limited transpiration to increasing the VPD, and some showed a continuous increase in their transpiration rate (Table 1). Experiments to study the cotton response to progressive soil drying were conducted in a controlled environment growth facility at the Beltsville Agricultural Research Center, Beltsville, MD, USA. Two experiments were conducted: experiment 1, including fifteen genotypes, and experiment 2, with four selected genotypes. Cotton plants were grown in 16.51-cm-diameter and 15.87-cm-deep plastic pots filled with soil within 2 cm of the top of the pots. This allowed us to cover the soil surface of the pot with aluminum foil to prevent evaporation. The soil was weighed, and equal amounts of soil were added to all pots. Ten pots filled with 1:1 soil and vermiculite mix were sown for each of the 15 genotypes in the greenhouse with three seeds. The pots were thinned down to one plant after ten days of planting. The average day and night temperatures maintained in the greenhouse were 28 °C and 24 °C, respectively. The experiments were conducted in June, July, and August of 2018. The pots were well-watered until the experiments were conducted. The drought experiments subjecting the plants to progressive drying were performed using the protocol originally described by Sinclair and Ludlow [13]. On day 30, after sowing, the pots were saturated with water and allowed to drain overnight. The following morning, the soil surface of each pot was covered with an aluminum foil firmly around the stem’s base to prevent evaporation. Each pot was weighed after covering the soil surface, and the weight was recorded as the initial pot weight. Thereafter, pots were weighed every day between 14:00 and 15:00 h (EST) [14].
Four pots of each genotype were selected to be well-watered control plants and six as drought-stressed based on first-day transpiration. First-day transpiration was calculated as the difference between initial pot weight and the weight recorded at 14:00 h on the same day. Different sizes of well-watered plants from each genotype were selected to ensure proper normalization of drought stress transpiration. This was achieved by choosing control plants based on their first-day transpiration from groups with the highest, middle, and lowest transpiration rates. The well-watered plants of each genotype were maintained at 100 g below the initial pot weight to avoid soil saturation and maintained at field capacity. The amount of water added to control plants was calculated as their daily transpiration minus 100 g. The soil in the six-remaining drought-stressed pots was allowed to dry. To avoid rapid dehydration of the soil and extend the drying cycle, water was added to the drought-stressed pots as needed to limit the maximum daily net water decrease to 50 g.
The transpiration of all pots on each day was calculated as the difference between the weights of consecutive days. The daily transpiration rate (TR) of each drought-stressed plant was calculated as the ratio of transpiration and the average transpiration of four well-watered plants of that particular genotype. This allowed the minimization of the large day-to-day environmental variations among the replicates in each genotype.
Transpiration   rate   ( T R )   of   drought   stress   plant   =   T r a n s p i r a t i o n   o f   d r o u g h t   s t r e s s   p l a n t A v e r a g e   t r a n s p i r a t i o n   o f   w e l l w a t e r e d   p l a n t s
Normalization of each drought-stressed plant was performed so that the normalized transpiration ratios were centered to 1.0 based on the average TR of the initial first three days of the experiment before water stress developed. This allowed the easy comparison among the genotypes and minimized the variations among replicates within the genotype due to plant size [14].
Normalized   transpiration   Ratio   ( N T R )   =   D a i l y   T R A v e r a g e   T R   o f   f i r s t   t h r e e   d a y s
The dry-down experiment continued until the NTR of a pot reached 0.1. The average number of days to reach NTR 0.1 was 14.26 ± 0.20. The difference between the initial weight and the final weight was the total transpirable soil water in each pot. The FTSW was calculated for each day based on daily measurements of the pot weight.
F r a c t i o n   o f   t r a n s p i r a b l e   s o i l   w a t e r   ( F T S W ) = D a i l y   w e i g h t F i n a l   W e i g h t I n i t i a l   w e i g h t F i n a l   W e i g h t
The FTSW threshold for each drought-stressed plant was measured by plotting daily NTR data against FTSW. The data was analyzed using a two-segment linear regression analysis of Graph Prism 5.0 (GraphPad Software Inc., San Diego, CA, USA) to obtain the FTSW threshold values for a decrease in transpiration as the soil dried. A repetition of the dry-down experiment, experiment 2 with four selected cotton cultivars based on their FTSW threshold, was conducted. The experimental procedure was the same as described above.

2.2. Leaf Gas Exchange and Water Potential

Based on the first experiment results, two genotypes with high FTSW thresholds for transpiration and two with low FTSW-threshold values were selected to measure the leaf gas exchange parameters in experiment 2. The four genotypes chosen for the study were (1) DeRidder Red and TM-1 with low FTSW-threshold values and (2) Siokra L23 and 12-8-103S with high FTSW-threshold values for transpiration. The procedure of the dry-down experiment was similar, as explained above. An additional three drought-stressed plants/genotypes were included in experiment 2 to measure the leaf water potential.
The gas exchange parameters were measured on a fully developed youngest leaf at the start of the experiment. The measurements were made at three different FTSWs of approximately 1, ~0.6, and ~0.4. The days to reach the endpoint (NTR 0.1) were different for four genotypes ranging from 13 to 15 days (Table 1). Measurements were therefore made on the days when plants reached FTSWs 0.6 and 0.4. The days to reach particular FTSW values were estimated based on experiment 1 data. Net photosynthetic rate per unit leaf area (A) and stomatal conductance (gs) was measured using a 2-cm X 3-cm chamber connected to a portable photosynthesis system (LI-6400, Li-Cor, Inc., Lincoln, NE, USA). The Li-Cor leaf chamber temperature was matched to the greenhouse, and the CO2 level was maintained at 400 ppm to match ambient conditions. The light in the leaf chamber was set at 1000 μmol m−2 s−1. Gas exchange parameters were measured at around 10:00 h in the morning. Instantaneous water use efficiency was calculated as a ratio of photosynthesis and transpiration measured with Li-Cor.
Leaf water potential was measured at midday (10:30–12:30 h) using the youngest, fully expanded leaves in experiment 2. A Wescor psychrometer (Wescor, Inc., Logan, UT, USA) eight-channel water potential data loggers were used to measure the leaf water potential. The measurements were made at five different FTSW levels of 1, 0.8, 0.6, 0.4, and 0.2.
Photosynthesis, stomatal conductance, transpiration rate, water use efficiency, and water potential measurements were analyzed using Tukey’s Kramer statistical method.

3. Results

3.1. FTSW Threshold

The change in transpiration rate with progressive soil drying followed a two-segment linear regression for all genotypes (Figure 1 and Table 2 and Table 3). The correlation coefficient among all the fifteen cotton genotypes ranged from 0.86 to 0.97. As illustrated in Figure 1A, the cultivar Siokra L23 started reducing its transpiration at a higher threshold level of 0.56 to 0.60, which was similar in both the experiments for this genotype. However, in Figure 1B, cultivar TM-1 NTR remained constant at a value of 1.0 until a threshold was reached at 0.35 to 0.37; the NTR decreased linearly with further decreases in the FTSW. This overall pattern for the NTR response to soil drying was typical for most plants [11].
Significant differences (p < 0.001) in the FTSW-threshold values for the transpiration rate were observed among fifteen cotton cultivars, ranging from 0.35 to 0.60 (Table 2). The differences in the cotton genotypes for their FTSW threshold for transpiration under soil-drying conditions were similar to the differences in their VPD breakpoints for transpiration [7]. Out of the fifteen genotypes tested, seven genotypes had limited transpiration after VPD of approximately 2 kPa. The range of the FTSW threshold for the transpiration values obtained for these seven genotypes was between 0.45 to 0.60, with a mean value of 0.53 ± 0.02 S.E. The other genotypes displayed no limitations in their transpiration to the increased VPD and had FTSW-threshold values for the decrease in transpiration between 0.35 and 0.60, with a mean value of 0.47 ± 0.02 S.E. The difference in the means of the two groups was significant (p < 0.001). The genotypes with the high FTSW threshold are proposed to conserve water when the soil dries by closing stomata early (Table 2).
The total extracted water variability among the fifteen genotypes was not significant, indicating no difference in the plants’ total water extraction ability from soil (Table 1). However, the time duration to extract this water varied (p < 0.05) among genotypes, from 13.4 to 15.9 days (Table 1). The differences in extraction time were significantly associated with the differences in transpiration rate during the initial stage of the dry-down when the soil was still wet (Figure 2). The lower initial transpiration rate was associated with a longer duration of water extraction and to reach the endpoint (Figure 1 and Figure 2).

3.2. Gas Exchange and Water Potential

The four selected genotypes to study the gas exchange parameters and water potential were different for their FTSW threshold for the transpiration response to soil drying (Table 2 and Table 3 and Figure 1). The genotypes Siokra L23 and 12-8-103S had high FTSW-threshold values, and DeRidder Red and TM-1 had low FTSW-threshold values (Table 2 and Table 3). All four cotton genotypes studied exhibited limitations in the stomatal conductance (gs), photosynthesis (A), and water use efficiency (WUEileaf) at ~0.4 FTSW compared to FTSW 1 (p < 0.001) and ~0.6 (p < 0.05) (Figure 3). A significant decrease (p < 0.01) in stomatal conductance in genotypes with high FTSW thresholds at around ~0.6 FTSW than cultivars with low FTSW thresholds was evident in Figure 3. However, both types of cultivars showed a significant drop in their stomatal conductance at approximately 0.4 FTSW (p < 0.05). Drought-stressed plants of DeRidder Red and TM-1 displayed a lower percentage of gs at ~0.6 FTSW than cultivars with high FTSW thresholds.
All genotypes had significantly lower photosynthetic rates at FTSWs 0.6 (p < 0.05) and 0.4 (p < 0.05) than FTSW 1 (well-irrigated) (Figure 3). However, genotypes with higher FTSW-threshold values had a lower percentage of reduction in their photosynthesis, especially Siokra L23, compared to low FTSW-threshold genotypes. Due to their high A levels at low gs, these cultivars showed high instantaneous water use efficiency. Significant differences in the water potential among cultivars were not noticeable until plants reached FTSW 0.6 (p < 0.01) (Figure 4). All genotypes lowered their water potentials at FTSW ~ 0.6 (p < 0.01) and FTSW ~ 0.4 (p < 0.05); however, they were not significant at FTSW 1 and 0.8 (Figure 4).

4. Discussion

The current study identified genotypic differences among cotton cultivars for their transpiration response to progressive soil drying. In both experiments, there was a clear difference among cultivars in FTSW-threshold values; at the point where the plants started to decline, their transpiration ranged from 0.35 to 0.60. An association between the presence of limited transpiration response to an increasing VPD and high FTSW threshold was observed in some species. In studies with peanuts, soybeans, and maize, cultivars that expressed limited transpiration to increased VPD also started declining their transpiration at higher FTSWs [14,15,16]. However, in sorghum, an opposite response was observed where the genotypes with a low FTSW threshold had limited their transpiration rate at high VPD [12]. In the present study, some of the cotton genotypes with high FTSW thresholds also restricted their transpiration rates at high VPD, similar to peanuts and maize. However, the response was not consistent across genotypes. For example, some genotypes such as Siokra L23, CS 50, and 06-46-153P started declining their transpiration at high FTSW-threshold values, even though they had no restriction in their transpiration rates at high VPD (Table 2 and Table 3).
Plants require to modulate their water transport mechanisms in response to changes in soil water availability and increasing VPD. A constant and constitutive hydraulic conductance can limit water flow to the guard cells as the water potential gradient of the guard cells increases under drought conditions [17,18]. The possible hypothesis to explain stomatal closure differences in the present study is the limitation in hydraulic conductance. The differences in the hydraulic conductance and water flux were given as possible explanations for the observations in peanuts, maize, and sorghum [12,16,19]. In fact, Sinclair et al. [19] in soybeans and Choudhary and Sinclair [20] in sorghum found a link between water conservation and hydraulic conductance. In soybeans and sorghum, the genotypes exhibited limitations in their transpiration rates at high VPD showed low hydraulic conductance in leaves. In sorghum, Choudhary and Sinclair [20] observed that the genotypes with high FTSW thresholds, i.e., started reducing stomatal conductance at high soil water contents, exhibiting high hydraulic conductance. However, the relationship observed between plant hydraulic conductance and FTSW threshold in sorghum was based on tests under well-watered conditions, not under soil-drying conditions.
The leaf hydraulic network is determined by the water permeability of the cells, which strongly affects the covariation between the leaf water potential, transpiration rate, stomatal conductance, and photosynthesis in leaves [17]. The hypothesis of hydraulic limitation in restricting the transpiration rate was studied by plotting the average transpiration rate during the first few days of the experiment (four days) against the FTSW threshold values (Figure 2) [12]. Unlike sorghum, a negative correlation was observed between these two parameters. These results were consistent with soybeans, where low hydraulic limitation was observed even under well-watered conditions [19]. This implies that the lower transpiration capacity during the initial days allowed the high FTSW-threshold cotton cultivars to conserve water and survive longer than the genotypes with low FTSW thresholds during the soil-drying cycle (Table 1 and Table 2). A positive correlation was found in a study with French beans between steady-state hydraulic conductivity and stomatal conductance [21]. A lower stomatal conductance can also be related to lower hydraulic conductivity in this study, especially in cultivars 12-8-103S and Siokra L23 compared to DeRidder Red and TM-1 (Figure 3). Cotton cultivars with higher FTSW thresholds for transpiration (12-8-103S and Siokra L23) were able to maintain low stomatal conductance and transpiration to avoid desiccation (Figure 3). Since stomata are the main gateway for water and CO2 exchange, there is a potential trade-off in photosynthesis and yield in genotypes with water conservation benefits [5]. However, a decrease in the transpiration rate early in the soil-drying cycle will help plants to save water and utilize it later in the growing season, leading to yield improvements in the drought stress environments. Crop simulation studies in soybeans and sorghum displayed an improvement in the crop yield up to 75% under water-limited conditions. This demonstrates that the negative effects of early stomatal closure under dry soil conditions can be compensated by the soil water conserved in the early season to sustain physiological activities later in the growing season in dry environments [8,22].
The stomata and leaf hydraulic systems regulate the water vapor and liquid flux phases across the soil-plant-atmospheric continuum. Coordination between these phases is required to maintain the physiologically favorable water levels in leaves, prevent desiccation, and optimize the carbon gain [17]. Previous studies with different cotton genotypes showed a significant difference in gas exchange parameters, water potentials, and their relation with the degree of drought tolerance [23,24,25]. The genotypes with high FTSW thresholds were able to conserve water by lowering their gs but maintaining their A, resulting in higher WUEileaf than low-threshold genotypes (Figure 3). These genotypes managed their photosynthesis under low leaf-water potentials, especially Siokra L23, an okra leaf-type cultivar (Figure 3 and Figure 4). Previous studies with okra and super okra leaf-type cotton genotypes suggest that these genotypes can continue to have higher photosynthetic values under low water potential than other cotton genotypes [24,25], which might be attributed to lower abaxial stomatal density [23].
In conclusion, this study showed genotypic variations among cotton genotypes for their FTSW-threshold values, where plants begin to decline their transpiration. The results demonstrated that there are cotton cultivars with different strategies to conserve soil water that could lead to yield improvements in water-limited environments. Some cultivars limited their transpiration early in the drying season, and others continued transpiration. Cultivars with high FTSW thresholds exhibited water conservation by limiting their transpiration early in the drought cycle. Except for a few, some of these cultivars with high FTSW-threshold values also limited their transpiration to elevated VPD, exhibiting water conservation even under dry air conditions. Variability in limiting the transpiration rate under soil-drying conditions indicated adjustments in the water potential and maintaining hydraulic conductivity. Early stomatal closure cultivars managed a high water-use efficiency by continuing C fixation and utilizing the water efficiently. The characterization of cotton genotypes and selecting cultivars with putative water-saving traits offers an excellent resource for improving yields in water-limited environments. Future studies are required in field settings using selected water-saving cultivars for carbon acquisition and plant development to investigate trade-offs and yields. In addition, studies to understand the relationship between early transpiration decline under drought conditions and transpiration limitations to increase VPD along with yield are necessary for a detailed understanding of water conservation traits.

Author Contributions

M.J.D. and V.R. conceived and designed the experiments. M.J.D. conducted the experiments and collected and analyzed the data. M.J.D. and V.R. prepared the manuscript. All authors have read and agreed to the published version of the manuscript.

Funding

This work was supported by U.S. Department of Agriculture (CRIS# 8042-11660-001-00D). Use of trademark or copyright is neither an endorsement nor offer to sell by the US. Department of Agriculture.

Acknowledgments

The authors acknowledge Payton Paxton for providing the seeds. We thank Thomas Sinclair for his helpful suggestions for improving the manuscript. We also acknowledge technical support from Jackson Fisher, Darryl Baxtman, Emily Morisson, and Robert Erdman.

Conflicts of Interest

The authors declare that the research was conducted in the absence of any commercial or financial relationships that could be construed as a potential conflict of interests.

References

  1. Field, C.B.; Barros, V.; Stocker, T.F.; Dahe, Q. Managing the Risks of Extreme Events and Disasters to Advance Climate Change Adaptation: Special Report of The Intergovernmental Panel on Climate Change; Cambridge University Press: Cambridge, UK, 2012. [Google Scholar]
  2. Khan, A.; Pan, X.; Najeeb, U.; Tan, D.K.Y.; Fahad, S.; Zahoor, R.; Luo, H. Coping with drought: Stress and adaptive mechanisms, and management through cultural and molecular alternatives in cotton as vital constituents for plant stress resilience and fitness. Biol. Res. 2018, 51, 47. [Google Scholar] [CrossRef]
  3. Lobell, D.B.; Roberts, M.J.; Schlenker, W.; Braun, N.; Little, B.B.; Rejesus, R.M.; Hammer, G.L. Greater Sensitivity to Drought Accompanies Maize Yield Increase in the U.S. Midwest. Science 2014, 344, 516–519. [Google Scholar] [CrossRef] [PubMed]
  4. Atlin, G.N.; Cairns, J.E.; Das, B. Rapid breeding and varietal replacement are critical to adaptation of cropping systems in the developing world to climate change. Glob. Food Secur. 2017, 12, 31–37. [Google Scholar] [CrossRef] [PubMed]
  5. Wang, D.R.; Venturas, M.D.; Mackay, D.S.; Hunsaker, D.J.; Thorp, K.R.; Gore, M.A.; Pauli, D. Use of hydraulic traits for modeling genotype-specific acclimation in cotton under drought. New Phytol. 2020. [Google Scholar] [CrossRef] [PubMed]
  6. Ullah, I.; Mehboob-ur-Rahman; Ashraf, M.; Zafar, Y. Genotypic variation for drought tolerance in cotton (Gossypium hirsutum L.): Leaf gas exchange and productivity. Flora-Morphol. Distrib. Funct. Ecol. Plant. 2008, 203, 105–115. [Google Scholar] [CrossRef]
  7. Passioura, J.; Angus, J. Improving productivity of crops in water-limited environments. In Advances in Agronomy; Elsevier: Amsterdam, The Netherlands, 2010; Volume 106, pp. 37–75. [Google Scholar]
  8. Sinclair, T.R. Effective Water Use Required for Improving Crop Growth Rather Than Transpiration Efficiency. Front. Plant Sci. 2018, 9, 1442. [Google Scholar] [CrossRef] [PubMed]
  9. Devi, M.J.; Reddy, V.R. Transpiration Response of Cotton to Vapor Pressure Deficit and Its Relationship With Stomatal Traits. Front. Plant Sci. 2018, 9, 1572. [Google Scholar] [CrossRef] [Green Version]
  10. Ritchie, J.T. Influence of Soil Water Status and Meteorological Conditions on Evaporation from a Corn Canopy1. Agron. J. 1973, 65, 893–897. [Google Scholar] [CrossRef]
  11. Sadras, V.O.; Milroy, S.P. Soil-water thresholds for the responses of leaf expansion and gas exchange: A review. Field Crop. Res. 1996, 47, 253–266. [Google Scholar] [CrossRef]
  12. Gholipoor, M.; Sinclair, T.R.; Prasad, P.V.V. Genotypic variation within sorghum for transpiration response to drying soil. Plant Soil 2012, 357, 35–40. [Google Scholar] [CrossRef]
  13. Sinclair, T.; Ludlow, M. Influence of Soil Water Supply on the Plant Water Balance of Four Tropical Grain Legumes. Funct. Plant Biol. 1986, 13, 329–341. [Google Scholar] [CrossRef]
  14. Devi, J.M.; Sinclair, T.R.; Vadez, V.; Krishnamurthy, L. Peanut genotypic variation in transpiration efficiency and decreased transpiration during progressive soil drying. Field Crop. Res. 2009, 114, 280–285. [Google Scholar] [CrossRef] [Green Version]
  15. Devi, J.M.; Sinclair, T.R.; Chen, P.; Carter, T.E. Evaluation of Elite Southern Maturity Soybean Breeding Lines for Drought-Tolerant Traits. Agron. J. 2014, 106, 1947–1954. [Google Scholar] [CrossRef]
  16. Gholipoor, M.; Sinclair, T.R.; Raza, M.A.S.; Löffler, C.; Cooper, M.; Messina, C.D. Maize Hybrid Variability for Transpiration Decrease with Progressive Soil Drying. J. Agron. Crop Sci. 2013, 199, 23–29. [Google Scholar] [CrossRef]
  17. Simonin, K.A.; Burns, E.; Choat, B.; Barbour, M.M.; Dawson, T.E.; Franks, P.J. Increasing leaf hydraulic conductance with transpiration rate minimizes the water potential drawdown from stem to leaf. J. Exp. Bot. 2014, 66, 1303–1315. [Google Scholar] [CrossRef] [Green Version]
  18. Sperry, J.S.; Hacke, U.G.; Oren, R.; Comstock, J.P. Water deficits and hydraulic limits to leaf water supply. Plan Cell Environ. 2002, 25, 251–263. [Google Scholar] [CrossRef]
  19. Sinclair, T.R.; Zwieniecki, M.A.; Holbrook, N.M. Low leaf hydraulic conductance associated with drought tolerance in soybean. Physiol. Plant. 2008, 132, 446–451. [Google Scholar] [CrossRef] [PubMed]
  20. Choudhary, S.; Sinclair, T.R. Hydraulic conductance differences among sorghum genotypes to explain variation in restricted transpiration rates. Funct. Plant Biol. 2014, 41, 270–275. [Google Scholar] [CrossRef]
  21. Sôber, A. Hydraulic conductance, stomatal conductance, and maximal photosynthetic rate in bean leaves. Photosynthetica 1998, 34, 599–603. [Google Scholar] [CrossRef]
  22. Sinclair, T.R.; Devi, J.; Shekoofa, A.; Choudhary, S.; Sadok, W.; Vadez, V.; Riar, M.; Rufty, T. Limited-transpiration response to high vapor pressure deficit in crop species. Plant Sci. 2017, 260, 109–118. [Google Scholar] [CrossRef]
  23. Pettigrew, W.T.; Heitholt, J.J.; Vaughn, K.C. Gas Exchange Differences and Comparative Anatomy among Cotton Leaf-type Isolines. Crop Sci. 1993, 33, 1295–1299. [Google Scholar] [CrossRef]
  24. Pettigrew, W.T.; Meredith, W.R., Jr. Leaf Gas Exchange Parameters Vary among Cotton Genotypes. Crop Sci. 1994, 34, 700–705. [Google Scholar] [CrossRef]
  25. Nepomuceno, A.L.; Oosterhuis, D.M.; Stewart, J.M. Physiological responses of cotton leaves and roots to water deficit induced by polyethylene glycol. Environ. Exp. Bot. 1998, 40, 29–41. [Google Scholar] [CrossRef]
Figure 1. Normalized transpiration rate (NTR) of cotton genotypes. (A) Siokra L23 and (B) TM-1 plotted against the fraction of transpirable soil water (FTSW) from two dry-down experiments. Closed circles are the data from experiment 1 and open circles from experiment 2. The X0 was calculated using two segmental linear regressions and is the threshold value of the FTSW, where the plant started declining their transpiration rate.
Agronomy 10 01290 g001
Figure 2. Linear regression between the fraction of transpirable soil water (FTSW) threshold calculated from the dry-down experiment for each genotype and initial transpiration rate during the wet stage of fifteen cotton cultivars.
Agronomy 10 01290 g002
Figure 3. (A) Photosynthesis, (B) stomatal conductance, and (C) instantaneous water use efficiency of four cotton genotypes that are contrasted in their response to drying soil with early and late transpiration declines. The values were measured at different intervals of drought periods based on approximate FTSW values. Bars represented with * and ** are significant at p < 0.05 and p < 0.01, respectively.
Agronomy 10 01290 g003
Figure 4. Cotton water potential values measured at different intervals while soil drying. Water potential of four different genotypes with high and low FTSW-threshold values. The water potentials were measured at different intervals of the drought periods. Values denoted with * and ** are significant at p < 0.05 and p < 0.01, respectively.
Agronomy 10 01290 g004
Table 1. Total water extracted and days to reach the endpoint of the dry-down experiment in cotton cultivars.
GenotypeTotal Water Extracted (g)Days to Endpoint
FiberMax 9180501 a13.4 a
Gossypium arboreum489 a13.5 a
TM-1509 a13.6 a
DeRidder Red500 a13.7 a
TX 1151501 a13.7 a
Phytagen 72502 a13.9 ab
06-46-153P480 a14.0 ab
FiberMax 2870508 a14.1 ab
CS 50498 a14.2 ab
All Tex OL220498 a14.2 ab
12-8-103S492 a14.5 b
05-MM4510 a14.8 b
Siokra L23505 a15.1 bc
Lankart 57486 a15.4 bc
McNair 220483 a15.9 c
Total water extracted (g) and days to reach the endpoint (normalized transpiration rate 0.1) of fifteen cotton cultivars from experiment 1. Varieties are listed in ascending order based on their days to reach the endpoint NTR 0.1. The genotypes represented with similar alphabets are not significantly different from each other at p < 0.05 based on Tukey’s Kramer model.
Table 2. Presence of VPD breakpoint and FTSW-threshold values of cotton cultivars with R2 values and confidence limit.
GenotypeVPD BreakpointFTSW ThresholdR2Confidence Limit (p < 0.05)
DeRidder RedNo0.35 a0.940.32 to 0.39
Gossypium arboreumNo0.35 a0.950.31 to 0.39
TM-1No0.37 a0.910.32 to 0.42
TX 1151Yes0.45 ab0.940.40 to 0.46
FiberMax 9180Yes0.46 b0.920.43 to 0.49
05-MM4No0.48 ab0.870.37 to 0.52
FiberMax 2870No0.49 b0.950.45 to 0.52
Phytagen 72Yes0.52 bc0.930.49 to 0.56
CS 50No0.53 bc0.950.50 to 0.56
06-46-153PNo0.55 bc0.920.50 to 0.58
All Tex OL220Yes0.57 bc0.970.54 to 0.61
McNair 220Yes0.57 c0.940.55 to 0.65
Lankart 57Yes0.58 c0.940.54 to 0.62
12-8-103SYes0.60 bc0.910.51 to 0.59
Siokra L23No0.60 c0.940.56 to 0.64
The Fraction of Transpirable Soil Water (FTSW) threshold values of fifteen cotton varieties subjected to progressive drought stress from experiment 1, along with the R2 and confidence intervals. The FTSW threshold represented with the same alphabet letter fall within the same confidence intervals are not significantly different from each other at p < 0.05. Presence of vapor pressure deficit (VPD)—breakpoint for the fifteen cotton cultivars listed based on the study from Devi and Reddy [9]. The cultivars are listed in the table in their ascending order based on FTSW threshold for the transpiration values.
Table 3. FTSW-threshold value, R2, confidence limit, and days to reach the endpoint of four cotton cultivars.
GenotypeFTSW ThresholdR2Confidence Limit (p < 0.05)Days to Reach Endpoint
DeRidder Red0.35 a0.890.30 to 0.3913.5 a
TM-10.37 a0.920.33 to 0.4113.7 a
12-8-103S0.59 b0.970.55 to 0.6215.4 b
Siokra L230.61 b0.900.58 to 0.6514.9 b
Fraction of transpirable soil water (FTSW) threshold, R2, confidence intervals, and days to reach the endpoint (normalized transpiration rate 0.1) of four selected cotton varieties in experiment 2. FTSW-threshold values falling within the same confidence intervals are not significantly from each other at p < 0.05. The FTSW-threshold values and days to reach the endpoint values denoted with the same alphabet letters are not significantly different, based on Tukey’s Kramer model.

