Article

Gene Expression and miRNA Regulation Changes in Leaves of Rice Backcross Introgression Lines

State Key Laboratory of Hybrid Rice, College of Life Sciences, Wuhan University, Wuhan 430072, China
*
Author to whom correspondence should be addressed.
Agronomy 2020, 10(9), 1381; https://doi.org/10.3390/agronomy10091381
Submission received: 10 August 2020 / Revised: 8 September 2020 / Accepted: 10 September 2020 / Published: 12 September 2020
(This article belongs to the Section Crop Breeding and Genetics)

Abstract

:
High-throughput sequencing was used to distinguish the gene and miRNA expression profiles in the leaves of three progenies from a rice backcross introgression line (BC2F12) and their parents (Oryza sativa and wild rice, O. longistaminata). A total of 33,419 genes and 513 miRNAs were identified in two parents and three lines, and the majority of the genes and miRNAs were commonly expressed. The results show that 10.23% to 17.94% of the genes were differentially expressed genes (DEGs) in the progenies compared with those of the two parents, and the majority of them were up-regulated. Of the miRNAs, 12.56% to15.43% were differentially expressed in the progeny/O. sativa comparisons and the majority of which were up-regulated, while 42.02% to 45.21% of miRNAs were differentially expressed in the progeny/O. longistaminata comparisons, of which nearly half were down-regulated. Most of the DEGs and differentially expressed miRNAs showed expression levels close to that of O. sativa, indicating that the expression of genes and miRNAs in progenies was closely related to their chromosome complements and that the miRNAs were more susceptible than the genes to the effects of genomic composition. Furthermore, a larger number of target genes were predicted in the progeny/O. longistaminata comparisons. Finally, we found that the expression of some genes and miRNAs might increase the possibility for abiotic stress responses and adaptation in progenies. Together, our findings increase the understanding of the molecular mechanisms of hybridization and backcrossing on the expression levels of genes and miRNAs in rice leaves.

1. Introduction

Among the cereal crops, Asian-cultivated rice (Oryza sativa) feeds a large proportion of the world’s population. The genus Oryza consists of two cultivated rice strains in the AA genome (O. sativa and O. glaberrima) and 22 well-characterized wild relatives with 10 recognized genome types, consisting of 6 diploid genomes (AA, BB, CC, DD/EE, FF and GG) and 4 tetraploid genomes (BBCC, CCDD, HHJJ and HHKK) [1]. In addition to the cultivated species, there are six wild species belonging to the AA genome. As an important source of genetic variation, the wild species remain untapped in rice breeding programs [2].
The use of distant hybridization between O. sativa and wild species is a valid method in the process of improving cultivated rice. Thus far, many valuable genes in the AA genome of wild rice have been studied and successfully utilized. O. longistaminata, originating in Africa, is a rhizomatous perennial wild rice species that likely separated from O. glaberrima 1.9 million years ago [3]. Many potentially useful traits of O. longistaminata, such as strong rhizomes and stress resistance, have been reported and are considered as an important resource for the improvement of cultivated rice [4,5,6,7]. Additionally, some genes from O. longistaminata have been investigated and are thought to be promising for cultivating disease resistance in rice, such as the blast resistance gene Pi57(t) [7]. Therefore, further discovery and utilization of high-quality genes from O. longistaminata could promote breeding and broaden the genetic basis of cultivated rice.
Hybridization and backcross is an effective approach to introduce novel genes and gene-networks from wild species into cultivated rice. Thus far, backcross introgression lines (BILs), introgression lines (ILs) and near-isogenic lines (NILs) of many crop species have been constructed to import qualitative features of wild species or resistant lines into the different breeding species [5,8,9,10,11]. Two sets of BILs, derived from Zn-dense rice, and two elite indica varieties were constructed to explore the grain mineral concentration in different environments [9]. The ILs deriving from an interspecific cross between Oryza glaberrima and Oryza sativa showed a significant positive donor parent effect on the phenotypic traits (grain yield per plant, plant height) and a significant negative donor parent effect on the filled grain percentage and days to flowering [10]. Recent studies have investigated the metabolic, proteomic or gene expression levels in BILs, ILs and NILs [12,13,14]. For example, the roots and leaves of two pairs of near-isogenic rice lines with opposite drought tolerance have been studied to find genes that are associated with drought tolerance under different drought stress conditions [8,15]. These studies show that NILs, ILs and BILs of rice are invaluable resources for the improvement of genetic qualities, especially when derived from wild rice strains.
Recently, transcriptome profile analyses of mRNAs and miRNAs have been widely reported in various plants [16,17,18,19,20]. Additionally, several studies on the integrated analysis of mRNA and miRNA expression levels have been carried out [21,22,23]. However, the combination analysis of miRNA expression data and miRNA target expression data in BIL/IL rice strains have rarely been reported. Previously, we investigated the molecular mechanisms of hybrid backcrossing on the gene, miRNA and lncRNA expression in the stem tissues of three progenies and their parents [24,25]. Based on the previous studies, the leaves of three progenies of BILs and their parents were used to explore the potential mechanisms of genomic infiltration from the donor parent, and next-generation sequencing technologies were employed to examine the expression levels of miRNAs and mRNAs in leaves. We focused primarily on the following: (1) the expression level variations of mRNA and miRNA in the leaves of progenies and whether they were influenced by their chromosome complements; (2) the integrated analysis of mRNA and miRNA that provided a valuable resource for which to examine the genome expression changes in the progenies; and (3) the function analysis of differentially expressed genes and miRNAs in three progenies compared with their parents. The results from this study provide us with a valuable resource to explore the global genome expression changes on mRNA and miRNA expression levels and broaden our understanding of the complex mechanisms of gene introgression in rice.

2. Materials and Methods

2.1. Plant Materials and Growth Conditions

The features of three progenies of BILs and their parents, and the growing environment used in this study were as previously described [24]. Leaves at the jointing–booting stage were harvested from 5 individual plants of each line and immediately frozen in liquid nitrogen for further use.

2.2. Construction of mRNA Libraries and Small RNA Libraries, Illumina Sequencing and Data Processing

To gain insight into the gene expression patterns of the three progenies and their parents, the leaves of each line were collected. Total RNA was extracted from the five-leaf sample of each line separately using TRIzol Reagent (Invitrogen, MA, USA), and each sample was composed of one pool of all RNA collected from five individuals. The digestion of genomic DNA and RNA quality testing and construction of the sequencing library of each line were performed as previously described [16]. The constructed RNA-seq libraries were sequenced with the Illumina HiSeq™2000, and the original image data were transferred as raw reads through base calling. After filtering out the adaptor sequences, reads with an N ratio >10% and low-quality sequences (low-quality base content exceeding 50% and a quality value ≤ 5), the clean reads were mapped onto the rice reference genome (http://rice.plantbiology.msu.edu) [26] with alignment using Short Oligonucleotide Analysis Package (SOAP aligner/soap2) software (http://soap.genomics.org.cn) [27]. The RNA extraction for constructing a sequencing library of small RNA was no different from that of the mRNA, and the sRNA selection and libraries construction were carried out as previously described [19]. High-throughput sequencing and the following analysis of the sequencing data were performed as previously described [28].

2.3. Analysis of Differential Expression of Genes and miRNAs

The gene expression levels were calculated using ERANGE software (version 4.0) (http://woldlab.caltech.edu/gitweb/) and normalized according to RPKM [29]. The miRNA reads were normalized to transcripts per million (TPM) as previously described [24]. The DESeq with the random sampling model was used to identify any differentially expressed genes (DEGs) [30]. Genes with an absolute value of log2 ratio ≥ 2.322 (fold change ≥ 5) and an FDR ≤ 0.001 were identified as DEGs, and miRNAs with an absolute value of log2 ratio ≥ 1 and p ≤ 0.05 were regarded as significantly differentially expressed miRNAs.

2.4. Function Annotation of Genes and Target Genes of miRNA

All miRNA sequences were mapped to the rice reference genome (http://rice.plantbiology.msu.edu) to predict putative target genes according to the criteria [31,32]. The psRobot software (http://omicslab.genetics.ac.cn/psRobot/) and Targetfinder software (http://targetfinder.org/) were used to identify the putative target genes. Cytoscape (version 2.6.2) software (http://www.cytoscape.org/) was used to perform the integrated analysis of miRNAs and their coherent target genes (CTGs).
A web-based tool and database (AgriGO) for gene ontology (GO) analysis (http://bioinfo.cau.edu.cn/agriGO/) [33] was used for GO classification. The Singular Enrichment Analysis (SEA) tool and the multi-test adjustment method (Yekutieli FDR dependency) were employed, and terms with FDR ≤ 0.05 were considered to be significantly enriched terms. The predicted transcription factor (TF) genes of all DEGs were sought from the Plant Transcription Factor Database (http://planttfdb.cbi.edu.cn/) [34].
All DEGs were mapped to terms in the Kyoto Encyclopedia of Genes and Genomes (KEGG) database for KEGG pathway analysis. We obtained p values using the hypergeometric test, and the Q values were calculated using multiple hypothesis testing. Pathways with a Q value ≤ 0.05 were considered to be significantly enriched pathways. Moreover, the ID and log2 ratio of DEGs in each progeny/parent comparison were input into the MapMan package (http://MapMan.gabipd.org) to visualize the related pathways.

2.5. Real-Time Quantitative PCR (RT-qPCR)

To validate the accuracy of our data, RT-qPCR of randomly selected 12 genes and 6 miRNAs were and performed as previously described [24]. Additionally, 16 genes involved in photosynthesis and adaptation were validated by RT-qPCR. The primers of specific gene for RT-qPCR were designed using the Primer (version primer 5.0) software (Table S1), and the miRNA-specific stem-loop primers (Table S2) followed the stem-loop primer designing rules [35]. The RT-qPCR reaction was carried out as previously described [19,36], and each reaction was repeated in triplicate with three biological replicates.

3. Results

3.1. Gene Expression and Functional Classification of Commonly Expressed (Co-Expressed) Genes

In total, 11,728,984 to 12,183,190 clean reads (more than 99.13% of the raw reads) were obtained from the five libraries (Table S3), and 77.33% to 86.71% of the reads could be matched to the reference genome. In total, we found 33,419 genes (26,767 in L1710, 25,531 in L1817, 26,960 in L1730, 24,468 in O. sativa and 25,093 in O. longistaminata) expressed in the five lines. Among the 33,419 genes, more than 79% were long gene sequences with a gene length exceeding 1000 bp (Table S4). Among the expressed genes, 19,663 were commonly expressed (co-expressed) in the five lines, which was far greater than the number of uniquely expressed genes in each line (Figure S1a), a result that is similar to the previous results from the stem tissue study [24]. In addition, 1887 genes were uniquely expressed in O. longistaminata, while less than 1000 genes were uniquely expressed in L1817 and O. sativa.
GO analysis of the co-expressed genes in the five lines was carried out using a web-based tool and database (AgriGO). The results from this analysis showed that 16 (biological process), 2 (molecular function) and 38 (cellular component) terms were found to be significantly enriched (FDR < 0.05) in the five lines (Figure S1b). Among these, 12 terms of biological process, 2 terms of molecular function and 36 terms of cellular component were significantly enriched with FDR < 0.001. We also found 168 genes that were involved in ‘photosynthesis’, of which 153 were related to ‘plastid’ and 106 were related to ‘thylakiod’. The results indicated that the co-expressed genes of the five lines at the rice jointing stage were mainly involved in cell synthesis and metabolism.

3.2. More Differentially Expressed Genes Were Discovered in Three Progenies Compared with O. longistaminata

To study the effect of inter-specific hybridization and backcrossing on the gene expression in three progenies, we verified the reliability of the sequencing data by detecting the expression patterns of 12 genes using qRT-PCR (Figure S2). The number of DEGs in each progeny/parent (O. sativa or O. longistaminata) was showed in Figure 1a. The L1710/O. longistaminata comparison showed the highest number of DEGs, and the L1817/parent comparison contained the least number of DEGs. Additionally, most of the genes were up-regulated in the progeny/parent comparisons, and most of the genes were up-regulated in L1730 compared with L1710 and L1817, while genes were down-regulated in L1817 compared with L1710. Furthermore, we found 1541, 500 and 1379 DEGs that were commonly up-regulated, and 350, 175 and 238 DEGs that were commonly down-regulated in L1710, L1817 and L1730 compared with their parents, respectively (Figure 1b–d). Overall, there were more DEGs in the progeny/donor parent comparison than that in the progeny/recipient parent comparison, and most of the DEGs were up-regulated in the progenies.
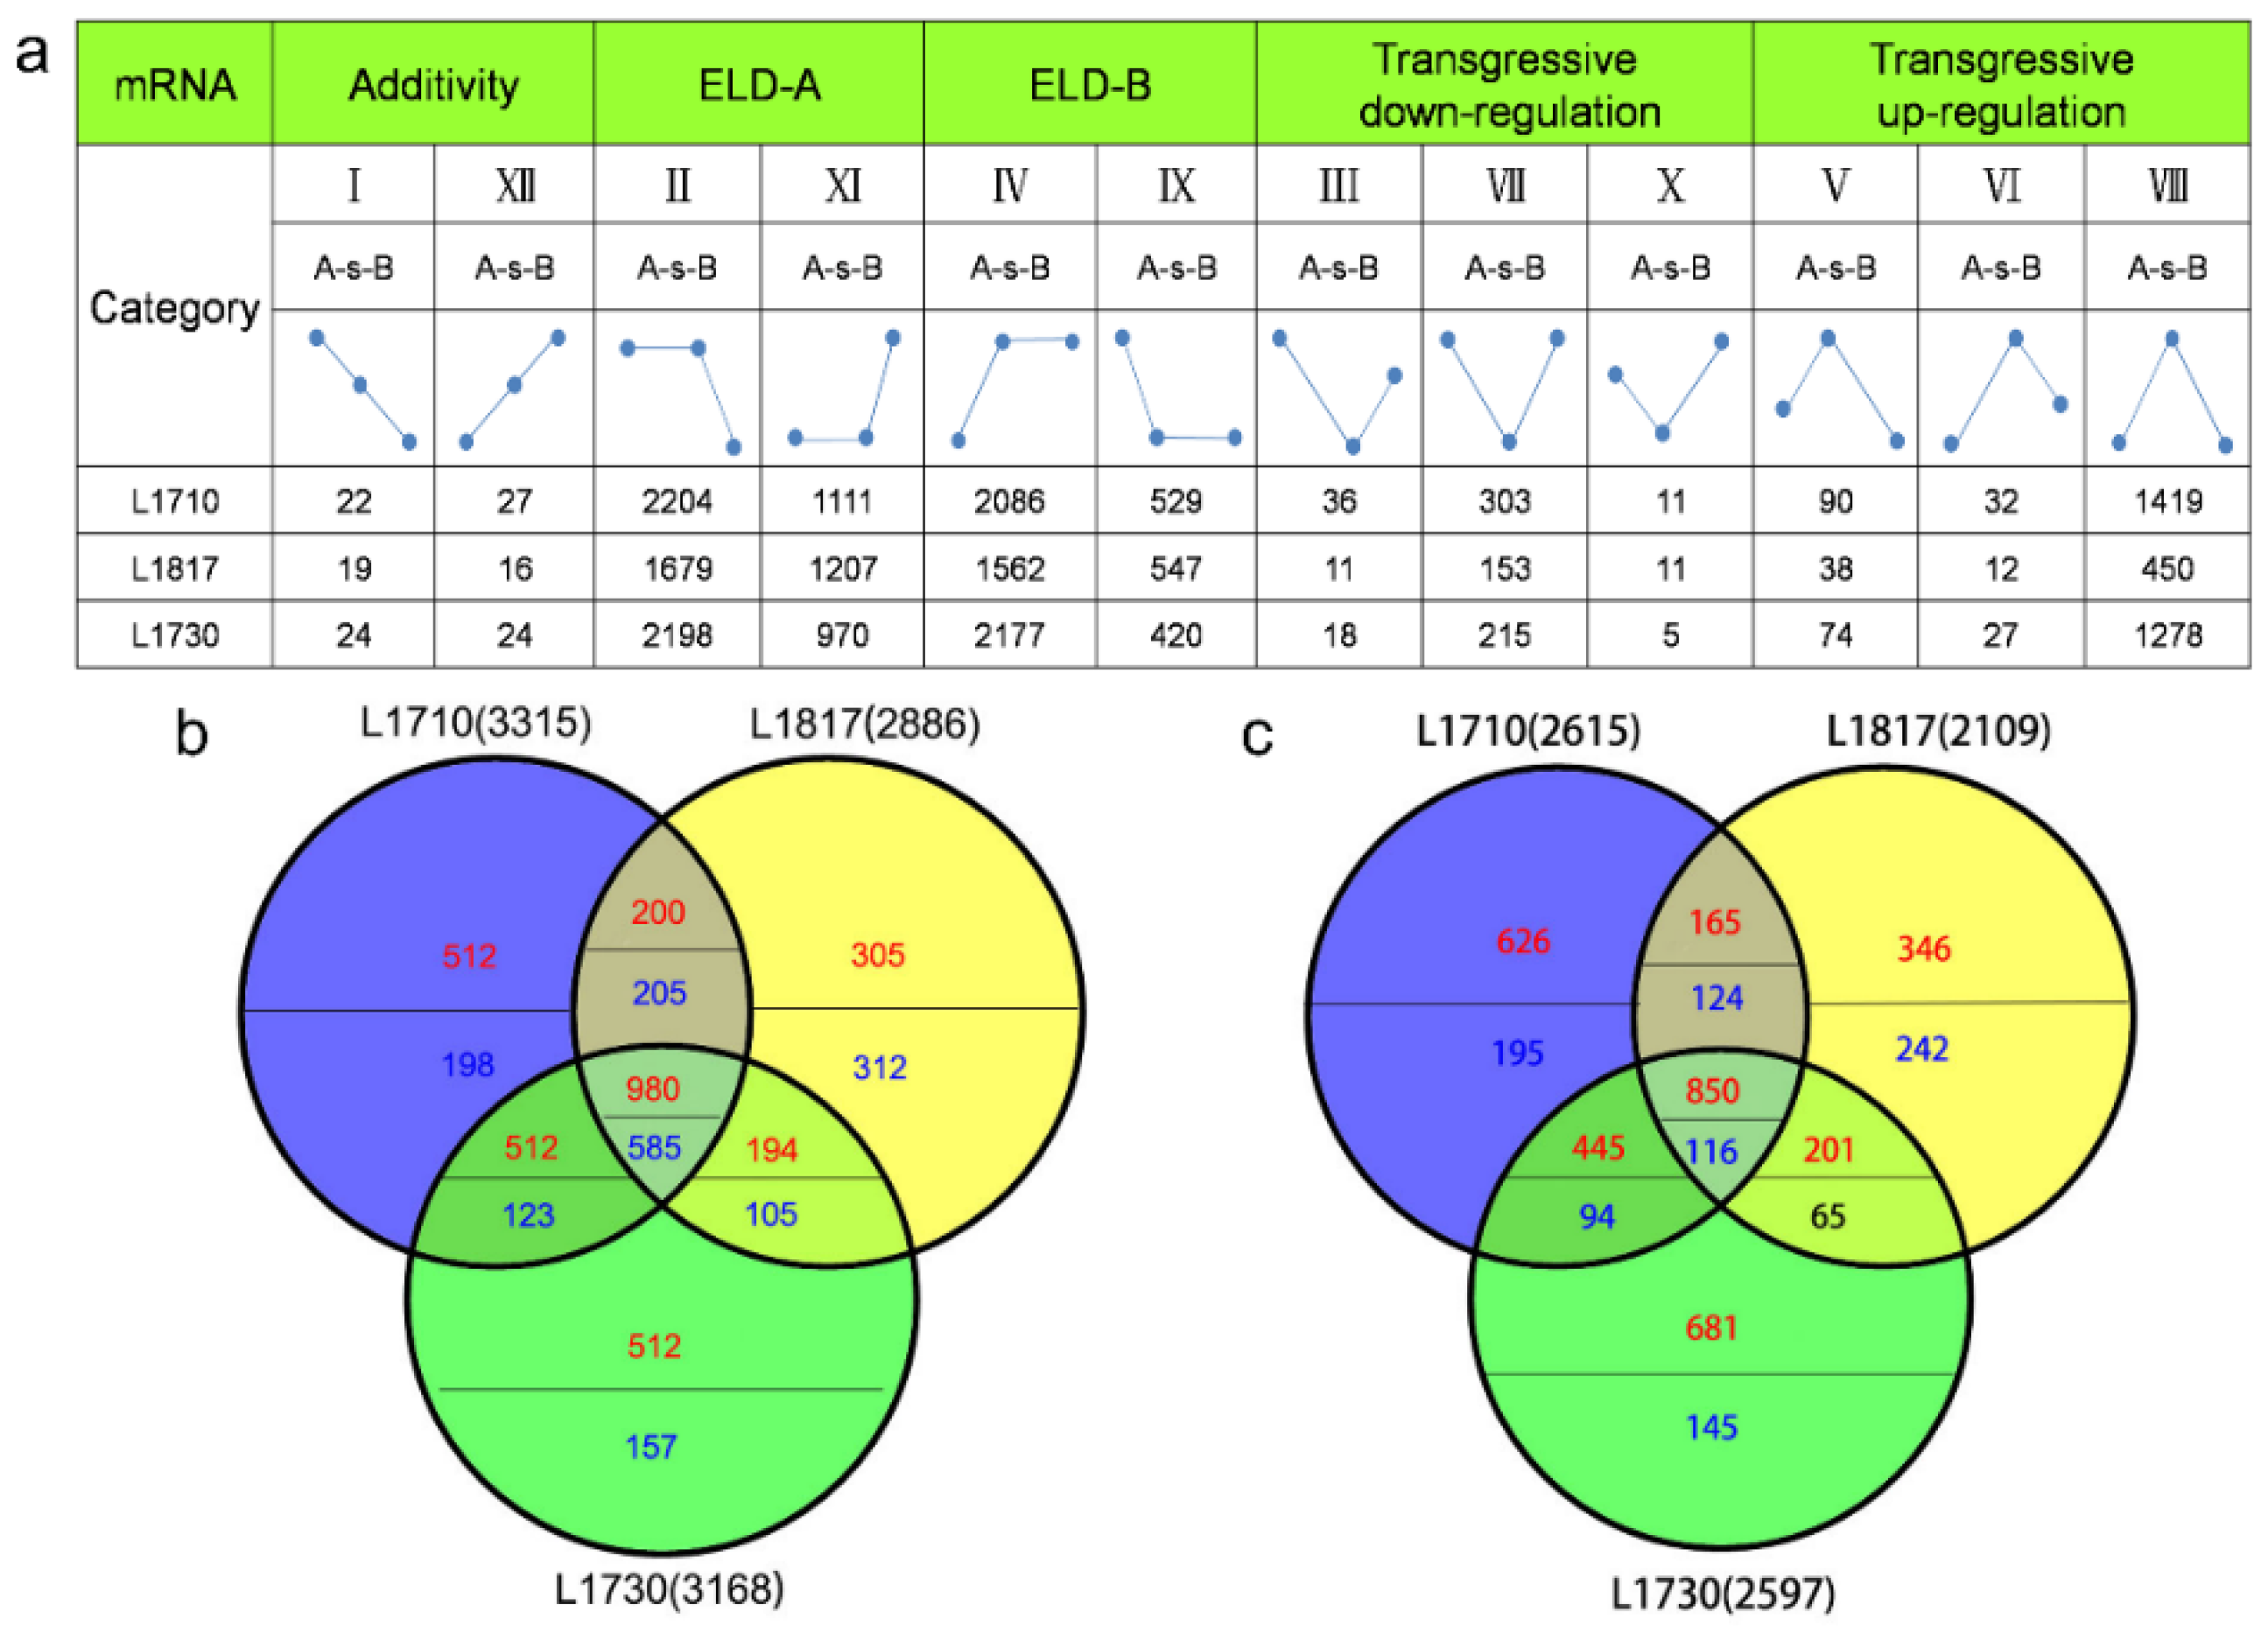
For a more detailed analysis, the genes were categorized into five major expression categories according to the previously defined criteria [37]. The five categories were distributed into 12 expression patterns (I to XII) according to the gene expression levels in the progeny relative to the parent (Figure 2a). The 12 expression patterns included the following: the expression level dominance (ELD) to O. sativa (II and XI, ELD-A), ELD to O. longistaminata (IV and IX, ELD-B), expression level of the progeny shows no marked difference from the average of the two parents (I and XII), transgressive down-regulation (III, VII and X) and transgressive up-regulation (V, VI and VIII). ELD-A genes indicated that gene expression levels in the progeny were close to that of O. sativa, but different from that of O. longistaminata, and ELD-B genes indicated that gene expression levels in the progeny were close to that of O. longistaminata, but different from that of O. sativa. Overall, genes that displayed ELD to their parents were the highest proportion (more than 75%), followed by transgressive expressed genes (24.03% in L1710, 11.83% in L1817 and 21.76% in L1730) in the three progenies (Table S5). Additionally, most of the genes showing ELD and transgressive regulation were up-regulated. For example, 2204 ELD-A genes, 2086 ELD-B genes and 1541 transgressive regulated genes were up-regulated, and 1111 ELD-A genes, 529 ELD-B genes and 450 transgressive regulated genes were down-regulated in L1710. Similar results were seen from L1817 and L1730. Moreover, we found 1565 ELD-A genes and 966 ELD-B genes that were commonly shared among the three progenies, and most of these were up-regulated, especially in the three progeny/O. longistaminata comparisons (Figure 2b,c). The number of ELD-A genes was much greater than the number of ELD-B genes in the three progenies, which may be caused by their chromosome complements that were primarily inherited from O. sativa.

3.3. More GO Terms Were Enriched in DEGs in the Three Progeny/O. sativa Comparisons

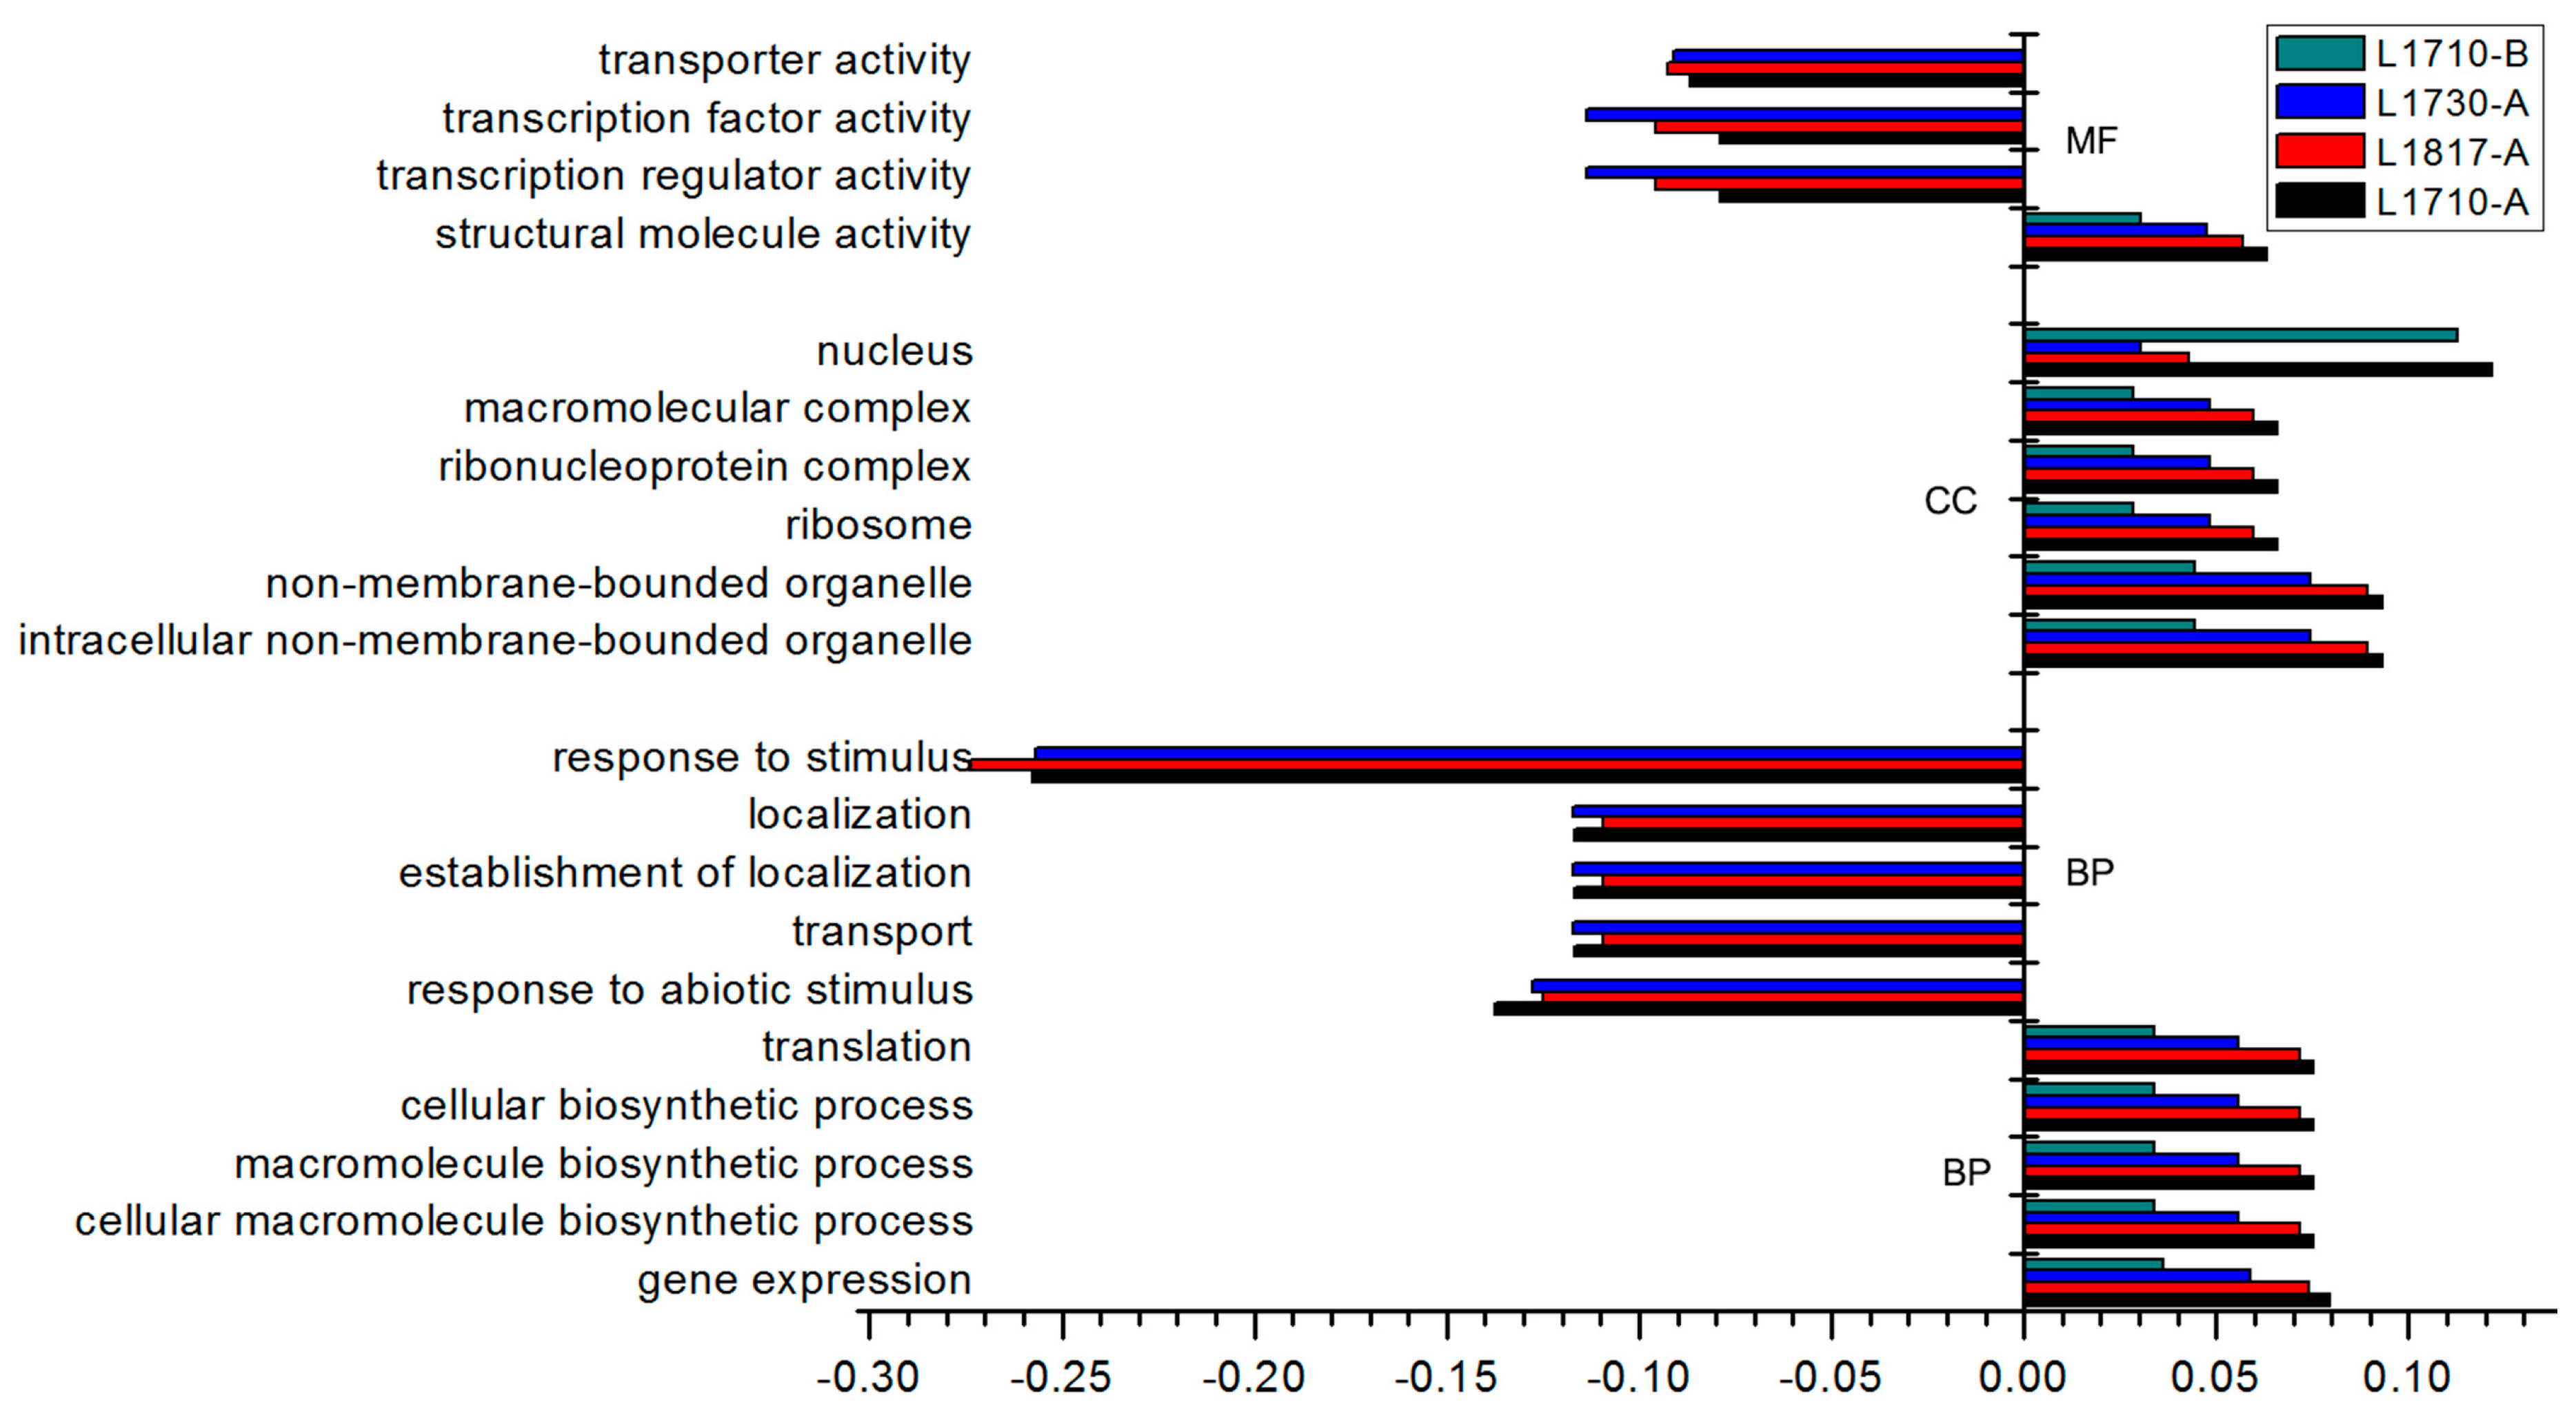
The GO functional categories of DEGs revealed a variety of significantly changed GO terms (FDR < 0.05) in each progeny. In total, 33 (L1710), 34 (L1817) and 25 (L1730) terms for DEGs in the three progeny/O. sativa comparisons and 16 (L1710), 12 (L1817) and 18 (L1730) terms for DEGs in the three progeny/O. longistaminata comparisons were significantly changed GO terms (Table S6). Among these, 23 and 9 significantly changed terms were seen in the three progenies compared with O. sativa and O. longistaminata, respectively. We then explored the significantly changed GO terms of the up/down-regulated genes and found that 31 (L1710), 25 (L1817) and 28 (L1730) terms were up-regulated, and 22 (L1710), 25 (L1817) and 11 (L1730) terms were down-regulated in the three progeny/O. sativa comparisons (Table S7). However, only 12 terms were up-regulated and 9 terms were down-regulated in L1710, and 1 term was down-regulated in L1817, among the three progeny/O. longistaminata comparisons. In addition, most of the up-regulated terms belonged to the cellular component, while most of the down-regulated terms belonged to biological processes, and there were more down-regulated terms of molecular function terms in the three progenies. We further found that the up-regulated genes were enriched in 5 biological processes, 1 molecular function and 6 cellular component terms in the three progeny/O. sativa comparisons and the L1710/O. longistaminata comparison (Figure 3). The down-regulated genes were mainly enriched in 5 biological processes and 3 molecular function terms in the three progenies compared with O. sativa. The above results indicated that the introgression of wild rice might lead to changes in many biological functions in the progenies relative to O. sativa.
We also investigated possible functions of the ELD genes in the three progenies. In total, ELD-A genes were significantly enriched in 30 (L1710), 9 (L1817) and 27 (L1730) GO terms, and ELD-B genes were significantly enriched in 32 (L1710), 31 (L1817) and 27 (L1730) GO terms (Table S8). Among the significantly changed terms from three GO categories, the ELD-A genes (3315 in L1710, 2886 in L1817 and 3168 in L1730) were mainly enriched in two terms of biological processes and two terms of molecular function in the three progenies (Figure S3a–c), whereas the ELD-B genes (2615 in L1710, 2109 In L1817 and 2597 in L1730) were mainly enriched in nine terms of cellular component in three progenies (Figure S3d–f). The above results indicate that ELD-A genes might be primarily involved in biological processes and molecular functions, whereas ELD-B genes might be primarily related to the function of cell components.

3.4. KEGG and MapMan Pathway Analysis of DEGs in the Three Progenies Compared with Their Parents

To understand the possible biological functions of differentially expressed genes (DEGs) in the three progenies, KEGG (Kyoto Encyclopedia of Genes and Genomes) pathway (http://www.genome.ad.jp/kegg/) analysis was conducted. All DEGs in each progeny/parent comparison were assigned to 119-126 pathways (Table S9). There were more significantly enriched pathways (Q ≤ 0.05) in the three progeny/O. longistaminata comparisons than in the three progeny/O. sativa comparisons. Several pathways were associated with photosynthesis, such as ‘carbon fixation in photosynthetic organisms’, ‘lycolysis/gluconeogenesis’, ‘fructose mannose metabolism’, ‘photosynthesis-antenna proteins’, ‘pentose phosphate pathway’, ‘porphyrin and chlorophyll metabolism’ and ‘carotenoid biosynthesis’. In addition, we found that most DEGs involved in photosynthesis showed parental ELD, of which a large proportion showed ELD-B in the three progenies, and some of these have been widely studied (Table S10). For example, WSL3 (LOC_Os10g32540), PGL (LOC_Os10g41780), psbS1 (LOC_Os01g64960) and psbS2 (LOC_Os04g59440) showed ELD-B in three progenies. The expression of some genes was contradictory to the pathways in which they were involved. For example, the hexokinase genes OsHXK2 (LOC_Os05g45590) and OsHXK7 (LOC_Os05g09500) showing ELD-B in L1710, and OsHXK8 (LOC_Os01g09460) showing ELD-A were up-regulated in ‘fructose and mannose metabolism’ in progenies.
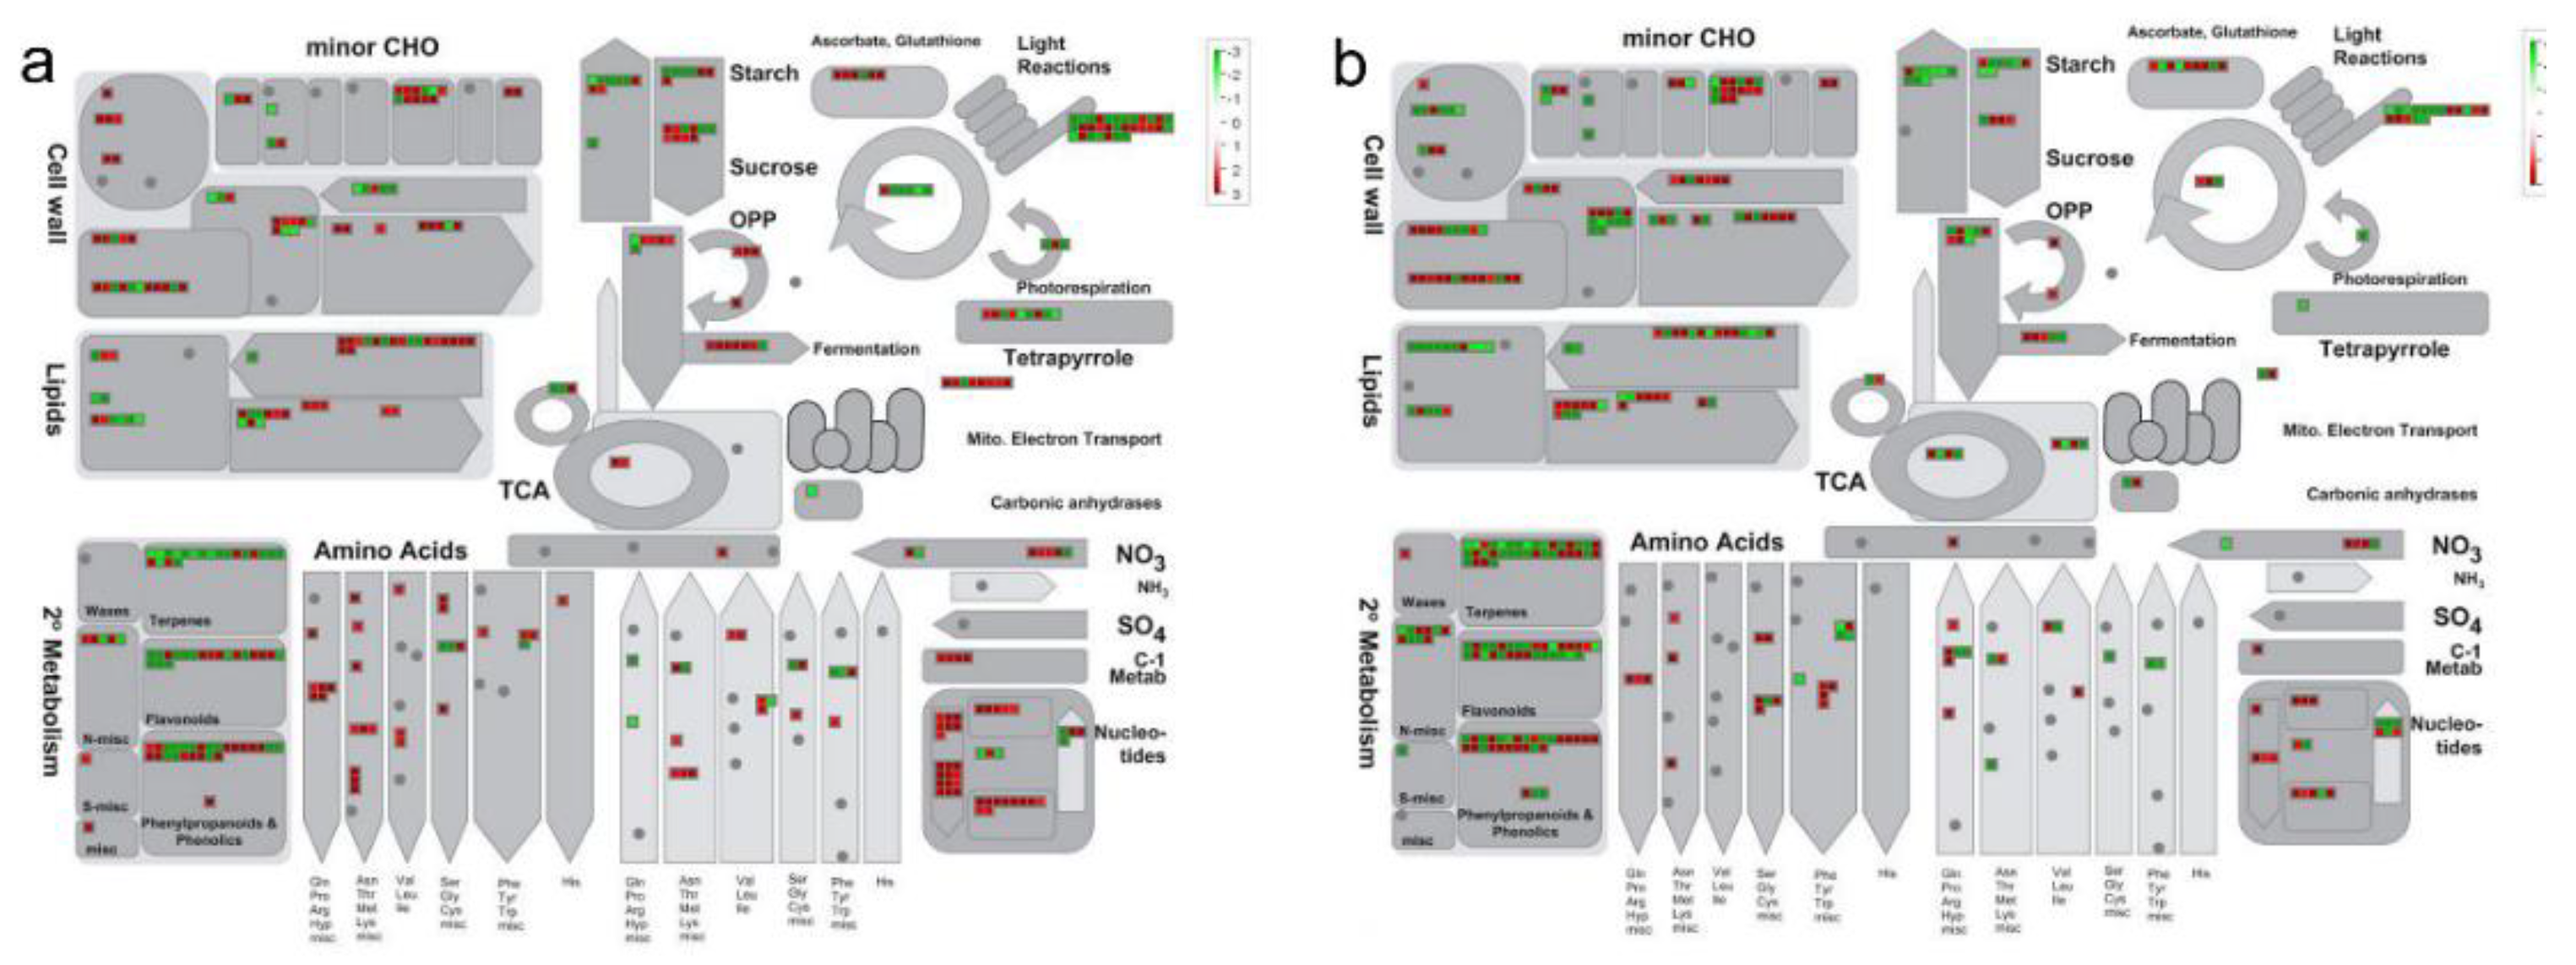
The MapMan tool utilizes input from several sources to map out specific biological processes and incorporates information from the following rice database: Oryza sativa Japonica Group/Rice_japonica_mapping_merged_08:10. Overviews of DEGs in the ‘cellular metabolism’ (Figure 4) and ‘photosynthesis pathways’ (Figure S4) were displayed using the MapMan tool for the L1710/parent comparisons. In the L1710/O. sativa comparison, the number of up-regulated genes was slightly greater than the number of down-regulated genes in the ‘metabolism’ pathway. Most genes were up-regulated in ‘nucleotides’ and ‘amino acids’, while most genes were down-regulated in ‘terpenes’, ‘flavonoids’, and ‘secondary metabolism’ (Figure 4a). In contrast to ‘metabolism’, most genes in ‘photosynthesis’ were down-regulated, especially in ‘Calvin cycle’ and ‘photorespiration’ in L1710 compared with O. sativa (Figure S4a). The expression patterns of genes related to ‘metabolism’ and ‘photosynthesis pathways’ in the L1710/O. longistaminata comparison were essentially the same as those in the L1710/O. sativa comparison (Figure 4b, Figure S4b). The main difference was that the number of down-regulated genes in the L1710/O. longistaminata comparison was slightly increased. Similar change patterns of DEGs in ‘metabolism’ were found in L1817 (Figure S5a,b) and L1730 compared with their parents (Figure S5c,d). The majority of ‘photosynthesis’ genes were up-regulated in L1817 (Figure S4c,d) and L1730 (Figure S4e,f), especially in L1730, which as contrary to that seen for L1710.

3.5. DEGs in Progeny/Parent Comparisons Involve Many Transcription Factor (TF) Gene Families

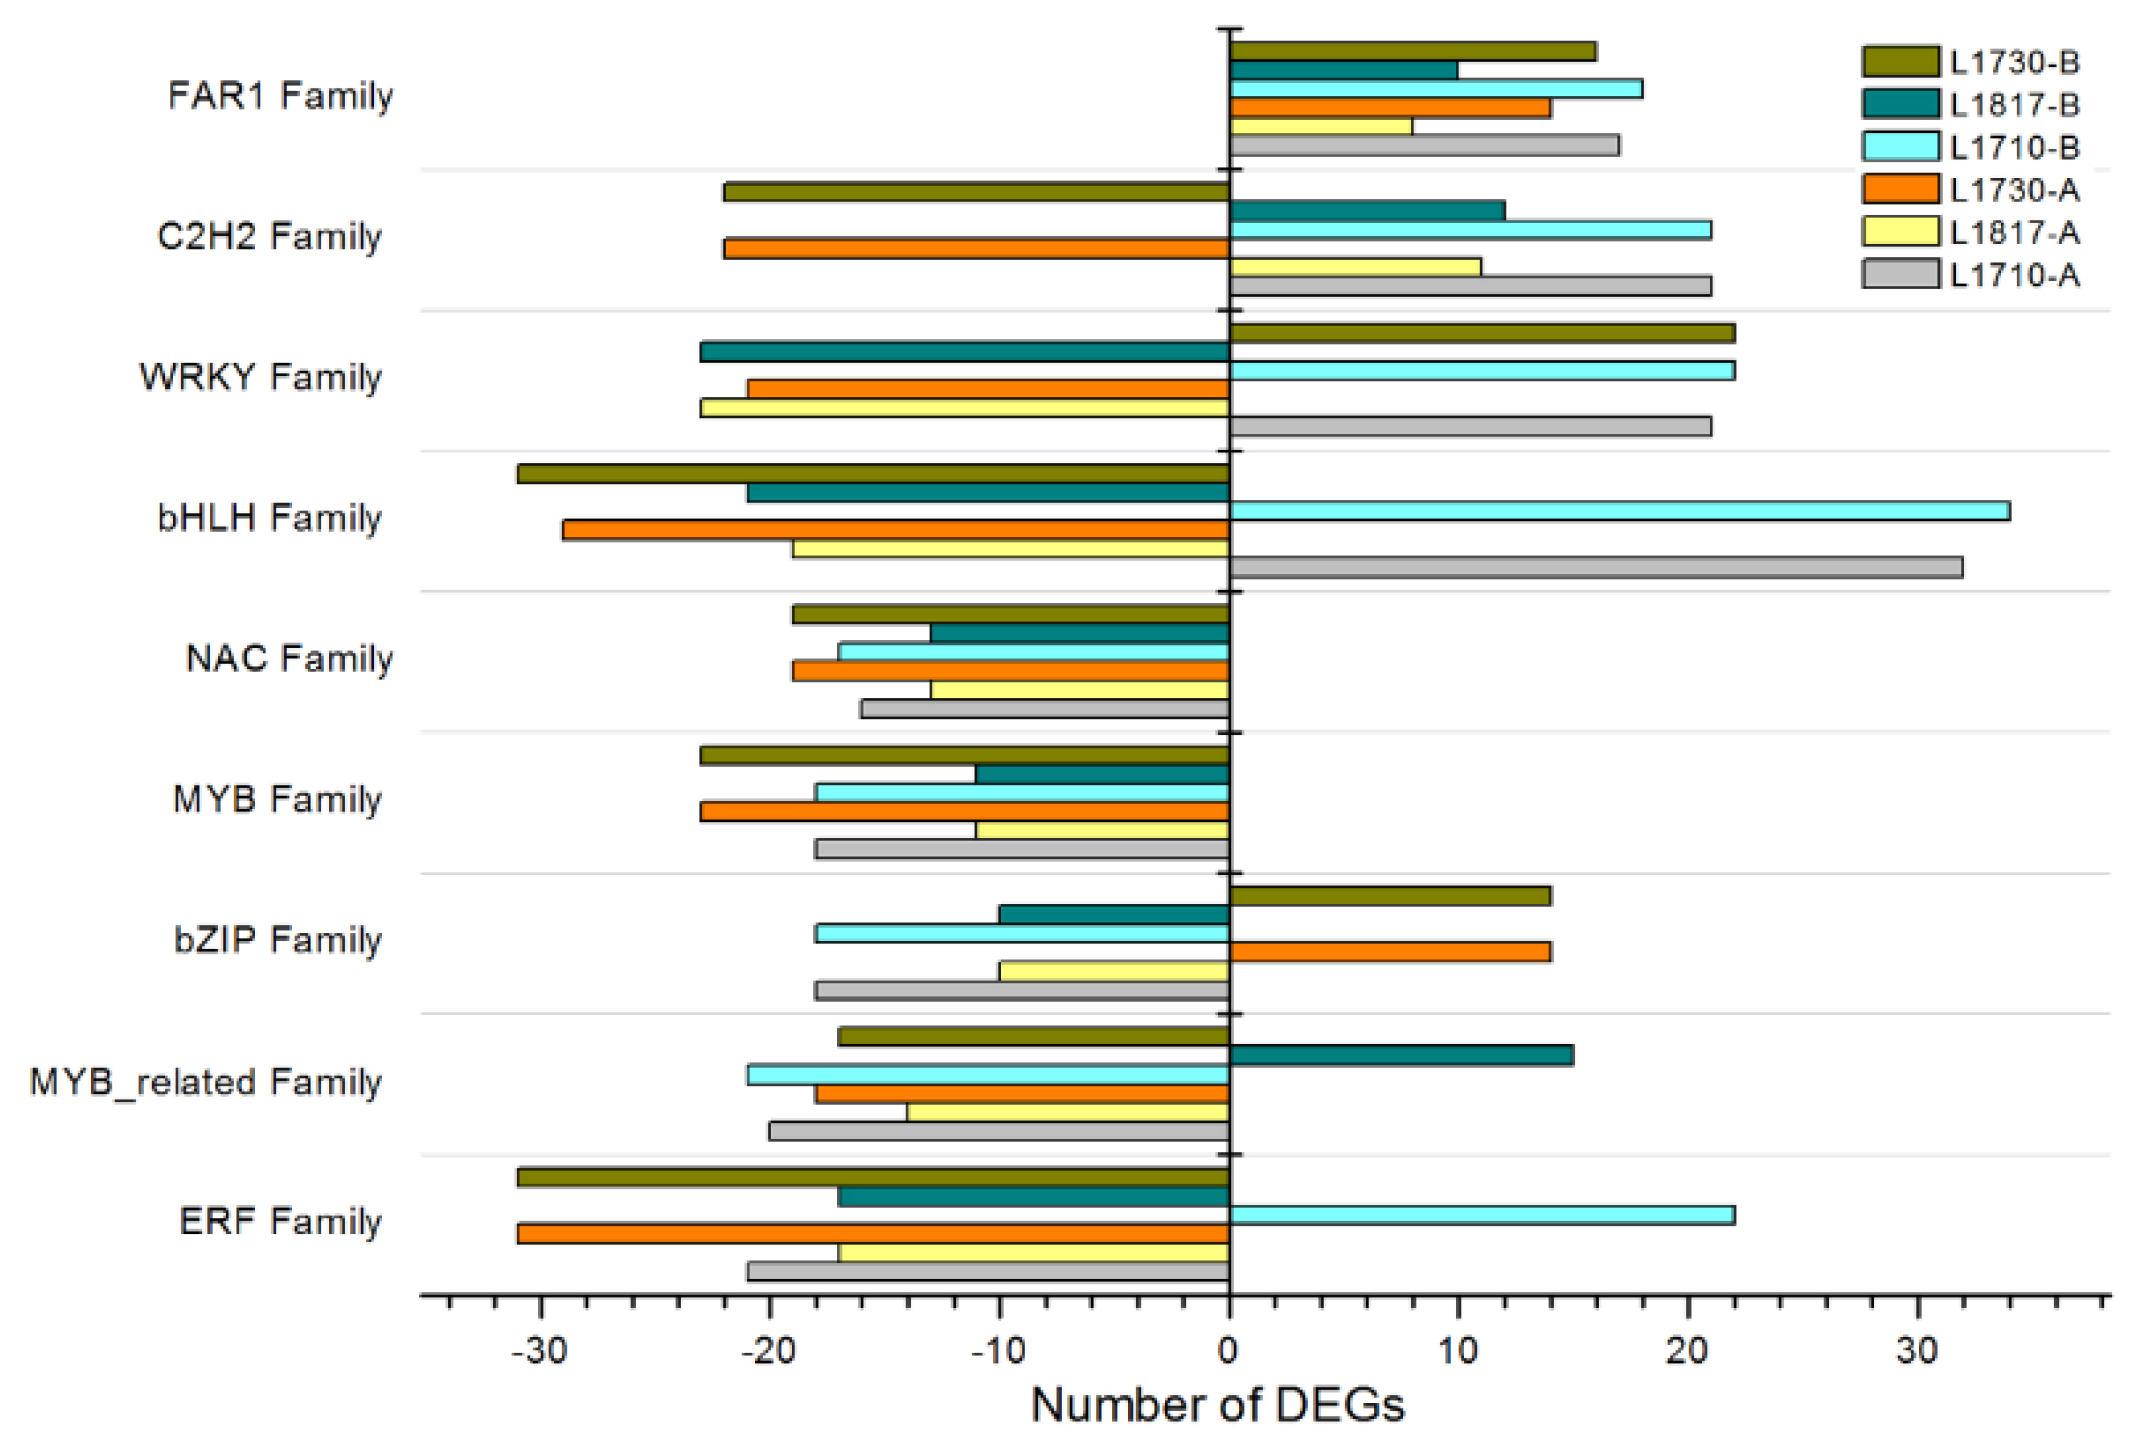
To identify TF gene expression changes in the five lines, rice TF genes were queried through the TF database (http://planttfdb.cbi.pku.edu.cn/index.php?sp=Osj). In total, 328 DEGs in L1710, 227 DEGs in L1817 and 335 DEGs in L1730 were identified to be putative TF genes. Differentially expressed TF genes could be classified into 40 (L1710), 38 (L1817) and 40 (L1730) TF families from the 58 TF families in the database (Table S11). Among the mapped TF gene families, C2H2 family, ERF family, MYB family, MYB-related family, NAC family, WRKY family, bHLH family and bZIP family were statistically significant differences in the number of DEGs (p < 0.01) in three progenies compared with their parents. Most of those TF gene families were closely related with the DNA binding and the development of plants, and several families were involved in many diverse functions in cellular processes, such as hormonal signal transduction, response to biotic and abiotic stresses, regulation of metabolism. NAC family genes are widely expressed in different tissues of rice and play important roles in the regulation of plant growth and response to stimulus through participating in the metabolism of plant hormones and cell wall. The expression levels of the NAC family in L1817 were both close to the parent expression levels (Figure 5). Additionally, the expression of OsNAC29 (LOC_Os08g02300), OsNAC31 (LOC_Os08g01330) and OsNAC2 (LOC_Os04g38720) were up-regulated in progenies.

3.6. Most miRNAs Were Co-Expressed in the Three Progenies and Their Parents

In total, nearly 12.33 million (L1710), 11.93 million (L1817), 11.96 million (L1730), 12.49 million (O. sativa) and 11.69 million (O. longistaminata) small RNA reads were obtained. After removing adaptor contaminations and low-quality reads, a total of 59.52 million reads were identified as clean reads from the five lines (Table S12). Among the sRNAs, 91.12% in L1710, 93.30% in L1817, 90.66% in L1730, 90.92% in O. sativa and 94.74% in O. longistaminata were 20–24 nt in length, with 21 and 24 nt as the primary size (Figure S6a). All of the clean reads were then mapped to small RNA databases and clustered into 10 RNA classes, including siRNA, piRNA, tRNA, miRNA, rRNA, snRNA, snoRNA, repeat-associated sRNA and degraded tags of exons or introns and an unannotated group (Table S12). Among all of the sRNA reads from the five lines, 4,169,035 (L1710), 3,733,827 (L1817), 3,164,348 (L1730), 4,243,010 (O. sativa) and 2,708,267 (O. longistaminata) were identified as miRNA reads.
A total of 513 miRNAs were detected in five lines, of which 428 miRNAs were detected in L1710, 424 in L1817, 436 in L1730, 398 in O. sativa and 383 in O. longistaminata. Among all the expressed miRNAs, 293 were co-expressed in five lines, and the number of co-expressed in each progeny and O. sativa was twice that of those co-expressed in each progeny and O. longistaminata (Figure S6b). In addition, 9 (L1710), 5 (L1817), 12 (L1730), 7 (O. sativa) and 22 (O. longistaminata) miRNAs were specifically expressed. The majority of the expressed miRNAs were shared among the five lines, and specifically expressed miRNAs were most abundant in O. longistaminata, which was a similar result to that of the gene expression. The co-expressed miRNAs from the five lines demonstrate that there is conserved expression among the five lines. Moreover, the frequency of co-expressed genes in leaf tissue is the same as that in the stem tissue [24]. The relative expression levels of the majority of miRNAs were detected from a read count frequency of less than 100 reads (64.39–66.51%), and 9.40% to 10.61% of miRNA expression levels were greater than 10,000 reads in the five lines (Figure S6c).

3.7. Expression of miRNA Showed ELD in Three Progenies

To accurately compare miRNA expression patterns in the three progenies and their parents, the miRNA read counts were normalized to TPM. The normalized miRNA data were then used to determine the differentially expressed miRNAs. The accuracy of the miRNA sequencing was also verified by qRT-PCR (Figure S7). As a result, 12.56–15.43% of miRNAs were differentially expressed (log2 ratio ≥ 1, p ≤ 0.05) in the three progeny/O. sativa comparisons, and 77.46–90.91% of the miRNAs were up-regulated (Figure 6a). However, 42.02–45.21% of miRNAs were differentially expressed, and there were more down-regulated miRNAs than up-regulated miRNAs in the three progeny/O. longistaminata comparisons (Figure 6b). Furthermore, we found 25.35% to 29.82% of the differentially expressed miRNAs in the three progeny/O. sativa comparisons, and 37.26% to 39.17% of the differentially expressed miRNAs in the three progeny/O. longistaminata comparisons that had a fold change ≥ 16. This finding shows that not only the number but also the magnitude of the fold change of the differentially expressed miRNAs in the progeny/O. longistaminata comparisons was greater than that in the progeny/O. sativa comparisons.
The differentially expressed miRNAs were categorized into twelve expression patterns in three progenies. As a result, more than three-quarters of the differentially expressed miRNAs showed parental ELD (Figure S8a). The percentage of ELD-A miRNAs (70.12–75.00%) significantly exceeded that of the ELD-A genes (42.12–50.59%), and the percentage of ELD-B miRNAs (9.54–12.28%) was less than that of the ELD-B genes (33.23–36.97%) in the three progenies (Table S5). Next, we compared the significance between ELD gene and miRNA expression using a paired-sample t-test. The results showed that the percentage of ELD-A genes and miRNAs was significantly different (p ≤ 0.05), and the percentage of ELD-B genes and miRNAs was also significantly different (p ≤ 0.01), indicated that the ELD degree of the miRNAs was more prominent than the genes in the three progenies. Furthermore, the number of down-regulated ELD-A miRNAs was much greater than that of the up-regulated ELD-A miRNAs, while the ELD-B miRNAs showed an opposite trend in the three progenies. Among the transgressive regulated miRNAs, the number of up-regulated miRNAs was greater than that of down-regulated miRNAs. Additionally, most ELD-A miRNAs (103) were commonly shared among the three progenies, and most of these were down-regulated (Figure S8b). In contrast, only one ELD-B miRNA was commonly shared among the three progenies, which was up-regulated in most cases (Figure S8c). The proportions of the ELD miRNAs in each progeny were roughly the same, indicated the miRNA expression tendency might be influenced by their genome dosage. In addition, most commonly expressed ELD-A miRNAs were down-regulated among three progenies meant that the introgression of wild rice genome might inhibit the expression of miRNAs, which may contribute to the up-regulated expression of ELD-A genes.

3.8. miRNAs Exhibit Biological Functions through Target Genes

Gene expression levels are mainly determined by the relative rates of transcription and RNA degradation. The small RNA post-transcriptionally regulated mechanisms are complicated gene expression regulation factors and are affected by many other aspects. To elucidate possible functions of the miRNAs, the target genes of all expressed miRNAs were predicted by using two software (psRobot and Target Finder) programs. In total, 5995 (L1710), 5724 (L1817), 5700 (L1730), 5722 (O. sativa) and 5871 (O. longistaminata) genes were predicted to be target genes. Of these, an average of 1456 genes and 4412 genes were predicted to be target genes of differentially expressed miRNAs in the three progenies compared with O. sativa and O. longistaminata, respectively (Table S13). More than 2500 genes were identified as target genes of ELD-A miRNAs, and more than 500 genes were identified as target genes of ELD-B miRNAs in the three progenies (Table S14).
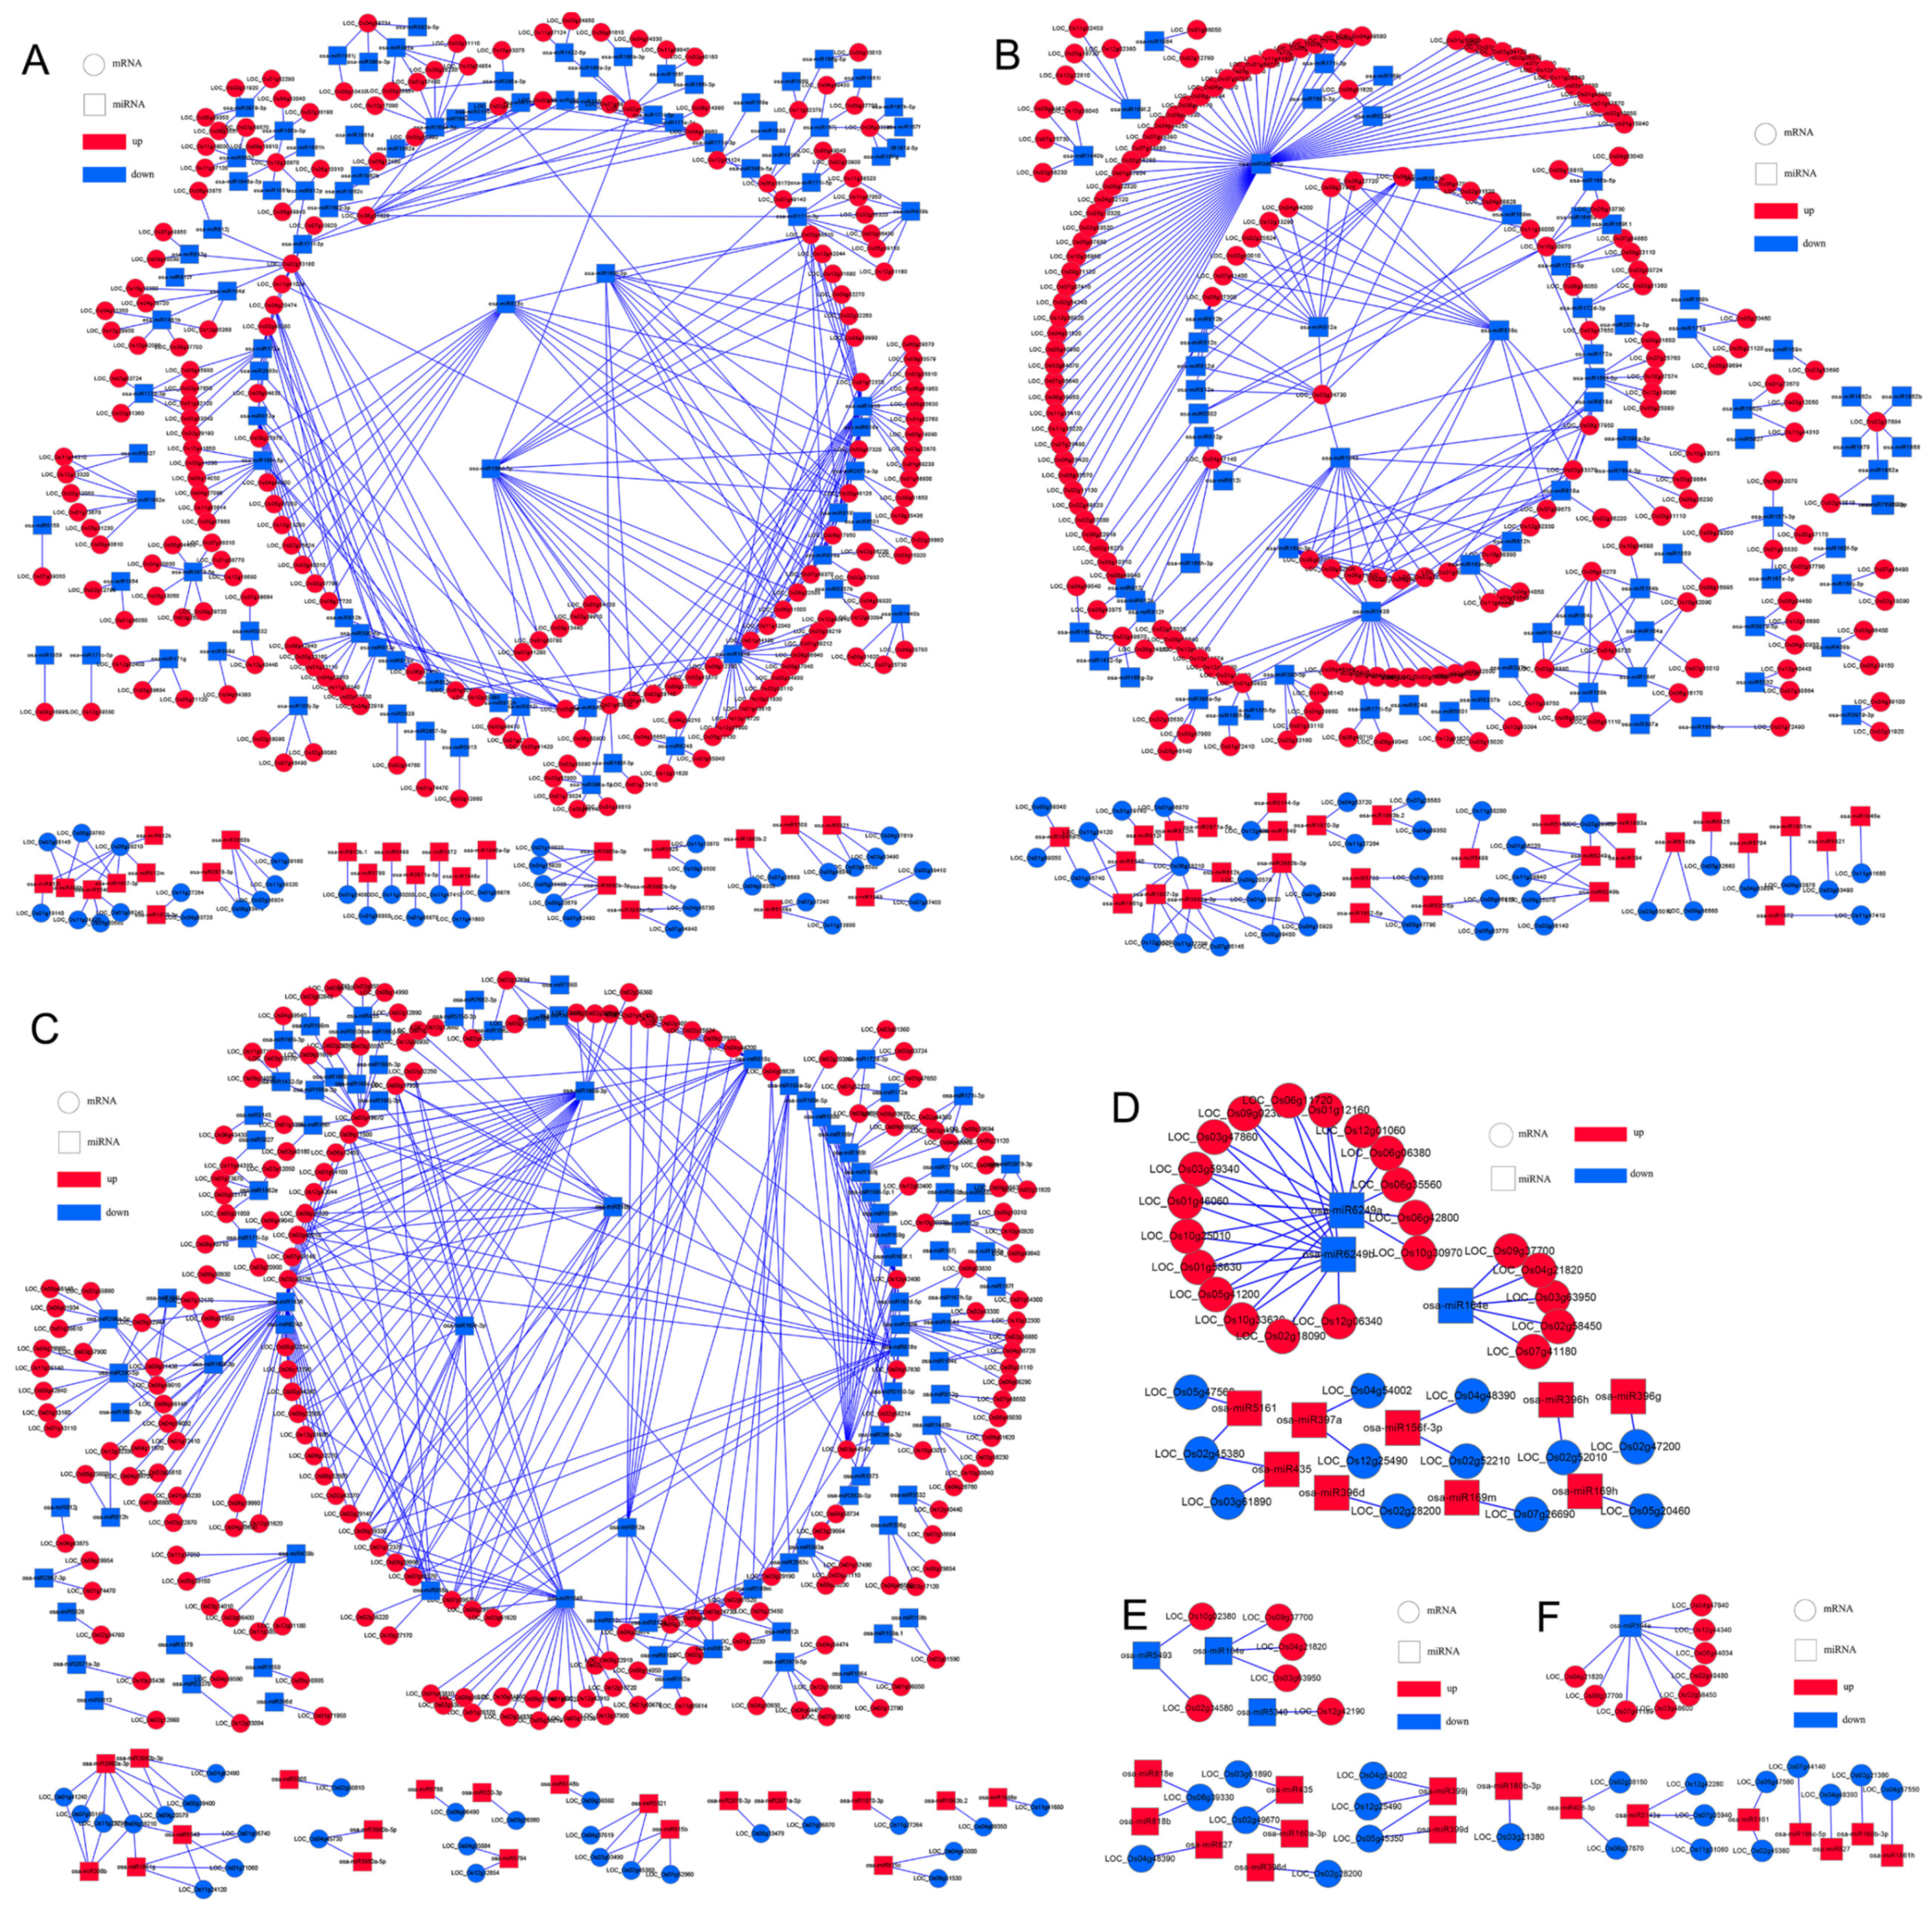
Among the target genes of the differentially expressed miRNAs, we focused on the CTGs that were inversely expressed related to the miRNAs. A gene was defined as a CTG if its expression pattern was opposite to that of the miRNA. Among the target genes of up-regulated miRNAs, down-regulated genes were regarded as CTGs. Similarly, up-regulated genes were regarded as CTGs of the down-regulated miRNAs. In total, 64 (L1710), 21 (L1817) and 62 (L1730) genes were regarded as CTGs in progenies compared with O. sativa, and 271 (L1710), 252 (L1817) and 259 (L1730) genes were categorized as CTGs in the progenies compared with O. longistaminata (Table S13). Of the miRNAs that contained CTGs, the number of CTGs of down-regulated miRNAs was far greater than that of the up-regulated miRNAs in the three progenies compared with parents, except in L1817 when compared with O. sativa. Among the parental ELD miRNAs, 132 (L1710), 123 (L1817) and 123 (L1730) ELD miRNAs were detected possessing CTGs (Figure 7). In addition, the majority of parental ELD miRNAs showed ELD-A and down-regulated expression patterns with more than one CTG. For example, osa-miR1436, osa-miR1848, osa-miR169r-3p, the osa-miR812 family and the osa-miR818 family contained more than 10 CTGs, and their expression levels were lower in the three progenies than in their parents (Figure 7). In addition, the osa-miR812 family were ELD-A miRNAs, and most were down-regulated in the three progenies, but osa-miR812m, osa-miR812l and osa-miR812k were up-regulated in L1710 and L1817. Among the up-regulated ELD-A miRNAs, osa-miR3980a and osa-miR3980b contained 4 to 7 CTGs in the three progenies. The number of ELD-B miRNAs with CTGs was not large, and most of them contained fewer than three CTGs and were up-regulated in the three progenies. The above results meant that the down-regulated miRNAs regulated more genes expression than the up-regulated miRNAs, indicated that the expressed regulation of some genes were through inhibited the expression of miRNAs in the progenies.
To determine the function annotation of the target genes of the differentially expressed miRNAs in each progeny, GO analysis of the miRNA CTGs was carried out to find the GO terms that were associated with these CTGs. In this study, the CTGs of differentially expressed miRNAs in the three progenies compared with O. sativa were enriched in 6 (L1710), 2 (L1817) and 1 (L1730) GO terms (Figure S9a–c), while those in the three progenies compared with O. longistaminata were enriched in 16 (L1710), 1 (L1817) and 16 terms (L1730) (Figure S9d–f). Moreover, CTGs of miRNAs were enriched in ‘oxygen binding’ in the three progeny/O. longistaminata comparisons, which was consistent with the GO analysis of DEGs in the three progeny/O. longistaminata comparisons. We found that miRNA CTGs were enriched in 8 GO terms that were also enriched in the DEGs analysis in L1710 and L1730 compared with O. longistaminata (Figure S9, Table S6). Among these target genes, OsJAR2 (LOC_Os01g12160) participated in 6 terms and was the CTG of osa-miR6249a (Table S15). The expression of osa-miR6249a was down-regulated in the L1730/parent comparisons and L1710/O. sativa comparison, but up-regulated in L1817 compared with O. longistaminata. OMTN1 (LOC_Os02g36880), OMTN2 (LOC_Os04g38720) and OMTN4 (LOC_Os06g46270), which were associated with ‘nucleotide binding’, were the CTGs of the osa-miR164 family, osa-miR169k and osa-miR1861b, respectively. OsKOL4 (LOC_Os06g37300) was involved in seven terms, and it was targeted by osa-miR812a. OVP3 (LOC_Os02g55890) was related to resistance, and it was the CTG of osa-miR396a-5p. Moreover, the expression levels of osa-miR812a, osa-miR1864 and osa-miR396a-5p showed ELD-A and down-regulated expression patterns in the three progenies. These indicated that the CTGs of miRNAs were involved in various biological processes, and individual miRNA could modulate multiple target genes, therefore, the manipulation of a single miRNA could affect multiple biological processes.

4. Discussion

4.1. miRNA Expression Was More Susceptible than Gene Expression to the Effect of Genomic Composition in Backcrossed Progenies

Hybridization and backcrossing are common in plants. Recently, many studies have explored the possible molecular basis for the phenotype variation of progenies in the gene and miRNA expression levels [16,17,19,21,38]. It has been widely reported that gene expression is influenced by parental inheritance in hybrids, and that maternal inheritance is more prominent than paternal inheritance [16,18,19]. There were more DEGs and differentially expressed miRNAs in a comparison of Brassica hexaploid/B. rapa (male) than in Brassica hexaploid/B. carinata (female), which may be attributed to the genome composition being primarily inherited from the female parent in Brassica hexaploid [16,19]. In this research, the number of DEGs and differentially expressed miRNAs in the progeny/O. longistaminata comparisons were much greater than that in the progeny/O. sativa comparisons. Additionally, a high proportion of genes and miRNAs showed parental ELD, and most of them showed ELD to O. sativa. This is consistent with our previous study on the stem tissues of the three progenies [24]. However, the percentage of miRNAs showing ELD to O. sativa was significantly higher than that of genes, and the proportion of miRNAs showing ELD to O. longistaminata was significantly lower than that of genes. These results demonstrate that the expression of miRNAs may be more susceptible to chromosome complements compared with gene expression in the leaf tissues of rice.
Previous studies have indicated that phenotypic traits and gene expression in progeny are influenced not only by parental inheritance (especially the maternal inheritance) but also by a variety of chromosome complements. In nascent hexaploid wheat, progeny genes participating in development showed expression levels close to that of T. turgidum, while genes with similar expression to Ae. tauschii were involved in adaptation [21]. Approximately half of the non-additive expressing genes, which were significantly enriched in photosynthesis-related pathways (photosynthesis and phenylpropanoid biosynthesis), showed paternal dominance in interspecific triploid hybrid rice [20]. In our study, CTGs of differentially expressed miRNAs were involved in ‘response to stimulus’ in L1710 and L1730 compared with O. longistaminata, and genes participating in ‘response to stimulus’ and ‘catalytic activity’ showed ELD to O. sativa in the three progenies. For example, OVP3 was involved in ‘response to stress’ and ‘response to stimulus’ and it was the target gene of osa-miR396a-5p that showed ELD to O. sativa. These results suggest that the genes and miRNAs that exhibit ELD to O. sativa in leaf tissues of progenies may participate mainly in adaption.
The growth of green plants solely depends on their own photosynthetic and metabolic capacity; thus, we analyzed the gene expression profiles involved in photosynthesis. The results revealed that the introgression of wild rice might lead to changes in many biological functions in the progenies relative to O. sativa. In addition, many DEGs involved in photosynthesis-related pathways showed parental ELD, and most of them showed ELD to O. longistaminata in the three progenies. The WSL3 gene encodes an essential subunit of the rice PEP complex, which is indispensable for the early chloroplast development by interacting with the PEP complex [39]. PGL encodes chlorophyllide oxygenase 1, and it is activated in the light-dependent chlorophyll synthesis process in chlorenchyma [40]. In this study, the expression of the WSL3 and PGL genes showed ELD to O. longistaminata. The photoprotective protein PsbS controls the assimilation rate of CO2 in fluctuating light conditions in rice [41]. Hexokinase (HXK) is a dual-function enzyme that plays an essential part in sugar sensing and signaling by catalyzing the phosphorylation of hexose, converting it to hexose 6-phosphate [42]. In this study, the expression of psbS1, psbS2, OsHXK2 and OsHXK7 showed ELD to O. longistaminata. These genes may have important roles in photosynthesis at the jointing–booting stage in leaves of the three progenies.

4.2. Regulation via miRNA Expression Likely Increases Abiotic Stress Responses and Adaptation in Backcrossed Progenies

Thus far, many miRNAs have been demonstrated to function by regulating transcription factors in plants, and they play important roles in the plant development, stress adaptation, and hormone signaling [43,44,45]. The NAC gene family, which encodes plant-specific transcription factors with a consensus NAC domain, is involved in various biological processes and is widely distributed in different tissues of rice [44,45,46]. NAC genes, which are conserved target genes of miR164, may act as negative regulators during drought tolerance [44]. OsNAC2 as a key regulating gene of the GA pathway and acts as a negative regulator of plant height and flowering time in rice [45]. NAC31, a member of the NAC transcription factor gene family, is the primary transcription factor gene for secondary wall formation [47]. In the present study, OsNAC2 was found to be a CTG of the osa-miR164 family, osa-miR169k and osa-miR1861b, and its expression was up-regulated in the three progenies compared with their parents. The up-regulated OsNAC31 gene was a CTG of osa-miR396 in L1817 and L1730. Another class of proteins, the OMTN proteins, have typical NAC transcriptional factor characteristics, and OMTN genes have highly conserved recognition sites for miR164 [44]. Moreover, the OMTN genes are responsive to abiotic stress, and the overexpression of OMTN2, OMTN3 and OMTN4 have negative effects on drought resistance in rice [44]. In our results, the OMTN genes were up-regulated in the leaves of backcrossed progenies; OMTN1 was up-regulated in L1817 and L1730, and OMTN2 and OMTN4 were up-regulated in all three progenies. Furthermore, OMTN1, OMTN2 and OMTN4 were CTGs of the osa-miR164 family, osa-miR169k and osa-miR1861b. These results indicate that not only the osa-miR164 family, but also osa-miR169k and osa-miR1861b might participate in abiotic stress regulation in the leaves of progenies.
Some miRNAs regulate adaptation in plants by targeting genes related to plant development, stress adaptation, and hormone signaling. Wakuta et al. [48] suggested that OsJAR2, which catalyzes the synthesis of JA-Ile, is involved in the activation of JA signaling in response to wounding in rice. In our study, OsJAR2, which is involved in ‘response to stress’ and ‘signaling’, was the target gene of osa-miR6249a. We speculate that osa-miR6249a might participate in the regulation of JA-Ile synthesis and response to stress. The OsKOL4 gene can efficiently promote the synthesis of intermediates in the biosynthesis of the oryzalexin and phytocassane families, which are rice antifungal phytoalexins [49]. Our results show that the up-regulated OsKOL4 gene was involved in ‘oxygen binding’ and ‘response to stimulus’ in the three progenies and it was the CTG of osa-miR812a. The coherent targets of miRNAs studied here participated in multiple pathways, including ‘response to stress’, ‘signaling’, ‘oxygen binding’ and ‘response to stimulus’. These miRNAs might regulate stress-related gene expression in cooperation with other regulatory mechanisms and play important roles in developmental pathways, which contribute to the adaptation of rice backcrossing progenies.

5. Conclusions

The integrative analysis of the mRNAs and small RNAs was carried out to investigate gene expression and regulation mechanisms in the leaf tissues of three progenies (BC2F12) compared with their parents. The expression patterns of the majority of genes and miRNAs showed ELD to recurrent parent, especially the expression patterns of the miRNAs, which indicated that miRNA expression was more sensitive to the parental genome components. In the three progenies, the genes and miRNAs that displayed expression dominance to O. sativa may be participating mainly in adaptation, and genes showing expression dominance to O. longistaminata are involved in photosynthesis-related pathways. Finally, we found that the expression of some genes and miRNAs might increase the possibility for abiotic stress responses and adaptation in the three progenies. In addition to the results from the stem tissue study, the genes, miRNAs and biological processes of leaf tissue identified here further broaden our understanding of the molecular mechanisms of gene introgression, and the results may be beneficial for future studies on the complex gene expression regulation in progenies after interspecific hybridization and backcross processes in plants.

Supplementary Materials

The following are available online at https://www.mdpi.com/2073-4395/10/9/1381/s1, Figure S1: The analysis of co-expressed genes in the five lines. (a) Venn diagram analysis of co-expressed and specially expressed genes. (b) GO analysis of co-expressed genes, Figure S2: Validation of DEGs obtained from deep sequencing via quantitative RT-PCR. Actin1 was used as an internal reference gene. The blue polylines were derived from the RNA-Seq data, Figure S3: Significantly changed GO terms of ELD-A genes in L1710 (a), L1817 (b) and L1730 (c), and ELD-B genes in L1710 (d), L1817 (e) and L1730 (f). A and B indicate O. sativa and O. longistaminata, respectively. GO terms with FDR ≤ 0.05 are denoted by one star; GO terms with FDR ≤ 0.01 are denoted by two stars, Figure S4: MapMan overview of photosynthesis pathways in L1710 (a), L1817 (c) and L1730 (e) compared with O. sativa, and those in L1710 (b), L1817 (d) and L1730 (f) compared with O. longistaminata. Each square indicates one gene, and the color key indicates the value of RPKM normalized log2. Red color indicates up-regulated and the green color indicates down-regulated, Figure S5: MapMan overview of cellular metabolism in L1817 (a) and L1730 (c) compared with O. sativa, and those in L1817 (b) and L1730 (d) compared with O. longistaminata, Figure S6: Characteristics of small RNAs and expression of miRNAs in five lines. (a) The length distribution of small RNAs in the five libraries. (b) Co-expressed and specifically expressed miRNAs in the five libraries. (c) Distribution of miRNA abundance in the five lines, Figure S7: Validation of differentially expressed miRNAs obtained from deep sequencing via quantitative RT-PCR. U6 snRNA was used as a reference small RNA. The blue polylines were derived from RNA-Seq data, Figure S8: (a) Twelve patterns of miRNAs in the three progenies. Venn diagram of ELD-A miRNAs (b) and ELD-B miRNAs (c) in the three progenies. A and B indicate O. sativa and O. longistaminata, respectively. Red font indicates up-regulated, and blue font indicates down-regulated, Figure S9: GO analysis of coherent target genes of differentially expressed miRNAs in three progenies. GO terms in L1710 (a), L1817 (b) and L1730 (v) compared with O. sativa. GO terms in L1710 (d), L1817 (e) and L1730 (f) compared with O. longistaminata, Table S1: The mRNA primers designed for real-time quantitative PCR, Table S2: The miRNA primers designed for reverse-transcription and real-time quantitative PCR, Table S3: Summary of mRNA sequencing reads in the five libraries, Table S4: Distribution of the gene sequence lengths in the five libraries, Table S5: Percentage of the five categories in the three progenies, Table S6: Significantly changed GO terms of the DEGs in the three progenies compared with their parents, Table S7: Significantly changed GO terms of up-regulated and down-regulated genes in the three progenies compared with their parents, Table S8: Significantly changed GO terms of ELD genes in the three progenies, Table S9: KEGG pathways enriched in DEGs in the three progenies compared with their parents, Table S10: Patterns of DEGs involved in photosynthesis-related pathways in the three progenies, Table S11: Number of DEGs of transcription factor (TF) families in the three progenies, Table S12: Category distribution of small RNAs in the five libraries, Table S13: Differentially expressed miRNAs and their target genes in three progenies, Table S14: Number of target genes of ELD miRNAs in the three progenies, Table S15: GO terms of coherent target genes of differentially expressed miRNAs. The clean data have been submitted to the NCBI Sequence Read Archive Database. The accession numbers are SRR5682126, SRR5682127, SRR5682129, SRR5682132, SRR5682131, SRR5684399, SRR5684400, SRR5684401, SRR5684402 and SRR5684418 (http://trace.ncbi.nlm.nih.gov/Traces/sra/sra.cgi?view=run_browser).

Author Contributions

Conceptualization, J.W. and A.C.; methodology, A.C.; software, A.C. and R.W.; validation, R.W. and A.C.; formal analysis, A.C.; data curation, A.C. and R.W.; writing—original draft preparation, A.C.; writing—review and editing, J.W.; visualization, A.C.; supervision, J.W. All authors have read and agreed to the published version of the manuscript.

Funding

This research received no external funding.

Acknowledgments

The authors acknowledge Shaoqing Li for providing the plant materials.

Conflicts of Interest

The authors declare no conflict of interest.

References

  1. Ge, S.; Sang, T.; Lu, B.R.; Hong, D.Y. Phylogeny of rice genomes with emphasis on origins of allotetraploid species. Proc. Natl. Acad. Sci. USA 1999, 96, 14400–14405. [Google Scholar] [CrossRef] [PubMed] [Green Version]
  2. Tanksley, S.D.; McCouch, S.R. Seed banks and molecular maps: Unlocking genetic potential from the wild. Science 1997, 277, 1063–1066. [Google Scholar] [CrossRef] [PubMed] [Green Version]
  3. Zhang, Y.; Zhang, S.; Liu, H.; Fu, B.; Li, L.; Xie, M.; Song, Y.; Li, X.; Cai, J.; Wan, W.; et al. Genome and comparative transcriptomics of African wild rice Oryza longistaminata provide insights into molecular mechanism of rhizomatousness and self-incompatibility. Mol. Plant 2015, 8, 1683–1686. [Google Scholar] [CrossRef] [PubMed] [Green Version]
  4. Hu, F.Y.; Tao, D.Y.; Sacks, E.; Fu, B.Y.; Xu, P.; Li, J.; Yang, Y.; Mcnally, K.; Khush, G.S.; Paterson, A.H.; et al. Convergent evolution of perenniality in rice and sorghum. Proc. Natl. Acad. Sci. USA 2003, 100, 4050–4054. [Google Scholar] [CrossRef] [Green Version]
  5. Chen, Z.W.; Hu, F.Y.; Xu, P.; Li, J.; Deng, X.N.; Zhou, J.W.; Li, F.; Chen, S.N.; Tao, D.Y. QTL analysis for hybrid sterility and plant height in interspecific populations derived from a wild rice relative, Oryza longistaminata. Breed. Sci. 2009, 59, 441–445. [Google Scholar] [CrossRef] [Green Version]
  6. He, R.; Salvato, F.; Park, J.J.; Kim, M.J.; Nelson, W.; Balbuena, T.S.; Willer, M.; Crow, J.A.; May, G.D.; Soderlund, C.A.; et al. A systems-wide comparison of red rice (Oryza longistaminata) tissues identifies rhizome specific genes and proteins that are targets for cultivated rice improvement. BMC Plant Biol. 2014, 14, 46. [Google Scholar] [CrossRef] [Green Version]
  7. Xu, P.; Dong, L.Y.; Zhou, J.W.; Li, J.; Zhang, Y.; Hu, F.Y.; Liu, S.F.; Wang, Q.; Deng, W.; Deng, X.N.; et al. Identification and mapping of a novel blast resistance gene Pi57 (t) in Oryza longistaminata. Euphytica 2015, 205, 95–102. [Google Scholar] [CrossRef]
  8. Moumeni, A.; Satoh, K.; Venuprasad, R.; Serraj, R.; Kumar, A.; Leung, H.; Kikuchi, S. Transcriptional profiling of the leaves of near-isogenic rice lines with contrasting drought tolerance at the reproductive stage in response to water deficit. BMC Genom. 2015, 16, 1110. [Google Scholar] [CrossRef] [Green Version]
  9. Xu, Q.; Zheng, T.Q.; Hu, X.; Cheng, L.R.; Xu, J.L.; Shi, Y.M.; Li, Z.Q. Examining two sets of introgression lines in rice (Oryza sativa L.) reveals favorable alleles that improve grain Zn and Fe concentrations. PLoS ONE 2015, 10, e0131846. [Google Scholar] [CrossRef]
  10. Chen, C.; He, W.; Nassirou, T.Y.; Zhou, W.; Yin, Y.; Dong, X.; Rao, Q.; Shi, H.; Zhao, W.; Efisue, A.; et al. Genetic diversity and phenotypic variation in an introgression line population derived from an interspecific cross between Oryza glaberrima and Oryza sativa. PLoS ONE 2016, 11, e0161746. [Google Scholar] [CrossRef]
  11. Ma, X.; Fu, Y.; Zhao, X.; Jiang, L.; Zhu, Z.; Gu, P.; Xu, W.Y.; Su, Z.; Sun, C.Q.; Tan, L.B. Genomic structure analysis of a set of Oryza nivara introgression lines and identification of yield-associated QTLs using whole-genome resequencing. Sci. Rep. 2016, 6, 27425. [Google Scholar] [CrossRef] [PubMed]
  12. Wang, Z.Q.; Shi, H.R.; Yu, S.F.; Zhou, W.L.; Li, J.; Liu, S.H.; Deng, M.; Ma, J.; Wei, Y.M.; Zheng, Y.L.; et al. Comprehensive transcriptomics, proteomics, and metabolomics analyses of the mechanisms regulating tiller production in low-tillering wheat. Theor. Appl. Genet. 2019, 132, 2181–2193. [Google Scholar] [CrossRef] [PubMed]
  13. Kimbembe, R.E.R.; Li, G.Y.; Fu, G.F.; Feng, B.H.; Fu, W.M.; Tao, L.X.; Chen, T.T. Proteomic analysis of salicylic acid regulation of grain filling of two near-isogenic rice (Oryza sativa L.) varieties under soil drying condition. Plant Physiol. Biochem. 2020, 151, 659–672. [Google Scholar] [CrossRef] [PubMed]
  14. Yang, X.H.; Xia, X.Z.; Zeng, Y.; Nong, B.X.; Zhang, Z.Q.; Wu, Y.Y.; Tian, Q.L.; Zeng, W.Y.; Gao, J.; Zhou, W.Y.; et al. Genome-wide identification of the peptide transporter family in rice and analysis of the PTR expression modulation in two near-isogenic lines with different nitrogen use efficiency. BMC Plant Biol. 2020, 20, 193. [Google Scholar] [CrossRef] [PubMed]
  15. Moumeni, A.; Satoh, K.; Kondoh, H.; Asano, T.; Hosaka, A.; Venuprasad, R.; Serraj, R.; Kumar, A.; Leung, H.; Kikuchi, S. Comparative analysis of root transcriptome profiles of two pairs of drought-tolerant and susceptible rice near-isogenic lines under different drought stress. BMC Plant Biol. 2011, 11, 174. [Google Scholar] [CrossRef] [Green Version]
  16. Zhao, Q.; Zou, J.; Meng, J.; Mei, S.; Wang, J. Tracing the transcriptomic changes in synthetic trigenomic allohexaploids of Brassica using an RNA-Seq approach. PLoS ONE 2013, 8, e68883. [Google Scholar] [CrossRef] [Green Version]
  17. Zhai, R.; Feng, Y.; Wang, H.; Zhan, X.; Shen, X.; Wu, W.; Zhang, Y.; Chen, D.; Dai, G.; Yang, Z.; et al. Transcriptome analysis of rice root heterosis by RNA-Seq. BMC Genom. 2013, 14, 19. [Google Scholar] [CrossRef] [Green Version]
  18. Huang, S.; Zhang, Y.; Ge, L.; Wang, L. Genome-wide transcriptome profiles of rice hybrids and their parents. Int. J. Mol. Sci. 2014, 15, 20833–20845. [Google Scholar]
  19. Shen, Y.Y.; Zhao, Q.; Zou, J.; Wang, W.L.; Gao, Y.; Meng, J.L.; Wang, J.B. Characterization and expression patterns of small RNAs in synthesized Brassica hexaploids. Plant Mol. Biol. 2014, 85, 287–299. [Google Scholar] [CrossRef]
  20. Wu, Y.; Sun, Y.; Wang, X.; Lin, X.; Sun, S.; Shen, K.; Wang, J.; Jiang, T.T.; Zhong, S.L.; Xu, C.M.; et al. Transcriptome shock in an interspecific F1 triploid hybrid of Oryza revealed by RNA sequencing. J. Integr. Plant Biol. 2016, 58, 150–164. [Google Scholar] [CrossRef]
  21. Li, A.; Liu, D.; Wu, J.; Zhao, X.; Hao, M.; Geng, S.; Yan, J.; Jiang, X.; Zhang, L.; Wu, J.; et al. mRNA and small RNA transcriptomes reveal insights into dynamic homoeolog regulation of allopolyploid heterosis in nascent hexaploid wheat. Plant Cell 2014, 26, 1878–1900. [Google Scholar] [CrossRef] [PubMed] [Green Version]
  22. Wen, M.; Xie, M.; He, L.; Wang, Y.; Shi, S.; Tang, T. Expression variations of miRNAs and mRNAs in rice (Oryza sativa). Genome Biol. Evol. 2016, 8, 3529–3544. [Google Scholar] [CrossRef] [PubMed] [Green Version]
  23. Sarkar, D.; Maji, R.K.; Dey, S.; Sarkar, A.; Ghosh, Z.; Kundu, P. Integrated miRNA and mRNA expression profiling reveals the response regulators of a susceptible tomato cultivar to early blight disease. DNA Res. 2017, 24, 419–434. [Google Scholar] [CrossRef] [PubMed]
  24. Cao, A.; Jin, J.; Li, S.; Wang, J. Integrated analysis of mRNA and miRNA expression profiling in rice backcrossed progenies (BC2F12) with different plant height. PLoS ONE 2017, 12, e0184106. [Google Scholar] [CrossRef] [Green Version]
  25. Li, M.D.; Cao, A.Q.; Wang, R.H.; Li, Z.Y.; Li, S.Q.; Wang, J.B. Genome-wide identification and integrated analysis of lncRNAs in rice backcross introgression lines (BC2F12). BMC Plant Biol. 2020, 20, 300. [Google Scholar] [CrossRef]
  26. Kawahara, Y.; de la Bastide, M.; Hamilton, J.P.; Kanamori, H.; McCombie, W.R.; Ouyang, S.; Schwartz, D.C.; Tanaka, T.; Wu, J.Z.; Zhou, S.G.; et al. Improvement of the Oryza sativa Nipponbare reference genome using next generation sequence and optical map data. Rice 2013, 6, 4. [Google Scholar] [CrossRef] [Green Version]
  27. Li, R.Q.; Li, Y.R.; Kristiansen, K.; Wang, J. SOAP: Short oligonucleotide alignment program. Bioinformatics 2008, 24, 713–714. [Google Scholar] [CrossRef] [Green Version]
  28. Yang, L.Y.; Wu, Y.; Wang, W.L.; Mao, B.G.; Zhao, B.R.; Wang, J.B. Genetic subtraction profiling identifies candidate miRNAs involved in rice female gametophyte abortion. G3-Genes Genomes Genet. 2017, 7, 2281–2293. [Google Scholar] [CrossRef] [Green Version]
  29. Mortazavi, A.; Williams, B.A.; McCue, K.; Schaeffer, L.; Wold, B. Mapping and quantifying mammalian transcriptomes by RNA-Seq. Nat. Methods 2008, 5, 621–628. [Google Scholar] [CrossRef]
  30. Wang, L.K.; Feng, Z.X.; Wang, X.; Wang, X.W.; Zhang, X.G. DEGseq: An R package for identifying differentially expressed genes from RNA-seq data. Bioinformatics 2010, 26, 136–138. [Google Scholar] [CrossRef]
  31. Allen, E.; Xie, Z.; Gustafson, A.M.; Carrington, J.C. MicroRNA-directed phasing during trans-acting siRNA biogenesis in plants. Cell 2005, 121, 207–221. [Google Scholar] [CrossRef] [PubMed] [Green Version]
  32. Schwab, R.; Palatnik, J.F.; Riester, M.; Schommer, C.; Schmid, M.; Weigel, D. Specific effects of microRNAs on the plant transcriptome. Dev. Cell 2005, 8, 517–527. [Google Scholar] [CrossRef] [PubMed] [Green Version]
  33. Tian, T.; Liu, Y.; Yan, H.; You, Q.; Yi, X.; Du, Z.; Xu, W.; Su, Z. agriGO v2.0: A GO analysis toolkit for the agricultural community, 2017 update. Nucleic Acids Res. 2017, 45, W122–W129. [Google Scholar] [CrossRef] [PubMed]
  34. Jin, J.; Zhang, H.; Kong, L.; Gao, G.; Luo, J. PlantTFDB 3.0: A portal for the functional and evolutionary study of plant transcription factors. Nucleic Acids Res. 2014, 42, D1182–D1187. [Google Scholar] [CrossRef] [Green Version]
  35. Chen, C.; Ridzon, D.A.; Broomer, A.J.; Zhou, Z.; Lee, D.H.; Nguyen, J.T.; Barbisin, M.; Xu, N.L.; Mahuvakar, V.R.; Andersen, M.R.; et al. Real-time quantification of microRNAs by stem-loop RT-PCR. Nucleic Acids Res. 2005, 33, e179. [Google Scholar] [CrossRef]
  36. Gao, Y.; Xu, H.; Shen, Y.Y.; Wang, J.B. Transcriptomic analysis of rice (Oryza sativa) endosperm using the RNA-Seq technique. Plant Mol. Biol. 2013, 81, 363–378. [Google Scholar] [CrossRef]
  37. Yoo, M.J.; Szadkowski, E.; Wendel, J.F. Homoeolog expression bias and expression level dominance in allopolyploid cotton. Heredity 2012, 110, 171–180. [Google Scholar] [CrossRef] [Green Version]
  38. Li, Q.; Li, Y.; Moose, S.P.; Hudson, M.E. Transposable elements, mRNA expression level and strand-specificity of small RNAs are associated with non-additive inheritance of gene expression in hybrid plants. BMC Plant Biol. 2015, 15, 168. [Google Scholar] [CrossRef] [Green Version]
  39. Wang, L.; Wang, C.; Wang, Y.; Niu, M.; Ren, Y.; Zhou, K.; Zhang, H.; Lin, Q.; Wu, F.; Cheng, Z.; et al. WSL3, a component of the plastid-encoded plastid RNA polymerase, is essential for early chloroplast development in rice. Plant Mol. Biol. 2016, 92, 581–595. [Google Scholar] [CrossRef]
  40. Yang, Y.; Xu, J.; Huang, L.; Leng, Y.; Dai, L.; Rao, Y.; Chen, L.; Wang, Y.; Tu, Z.; Hu, J.; et al. PGL, encoding chlorophyllide a oxygenase 1, impacts leaf senescence and indirectly affects grain yield and quality in rice. J. Exp. Bot. 2016, 67, 1297–1310. [Google Scholar] [CrossRef] [Green Version]
  41. Hubbart, S.; Ajigboye, O.O.; Horton, P.; Murchie, E.H. The photoprotective protein PsbS exerts control over CO2 assimilation rate in fluctuating light in rice. Plant J. 2012, 71, 402–412. [Google Scholar] [CrossRef] [PubMed]
  42. Cho, J.I.; Ryoo, N.; Ko, S.; Lee, S.K.; Lee, J.; Jung, K.H.; Lee, Y.H.; Bhoo, S.H.; Winderickx, J.; An, G.; et al. Structure, expression, and functional analysis of the hexokinase gene family in rice (Oryza sativa L.). Planta 2006, 224, 598–611. [Google Scholar] [CrossRef] [PubMed]
  43. Yang, C.; Li, D.; Mao, D.; Liu, X.; Ji, C.; Li, X.; Zhao, X.F.; Cheng, Z.K.; Chen, C.Y.; Zhu, L.H. Overexpression of microRNA319 impacts leaf morphogenesis and leads to enhanced cold tolerance in rice (Oryza sativa L.). Plant Cell Environ. 2013, 36, 2207–2218. [Google Scholar] [CrossRef]
  44. Fang, Y.; Xie, K.; Xiong, L. Conserved miR164-targeted NAC genes negatively regulate drought resistance in rice. J. Exp. Bot. 2014, 65, 2119–2135. [Google Scholar] [CrossRef] [PubMed] [Green Version]
  45. Chen, H.; Chen, X.; Chai, X.; Qiu, Y.; Gong, C.; Zhang, Z.; Wang, T.; Zhang, Y.; Li, J.; Wang, A. Effects of low temperature on mRNA and small RNA transcriptomes in Solanum lycopersicoides leaf revealed by RNA-Seq. Biochem. Biophys. Res. Commun. 2015, 464, 768–773. [Google Scholar] [CrossRef]
  46. Sperotto, R.A.; Ricachenevsky, F.K.; Duarte, G.L.; Boff, T.; Lopes, K.L.; Sperb, E.R.; Grusak, M.A.; Fett, J.P. Identification of up-regulated genes in flag leaves during rice grain filling and characterization of OsNAC5, a new ABA-dependent transcription factor. Planta 2009, 230, 985–1002. [Google Scholar] [CrossRef]
  47. Huang, D.; Wang, S.; Zhang, B.; Shang-Guan, K.; Shi, Y.; Zhang, D.; Liu, X.; Wu, K.; Xu, Z.; Fu, X.; et al. A gibberellin-mediated DELLA-NAC signaling cascade regulates cellulose synthesis in rice. Plant Cell 2015, 27, 1681–1696. [Google Scholar] [CrossRef] [Green Version]
  48. Wakuta, S.; Suzuki, E.; Saburi, W.; Matsuura, H.; Nabeta, K.; Imai, R.; Matsui, H. OsJAR1 and OsJAR2 are jasmonyl-L-isoleucine synthases involved in wound- and pathogen-induced jasmonic acid signalling. Biochem. Biophys. Res. Commun. 2011, 409, 634–639. [Google Scholar] [CrossRef] [Green Version]
  49. Wang, Q.; Hillwig, M.L.; Wu, Y.; Peters, R.J. CYP701A8: A rice ent-kaurene oxidase paralog diverted to more specialized diterpenoid metabolism. Plant Physiol. 2012, 158, 1418–1425. [Google Scholar] [CrossRef] [Green Version]
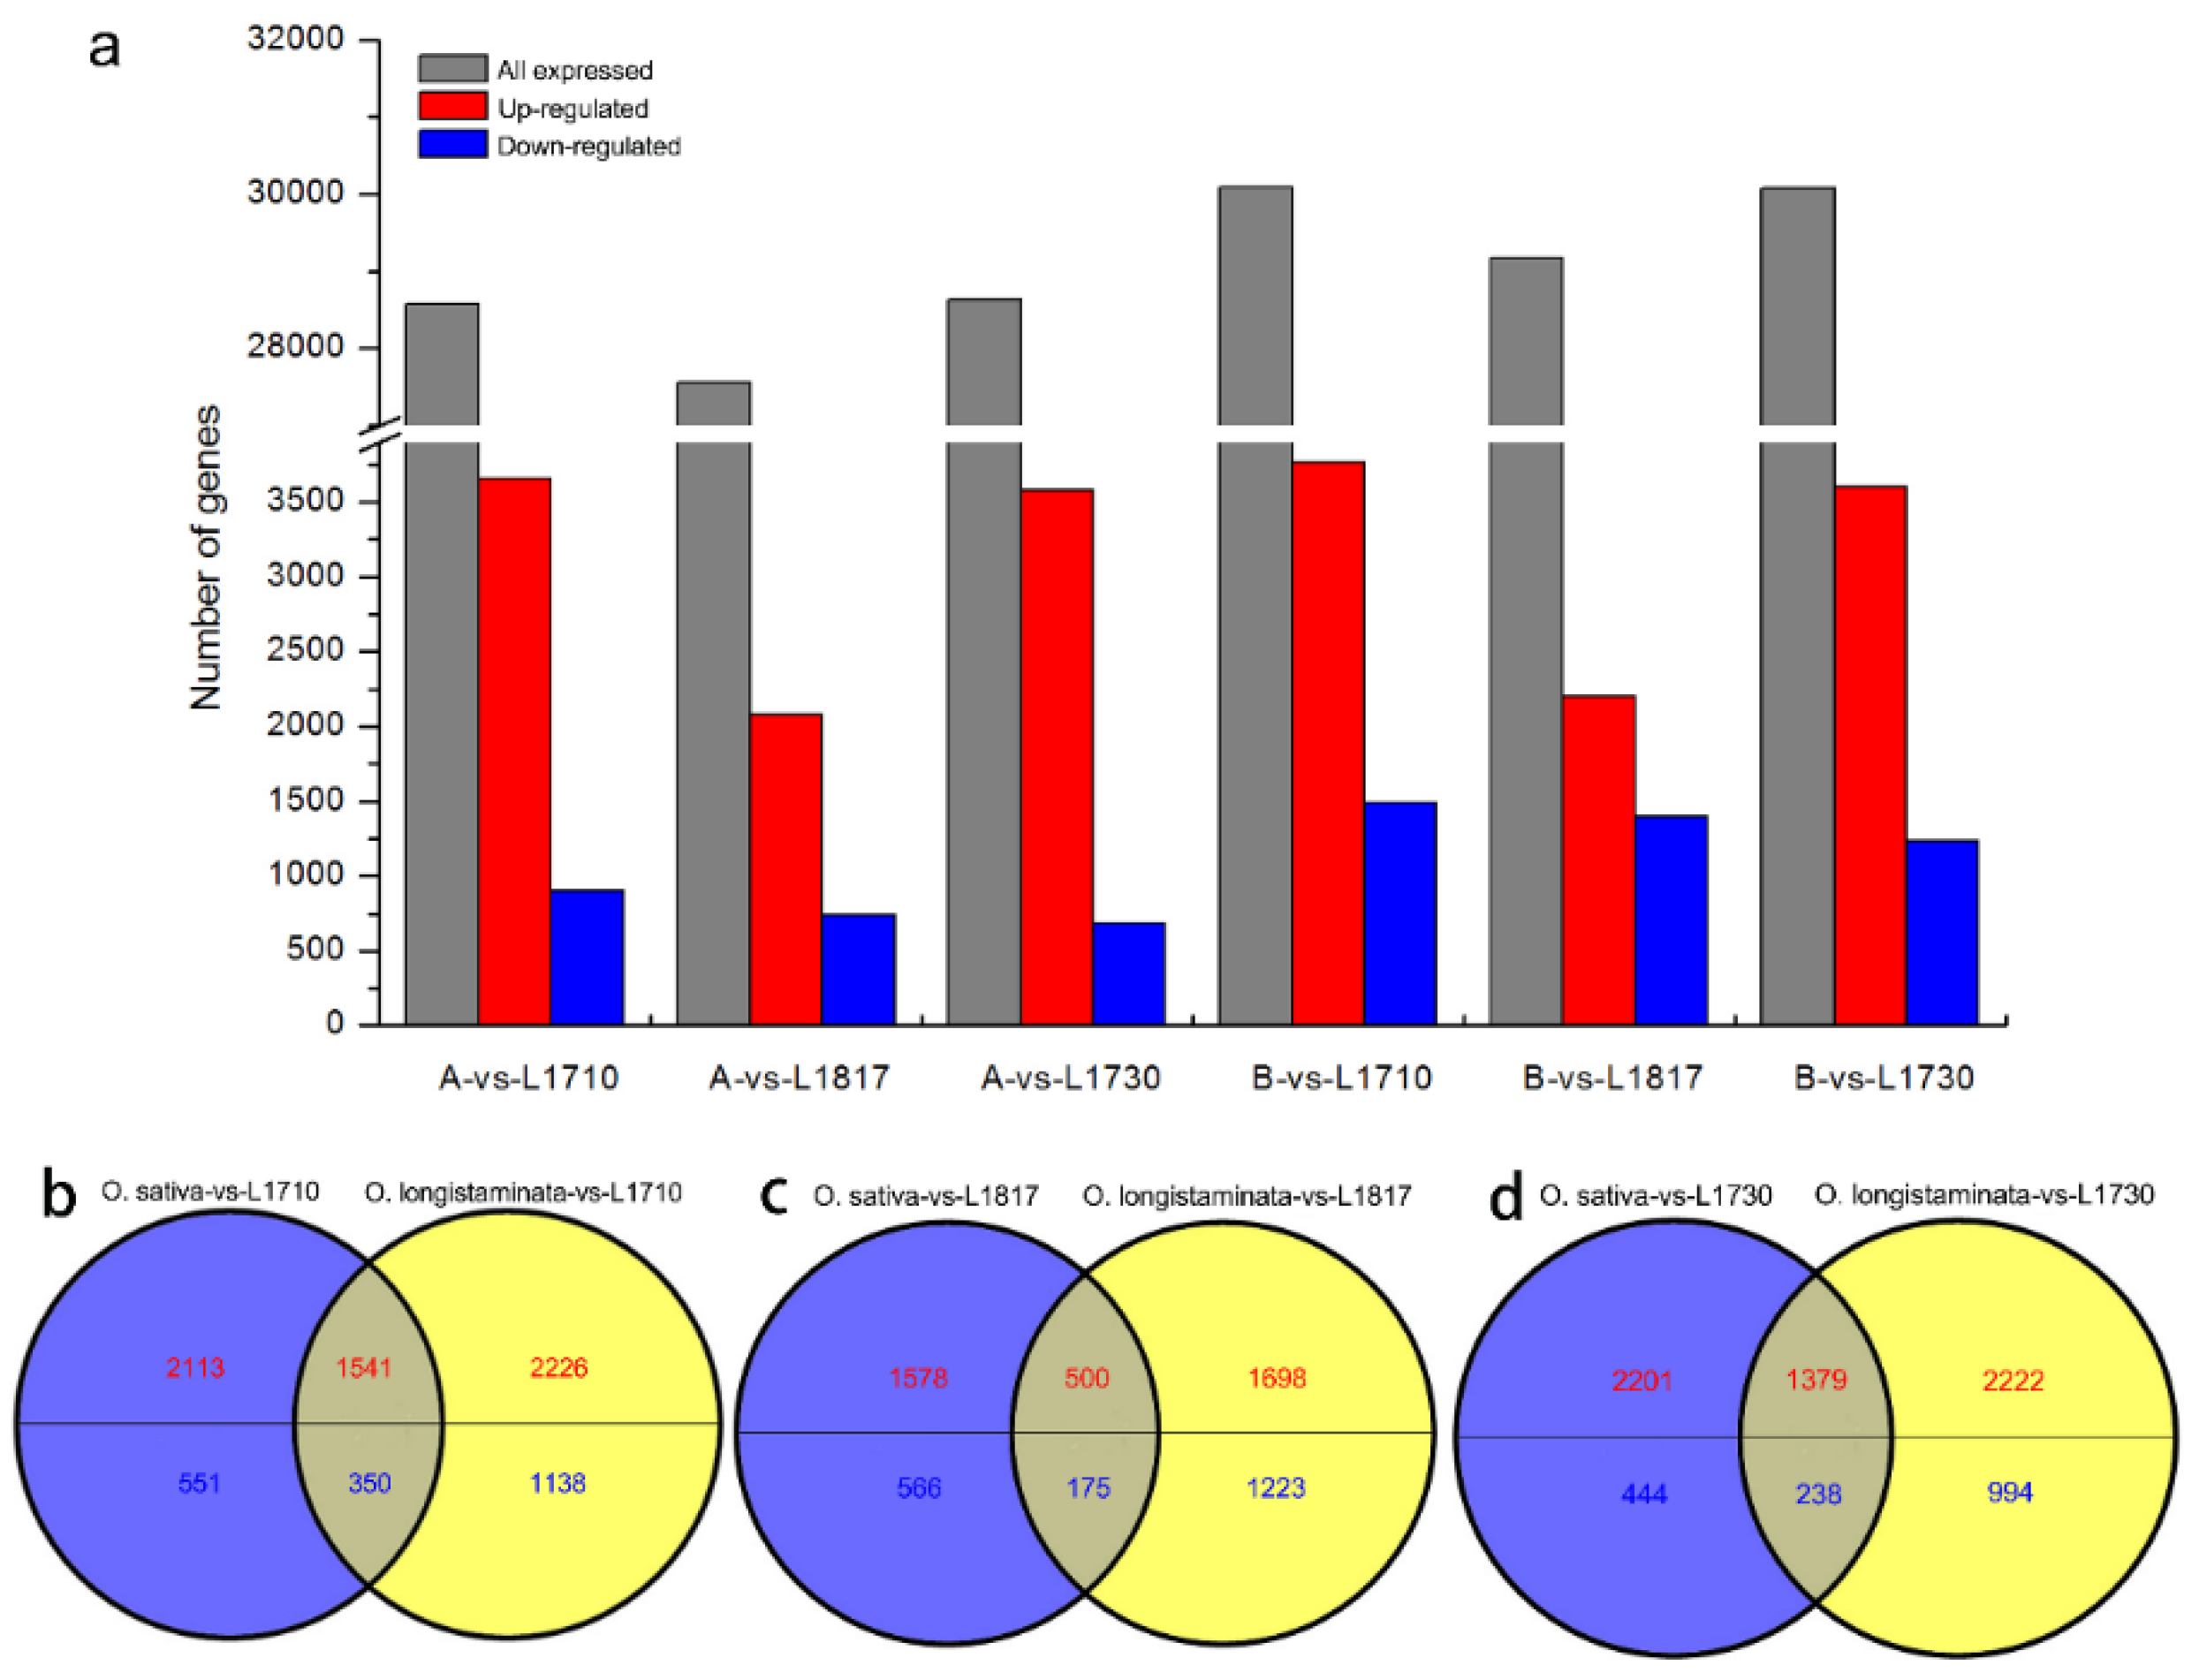
Figure 1. Differentially expressed genes (DEGs) in five lines. (a) Statistical analysis of DEGs among three progenies and their parents. Venn diagrams of DEGs in L1710 (b), L1817 (c) and L1730 (d) compared with their parents. A and B indicate O. sativa and O. longistaminata, respectively. The red and blue numbers indicate the number of up-regulated and down-regulated genes, respectively.
Agronomy 10 01381 g001
Figure 2. Parental expression level dominance (ELD) genes in the three progenies. (a) Twelve patterns of DEGs. Venn diagrams of ELD-A genes (b) and ELD-B genes (c) among the three progenies. A indicates O. sativa; s indicates the progeny line; and B indicates O. longistaminata. ‘A-s-B’ indicates the expression pattern among the progeny line and their parents. The numbers represent the number of genes that showed the corresponding expression pattern of A-s-B. Red font indicates up-regulated genes and blue font indicates down-regulated genes.
Agronomy 10 01381 g002
Figure 3. Significantly changed gene ontology (GO) terms of up-regulated and down-regulated genes in three progenies compared with their parents. A and B indicate O. sativa and O. longistaminata, respectively. The X-axis represents the percentage of genes (number of a particular gene divided by total gene number). The right side of the Y-axis indicates the percentage of up-regulated genes, and the left side indicates the percentage of down-regulated genes. BP: Biological process, CC: Cellular component, MF: Molecular function.
Agronomy 10 01381 g003
Figure 4. MapMan overview of the cellular metabolism in the L1710/O. sativa comparison (a) and the L1710/O. longistaminata comparison (b). Each square represents one gene. The color indicates the value of RPKM normalized log2; red indicates up-regulated and green indicates down-regulated.
Agronomy 10 01381 g004
Figure 5. Hierarchical clustering for the DEGs belonging to the TF gene families. The color key represents the RPKM normalized transformed counts; red indicates up-regulated and green indicates down-regulated. Each column represents a rice line, each row represents a DEG.
Agronomy 10 01381 g005
Figure 6. The number of differentially expressed miRNAs in the three progenies compared with O. sativa (a) and O. longistaminata (b). FC indicates fold change. Red font indicates up-regulated and blue font indicates down-regulated genes.
Agronomy 10 01381 g006
Figure 7. Integrated network of ELD-A miRNAs and their CTGs in L1710 (A), L1817 (B) and L1730 (C), and integrated network of ELD-B miRNAs and their CTGs in L1710 (D), L1817 (E) and L1730 (F). Round rectangle indicates miRNA; ellipse indicates CTG; red indicates up-regulated; and blue indicates down-regulated.
Agronomy 10 01381 g007