Abstract
The interaction between salinity and nitrogen metabolism has been investigated in two barley landraces, one tolerant (“100/1B”) and one susceptible to salinity (“Barley medenine”) from the Middle East and North Africa (MENA) region. Barley plants were exposed to 50 mM NaCl for 7 days; then, salinity was increased to 150 mM NaCl in the presence (10 mM) or limitation (1 mM) of ammonium as a nitrogen source. Upon salinity, “100/1B” was shown to support N assimilation by enhancing the glutamine synthetase (GS) and glutamine oxoglutarate aminotransferase (GOGAT) cycle under high N, and the stimulation of the glutamate dehydrogenase (GDH) pathway under low N treatment. In “Barley medenine”, salinity reduced the GS/GOGAT cycle, and increased GDH activity. Upon salinity, Heat Shock Proteins 70 and PEPC remained unchanged in “100/1B”, while they decreased in “Barley medenine”. The tolerance degree is a determining factor in enzymes’ occurrence and regulation: exposed to salinity, “100/1B” rapidly increased APX and PEPC activities, while this was delayed in “Barley medenine”. Salinity increased cyt-G6PDH levels in “100/1B”, while “Barley medenine” showed a decrease in G6PDH isoforms. Correlation analyses confirm GOGAT was related to G6PDH; GDH and APX with PEPC in “100/1B” under moderate salinity; severe salinity correlated GDH with G6PDH and PEPC. In “Barley medenine” under salinity, GOGAT was correlated with G6PDH, while APX showed a relation with PEPC. Therefore, specific enzymatic activities and occurrence can be used to determine stress responsiveness of different landraces. We suggest that the rapid increase in G6PDH, APX, and nitrogen assimilation enzymes activities represents an index of tolerance in “100/1B” and a stress symptom in “Barley medenine”.
1. Introduction
High salinity is one of the most widespread abiotic stresses affecting plant physiology, growth, and development [1,2,3]. Remarkable reduction in cereals productivity was recurrently reported in recent decades by abiotic constrains, namely salinity and drought [4,5,6]. Exposure to an excess of salts triggers different metabolic changes by modifying the balance between nutrient availability and plant requirements, and inducing associated constraints, namely osmotic, ionic, and oxidative stresses [7]. These conditions disturb cells water potential, disrupt nutrient availability caused by competitive uptake, and generate reactive oxygen species (ROS) [8].
One of the most important mechanisms conferring acclimation and tolerance of plants to abiotic stresses and salinity is the regulation of ROS levels. This stress response is regulated by a specific scavenging complex, composed by both enzymes and non-enzymatic antioxidant compounds [9,10,11]. Critical enzymes involved in ROS detoxification are ascorbate peroxidase (APX, E.C. 1.11.1.11), catalase (CAT, E.C. 1.11.1.6), superoxide dismutase (SOD, E.C. 1.15.1.1), and glutathione reductase (GR, E.C. 1.8.1.7) [10,12]. Furthermore, an assisting role as reductants’ supplier has been recently proposed for glucose 6-phosphate dehydrogenase (G6PDH, E.C. 1.1.1.49), which provides additional NAPDH for scavenging enzymes upon abiotic stresses such as salinity and drought [13,14,15,16].
On the other hand, salinity affects nitrogen (N) metabolism inducing nutritional imbalances [8]. N is a crucial plant nutrient required for growth and development [17]. Therefore, the interaction between salinity and N metabolism is particularly complex, because of the antagonism in plant response under these combined interactions. N supply improves nutritional plant status and alleviates toxicities of abiotic stress [18]. In this context, crucial roles were played by enzymes such as phosphoenolpyruvate carboxylase (PEPC, E.C. 4.1.1.32), which regulate the connection between carbon and N metabolism for the replacement of carbon skeletons and the replenishment of the tricarboxylic acid cycle; G6PDH plays a pivotal role in reductants provision also for enzymes involved in N metabolism and assimilation [19]. Furthermore, N availability showed contrasting roles in abiotic stress susceptibility/tolerance: deficiency of this nutrient could reduce water loss but N transporters, namely AtNRT1.1 (At1g12110), AtNRT1.8 (At4g21680), and CLCA (At5g40890), showed positive effects on plant response to abiotic stresses [20,21,22].
Nowadays, the enhancement of crop yields upon high saline environments led to a renewed interest for plant physiology researchers. Mediterranean regions, especially arid and semi-arid areas from Southern Europe and Northern Africa, were usually characterized by ecosystems subjected to multiple stress conditions characterized by contemporary onset of excess of salinity and/or water scarcity, heat, and nutrients [23]. Therefore, farmers throughout centuries have developed a number of traditional varieties. These genotypes, generally described as landraces, showed the ability to tolerate environmental changes maintaining unaltered yields [3,24]. In the Middle East and North Africa (MENA) region, barley represents a critical agronomic resource in semi-desert environments, especially in developing countries where this crop is a critical component of cereal rotation, providing a stable source to sustain smallholder farmers, and often replaces wheat or other cereals in more arid areas [25]. On the other hand, barley is the fourth most produced cereal in the world [26], representing one of the main sources of carbohydrates in developing countries, due to its natural stress tolerance, thus supporting small farmers in many arid areas [25,27,28]. Furthermore, barley is an excellent model organism to investigate abiotic and biotic stress resistance, being tolerant to different environmental stress [29].
It is worth pointing out that the identification of novel alleles QTL and peculiarities from unexploited genotypes is a central challenge for researchers, in order to improve crop productivity in vulnerable environments and provide new tools to increase crop yields [24,30]. For example, genes such as HsCBL8 (calcium-sensor calcineurin B-like) and HsCIPKs—identified in Tibetan genotypes of Hordeum spontaneum—were overexpressed in rice, contributing to an increased tolerance to salinity, drought, and heavy metals [5].
The aim of this paper is to investigate the effects of the interaction between salinity and N metabolism in two contrasting barley landraces. Our strategy is finalized to understand how the selected landraces respond to the detrimental effects induced by salt stress and how salinity regulates the N metabolism. To do this, biochemical activities of enzymes involved in responses to salinity and nitrogen assimilation have been studied. Our hypothesis is that landraces showing contrasting responses to salinity and nitrogen assimilation might reflect distinct regulations in their main metabolic pathways in order to adapt to environmental conditions. Therefore, specific enzymatic activities and protein occurrence can be identified as stress responsive sensors in different cereal genotypes; this possibility will be discussed under the light of the results obtained.
2. Materials and Methods
2.1. Plant Material and Growth Conditions
Two barley landraces, “100/1B” and “Barley medenine”, which differ in their response to salinity, were chosen for this study. “100/1B” is a salt-tolerant landrace from Oman; the seeds were supplied by the Laboratory of Genetics and Cereal breeding—INAT, University of Tunis. “Barley medenine” is a salt-susceptible landrace selected by International Center for Agricultural Research in the Dry Areas (ICARDA) for “PRF sud project” in 2009; the seeds were obtained from the National Research Institute for Rural Engineering, Water and Forestry, Ariana, Tunisia in collaboration with the International Center for Biosaline Agriculture, Dubai, United Arab Emirates. Soil salinity in the origin area of “100/1B” and “Barley medenine” is 2 and 1.3 (dS m−1), respectively [25]. Seeds were germinated for 7 days in the dark on moistened paper, then seedlings were grown in hydroponic solution in darkened plastic bottles at 20 °C, at 60–80% relative humidity, under a 16h-light/8h-dark regime, with approximately 180 μmol photons m−2 s−1. The composition of the medium (modified Hoagland solution), continuously bubbled with air, has been previously described [23]. Hydroponic solutions were controlled for pH (6–6.5) and adjusted daily.
2.2. Nitrogen and Salt Treatments
After 7 days of hydroponic culture and before starting any treatments, 10 seedlings from each landrace were collected for analysis (-N/-NaCl). Then, plants were separated into 4 groups: Two control groups were grown without NaCl, upon low or high N supply with 1 and 10 mM of (NH4)2SO4, respectively. The other two groups were grown under the same concentration of (NH4)2SO4 and subjected to moderate salt stress (50 mM NaCl), which was increased to severe stress (150 mM NaCl) after 7 days. Seedlings were collected 3 and 7 days after moderate NaCl stress (50 mM NaCl); further samples were collected after 1 and 3 days under imposing severe stress (150 mM NaCl). This experimental scheme was designed to simulate field conditions where salinity sequentially increases from low to high levels. These degrees of salinity (50 and 150 mM NaCl) allow investigating of both tolerance and adaptation to this abiotic stress. Sampling days have been selected based on previous biochemical investigation on similar enzymes upon abiotic stress [13,23], which indicated 3 and 7 as the most stressful days. The whole experimental design is depicted in Figure 1.
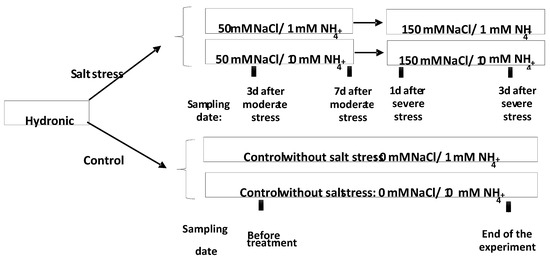
Figure 1.
Scheme of the adopted experimental strategy. Stressed plants treated by low and high N were collected after 3 and 7 days of moderate stress (50 mM NaCl); then, a severe stress (150 mM NaCl) was applied and plants were collected after further 1 and 3 days. Control plants (without NaCl) were collected before any treatment, and after N application at the end of experiment.
2.3. Enzyme Extraction and Activities’ Determination of NADH-GOGAT and NADH-GDH
NADH-GOGAT and NADH-GDH were extracted by grounding 300 mg of barley leaves in the same buffer containing 1 mL of 100 mM KH2PO4 buffer (pH 7.5), 2 mM EDTA, 2 mM dithiothreitol (DTT), and plant-specific proteases inhibitor cocktail (Sigma-Aldrich, St. Louis, USA). GOGAT and GDH assays were measured by following the oxidation of NADH at 340 nm for 10 min as described by Groat and Vance [31] and Singh and Srivastava [32], respectively. Specific activity was expressed as nmol NADH mg−1 protein min−1. The reaction mixture for NADH-GOGAT assay contained 100 mM KH2PO4 buffer (pH 7.5), 18.75 mM2-oxoglutarate,15 mM aminooxyacetate, 0.15 mM NADH, 7.5 mM L-glutamine, and extract. GDH activity was measured using 100 mM KH2PO4 buffer (pH 7.5), 200 mM (NH4)2SO4, 0.15 mM NADH, 2.5 mM 2-oxoglutarate, and extract. Enzymatic activities were determined spectrophotometrically using a Cary 60 spectrophotometer (Agilent Technologies, Santa Clara, CA, USA) at 25 °C. For all enzymatic assays, the protein concentration in the samples was measured using the Bradford method.
2.4. Enzyme Extraction and Activities Determination of G6PDH, APX, and PEPC
G6PDH, APX, and PEPC activities were extracted by grounding 300 mg of barley leaves in the same extraction buffer containing 50 mM Tris-HCl, a pH 8.0, 5 mM MgCl2, 4 mM EDTA, 10% glycerol, and plant-specific proteases inhibitor cocktail (Sigma-Aldrich, St. Louis, USA). (1) G6PDH was assayed as previously described by Castiglia et al. [33]. NADP+ was determined at 340 nm for 2–10 min. The reaction mixture contained 50 mM Tris-HCl buffer (pH 8.0), 5 mM MgCl2, 0.15 mM NADP+, 3 mM G6P, and 100 µL of extract. Enzyme activity was expressed as nmol-reduced NADP+ min−1 mg−1 protein. (2) APX activity was determined following the oxidation of ascorbic acid at 290 nm for 5–10 min. APX assay was carried out as described by Nakano and Asada [34]; the assay mixture contained 30 mM potassium phosphate buffer (pH 7.5), 1 mM EDTA, pure hydrogen peroxide H2O2, 5 mM ascorbic acid, and extract. The enzyme activity was expressed as μmol of ascorbic acid min–1 mg−1 protein. (3) PEPC was assayed by following the method of Fontaine et al. [35] with some modifications. For PEPC determination, a reaction coupled to malate dehydrogenase (MDH) is required. PEPC activity was measured by following NADH oxidation at 340 nm for 10 min. The reaction was assayed at 25 °C, in a mixture containing 100 mM Tris–HCl (pH 8.2), 20 mM MgCl2, 100 mM NaHCO3, 0.2 mM NADH, MDH (3µL/mL Tris HCl pH 8.2); 10 mM PEP was used to start the reaction; a control without PEP was prepared for each assay. Enzymatic activities were determined spectrophotometrically using a Cary 60 spectrophotometer (Agilent Technologies, Santa Clara, USA) at 25 °C. For all enzymatic assays, the protein concentration in the samples was measured using the Bradford method.
2.5. Western Blotting
For Western blotting analysis, proteins were extracted as described previously (Section 2.4) and then, separated using electrophoresis SDS-PAGE. Polypeptides were transferred on a Hybond membrane (Ge Healthcare, Chicago, IL, USA) using a Transblot turbo transfer system (Biorad, Hercules, CA, USA). The membrane was incubated with primary G6PDH antibody raised against potato cytosolic (cyt), chloroplastic (P1), and plastidial (P2) G6PDH isoforms [36]; barley Fd-GOGAT [37]; HSP70 (cytosolic and chloroplast—Agrisera, Vännäs, Sweden) and PEPC from antiserum from Amarantus edulis. After incubation of the membrane with secondary antibodies, cross-reacting polypeptides were identified by enhanced chemiluminescence using the Western Bright Quantum kit (Advansta—Aurogene, Roma, Italy). Images were acquired by the BioRad Chemidoc system/Quantity One software (BioRad, Hercules, CA, USA).
2.6. Statistical Analyses
R software (R- 64 3.6.1) was used for statistical analysis. The significance of saline stress, N treatment, and duration of salt stress single effects and their interaction were analyzed using a linear variance analysis model (ANOVA p < 0.05). Then, means were compared using Duncan’s test. Correlation analysis using Pearson’s parametric correlation test was performed to determine the correlation coefficients for all possible pairs of columns in the data table.
3. Results
3.1. Contrasting Barley Landraces Showed Diversified Stress and Antioxidant Responses
The ability of two contrasting barley landraces to respond to a combination of salinity and nitrogen starvation stresses was analyzed by biochemical investigation on N metabolism and antioxidant enzymes.
The different behavior in the salt stress condition and N concentrations is clearly depicted in Figure 2, which shows leaves from these two landraces under experimental conditions. “100/1B” leaves showed a reduced damage induced by salinity, while the “Barley medenine” landrace showed strongly stressed leaves, both upon high and low N.
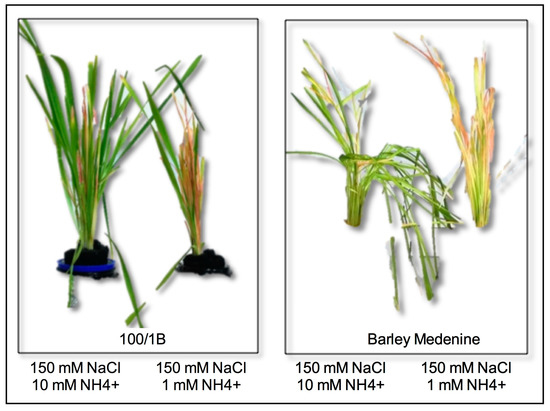
Figure 2.
Effects of salinity and N supply on “100/1B” and “Barley medenine” leaves.
The salt tolerant landrace “100/1B” showed a reduced involvement of APX upon salinity under low N conditions (Figure 3). A rapid APX activity increase of about 50%, related to severe salt stress, was observed in “100/1B” plants grown in high N, whereas under low conditions, plants showed an APX activity essentially unchanged by salinity. The presence of an adequate source of N (10 mM NH4) induced an increase in APX activity upon 150 mM of NaCl. The involvement of G6PDH in “100/1B” appeared to be mainly related to N assimilation by a significant increase upon the low N concentration condition compared with the high N concentration. On the other hand, susceptible “Barley medenine” showed increased activities of APX and G6PDH upon salinity both in high N and low N concentration. It should be underlined that the sensitive landrace “Barley medenine” showed higher G6PDH activities than “100/1B” when expressed on a mg−1 prot. The maximum activity in low N plants was observed after 24 h of 150 mM NaCl exposure, while high N induced a marked increase up to 216 nmol min−1 mg−1 prot after 3 days of severe stress.
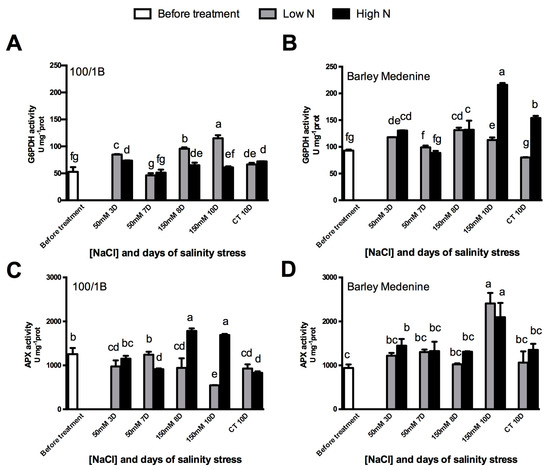
Figure 3.
Effects of salinity and N concentration on G6PDH and APX enzymatic activities in barley plants growth in hydroponic system. Levels of low N concentrations are in grey bars; high N concentrations are in black bars. Legend: (BT), before treatment; (50 mM 3D), 3 days of moderate stress; (50 mM 7D), 7 days of moderate stress; (150 mM 8D), 7 days in 50 mM NaCl and 1 day in 150 mM NaCl (severe stress); (150 mM 10d) 7 days in 50 mM NaCl and 3 days in 150 mM NaCl (severe stress); (CT 10D) control treatment for 10 days. (A)100/1B, G6PDH activity; (B): Barley Medenine, G6PDH activity; (C) 100/1B, APX activity; (D): Barley Medenine, APX activity. Letters indicate significant differences between different treatments. (p < 0.05, ANOVA: Duncan’s test).
In order to investigate the contribution of different G6PDH isoforms, antibodies constructed against cytosolic (Cyt-G6PDH), chloroplastic (P1-G6PDH), and plastidial (P2-G6PDH) were used by Western blotting (WB—Figure 4). The results showed an increase in cyt-G6PDH abundance upon 150 mM NaCl in high N “100/1B” plants, while an evident decrease was observed in low N plants (Figure 3). P1-G6PDH remained unaffected at low N regimes in “100/1B” and decreased under high N under both moderate and high salinity.
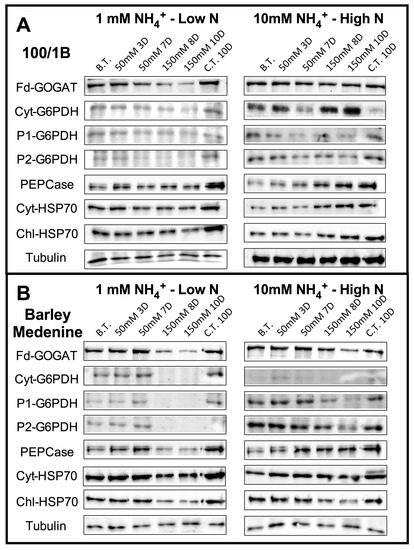
Figure 4.
Western blotting of leaves of “100/1B” (A) and “Barley medenine” (B) grown under low N (1 mM NH4+) and high N (10 mM NH4+) using antisera Fd-GOGAT, cyt-G6PDH, P1-G6PDH, P2-G6PDH, Chl-HSP70, Cyt-HSP70, PEPCase, and Tubulin (as control for equal loading). Legend: (BT), before treatment; (50 mM 3D), 3 days of moderate stress; (50 mM 7D), 7 days of moderate stress; (150 mM 8D), 7 days in 50 mM NaCl and 1 day in 150 mM NaCl (severe stress); (150 mM 10d) 7 days in 50 mM NaCl and 3 days in 150 mM NaCl (severe stress); (CT 10D) control treatment for 10 days. Images are representative of two or three WB from different experiments.
Plastidic P2-G6PDH decreased in “100/1B” under low N and salinity and remained unaffected by salt stress under high N. Similar behaviors were observed in “Barley medenine”. Finally, the degree of the stress conditions was monitored by the HSP70s occurrence (Figure 4). Upon moderate stress, cyt-HSP70 protein occurrence remained unchanged in low N conditions in “100/1B”, while high salinity induced a sensible increase in cyt-HSP70 upon high N. By contrast, “Barley medenine” showed a high stability in cyt-HSP70 abundance upon high N independently of NaCl concentration. Chl-HSP70 showed no differences in “100/1B” in each analyzed condition with the exception of an increase upon high salinity and high N after 10D. In “Barley medenine”, Chl-Hsp70 showed a decrease upon high salinity, independently by N supply.
3.2. N Metabolism Modifications upon Salinity: The Role of GOGAT and GDH
Salinity did not induce substantial changes in NADH-GOGAT activity both under high and low N in tolerant “100/1B” (Figure 5). The only exception was represented by the higher stress point (10 days, 150 mM NaCl, 10 mM NH4), where the NADH-GOGAT activity showed a 22% increase. Furthermore, GDH activity showed an 24% increase upon severe salt stress in low N after 8 days. On the other hand, in “Barley medenine”, NADH-GOGAT showed reduced differences between controls and salt stressed conditions both upon low and high N concentrations. Contrarily, an evident increase in GDH activity was observed in the susceptible “Barley medenine” in both low N and high N conditions; this increase was more evident under low N. Fd-GOGAT occurrence was investigated using specific antibodies. As shown in Figure 4, “100/1B” reported a decrease in Fd-GOGAT occurrence in low N grown plants under salinity, while under high N conditions, no differences were observed upon salt stress. Similar behavior in “Barley medenine”, where only a more severe decrease in Fd-GOGAT occurrence, was observed under 150 mM NaCl.
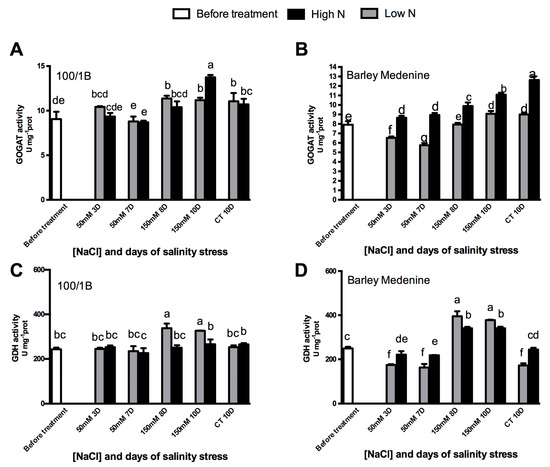
Figure 5.
Effects of salinity and N concentration on NADH-GOGAT and GDH enzymatic activities in barley plants growth in hydroponic system. Levels of low N concentrations are in grey bars; high N concentrations are in black bars. Legend: (BT), before treatment; (50 mM 3D), 3 days of moderate stress; (50 mM 7D), 7 days of moderate stress; (150 mM 8D), 7 days in 50 mM NaCl and 1 day in 150 mM NaCl (severe stress); (150 mM 10d) 7 days in 50 mM NaCl and 3 days in 150 mM NaCl (severe stress); (CT 10D) control treatment for 10 days. (A)100/1B, GOGAT activity; (B): Barley Medenine, GOGAT activity; (C) 100/1B, GDH activity; (D): Barley Medenine, GDH activity.Letters indicate significant differences between different treatments. (p < 0.05, ANOVA: Duncan’s test).
3.3. Change in the Activity of PEPcase
As shown in Figure 6, the tolerant “100/1B” had an increase in PEPC activity upon N supply and NaCl. In the susceptible “Barley medenine”, PEPC activity under high N was relatively stable throughout salt stress but lower than control. A 3-d response increasing PEPC activity was observed in low N under both moderate and severe salinity. Western blotting analysis showed an unchanged PEPC occurrence in low N “100/1B” plants and an increase in high N plants under severe salinity (Figure 4). On the contrary, in low N “Barley medenine” plants, PEPC occurrence was reduced under high salinity, while a high N supply maintained a relative stability in PEPC abundance, even under severe stress (Figure 4).
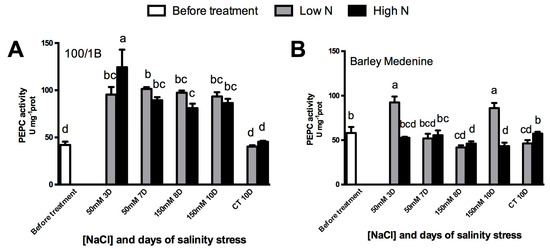
Figure 6.
Effects of salinity and N concentration on PEP carboxylase (PEPC) enzymatic activity in barley plants growth in hydroponic system. Levels of low N concentrations are in grey bars; high N concentrations are in black bars. Legend: (BT), before treatment; (50 mM 3D), 3 days of moderate stress; (50 mM 7D), 7 days of moderate stress; (150 mM 8D), 7 days in 50 mM NaCl and 1 day in 150 mM NaCl (severe stress); (150 mM 10d) 7 days in 50 mM NaCl and 3 days in 150 mM NaCl (severe stress); (CT 10D) control treatment for 10 days. (A)100/1B, PEPC activity; (B): Barley Medenine, PEPC activity; Letters indicate significant differences between different treatments. (p < 0.05, ANOVA: Duncan’s test).
3.4. Correlation between Suppliers of Reducing Power (G6PDH and PEPC) and Different Enzymes Involved in N Metabolism or Defense against Stress
Both G6PDH and PEPC participate, directly or indirectly, in N assimilation, by providing NAD(P)H and carbon skeletons supply, respectively; therefore, under stress conditions, a diversion of metabolism to ROS detoxification can be possible. To achieve a deeper understanding of G6PDH and PEPC effects on other enzymes, the correlations between different enzymes have been evaluated. In the “100/1B” landrace cultivated under 50 mM NaCl, GOGAT was strongly and positively correlated with G6PDH (r = 0.84, p = 0.011) (Table 1). GDH and APX were moderately correlated with PEPC activity (r = 0.54, p = 0.176 and r = 0.52, p = 0.195, respectively). Under severe stress, GDH was strongly and positively correlated with both G6PDH and PEPC (r = 0.87, p = 0.005 and r = 0.9, p = 0.002, respectively) and inversely correlated with APX (r = −0.85, p = 0.008) (Table 1). On the other hand, “Barley medenine” showed a positive correlation of GOGAT with G6PDH (r = 0.76, p = 0.027), and of APX with PEPC (r = 0.7, p = 0.058) upon severe salinity (Table 2).

Table 1.
Coefficients of correlation (r) between different enzymes measured in “100/1B” cultivated under 50 mM NaCl (moderate salt stress—lower diagonal data) or 150 mM NaCl (severe salt stress—upper diagonal data). Numbers in brackets indicate p values.
Table 2.
Coefficients of correlation (r) between different enzymes measured in “Barley medenine” cultivated under 50 mM NaCl (moderate salt stress—lower diagonal data) or 150 mM NaCl (severe salt stress—upper diagonal data). Numbers in brackets indicate p values.
4. Discussions
In this work, we investigated the biochemical modifications involved in the response to salt stress and nitrogen deprivation in two contrasting landraces of barley, one salt tolerant “100/1B”, a landrace from Oman; and one salt susceptible, “Barley medenine”, a landrace from ICARDA/Tunis [25]. Recently, these landraces—together with other 38 genotypes from North Africa—were analyzed in crop fields for their potential in salinity tolerance in the Middle East and North Africa (MENA) region. These genotypes were grouped in four different clusters, where “100/1B” belong to the best salt tolerant one. This investigation highlighted K+, Ca2+ content, and relative water content as the most important traits explaining barley yield reduction ratio under salinity stress [25]. It is worth pointing out that even if agronomic data are available, no investigation about antioxidant response and N metabolism was analyzed in landraces from this germplasm collection. In this context, our results showed different behaviors in enzymatic activities and protein occurrence in the selected landraces. Heat shock proteins (HSP70s) are crucial regulators of response against abiotic stress [23]. The maintenance or the increase in HSP70s isoforms occurrence in “100/1B” and its decrease in “Barley medenine” in response to salinity could explain the tolerance of the first and susceptibility of the second.
High levels of antioxidant enzymes are generally considered as a biochemical index of plant tolerance against salinity [38]. Contrarily, a number of authors consider scavenging enzymes as a stress symptom, suggesting their increase a consequence of oxidative damage [10,39]. Our results suggested a long-term activation of APX and G6PDH in salt-susceptible “Barley medenine”, thus highlighting a severe oxidative stress induced by stress. By contrast, the delayed response of “Barley medenine” in the increased APX and PEPC activities, observed only 3d after salt stress, and evidently upon low N, may suggest that high levels of APX and PEPC activities can be considered as a symptom of oxidative stress in this sensitive landrace. Similarly, Maksimović et al. [39] investigated the role as a stress sensor of APX, by analyzing the increase in enzymatic activity in barley plants under oxidative stress. Furthermore, our results confirm the role of N metabolism in maintaining metabolic functions under salt stress [40]. In accordance with our findings, previous studies showed that different plants respond to salinity by increasing APX and PEPC activities [41,42]. On the other hand, N-fed “100/1B” showed a precocious increase in APX and PEPC, indicating their central role in the ability of this landrace to tolerate high salinity. Interestingly, “100/1B” G6PDH activity showed reduced efforts upon N-fed salinity, reporting a probable preferred activation to sustain N assimilation in salt-tolerant landraces. G6PDH plays an important role in sustaining the redox state of plant cells through supplying the NADPH reductants needed for ROS-detoxification mechanisms [19]. The G6PDH increase in both landraces reflects the oxidative damage produced by salinity and the high requirement for reductants to trigger a defense system against ROS. Therefore, the higher occurrence of cyt-G6PDH in “100/1B” in response to salinity and N availability can justify the tolerance of this landrace.
“100/1B” and “Barley medenine” behaviors suggested different N assimilation and detoxification mechanisms upon salinity. NADH-GOGAT and GDH regulations were related to N availability in the tolerant “100/1B”, which was least affected by salinity compared to the sensitive “Barley medenine”.
Tolerant “100/1B” stimulated the GS/GOGAT pathway under sufficient N nutrition and salinity. This result is in accordance with previous studies on chickpea (Cicer arietinum L.), soybean (Glycine max L.), and halophyte species, [43,44] thus it could allow assimilation of the excess of NH4+ accumulated under salinity.
“100/1B” subjected to salinity is able to switch the main GS/GOGAT cycle to GDH assimilation under low N, possibly to limit energy-consuming metabolism. In fact, despite its high efficiency, the GS/GOGAT pathway is an energy consuming process when compared to GDH assimilation, by requiring an extra ATP molecule [45]. Through this mechanism, plants can save energy for the defense system and adaptation to salinity
In “Barley medenine”, GOGAT activity significantly decreased upon salinity. Previous studies on different crops showed salt stress inhibition of the GS/GOGAT cycle, induced by both salt ions damaging and/or substrate limitation [46,47].
The noticeable NADH-GDH increase after 24 h of severe salinity in both landraces reflects a rapid leaf protein catabolism induced by salt and leading to high intracellular NH4+ levels [8]. The alternative N assimilation pathway (GDH) activation by salinity is strongly required to protect plants against ammonium toxicity, fill the glutamate pool, and allow the synthesis of stress-protective metabolites [48]. The GDH enzyme presents low affinity for NH4+, and it can be stimulated to synthesize glutamate only when NH4+ concentration >1 mM, [46]; therefore, the fact that GDH was stimulated under low N (1 mM NH4+) supports the hypothesis of intracellular ammonia accumulation under salt stress.
Taken together, the tolerant “100/1B” seems to have established a strong regulation mechanism under salinity, by maintaining an efficient energy-saving N metabolism, delivering carbon sources, synthesizing oxoglutarate, incorporating NH4+ to synthesize amino acids required for cell osmotic adjustments, and rapidly triggering a defense system after stress exposure. The participation of G6PDH in the NADPH recycling machinery and the role of PEPC in furnishing carbon skeletons during ammonium assimilation may indicate a correlation between different enzymes, in its turn depicting different defense scenarios of the two landraces upon salinity. Under moderate stress, the positive correlation between G6PDH and GOGAT suggests that the reductants produced via G6PDH can be used in N metabolism in the GS/GOGAT cycle. The positive correlation of PEPC with both APX and GDH indicates PEPC involvement in both the ROS scavenging system and N assimilation via GDH pathway. Under severe salinity, based on the strong correlation between GDH with both G6PDH and PEPC, we suggest that severe salinity leads to a diversion of reductants supplied by G6PDH and PEPC to the alternative N assimilation pathway (GDH). Based on the observed correlation under high salinity in the sensitive “Barley medenine”, we suggest the involvement of G6PDH in N assimilation via the GS/GOGAT cycle and the participation of PEPC [19] in response against salinity as well.
5. Conclusions
The results presented here support the hypothesis that activities and occurrence of specific enzymes can be used as a useful index of metabolism in landraces. Particularly, the activities of GS/GOGAT and GDH represent a fast and reliable tool to identify the rapid response of barley landraces to salinity. Furthermore, biochemical investigations on scavenging and reductants’ supplier enzymes represent crucial aspects to analyze genotypes, ecotypes, and landraces with different responses in abiotic stress conditions. Finally, our findings proved that the tolerance of “100/1B” and the sensibility of “Barley medenine” to salinity, which have been previously selected on agronomic parameters [26], are based on different biochemical and metabolic regulation of enzymes of the central metabolism. This study demonstrated that specific enzymatic activities and protein occurrence can be utilized as tools and/or sensors to investigate plant salt stress response. Further investigations will be necessary to clarify the possible molecular pathways of regulation which coordinate the basal metabolism fluxes in adverse environments.
Author Contributions
F.E.B.A., Conceptualization, methodology, and writing; S.A., Conceptualization, methodology, and writing; G.C. biochemical and Western blotting analysis; S.L., biochemical analysis and wrote and amended the paper; V.P., biochemical analysis; S.J., data curation; Z.H., validation and statistical analysis; Z.C., data analysis; I.Z., review and editing; Y.T., supervision; S.E., coordinated the research project, analyzed the data, and wrote and amended the paper. All authors have read and agreed to the published version of the manuscript.
Funding
This work was supported by grants from the Tunisian Ministry of Agriculture, Water Resources and Fisheries and the Tunisian Ministry of Higher Education, Scientific Research. Giorgia Capasso acknowledges Project “Garanzia Giovani” 2018 by Regione Campania, DD566/2014/23599. Simone Landi acknowledges Project PON-AIM LINEA 1 “MOBILITA’ DEI RICERCATORI” Codice Attività = AIM1823408_2.
Acknowledgments
The authors would like to thank the laboratory of Genetics and Cereal breeding (LR14GAC01)—INAT; and the National Research Institute for Rural Engineering, Water and Forestry (Ariana, Tunisia) in collaboration with the International Center for Biosaline Agriculture (Dubai, United Arab Emirates), for the generous gift of barley seeds. The authors thank Antje von Schaewen very much (Muenster—Germany) for the generous gift of potato G6PDH antibodies (Wendt et al. 2000). The authors would like to thank Robert P. Walker, (Sheffield—UK) for the kind gift of PEPCase antibodies from Amaranthus edulis and A. Marquez (Univ. of Sevilla, Spain) for the generous gift of barley Fd-GOGAT antibodies, respectively.
Conflicts of Interest
The authors declare no conflict of interest.
References
- Martinez-Atienza, J.; Jiang, X.; Garciadeblas, B.; Mendoza, I.; Zhu, J.-K.; Pardo, J.M.; Quintero, F.J. Conservation of the salt overly sensitive pathway in rice. Plant Physiol. 2007, 143, 1001–1012. [Google Scholar] [CrossRef] [PubMed]
- Wang, H.; Zhang, M.; Yang, C.; Shi, D.; Liu, B.; Lin, X.; Yang, C. Effects of salt stress on ion balance and nitrogen metabolism of old and young leaves in rice (Oryza sativa L.). BMC Plant Biol. 2012, 12, 194. [Google Scholar] [CrossRef] [PubMed]
- Ruggiero, A.; Landi, S.; Punzo, P.; Possenti, M.; Van Oosten, M.J.; Costa, A.; Morelli, G.; Maggio, A.; Grillo, S.; Batelli, G. Salinity and ABA Seed Responses in Pepper: Expression and Interaction of ABA Core Signaling Components. Front. Plant Sci. 2019, 10, 304. [Google Scholar] [CrossRef]
- Lobell, D.B.; Schlenker, W.; Costa-Roberts, J. Climate trends and global crop production since 1980. Science 2011, 333, 616–620. [Google Scholar] [CrossRef] [PubMed]
- Guo, W.; Chen, T.; Hussain, N.; Zhang, G.; Jiang, L. Characterization of Salinity Tolerance of Transgenic Rice Lines Harboring HsCBL8 of Wild Barley (Hordeum spontanum) Line from Qinghai-Tibet Plateau. Front. Plant Sci. 2016, 7, 1678. [Google Scholar] [CrossRef]
- Halford, N.G.; Curtis, T.Y.; Chen, Z.; Huang, J. Effects of abiotic stress and crop management on cereal grain composition: Implications for food quality and safety. J. Exp. Bot. 2015, 66, 1145–1156. [Google Scholar] [CrossRef]
- Bartels, D.; Sunkar, R. Drought and salt tolerance in plants. Crit. Rev. Plant Sci. 2005, 24, 23–58. [Google Scholar] [CrossRef]
- Ashraf, M.; Shahzad, S.M.; Imtiaz, M.; Rizwan, M.S. Salinity effects on nitrogen metabolism in plants–focusing on the activities of nitrogen metabolizing enzymes: A review. J. Plant Nutr. 2018, 41, 1065–1081. [Google Scholar] [CrossRef]
- Mittler, R.; Vanderauwera, S.; Gollery, M.; Van Breusegem, F. Reactive oxygen gene network of plants. Trends Plant Sci. 2004, 9, 490–498. [Google Scholar] [CrossRef]
- Gill, S.S.; Tuteja, N. Reactive oxygen species and antioxidant machinery in abiotic stress tolerance in crop plants. Plant Physiol. Biochem. 2010, 48, 909–930. [Google Scholar] [CrossRef]
- Jallouli, S.; Ayadi, S.; Landi, S.; Capasso, G.; Santini, G.; Chamekh, Z.; Zouari, I.; Ben Azaiez, F.E.; Trifa, Y.; Esposito, S. Physiological and Molecular Osmotic Stress Responses in Three Durum Wheat (Triticum Turgidum ssp Durum) Genotypes. Agronomy 2019, 9, 550. [Google Scholar] [CrossRef]
- Caverzan, A.; Passaia, G.; Rosa, S.B.; Ribeiro, C.W.; Lazzarotto, F.; Margis-Pinheiro, M. Plant responses to stresses: Role of ascorbate peroxidase in the antioxidant protection. Genet. Mol. Biol. 2012, 35, 1011–1019. [Google Scholar] [CrossRef] [PubMed]
- Landi, S.; De Lillo, A.; Nurcato, R.; Grillo, S.; Esposito, S. In-field study on traditional Italian tomato landraces: The constitutive activation of the ROS scavenging machinery reduces effects of drought stress. Plant Physiol. Biochem. 2017, 118, 150–160. [Google Scholar] [CrossRef] [PubMed]
- Wang, H.; Yang, L.; Li, Y.; Hou, J.; Huang, J.; Liang, W. Involvement of ABA- and H2O2-dependent cytosolic glucose-6-phosphate dehydrogenase in maintaining redox homeostasis in soybean roots under drought stress. Plant Physiol. Biochem. 2016, 107, 126–136. [Google Scholar] [CrossRef]
- Lentini, M.; De Lillo, A.; Paradisone, V.; Liberti, D.; Landi, S.; Esposito, S. Early responses to Cadmium exposure in barley plants: Effects on biometric and physiological parameters. Acta Physiol. Plant. 2018, 40, 178. [Google Scholar] [CrossRef]
- Zhao, C.; Wang, X.; Wang, X.; Wu, K.; Li, P.; Chang, N.; Wang, J.; Wang, F.; Li, J.; Bi, Y. Glucose-6-phosphate dehydrogenase and alternative oxidase are involved in the cross tolerance of highland barley to salt stress and UV-B radiation. J. Plant Physiol. 2015, 181, 83–95. [Google Scholar] [CrossRef]
- Arghavani, M.; Zaeimzadeh, A.; Savadkoohi, S.; Samiei, L. Salinity tolerance of Kentucky bluegrass as affected by nitrogen fertilization. J. Agric. Sci. Technol. 2017, 19, 173–183. [Google Scholar]
- Singh, M.; Singh, V.P.; Prasad, S.M. Responses of photosynthesis, nitrogen and proline metabolism to salinity stress in Solanum lycopersicum under different levels of nitrogen supplementation. Plant Physiol. Biochem. 2016, 109, 72–83. [Google Scholar] [CrossRef]
- Esposito, S. Nitrogen assimilation, abiotic stress and glucose 6-phosphate dehydrogenase: The full circle of reductants. Plants 2016, 5, 24. [Google Scholar] [CrossRef]
- De Angeli, A.; Monachello, D.; Ephritikhine, G.; Frachisse, J.-M.; Thomine, S.; Gambale, F.; Barbier-Brygoo, H. The nitrate/proton antiporter AtCLCa mediates nitrate accumulation in plant vacuoles. Nature 2016, 442, 939–942. [Google Scholar] [CrossRef]
- Álvarez-Aragón, R.; Rodríguez-Navarro, A. Nitrate-dependent shoot sodium accumulation and osmotic functions of sodium in Arabidopsis under saline conditions. Plant J. 2017, 91, 208–219. [Google Scholar] [CrossRef] [PubMed]
- Landi, S.; Esposito, S. Nitrate Uptake Affects Cell Wall Synthesis and Modeling. Front. Plant Sci. 2017, 8, 1376. [Google Scholar] [CrossRef] [PubMed]
- Landi, S.; Capasso, G.; Ben Azaiez, F.E.; Jallouli, S.; Ayadi, S.; Trifa, Y.; Esposito, S. Different roles of heat shock proteins (70 kDa) during abiotic stresses in barley (Hordeum vulgare) genotypes. Plants 2019, 8, 248. [Google Scholar] [CrossRef] [PubMed]
- Dwivedi, S.L.; Ceccarelli, S.; Blair, M.W.; Upadhyaya, H.D.; Are, A.K.; Ortiz, R. Landrace germplasm for improving yield and abiotic stress adaptation. Trends Plant Sci. 2016, 21, 31–42. [Google Scholar] [CrossRef] [PubMed]
- Hammami, Z.; Gauffreteau, A.; BelhajFraj, M.; Sahli, A.; Jeuffroy, M.H.; Rezgui, S.; Bergaoui, K.; McDonnell, R.; Trifa, Y. Predicting yield reduction in improved barley (Hordeum vulgare L.) varieties and landraces under salinity using selected tolerance traits. Field Crop. Res. 2017, 211, 10–18. [Google Scholar] [CrossRef]
- FAOstat. Statistical Database 2017. Available online: http://www.fao.org/faostat/en/#home (accessed on 2 July 2020).
- Shen, Q.; Fu, L.; Dai, F.; Jiang, L.; Zhang, G.; Wu, D. Multi-omics analysis reveals molecular mechanisms of shoot adaption to salt stress in Tibetan wild barley. BMC Genom. 2016, 17, 889. [Google Scholar] [CrossRef] [PubMed]
- Lee, S.; Lee, T.; Yang, S.; Lee, Y. BarleyNet: A Network-Based Functional Omics Analysis Server for Cultivated Barley, Hordeum vulgare L. Front. Plant Sci. 2020, 11, 98. [Google Scholar] [CrossRef]
- Gürel, F.; Øztürk, Z.N.; Uçarlı, C.; Rosellini, D. Barley genes as tools to confer abiotic stress tolerance in crops. Front. Plant Sci. 2016, 7, 1137. [Google Scholar] [CrossRef]
- Tuberosa, R. Phenotyping for drought tolerance of crops in the genomics era. Front. Physiol. 2012, 3, 347. [Google Scholar] [CrossRef]
- Groat, R.G.; Vance, C.P. Root nodule enzymes of ammonia assimilation in alfalfa (Medicago sativa L). Plant Physiol. 1981, 67, 1198–1203. [Google Scholar] [CrossRef]
- Singh, R.P.; Srivastava, H.S. Increase in glutamate synthase (NADH) activity in maize seedlings in response to nitrate and ammonium nitrogen. Physiol. Plant. 1986, 66, 413–416. [Google Scholar] [CrossRef]
- Castiglia, D.; Cardi, M.; Landi, S.; Cafasso, D.; Esposito, S. Expression and characterization of a cytosolic glucose 6 phosphate dehydrogenase isoform from barley (Hordeum vulgare) roots. Protein Expr. Purif. 2015, 112, 8–14. [Google Scholar] [CrossRef] [PubMed]
- Nakano, Y.; Asada, K. Hydrogen peroxide is scavenged by ascorbate-specific peroxidase in spinach chloroplasts. Plant Cell Physiol. 1981, 22, 867–880. [Google Scholar]
- Fontaine, V.; Pelloux, J.; Podor, M.; Afif, D.; Gérant, D.; Grieu, P.; Dizengremel, P. Carbon fixation in Pinus halepensis submitted to ozone. Opposite response of ribulose-1,5-bisphosphate carboxylase/oxygenase and phosphoenolpyruvate carboxylase. Physiol. Plant. 1999, 105, 187–192. [Google Scholar] [CrossRef]
- Wendt, U.K.; Wenderoth, I.; Tegeler, A.; Von Schaewen, A. Molecular characterization of a novel glucose-6-phosphate dehydrogenase from potato (Solanum tuberosum L.). Plant J. 2000, 23, 723–733. [Google Scholar] [CrossRef]
- Pajuelo, P.; Pajuelo, E.; Márquez, A.J. Proteolysis of barley (Hordeum vulgare L.) T. ferredoxin-glutamate synthase affects ferredoxin-and methyl viologen-dependent enzyme activities differently. J. Plant Physiol. 2000, 157, 575–579. [Google Scholar] [CrossRef]
- Li, Y.J.; Hai, R.L.; Du, X.H.; Jiang, X.N.; Lu, H. Over-expression of a Populus peroxisomal ascorbate peroxidase (PpAPX) gene in tobacco plants enhances stress tolerance. Plant Breed. 2009, 128, 404–410. [Google Scholar] [CrossRef]
- Maksimović, J.D.; Zhang, J.; Zeng, F.; Živanović, B.D.; Shabala, L.; Zhou, M.; Shabala, S. Linking oxidative and salinity stress tolerance in barley: Can root antioxidant enzyme activity be used as a measure of stress tolerance? Plant Soil 2013, 365, 141–155. [Google Scholar] [CrossRef]
- Chang, Z.; Liu, Y.; Dong, H.; Teng, K.; Han, L.; Zhang, X. Effects of cytokinin and nitrogen on drought tolerance of creeping bentgrass. PLoS ONE 2016, 11, e0154005. [Google Scholar] [CrossRef]
- Sagi, M.; Dovrat, A.; Kipnis, T.; Lips, H. Nitrate reductase, phosphoenolpyruvate carboxylase, and glutamine synthetase in annual ryegrass as affected by salinity and nitrogen. J. Plant Nutr. 1998, 21, 707–723. [Google Scholar] [CrossRef]
- Shi, W.M.; Muramoto, Y.; Ueda, A.; Takabe, T. Cloning of peroxisomal ascorbate peroxidase gene from barley and enhanced thermotolerance by overexpressing in Arabidopsis thaliana. Gene 2001, 273, 23–27. [Google Scholar] [CrossRef]
- Soussi, M.; Ocaña, A.; Lluch, C. Effects of salt stress on growth, photosynthesis and nitrogen fixation in chick-pea (Cicer arietinum L.). J. Exp. Bot. 1998, 49, 1329–1337. [Google Scholar] [CrossRef]
- Stewart, G.R.; Rhodes, D. Nitrogen metabolism of halophytes III. Enzymes of ammonia assimilation. New Phytol. 1978, 80, 307–316. [Google Scholar] [CrossRef]
- Abobatta, W.F. Plant Responses and Tolerance to Combined Salt and Drought Stress. In Salt and Drought Stress Tolerance in Plants; Hasanuzzaman, M., Tanveer, M., Eds.; Springer: Berlin/Heidelberg, Germany, 2020; pp. 17–52. [Google Scholar] [CrossRef]
- Wang, Z.Q.; Yuan, Y.Z.; Ou, J.Q.; Lin, Q.H.; Zhang, C.F. Glutamine synthetase and glutamate dehydrogenase contribute differentially to proline accumulation in leaves of wheat (Triticum aestivum) seedlings exposed to different salinity. J. Plant Physiol. 2007, 164, 695–701. [Google Scholar] [CrossRef]
- Ullah, A.; Li, M.; Noor, J.; Tariq, A.; Liu, Y.; Shi, L. Effects of salinity on photosynthetic traits, ion homeostasis and nitrogen metabolism in wild and cultivated soybean. PeerJ 2019, 7, 8191. [Google Scholar] [CrossRef]
- Goel, P.; Singh, A.K. Abiotic stresses downregulate key genes involved in nitrogen uptake and assimilation in Brassica juncea L. PLoS ONE 2015, 10, e0143645. [Google Scholar] [CrossRef]


© 2020 by the authors. Licensee MDPI, Basel, Switzerland. This article is an open access article distributed under the terms and conditions of the Creative Commons Attribution (CC BY) license (http://creativecommons.org/licenses/by/4.0/).