Abstract
Seed germination and seedling establishment are the most critical stages in the barley (Hordeum vulgare ssp. vulgare L.) life cycle that contribute substantially to grain yield. These two phases are exposed to several forms of environmental stresses such as salinity due to high level of salt accumulation in the soil rhizosphere where seed germination takes place and seedlings emerge from. Previously, we have reported genotypic variability and independent QTLs associated with salinity tolerance at seedling and germination stages. However, genotypic studies on revival of a seedling germinating under salinity stress are yet to close the lack of information between germination and seedling stages. Here, we attempt to close the genetic gap by targeting early seedling survival traits in barley after germination under salinity (NaCl) stress and the various seedling vigour indices. Seedling vigour parameters formed the basis for Quantitative trait locus (QTL) linkage mapping in 103 Doubled Haploid (DH) lines of CM72/Gairdner population, and validated the phenotypic response using a selected diverse panel of 85 barley germplasm. The results indicate that 150 mM NaCl stress significantly reduced all the recorded phenotypic traits compared to 75, 90 and 120 mM NaCl. In both DH population and diversity panel barley germplasm, the highest percentage reduction was recorded in shoot length (65.6% and 50.3%) followed by seedling vigour index length (56.5% and 41.0%), while root length (28.6% and 15.8%) and root dry weight (29.3% and 28.0%) were least reduced when control was compared to150 mM NaCl stress treatment. Six QTLs containing 13 significant markers were detected in the DH population, 3 on chromosomes 1H, 8 on 3H and 2 on 4H with LOD values ranging from 3 to 8 associated with seedling survival traits under salinity stress. Three QTLs one on 1H and two on 3H with closely linked significant markers (Bmac0032, bPb-9418 and bPb-4741), (bPb-4576 and bPb-9624) and (bPb-3623, bPb-5666 and bPb-6383) for 1H and two on 3H respectively formed the regions with high possibility of candidate genes. A QTL on 3H flanked with markers bPb-4576 and bPb-9624 that were detected in more than one salinity survival trait and were closely linked to each other will form a basis for detailed studies leading to gene functional analysis, genetic transformation and marker assisted selection (MAS).
1. Introduction
Barley (Hordeum vulgare ssp. vulgare L.) is an important crop grown globally for its multipurpose uses for malting/brewing purposes, human food and animal feed. While it has been reported to naturally acclimatise to varying environmental conditions, cultivated barley varieties have a narrower genetic diversity to most stresses occasioned by deliberate breeding programmes concentrating on fewer traits [1,2,3]. Most programmes focus on minimising the gap between yield capacity and actual yield under stress by identifying the Quantitative trait loci (QTL) or responsible genes through phenotypic screening and then incorporating it into adapted backgrounds [4]. The seedling stage is one of the most important phases in barley growth and development and is determined by seed germination. It governs production aspects including uniform stand, good nutrients uptake, environmental stresses tolerance and yield [5]. Germination is a stage prompted by water uptake into the embryo leading to root and shoot emergence. It is a foundation for the succeeding seedling stage, and thus plays an imperative role in plant growth and the ultimate yield [6].
Seedling establishment, which is a vital phase in the plant life cycle that lays foundations for the succeeding growth stages, is exposed to numerous environmental stress factors [7,8]. Salinity is among the main factors that affects germination and seedling establishment of most crops including barley [9,10,11,12,13]. Salinity interferes with seed germination and plants growth and developments through (i) osmotic pressure imbalance i.e., initiating water shortage, (ii) ion toxicity, (iii) essential nutrients uptake imbalance and (iv) production of reactive oxygen species (ROS) that act at cellular or at whole plant level to cause physiological and biochemical defects that result to reduced germination, suppressed seedling growth and poor harvest [6,14].
Uniform and timely germination and vigorous seedling growth under saline conditions are some of the key traits when selecting for salinity tolerant genotypes. The ability of a plant to grow under salinity stress determined by the proportion of dissolved salts depends on the potential of the seed to germinate and grow under declining soil osmotic potentials, as well as the plants’ varied internal cellular ionic compositions [15]. Barley is grown on every continent because of its ability to adapt to various environmental conditions [16]. It is produced in a wider topographical area than most other cereals, spreading across more than 100 countries around the world, and is the fourth most important cereal crop [16,17]. The top country by production in the world is Russian Federation at 19,939 thousand tonnes, which is 21.4% of the world’s barley production of 93,392 thousand tonnes, followed by Canada, Ukraine, Australia and Turkey that account for 60.8% collectively [18]. The world’s land affected by salinity is ~1125 million hectares, which is approximately 6% of total global area including 20% of cultivated and 33% of the irrigated land [19]. At the same time, more land area on the planet is being lost to high salinity at the rate of ~1.5 million hectares annually, an indication that ~50% of arable lands will be saline by 2050 [20] Most of the world’s barley producing countries are affected by the salination problem including but not limited to the following Russian Federation, Australia, Bangladesh, USA, China, Egypt, Turkey, India, Mexico, Iran, Syria, Iraq and Pakistan [19]. Several barley growing environments are prone to salinity stress due to high level of salt accumulation in the topsoil due to high evapotranspiration and capillary actions from dry and hot summers. Under such environments, seed germination and seedling development phases are severely impacted by salinity stress until the excessive salt level is leached out of the root zone by rain or irrigation later in the season by the time when the plants are likely to be rather hardened and vigorous [21,22].
Few QTLs for salinity stress tolerance have been reported at seedling level in barley including those governing response to ionic stress [23,24], osmotic stress [25,26] and salinity tolerance [9]. Genome Wide Association analysis of salinity tolerance in a collection of barley accessions from across the globe totaling to 350 identified genomic regions linked with germination stage salinity tolerance [27]. Angessa et al. [9] mapped QTLs associated with germination stage and/or seedling stage salinity tolerance in a DH population of 103 lines developed from CM72 (tolerant) and Gairdner (sensitive). Previous studies demonstrated that salinity tolerance associated QTL at seedling phase vary from those controlling similar response in other development stages [9,28]. However, studies on salinity tolerance at the germination and seedling stages interphase, referred to as seedling survival in this paper, appears to be scant in barley. Seedling survival (the singular vigorous growth of the immediate post-germination phase without seedling loss) is an important trait in growing regions where dry seeding is practicing to fitting the crops growth period into the narrow growing season, where a delayed seeding exposes flowering and grain filling stages to abiotic stress factors that cause massive yield and grain quality reduction. Lack of previous reports on seedling survival as a measure of salinity tolerance and our previous findings of independent QTLs linked with salinity tolerance at germination and seedling stages lead us to: (i) study seedling survival as a measure of salinity tolerance, (ii) identify QTL associated with seedling survival and (iii) identify phenotypic trait as a measure of seedling survival. Building on our previous study, our current study explored salinity tolerance in the stage between germination and seedling in two sets of barley germplasm.
2. Materials and Methods
2.1. Germplasm
Two barley germplasm sets were used for this study. These are (i) 103 Doubled Haploid (DH) lines developed from a cross between CM72 (salinity tolerant parental genotype) and Gairdner (salinity susceptible parental genotype) [9], and (ii) A diverse panel of selected 85 barley entries that included Australian barley varieties, breeding lines and landraces from across the globe representing six continents characterised by different head types and growth habits (Table S1). The diversity panel of 85 barley entries was selected from our recent study conducted on salinity tolerance during germination [27]. Categorised based on the observed germination percentage (GP) under 150 mM NaCl stress, the diversity panel was randomly selected to represent four salinity tolerance categories, namely, tolerant group (>90% GP) (31 entries), moderately tolerant group (80–89% GP) (37 entries), susceptible group (65–79% GP) (10 entries) and sensitive group (<65% GP) (seven entries) (Table S2).
2.2. Germination Assays
Germination experiment of both germplasm sets was conducted using two treatments, namely, 150 mM NaCl or deionised water (DI). Petri dishes with 9 cm diameter were fitted with two filter papers and 100 surface sterilised seeds placed in each. Surface sterilisation of barley seeds was done using 10% sodium hypochlorite for 5 min, followed by thorough rinsing with sterile water [27]. All entries from both germplasm sets were subjected to two treatments in three replications and placed in a dark oven set at ~24 °C temperature level. Sprouted seeds were counted after 72 h from which Germination Percentage (GP) and germination tolerance index (GTI) were calculated as shown in Equations (i) and (ii) below. GP is the number of sprouted seeds expressed as a percentage of the total number of incubated seeds multiplied by 100 [29]. GTI is the ratio of GP under NaCl stress treatment and GP of the same entry under DI water as detailed by [9] and [27].
2.3. Seedling Survival and Vigour Evaluation
Evaluation of entries from both sets of barley germplasm for seedling survival and seedling vigour was conducted on germinated seeds in a glasshouse with a controlled temperature level set to a maximum level of ~24 °C using a hydroponic system [5,30], (Figure S1). Approximately 150 plump and uniform barley seeds per genotype were selected and surface sterilised in 10% sodium hypochlorite solution for ~5 min [27]. The seeds were rinsed thoroughly with distilled water, and then germinated as explained in germination experiment using DI water and four different NaCl concentration levels, namely, 75, 90, 120 and 150 mM. After 4 days of incubation in control or salinity stress in an oven at ~24 °C in dark condition, six uniform seedlings per treatment in three replicates were transplanted and placed in the holes of the lids of the plastic tanks assigned with control or salinity stress treatment as described below.
Six sets of 6L containers with a dimension of 25 cm length, 25 cm width × 12 cm depth were filled with improved Hoagland’s nutrient solution [30]. The modified Hoagland solution comprised of 19.9 µmol/L Fe (III)EDTA, 0.2 mmol/L KH2PO4, 2 mmol/L NH4NO3, 0.3 mmol/L K2SO4, 0.4 mmol/L CaCl2, 46.9 µmol/L H3BO3, 0.4 mmol/L MgSO4, 4.5 µmol/L MnCl2, 0.19 µmol/L CuSO4, 1 µmol/L Na2MoO4 and 0.38 µmol/L ZnSO4 [30]. The containers were then covered with lids with holes that were in turn covered by Kimberly Clark Professional Kleenex Compact Towel tissues. The containers were assigned with control treatment which received pure modified Hoagland’s nutrient solution or four salinity stress levels. Salinity stress assigned containers received modified Hoagland’s nutrient solution and four levels of salinity stress. All the containers were fitted with an electric pump that constantly aerated the solution. Completely randomised design with three replications was used and the experiments were repeated four times. The solution in each tank was replaced after seven days and the pH adjusted to 6.5 through addition of NaOH and/or HCl [31].
Fourteen days after transplanting, three plants per replication were harvested from each entry per treatment and replication. The roots (R) were separated from the shoots (S) at the base, to record the length (L) of each; root length (RL) and shoot length (SL). Harvested root and shoot were put in labelled bags and oven dried at 80 °C temperature for 72 h after which dry weight (DW) was recorded independently; root dry weight (RDW) and shoot dry weight (SDW). Using length and weights measurements recorded on shoots and roots for both treated (tr) and control (ck), Tolerance Indices (I) of roots, shoots were calculated as follows.
Note: Seedling length or dry weight is the sum of roots and shoots length or dry weight.
Assessment for seedling vigour (SV) was based on a previous study that used germination capacity, which is the ability of germinating seeds to give normal seedlings, to estimate seedling vigour and represent the extent of salinity damage to the seedling [32]. SV was calculated as the sum of average of the root and shoot vigour, seedling vigour index (SVI) estimated by modified formula suggested by [33,34,35] as the product of seedling vigour (root and shoot length/weight) by germination percentage, while the Relative seedling vigour indices (RSVI) are the percentage of trSVI divided by ckSVI.
where n refers to number of individual counts.
2.4. Phenotypic Data Analysis
The presented data, unless where it is specified, are the means of three independent replications. Pearson correlation coefficients were used to estimate the association between phenotypic traits pairs, and analysis of variance (ANOVA) was computed to determine if there were significant differences between treatments with the differences significance among mean values tested with Duncan’s Multiple Range tests (DMRT) at p < 0.05. These analyses together with plotting of the graphs were performed using SPSS statistical computer software program [36].
2.5. DNA Extraction and Molecular Marker Selection
Fresh leaf tissues were collected from all DH lines and their parental genotypes (used to build up the linkage map) when their seedlings reached three leaves stage and their genomic DNA extracted using CTAB method as described by [37] and further decontaminated through RNase treatment. Polymorphisms of each marker was then determined by polymer chain reaction (PCR) reactions in a volume of 10 µL and electrophoresis; first using the two parents (CM72 and Gairdner), and then followed by the analysis of individual lines using the selected primers [38]. The Simple Sequence Repeat (SSR) markers were separated by either 2% agarose gel or 6% polyacrylamide gel electrophoresis (PAGE) and visualised under UV following ethidium bromide staining. A total of 350 (Diversity Array Technology Pty Ltd., Canberra, Australia) (DArT) markers (http://www.diversityarrays.com) and 84 single sequence repeat (SSR) markers were selected to survey DH population.
2.6. Genetic Linkage Map Construction and QTL Analysis
An integrated genetic linkage map was developed using MapQTL 5.0 software [39], with 350 Diversity Array Technology (DArT) and 84 Simple Sequence Repeat (SSR) markers. Interval mapping (IM) function was used to perceive significant QTLs passing a logarithm of odds (LOD) and a threshold score of 3.0 at p < 0.05 was used to declare a significant locus for phenotype data. This was predicted by execution genome-wide permutation analysis done in MapQTL 5.0 with 1000 permutations of the original data on each salinity seedling survival trait that resulted in a 95% LOD threshold of around 3.0. The intervals flanking each QTL on the right and left was determined, by taking two positions peak, with LOD values lower than the maximum after performing restricted multiple QTL model (MQM) mapping. R2 which is the percentage variance elucidated by each QTL was attained by restricted MQM mapping [39]. The graphical image of the linkage map and QTL was done in MapChart 2.2 [40]. Broad sense heritability (H2) estimates were done using the formula proposed by [41] using genotypic (σ2g) and phenotypic (σ2 p) variances. The respective genotypic and phenotypic variances were calculated from the mean squares of the genotypes (MSg) and experimental error (MSe) as shown below.
where r refers to number of replicates.
3. Results
3.1. Phenotypic Response to Salinity Stress
Salinity stress reduced seedling survival traits recorded on young plants from seeds germinated under various salinity levels in the DH population (103 lines) and diverse barley germplasm panel (85 entries) without any mortality. Salt concentration of 150 mM NaCl had a higher effect on DH lines seedling survival than 75, 90 and 120 mM NaCl treatment levels (Figure 1A). In our second experiment of diverse barley germplasm panel, we only used two salinity levels of 75 and150 mM NaCl because we did not record much variation among 75, 90 and 120 mM NaCl in the DH population trial (Figure 1A,B). The lowest salinity stress level of 75 mM NaCl increased root length (18.9cm) with almost no variation observed in the whole seedling length (4.7cm) and root weight (1.0 mg) compared to observations in the control treatment (Figure 1B). Overall, among the four levels of salinity concentration treatments used in this study, the highest level of 150 mM NaCl adversely and consistently affected shoot, root and seedling length or dry weight in both the DH population and diverse barley germplasm panel. Compared with observations made under control treatment, the 150 mM NaCl concentration treatment caused almost 50% reduction in most traits (Figure 1A,B).
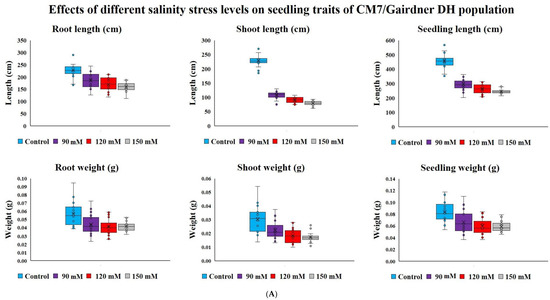
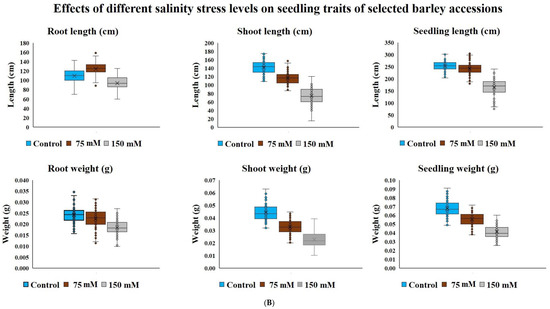
Figure 1.
(A) Block plots for seedling survival traits of CM72/Gairdner DH populations under different levels of NaCl concentrations (mM) grown in hydroponic solutions after germinating under the same conditions; (B) Block plots for seedling survival traits of selected barley accessions under different levels of NaCl concentrations (mM) grown in hydroponic solutions after germinating under the same stress.
Due to strong effect of 150 mM NaCl level on almost all the traits, our further investigation into genotypic differences in seedling survival in two barley germplasm sets in this study was based on observations made under the highest salinity level and the control treatments. Salinity stress with 150 mM NaCl reduced all the traits in both DH population and diversity barley panel (Figure 2). Salinity stress did not only reduced germination, but it also impacted negatively on seedling growth to an extent of 50% (Table 1). High germination tolerance index was not a direct reflection of a high Relative seedling vigour index (RSVI) in selected barley accessions, for instance, WABAR2347 had the highest germination index (97.0%) but with (50.2% and 53.1%) RSVI by length and DW respectively (Figure 3). Starting with DH population then diversity panel barley set, the highest reduction was recorded in shoot length (65.6% and 50.4%) followed by seedling vigour index by length (56.4% and 41.0%), and root length (28.7% and 15.9%) and root dry weight (29.8% and 30.4%) respectively. Seedling vigour indices best explained the seedling survival of sprouted plants after germinating in salinity stress since it related the two traits (germination and early seedling growth). Barley entries seedling stage phenotypic traits variation assessed under 150 mM NaCl stress treatment exhibited considerable variations in both CM72/Gairdner DH population and barley germplasm diversity panel (Table 1). The average GTI was highest for both DH population and diversity panel at 81.3% and 83.7%, while R/SDWI was the lowest at 12.4% and 13.4%, respectively. BmnL-75 had the highest RSVI for both length (84.5%) and weight (79.9%) but with a GTI of 88.9% among the diversity panel germplasm set (Figure 3). Interestingly, C01P-53 recorded the lowest level of indices in GTI (42.4%), RSVIL (25.5%) and 21.6% for RSVIDW (Figure 3 and Table S3).
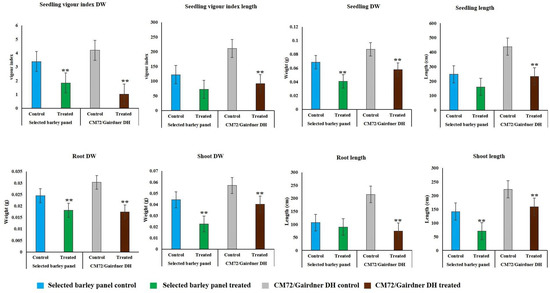
Figure 2.
Effect of 150 mM NaCl on seedling survival traits and seedling vigour indices of CM72/Gairdner DH populations and selected barley diversity panel. Values are given as mean ± SD of six experiments in each group. Error bars that are not overlapping differ significantly at p ≤ 0.05 and ** indicate significant difference between control and in the salt treatment at p < 0.05.

Table 1.
Seedling survival extent of variations in barley germplasms in response to 150 mM NaCl salinity stress.
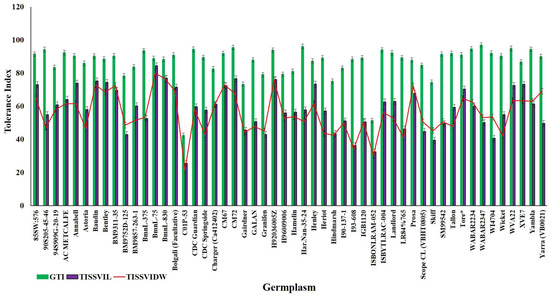
Figure 3.
Representation of the highly tolerant and extremely sensitive 15 genotypes for germination tolerance index (GTI; blue line), Relative seedling vigour index by length (RSVIL; red line) and Relative seedling vigour index by DW (RSVIDW; green line).
In DH population, trSVIL ranged from 46.3 to 131.6 cm, RSVIL from 26.1% to 80.3%, trSVIDW from 0.5 to 1.9 g. and RSVIDW from 15.1% to 76.7%. The range of values for seedling vigour indices in barley diversity panel were; 23.0–118.4cm for trSVIL, 25.4%–88.3% for RSVIL, 0.8–3.3 g for trSVIDW and 22.0%–84.8% for RSVIDW. The highest value Relative seedling vigour indices (RSVI) for both L and DW were recorded in BmnL-75 (84.4% and 79.9%) while the lowest was (25.5% and 21.6%) recorded in C01P-53 (Table 1). Frequency distributions of RSVIL and RSVIDW are shown in Supplementary Figure S2; the traits showed a normal distribution and the DH population was transgressive.
3.2. Correlation among Seedling Traits
Pearson correlation between seedling survival traits under 150 mM NaCl are presented separately for CM72/Gairdner DH population and barley diverse panel (Table 2). Associations among all the recorded seedling character ranged from positive to negatives, for both DH population and diverse panel. The highest correlation coefficients (r = 0.8 **) was detected between trRDW and trSDW for the DH population and (r = 0.9 **) observed between trSVIL and RSVIL for diversity panel set. The results indicated that there were significant positive correlations among trSVIL, RSVIL, trSVIDW treated and RSVIDW at p < 0.05 in both sets of genotypes (Table 2). GTI showed positive correlations with trSVIL, RSVIL, trSVIDW and RSVIDW in both sets with varying strengths, but significant (p < 0.05).
Table 2.
Pearson correlation among seedling survival traits of diverse barley panel (above) and CM72/Gairdner DH (below main diagonal) in 150 mM NaCl.
3.3. Bi-Parent QTL Mapping for Seedling Survival Traits
The CM72/Gairdner DH population showed a transgressive segregation in relation to their individual parents for seedling survival forming the basis for mapping of QTL for salinity stress tolerance (Figure S2). We did not do QTL and marker–trait association analysis for GTI for DH population and diverse panel because we had already reported them in our previous studies. Three hundred and fifty DArT and 84 SSR markers in our Bi-parent population were polymorphic amongst (CM72 and Gairdner), and were thereafter evaluated in the remaining 103 lines before the scores being used for genetic linkage map construction. We detected new QTLs for seedling survival traits under salinity stress totaling to 13 on chromosomes 1H, 3H and 4H (Table 3 and Figure S3). Two markers bPb-9624 (173.172 cM) and bPb-1278 (78.006 cM) were mapped on chromosome 3H and 4H for trRL with LOD values of 7.7 and 3.6, explaining 29.0% and 7.6% of the phenotypic variations, respectively. Marker bPb-9624 was contributed by CM72 with an additive effect of 3.5, while bPb-1278 had -1.8 from Gairdner. Two other markers bPb-3623 (190.268 cM) and bPb-5666 (189.664 cM) on 3H were detected for trSVL at position 190.268 cM and 189.664 cM, having LOD values of 5.1 and 5.0, respectively, that explained between 19.0% and 21.0% of the phenotypic variation from CM72 parent. Almost at the same position (190.981 cM) as trSVL, marker bPb-6383 (190.981 cM) was mapped on 3H for trSVDW, it recorded LOD value of 3.5 that contributed 10.5% of the variation from CM72. We further mapped eight markers, three for trSVIL (bPb-4576 and bPb-9624 on 3H and bPb-9820 on 4H) and five for trSVIDW (Bmac0032, bPb-9418 and bPb-4741on 1H respectively and bPb-4616 and bPb-9624 on 3H). The position of trSVIL markers were 184.281 and 173.172 cM for bPb-4576 and bPb-9624 on 3H, and bPb-9820 on 4H was at 244.943 cM, while trSVIDW markers were located at 28.004, 40.875 and 25.075 cM on 1H, respectively, and 142.225 and 173.172 cM on 3H. All the trSVIL and trSVIDW markers except bPb-9820 were contributed by CM72 and were explaining between 8.1% and 21.8% of the total phenotypic variation. Its worthy noting that marker bPb-9624 was detected for trRL, trSVIL and trSVIDW (Table 3).
Table 3.
Quantitative Traits Loci (QTL) linked with seedling survival traits mapped using CM72/Gairdner DH population.
3.4. Core QTLs Regions for Seedling Survival Traits under Salinity Stress Mapped on 3H and 1H
A total of eight markers were detected on chromosome 3H, with a region flanked by markers bPb-4576 and bPb-9624 in the DH population being detected in more than one trait (trRL, trSVIL and trSVIDW). Notably, three more markers detected on 3H, bPb-3623, bPb-5666 and bPb-6383 were closely linked to the above flanking markers, while bPb-4616 was a distance from them (Table 3). On 4H, we mapped two markers, bPb-1278 and bPb-9820 that were distanced from each other, whereas, on 1H we recorded three markers Bmac0032, bPb-9418 and bPb-4741 that were closely linked to each other. The region mapped by markers on 3H and 1H can therefore be considered for further validation and fine mapping.
4. Discussion
4.1. The Dynamic Reaction of Barley Seedlings to Salinity Induced Stress
In a plant life cycle, seeds have maximum capacity to tolerate environmental pressures, while germination and seedlings growth stages are extremely delicate. Therefore, to establish a good crop population stand requires well adapted genotypes both at germination and seedling growth stages [42,43]. Seed germination is impaired by salinity stress in barley and its tolerance depends on the genotype [9,27]. Salinity stress delays/inhibits the imbibition process of a seed during germination by reducing the surrounding osmotic potential making the emerging seedling less vigorous. In our context, NaCl reduced seed germination and seedling vigour of barley genotypes as indicated by Figure 1 and Figure 2. The findings indicated the difference in responses for seed germination and seedling developmental traits of DH population and selected barley diversity panel under salinity stress. As expected, there was higher negative impact of the salt on both germination and seedling traits when the concentration of NaCl was increased. These results were in line with those reported by [44], using 0.0, 0.25, 0.275 and 0.30 M salt concentrations in barley (Hordeum vulgare cv. Bülbül 89), 0.0%, 1.0%, 1.5%, 2.0% and 2.5% in Sorghum (Sorghum bicolor L. Moench) and 160 mM NaCl in maize (Zea mays L.) by [14,45,46].
At 150 mM NaCl, the highest concentration level used in our study, it was recorded that the germination tolerance index and seedling vigour indices were varied among the barley genotypes. After seed germination (root emerging from seed), the growth of shoot starts through a process of intense cell divisions that is very responsive to water scarcity [47], and more sensitive to hostile ionic ratio because of undeveloped vacuole [48]. Consequently, the suppressed growth of barley seedlings can be linked to inhibition effect of salinity stress during germination [44]. This is an indication that the negative effect of salinity on seedling survival in this study was initially due to osmotic stress. The findings reported by [44], suggest similar mechanisms when hydrogen peroxide (H2 O2) was applied as an osmo-protectant in barley to alleviate salinity stress effect during germination and early seedling growth. The findings also go in line with what was reported in Grass Pea (Lathyrus sativus L.) [49], rice (Oryza sativa), soybean (Glycine max), wheat (Triticum aestivum) and Arabidopsis plants [50].
Early seedling vigour (ESV), determines even emergence and speedy development of plants in stressing condition in which they grow and stabilise the ultimate yield [51]. In most cases, it is expressed in terms of seedling height and weight with little regards to the germination capacity [52,53]. However, seedling emergence under field condition is an indication of a rapid germination and early seedling vigour which can be best expressed by Seedling vigour index (SVI). SVI is influenced by physiological, genetic, storage and the germinating condition of a seed [53]. In the current study, storage and germinating conditions was held constant therefore, the physiological and genetic aspects were evaluated though genotype-phenotype mapping by QTL analysis [54].
4.2. Major QTLs Locations and the Comparison of the Two Analysis Methods
The QTLs reported for salinity tolerance at germination stage in our previous studies [9,27], were different from what is reported here for seedling survival traits. Using the same DH population included in this study, [9,28] mapped QTLs for early seedling growth stage, late phenotypic agronomic and physiological traits on all chromosomes. Comparable to their findings, our seedling survival QTLs were located on chromosomes 1H, 3H and 4H (Table 3). The QTLs located on 3H and 4H and were closely linked to those reported by [9]. Two QTLs on 3H contributed by CM72 and recognised by markers bPb-4576 (184.281 cM) and bPb-9624 (173.172 cM) were closely linked to bPb-6504 (176.5 cM) associated with 50% seedling emergence in 150 mM NaCl dry weight, fresh weight and dry weight of 50% full 1st leaf expansion under 150 mM NaCl reported by [9]. The same markers (bPb-4576 and bPb-9624) were distantly linked to bPb-1961 (161.1 cM) and bPb-1579 (159.8 cM) reported previously together with bPb-3634 (192.8 cM) for fresh weight of 50% full 1st leaf expansion under 150 mM NaCl [9] and dry weight at late growth stage under control condition [28].
Using 172 DH lines generated from YYXT (salinity-tolerant) and Franklin (salinity-sensitive), [55] identified five QTLs for salinity tolerance on 1H, 2H, 5H, 6H and 7H, accounting for not less than 50% of the fore-leaf chlorosis and plant survival difference. The experiment also included the two parents CM72 and Gairdner used in this study, whose results confirmed their difference in response to salinity stress as reported here. Mano and Takeda, [56] used two DH populations derived from the crosses, Steptoe/Morex and Harrington/TR306 by interval mapping analysis to detect five QTLs governing salinity stress tolerance at germination and the seedling stage. The study findings indicated that QTLs for salinity tolerance at germination is different from those at seedling stage. Later, twenty-three QTLs were reported by [57] for salt tolerance using Steptoe×Morex DH population at seedling stage on all chromosomes except 4H. Further, in a hydroponic experiment, [58] reported one major QTL on 2H controlling 50% of phenotypic variation to salinity tolerance in Chinese landrace of barley using 188 DH lines generated from TX9425 (salinity tolerant) and Naso Nijo (salinity sensitive) by leaf chlorosis and plant survival. Using the same population as [58,59], reported four QTLs on 1H, 2H, 5H and 7H for physiological traits linked with salt tolerance at seedling stage in barley. Like our study, [60] used 206 barley genotypes from across the globe in a potting experiment inside a glasshouse to identify 24 markers associated with salinity stress on all chromosomes except 1H by combining scores for plant survival and leaf chlorosis. Marker bPb-6504 reported in that study on 3H was closely linked to two markers bPb-4576 and bPb-9624 reported in the current study illumination a possibility of them being the same QTL. Using 2671 barley lines from a USDA mini-core collection, [61] identified SNPs on 4H associated with salt tolerance in a region with HKT1;5 ion transporter (HORVU4Hr1G087960, location; 638634849–638636785bp) that is responsible for withdrawing Na+ from the xylem. The location of the SNPs is very close to the marker (bPb-9820) on 4H (638546732bp) reported in our current results. Further, [60] predicted the possibility of a salinity tolerance genes on 4H related to ion homeostasis linked to marker bPb-9668. Using Association Mapping in a structured barley population of 103, [62] reported 9 markers for salt tolerance, 12 for Potassium ion (K+) and Sodium ion (Na+) across the whole barley genome.
We predicted a region on chromosome 3 that is likely to harbour putative genes for seedling salinity survival after salinity stress germination. A search in barley genome [63] gave us 36 genes (Table S4) from the flanking region. Late embryogenesis abundant protein Lea, receptor-like kinase and Dehydrin families were noticeable, all of which have been associated with drought and salinity stress [64,65,66]. Overexpressing these genes in model plants can be used to elucidate their functions if it increases tolerance levels or reduced survival capacity in salinity stress when knocked down. The finding of this research can be further validated and fine mapped by either GWAS or other DH populations. Using the GWAS approach, a diverse panel of barley accessions with a wide geographic origin having 632 genotypes and 30,543 SNP markers by [67] is perfect. Association analysis will be used to identify SNPs that are overlapping with the QTLs reported in this study and facilitate the pinpointing of candidate genes. Alternatively, using a DH population developed form parents with contrasting salinity tolerance like TX9425 salinity tolerant and Naso Nijo salinity sensitive by Xu et al. (2012) and YYXT (salinity tolerant) and Franklin (salinity-sensitive) by [55] in relation to the current DH population can be used.
5. Conclusions and Recommendations
In the current study, we recorded a large phenotypic difference among early seedling growth traits in response to salinity stress. Two major QTLs for seedling vigour indices were mapped on chromosome 3H using CM72/Gairdner DH population in addition to two more on 1H and 4H. Further literature search indicated that some genes in the hotspot on 3H have been reported to enhance salinity and other abiotic stresses in plants. The supposed candidate genes and identified markers will be a source of important information for studies on gene finding and functional analysis and marker-assistant selection (MAS) breeding. Before that, we recommend validation studies to evaluate the allele effects precisely using a larger number of accessions by Genome-Wide Association Analysis (GWAS) and other DH populations. Extra fine mapping of the region on 3H and 1H will enable narrowing down to the putative gene and development of stable barley varieties with vigorous seedlings under salinity through genetic transformation and associated studies. The identified QTLs will form an important basis for development of new barley lines that can survive salinity stress during germination and early seedling stage. The markers will be used for pyramiding the seedling salinity survival QTLs by MAS and allow for release of barley varieties that will have a vigorous seedling growth in saline prone region of the world.
Supplementary Materials
The following are available online at https://www.mdpi.com/2073-4395/11/1/103/s1, Table S1. Accessions used for association analysis; Table S2. Germination % of barley varieties to 150mM NaCl; Table S3. List of top and bottom 15 genotypes for germination tolerance index, Tolerance index salinity seedling; Table S4. Genes from barley genome in the two important regions on 3H; Figure S1. Production of barley seedling under hydroponic solution phenotyping; Figure S2. Histograms of seedling vigour index tolerance index (SVI TI) Length (L) and weight (DW) for selected barley genotypes and CM72/Gairdner DH population under 150 mM NaCl; Figure S3. Locations of the QTLs for seedling survival traits in barley after germinating under salinity stress in CM72/Gairdner DH population.
Author Contributions
E.M. performed the experiments, data analysis, interpretation and drafting of the manuscript; G.Z. constructed the molecular linkage map and QTL mapping; Y.H. and T.T.A. guided in the experiment; C.L. conceived the project; E.M., Y.H., T.T.A. and C.L. revised the paper and approved the final version to be published.
Funding
This research was supported by grants from Grains Research and Development Corporation (GRDC), scholarship from Murdoch University and additional funds from the Department of primary and Industry and Regional Development of Western Australia Government.
Acknowledgments
The authors are obliged to Australian Grains Research and Development Corporation (GRDC), Murdoch University and The Department of Primary Industries and Regional Development for financial and technical support. The expertise support from several institutional staffs of the university and access to facilities of Western Crops Genetics Alliance, Western Australian State Agricultural Biotechnology Centre and The Department of Primary Industries and Regional Development is cherished.
Conflicts of Interest
The authors of this paper affirm that the research was carried out without any profitable or monetary relationships that might be interpreted as a possible conflict of interest.
References
- Angessa, T.; Chen, K.; Farleigh, D.; Bussanich, J.; McFawn, L.A.; Whitfield, K.; Weir, B.; Cosh, S.; Chimdi, A.; Gurmu, G.; et al. Exploring barley germplasm for yield improvement under sulphur-limiting environments. In Achieving Sustainable Cultivation of Barley; Burleigh Dodds Science Publishing: Cambridge, UK, 2020; pp. 1–25. [Google Scholar]
- Hill, C.B.; Angessa, T.T.; Zhang, X.Q.; Chen, K.; Zhou, G.; Tan, C.; Wang, P.; Westcott, S.; Li, C. A global barley panel revealing genomic signatures of breeding in modern cultivars. bioRxiv 2020. [Google Scholar] [CrossRef]
- Mikołajczak, K.; Ogrodowicz, P.; Ćwiek-Kupczyńska, H.; Weigelt-Fischer, K.; Mothukuri, S.R.; Junker, A.; Altmann, T.; Krystkowiak, K.; Adamski, T.; Surma, M.; et al. Image Phenotyping of Spring Barley (Hordeum vulgare L.) RIL Population under Drought: Selection of Traits and Biological Interpretation. Front. Plant Sci. 2020, 11, 743. [Google Scholar] [CrossRef] [PubMed]
- Berger, B.; Parent, B.; Tester, M. High-throughput shoot imaging to study drought responses. J. Exp. Bot. 2010, 61, 3519–3528. [Google Scholar] [CrossRef] [PubMed]
- Wang, Q.; Sun, G.; Ren, X.; Wang, J.; Du, B.; Li, C.; Sun, D. Detection of QTLs for seedling characteristics in barley (Hordeum vulgare L.) grown under hydroponic culture condition. BMC Genet. 2017, 18, 94. [Google Scholar] [CrossRef] [PubMed]
- Xue, W.; Yan, J.; Jiang, Y.; Zhan, Z.; Zhao, G.; Tondelli, A.; Luigi, C.; Cheng, J. Genetic dissection of winter barley seedling response to salt and osmotic stress. Mol. Breed. 2019, 39, 137. [Google Scholar] [CrossRef]
- Batool, N.; Ilyas, N.; Shahzad, A.; Hauser, B.A.; Arshad, M. Quantitative trait loci (QTLs) mapping for salt stress tolerance in wheat at germination stage. Pak. J. Agric. Sci. 2018, 55, 47–55. [Google Scholar]
- Sedzik, M.; Smolik, B.; Krupa-Malkiewicz, M. Effect of nicotinamide in alleviating stress caused by lead in spring barley seedling. J. Elementol. 2019, 24, 281–291. [Google Scholar]
- Angessa, T.T.; Zhang, X.Q.; Zhou, G.; Zhang, W.; Li, C.; Broughton, S. Early growth stages salinity stress tolerance in CM72 × Gairdner doubled haploid barley population. PLoS ONE 2017, 12, e0179715. [Google Scholar] [CrossRef]
- Williams, G.; Vanniarajan, C.; Vetriventhan, M.; Thiageshwari, S.; Anandhi, K.; Rajagopal, B. Genetic variability for seedling stage salinity tolerance in barnyard millet [Echinochloa frumentaceae (Roxb.) Link]. Electron. J. Plant Breed. 2019, 10, 552–558. [Google Scholar] [CrossRef]
- Priyadharshini, B.; Vignesh, M.; Prakash, M.; Anandan, R. Evaluation of black gram genotypes for saline tolerance at seedling stage. Indian J. Agric. Res. 2019, 53, 83–87. [Google Scholar]
- Thanh, N.V.; Bharali, B. Salinity stress on rice (Oryza sativa L.) crop and its amelioration. J. Pharmacogn. Phytochem. 2019, 8, 1435–1441. [Google Scholar]
- Aminifard, M.H.; Bayat, H. Evaluation of Seed Germination and Seedling Growth Characteristics of Sweet Pepper (Capsicum annuum) Under Salinity and Drought Treatment. Iran. J. Seed Res. 2020, 6, 137–149. [Google Scholar] [CrossRef]
- Rajabi Dehnavi, A.; Zahedi, M.; Ludwiczak, A.; Cardenas Perez, S.; Piernik, A. Effect of Salinity on Seed Germination and Seedling Development of Sorghum (Sorghum bicolor (L.) Moench) Genotypes. Agronomy 2020, 10, 859. [Google Scholar] [CrossRef]
- Kanbar, A. Effect of salinity stress on germination and seedling growth of barley (Hordeum vulgare L.) varieties. Adv. Environ. Biol. 2014, 1, 244–248. [Google Scholar]
- Ko, J.; Ng, C.T.; Jeong, S.; Kim, J.H.; Lee, B.; Kim, H.Y. Impacts of regional climate change on barley yield and its geographical variation in South Korea. Int. Agrophys. 2019, 33, 81–96. [Google Scholar] [CrossRef]
- Giraldo, P.; Benavente, E.; Manzano-Agugliaro, F.; Gimenez, E. Worldwide research trends on wheat and barley: A bibliometric comparative analysis. Agronomy 2019, 9, 352. [Google Scholar] [CrossRef]
- USDA (United States Department of Agriculture). World Agricultural Production, Foreign Agricultural Service; USDA: Washington, DC, USA, 2020.
- Hossain, M.S. Present scenario of global salt affected soils, its management and importance of salinity research. Int. Res. J. Biol. Sci. 2019, 1, 1–3. [Google Scholar]
- Hasanuzzaman, M.; Nahar, K.; Alam, M.; Bhowmik, P.C.; Hossain, M.; Rahman, M.M.; Prasad, M.N.V.; Ozturk, M.; Fujita, M. Potential use of halophytes to remediate saline soils. BioMed Res. Int. 2014, 2014, 589341. [Google Scholar] [CrossRef]
- El Goumi, Y.; Fakiri, M.; Lamsaouri, O.; Benchekroun, M. Salt stress effect on seed germination and some physiological traits in three Moroccan barley (Hordeum vulgare L.) cultivars. J. Mater. Environ. Sci. 2014, 5, 625–632. [Google Scholar]
- Ho, W.W.H.; Hill, C.B.; Doblin, M.S.; Shelden, M.C.; van de Meene, A.; Rupasinghe, T.; Roessner, U. Integrative Multi-Omics analyses of Barley Rootzones under salinity stress reveal two distinctive salt tolerance mechanisms. Plant Commun. 2020, 2020, 100031. [Google Scholar] [CrossRef]
- Witzel, K.; Weidner, A.; Surabhi, G.K.; Varshney, R.K.; Kunze, G.; Buck-Sorlin, G.H.; Mock, H.P. Comparative analysis of the grain proteome fraction in barley genotypes with contrasting salinity tolerance during germination. Plant Cell Environ. 2010, 33, 211–222. [Google Scholar] [CrossRef] [PubMed]
- Xue, W.; Yan, J.; Zhao, G.; Jiang, Y.; Cheng, J.; Cattivelli, L.; Tondelli, A. A major QTL on chromosome 7HS controls the response of barley seedling to salt stress in the Nure× Tremois population. BMC Genet. 2017, 18, 79. [Google Scholar] [CrossRef]
- Bálint, A.F.; Szira, F.; Börner, A.; Galiba, G. Segregation-and association based mapping of loci influencing osmotic tolerance in barley. Acta Biol. Szeged. 2008, 52, 101–102. [Google Scholar]
- Wójcik-Jagła, M.; Rapacz, M.; Tyrka, M.; Kościelniak, J.; Crissy, K.; Żmuda, K. Comparative QTL analysis of early short-time drought tolerance in Polish fodder and malting spring barleys. Theor. Appl. Genet. 2013, 126, 3021–3034. [Google Scholar] [CrossRef] [PubMed]
- Mwando, E.; Han, Y.; Angessa, T.T.; Zhou, G.; Hill, C.B.; Zhang, X.Q.; Li, C. Genome-wide association study of salinity tolerance during germination in barley (Hordeum vulgare L.). Front. Plant Sci. 2020, 11, 118. [Google Scholar] [CrossRef] [PubMed]
- Xue, D.; Huang, Y.; Zhang, X.; Wei, K.; Westcott, S.; Li, C.; Chen, M.; Zhang, G.; Lance, R. Identification of QTLs associated with salinity tolerance at late growth stage in barley. Euphytica 2009, 169, 187–196. [Google Scholar] [CrossRef]
- Adjel, F.; Kadi, Z.; Bouzerzour, H.; Benmahammed, A. Salt stress effects on seed germination and seedling growth of barley (Hordeum Vulgare L.) genotypes. J. Agric. Sustain. 2013, 3, 223–237. [Google Scholar]
- Han, Y.; Yin, S.; Huang, L.; Wu, X.; Zeng, J.; Liu, X.; Qiu, L.; Munns, R.; Chen, Z.H.; Zhang, G. A sodium transporter HvHKT1; 1 confers salt tolerance in barley via regulating tissue and cell ion homeostasis. Plant Cell Physiol. 2018, 59, 1976–1989. [Google Scholar] [CrossRef]
- Karunarathne, S.D.; Han, Y.; Zhang, X.Q.; Zhou, G.; Hill, C.B.; Chen, K.; Angessa, T.; Li, C. Genome-wide association study and identification of candidate genes for nitrogen use efficiency in barley (Hordeum vulgare L.). Front. Plant Sci. 2020, 11, 1361. [Google Scholar] [CrossRef]
- Zhao, X.; Joo, J.C.; Kim, D.; Lee, J.; Kim, J.Y. Estimation of the seedling vigor index of sunflowers treated with various heavy metals. J. Bioremediat. Biodegrad. 2016, 7, 353. [Google Scholar] [CrossRef]
- Abdul-Baki, A.A.; Anderson, J.D. Vigor determination in soybean seed by multiple criteria. Crop Sci. 1973, 13, 630–633. [Google Scholar] [CrossRef]
- Sagar, A.; Tajkia, J.E.; Haque, M.E.; Fakir, M.S.A.; Hossain, A.K.M.Z. Screening of sorghum genotypes for salt-tolerance based on seed germination and seedling stage. Fundam. Appl. Agric. 2019, 4, 735–743. [Google Scholar] [CrossRef]
- Podder, S.; Ray, J.; Das, D.; Sarker, B.C. Effect of salinity (NaCl) on germination and seedling growth of mungbean (Vigna radiata L.). J. Biosci. Agric. Res. 2020, 24, 2012–2019. [Google Scholar] [CrossRef]
- IBM Corporation. IBM SPSS Statistics for Windows; Version 25.0; IBM Corp.: Armonk, NY, USA, 2017. [Google Scholar]
- Stein, N.; Herren, G.; Keller, B. A new DNA extraction method for high-throughput marker analysis in a large-genome species such as Triticum aestivum. Plant Breed. 2001, 120, 354–356. [Google Scholar] [CrossRef]
- Wang, D.; Shi, J.; Carlson, S.R.; Cregan, P.B.; Ward, R.W.; Diers, B.W. A low-cost, high-throughput polyacrylamide gel electrophoresis system for genotyping with microsatellite DNA markers. Crop Sci. 2003, 43, 1828–1832. [Google Scholar] [CrossRef]
- Ooijen, V. MapQTL5.0, Software for the Mapping of Quantitative Trait Loci in Experimental Populations; Kyazma BV: Wageningen, The Netherlands, 2004. [Google Scholar]
- Voorrips, R.E. MapChart: Software for the graphical presentation of linkage maps and QTLs. J. Hered. 2002, 93, 77–78. [Google Scholar] [CrossRef]
- Sayed, M.A.; Hamada, A.; Lèon, J.; Naz, A.A. Genetic mapping reveals novel exotic QTL alleles for seminal root architecture in barley advanced backcross double haploid population. Euphytica 2017, 213, 2. [Google Scholar] [CrossRef]
- Qu, X.X.; Huang, Z.Y.; Baskin, J.M.; Baskin, C.C. Effect of temperature, light and salinity on seed germination and radicle growth of the geographically widespread halophyte shrub Halocnemum strobilaceum. Ann. Bot. 2008, 101, 293–299. [Google Scholar] [CrossRef]
- Debez, A.; Ben Slimen, I.D.; Bousselmi, S.; Atia, A.; Farhat, N.; El Kahoui, S.; Abdelly, C. Comparative analysis of salt impact on sea barley from semi-arid habitats in Tunisia and cultivated barley with special emphasis on reserve mobilization and stress recovery aptitude. Plant Biosyst. Int. J. Deal. Asp. Plant Biol. 2019, 17, 1–9. [Google Scholar] [CrossRef]
- Kilic, S.; Kahraman, A. The Mitigation Effects of Exogenous Hydrogen Peroxide when Alleviating Seed Germination and Seedling Growth Inhibition on Salinity-Induced Stress in Barley. Pol. J. Environ. Stud. 2016, 25, 1053–1059. [Google Scholar] [CrossRef]
- Wang, H.; Chen, G.; Zhang, H.; Liu, B.; Yang, Y.; Qin, L.; Chen, E.; Guan, Y. Identification of QTLs for salt tolerance at germination and seedling stage of Sorghum bicolor L. Moench. Euphytica 2014, 196, 117–127. [Google Scholar] [CrossRef]
- Cui, D.; Wu, D.; Somarathna, Y.; Xu, C.; Li, S.; Li, P.; Zhang, H.; Chen, H.; Zhao, L. QTL mapping for salt tolerance based on snp markers at the seedling stage in maize (Zea mays L.). Euphytica 2015, 203, 273–283. [Google Scholar] [CrossRef]
- Nonogaki, H.; Bassel, G.W.; Bewley, J.D. Germination—Still a mystery. Plant Sci. 2010, 179, 574–581. [Google Scholar] [CrossRef]
- Alam, M.Z.; Stuchbury, T.; Naylor, R.E.L. Effect of NaCl and PEG induced osmotic potentials on germination and early seedling growth or rice cultivars differing in salt tolerance. Pak. J. Biol. Sci. 2002, 5, 1207–1210. [Google Scholar] [CrossRef][Green Version]
- Tokarz, B.; Wójtowicz, T.; Makowski, W.; Jędrzejczyk, R.J.; Tokarz, K.M. What is the Difference between the Response of Grass Pea (Lathyrus sativus L.) to Salinity and Drought Stress?—A Physiological Study. Agronomy 2020, 10, 833. [Google Scholar] [CrossRef]
- Kataria, S.; Verma, S.K. Salinity stress responses and adaptive mechanisms in major glycophytic crops: The story so far. In Salinity Responses and Tolerance in Plants; Springer: Cham, Switzerland, 2018; Volume 1, pp. 1–39. [Google Scholar]
- Wen, D.; Hou, H.; Meng, A.; Meng, J.; Xie, L.; Zhang, C. Rapid evaluation of seed vigor by the absolute content of protein in seed within the same crop. Sci. Rep. 2018, 8, 5569. [Google Scholar] [CrossRef]
- Lu, X.L.; Niu, A.L.; Cai, H.Y.; Zhao, Y.; Liu, J.W.; Zhu, Y.G.; Zhang, Z.H. Genetic dissection of seedling and early vigor in a recombinant inbred line population of rice. Plant Sci. 2007, 172, 212–220. [Google Scholar] [CrossRef]
- Capo-chich, L.; Eldridge, S.; Elakhdar, A.; Kumamaru, T.; Anyia, A. Major QTLs for seedling traits in barley using a DArT-based linkage map. bioRxiv 2019. [Google Scholar] [CrossRef]
- Zhu, C.; Gore, M.; Buckler, E.S.; Yu, J. Status and Prospects of Association Mapping in Plants. Plant Genome J. 2008, 1, 5. [Google Scholar] [CrossRef]
- Zhou, G.; Johnson, P.; Ryan, P.R.; Delhaize, E.; Zhou, M. Quantitative trait loci for salinity tolerance in barley (Hordeum vulgare L.). Mol. Breed. 2012, 29, 427–436. [Google Scholar] [CrossRef]
- Mano, Y.; Takeda, K. Mapping quantitative trait loci for salt tolerance at germination and the seedling stage in barley (Hordeum vulgare L.). Euphytica 1997, 94, 263–272. [Google Scholar] [CrossRef]
- Siahsar, B.A.; Narouei, M. Mapping QTLs of physiological traits associated with salt tolerance in ‘Steptoe’ × ‘Morex’ doubled haploid lines of barley at seedling stage. J. Food Agric. Environ. 2010, 8, 751–759. [Google Scholar]
- Xu, R.; Wang, J.; Li, C.; Johnson, P.; Lu, C.; Zhou, M. A single locus is responsible for salinity tolerance in a Chinese landrace barley (Hordeum vulgare L.). PLoS ONE 2012, 7, e43079. [Google Scholar] [CrossRef] [PubMed]
- Aminfar, Z.; Dadmehr, M.; Korouzhdehi, B.; Siasar, B.; Heidari, M. Determination of chromosomes that control physiological traits associated with salt tolerance in barley at the seedling stage. Afr. J. Biotechnol. 2011, 10, 8794–8799. [Google Scholar]
- Fan, Y.; Zhou, G.; Shabala, S.; Chen, Z.H.; Cai, S.; Li, C.; Zhou, M. Genome-wide association study reveals a new QTL for salinity tolerance in barley (Hordeum vulgare L.). Front. Plant Sci. 2016, 7, 946. [Google Scholar] [CrossRef] [PubMed]
- Hazzouri, K.M.; Khraiwesh, B.; Amiri, K.; Pauli, D.; Blake, T.; Shahid, M.; Nelson, D.; Mansour, A.L.; Salehi-Ashtiani, K.; Purugganan, M.; et al. Mapping of HKT1; 5 gene in barley using GWAS approach and its implication in salt tolerance mechanism. Front. Plant Sci. 2018, 9, 156. [Google Scholar] [CrossRef] [PubMed]
- Mohamed, N.E.M.; Said, A.A.; Mustafa, A.A.; Léon, J. Association Mapping for Salinity Tolerance Related Traits in a Structured Barley Population. Egypt. J. Agron. 2015, 37, 11–33. [Google Scholar]
- Mascher, M.; Gundlach, H.; Himmelbach, A.; Beier, S.; Twardziok, S.-O.; Wicker, T.; Radchuk, V.; Dockter, C.; Hedley, P.E.; Russell, J.; et al. A chromosome conformation capture ordered sequence of the barley genome. Nature 2017, 544, 427–448. [Google Scholar] [CrossRef]
- Kosová, K.; Vítámvás, P.; Prášil, I.T. Wheat and barley dehydrins under cold, drought, and salinity—What can LEA-II proteins tell us about plant stress response? Front. Plant Sci. 2014, 5, 343. [Google Scholar] [CrossRef]
- Passricha, N.; Saifi, S.K.; Kharb, P.; Tuteja, N. Rice lectin receptor-like kinase provides salinity tolerance by ion homeostasis. Biotechnol. Bioeng. 2020, 117, 498–510. [Google Scholar] [CrossRef]
- Mwando, E.; Angessa, T.T.; Han, Y.; Li, C. Salinity tolerance in barley during germination—Homologs and potential genes. J. Zhejiang Univ. Sci. B 2020, 21, 93–121. [Google Scholar] [CrossRef] [PubMed]
- Jia, Y.; Westcott, S.; He, T.; McFawn, L.A.; Angessa, T.; Hill, C.; Tan, C.; Zhang, X.; Zhou, G.; Li, C. Genome-wide association studies reveal QTL hotspots for grain brightness and black point traits in barley. Crop J. 2020. [Google Scholar] [CrossRef]


Publisher’s Note: MDPI stays neutral with regard to jurisdictional claims in published maps and institutional affiliations. |
© 2021 by the authors. Licensee MDPI, Basel, Switzerland. This article is an open access article distributed under the terms and conditions of the Creative Commons Attribution (CC BY) license (http://creativecommons.org/licenses/by/4.0/).