Article

Effects of Soil Types and Irrigation Modes on Rice Root Morphophysiological Traits and Grain Quality

Jiangsu Key Laboratory of Crop Genetics and Physiology/Jiangsu Co-Innovation Center for Modern Production Technology of Grain Crops/Agricultural College, Yangzhou University, 88 Daxue South Road, Yangzhou 225009, China
*
Author to whom correspondence should be addressed.
Agronomy 2021, 11(1), 120; https://doi.org/10.3390/agronomy11010120
Submission received: 9 December 2020 / Revised: 5 January 2021 / Accepted: 8 January 2021 / Published: 10 January 2021

Abstract

:
Soil moisture plays an important role in rice (Oryza sativa L.) root development and grain quality. However, little is known about the effects of soil type on rice root morphophysiological traits (RMTs) and grain quality under different irrigation modes. A soil-grown experiment was conducted during the 2016–2017 rice growing seasons in Yangzhou city with three soil types, namely, clay soil, loamy soil, and sandy soil, and three irrigation regimes, namely, conventional irrigation (CI, 0 kPa), alternate wetting and moderate drying (AWMD, −15 kPa), and alternate wetting and severe drying (AWSD, −25 kPa). The AWMD regime improved the RMT by 3.05–48.95% when compared with the CI and AWSD regimes, and the RMTs in loamy were 7.38–93.67% higher than those in clay and sandy soil under AWMD across 2016 and 2017. The AWMD regime improved the rice milling quality and appearance quality both in clay and loamy soil by 2.88–10.08% and 15.43–45.77%, respectively. The CI regime improved the processing quality and nutritional quality of rice in sandy soil. Both loamy and clay soils improved the rice RMTs and grain quality under an AWMD regime. The RMTs were very significantly correlated with water use efficiency, rice milling, and cooking quality and were negatively correlated with rice appearance quality. The AWMD regime can affect the rice RMT and can improve the rice grain quality in loamy soil. Our results provide a theoretical basis for the design of water-saving rice irrigation regimes and for an improvement in rice grain quality in the process of rice cultivation.

1. Introduction

Rice (Oryza sativa L.) is one of the most important grain crops in the world, and more than three billion people worldwide consume rice as a staple food [1]. As a major rice-planting country, China’s rice production accounts for approximately 19% of the world’s total rice production, and its planting area accounts for 32% of the world’s rice area [2]. It is estimated that, by 2030, with economic development and population growth, China will need to produce 20% more rice to meet domestic consumption demands [3,4,5,6]. At present, the traditional flooding irrigation method is used in most areas of China, which consumes large amounts of water resources and increases losses of nitrogen and phosphorus due to runoff, leaching, and agricultural drainage [7,8]. In the face of increasing water shortages, to meet the needs of the growing population, to increase rice yield, and to save water, some widely used water-saving irrigation regimes such as shallow-wet irrigation (SWI), controlled irrigation (CI), intermittent irrigation (II), and rain-gathering irrigation (RGI) have been applied across China [9,10,11,12]. Alternate wetting and drying (AWD) irrigation has widely been implemented in many parts of China [13,14]. In AWD, irrigation is applied a few days after water has disappeared from the surface so that, during the growing season, soil immersion and non-submerged periods alternate [10,15]. Compared with continuous flooding irrigation, this technique can significantly reduce irrigation water usage and can increase nutrient uptake, root growth, and the grain filling rates of rice [10,15,16,17].
As an integral part of plant organs, roots function to anchor plants, to absorb nutrients and water, to secrete organic acids and amino acids, to synthesize plant hormones, and to sense the soil environment, which play very important roles in crop growth and development [18,19]. The morphophysiological traits of rice root systems are closely related to the growth and development of the aboveground portions of rice. Good root systems can provide sufficient nutrients and water for growth and development of the aboveground parts of rice and can lay the foundation for high yields [20,21,22,23,24,25]. The morphological and physiological characteristics of rice roots are different under different irrigation modes. Soil texture affects the movement and availability of air and water in soil, root growth, water and nutrient uptake, and plant growth. Generally, paddy soil contains large amounts of clay, which is the most important part of mineral soil because it has a high specific surface area and thus has the ability to maintain nutrients and water [26]. The irrigation regime and soil texture may interact with each other to produce a coupling effect on the rice-growing environment. However, under different soil types, the effects of alternate dry–wet irrigation on rice root morphological and physiological characteristics need further study.
Rice grain quality is a comprehensive characteristic and includes milling quality, appearance quality, eating and cooking quality, and nutritional quality. It is well known that the root morphophysiological traits of rice is closely related to the grain quality. Root morphological and physiological characteristics can affect rice grain quality by affecting the aboveground development of rice and the grain filling process [27]. Most studies have focused on the effects of different irrigation methods on RMT, but there have been few studies on the effects of different soil types (e.g., clay, loamy, and sandy soil) on rice RMT and grain quality. However, information about RMT and their relationship with rice grain quality under alternate wetting and drying (AWD) irrigation is not available for clay, loamy, and sandy soil. The objectives of this study are (1) to study the effects of irrigation modes on the morphological and physiological characteristics of rice roots under different soil types; (2) to study the effects of irrigation modes on rice grain quality under different soil types; and (3) to explore the correlations among water use efficiency, root morphophysiological traits, and grain quality. Our results will provide a theoretical basis for the design of water-saving rice irrigation and for an improvement in grain quality under different soil types.

2. Materials and Methods

2.1. Experimental Design

The experiment was conducted in 2016–2017 in the soil culture pond of the Yangzhou University experimental farm (32°24′ N, 119°26′ E), Yangzhou city, Jiangsu Province, China. The elevation of Yangzhou is 12 m. The minimum (Tmin), maximum (Tmax), mean (Tmean) temperature, rainfall, mean relative humidity (RHmean), and sunshine hours (SH) in the rice growing season (from May to November) of 2016 and 2017 are presented in Table 1. The sunshine hours (Figure 1A) and mean temperature (Figure 1B) during the rice growing seasons of 2016 and 2017 are shown in Figure 1. The experiments were laid out in a completely randomized block design with three replicates. In our experiment, we set up three soil types and three irrigation modes. The three soil types used were clay, loamy, and sandy. The soil properties are listed in Table 2. The water contents of the different soil types are shown in Table 3. Treatments consisted of three irrigation regimes, namely, conventional irrigation (CI), alternate wetting and severe soil drying (AWSD), and alternate wetting and moderate soil drying (AWMD), and were applied 6 d after heading to maturity. In the CI regime, plots were maintained with a continuous flood of 2–3 cm of water until one week before harvest as a recommended farming practice. In the AWMD regime, fields were not irrigated until the soil water potential reached −15 kilopascal (kPa). In the AWSD regime, water was withheld until the soil water potential reached −25 kPa. Tensiometers (Institute of Soil Science, Chinese Academy of Sciences, Nanjing, China) consisting of a 10-cm length sensor were installed in each pot to monitor the soil water potential. A rain shelter consisting of a steel frame covered with a plastic sheet was used in each block to minimize the effects of rainfall precipitation on the treatments and was moved off after rains. A separate cement pool was used, and the area of each plot was 4 m2.
One rice cultivar with good taste quality from Jiangsu, Nanjing 9108, was used in this study. Seeds were sown in plastic plates on 29 May in both 2016 and 2017 with a seeding rate of 120 g of dry seeds per plate. Seedlings were manually transplanted in hills on 18 June, and the hill spacing was 12 cm × 30 cm, with four seedlings per hill. The total nitrogen application rate was 300 kg ha-1, and the ratio of basal-tillering fertilizer to panicle fertilizer was 6:4. Calcium superphosphate (P2O5 content: 12%) and potassium chloride (K2O content: 60%) were applied as basal fertilizers at rates of 150 kg P2O5 ha−1 and 240 kg K2O ha−1, respectively. Insect pests, pathogens, and weeds were controlled using common chemical treatments.

2.2. Sampling and Measurement

Irrigation water amounts were monitored with a flow meter (LXSG-50 Flow meter, Shanghai Water Meter Manufacturing Factory, Shanghai, China), which was installed in the irrigation pipelines. Soil samples were taken from a depth of 0–15 cm; the soil samples were then baked in an oven (DHG-9625A, Shanghai Yiheng Scientific Instruments Co., Ltd., Shanghai, China) at 105 °C for 6–8 h to constant weight, and the water content was calculated. For each root sampling, a cube of soil (25 cm in length × 16 cm in width × 20 cm in depth) around each individual hill was removed by using a sampling core. Such cubes contained approximately 95% of total root biomass [22]. At the jointing stage, heading stage, and maturity stage, three hills were sampled for each treatment. To measure root lengths, the roots were arranged and floated on shallow water in a glass tray (30 cm × 30 cm), then were scanned using a scanner (Epson Expression 1680 Scanner, Seiko Epson Corp., Tokyo, Japan), and finally were analyzed using the WinRHIZO Root Analyzer System (Regent Instruments Inc., Quebec, Canada). According to Chu’s methods [17], the root dry weight, root shoot ratio, root bleeding, and root oxidation activity were also measured.
Rice grains were collected, dried, and stored for more than 3 months according to NY/T83 [28]. Grain samples of 120 g with three replications from each plot were collected for grain quality analysis according to GB/T17891 [29]. According to Wei’s methods [30], samples were passed through a de-husker to obtain brown rice, which was polished to obtain milled rice. Milled rice grains with grain lengths equal to or greater than 4/5 of the total length were manually separated to obtain head rice. The brown rice rate, milled rice rate, and head rice rate were expressed as the percentages of their weights to the total rough rice weight (120 g). One hundred milled grains per plot were randomly selected to check the appearance quality. Grains containing a white belly, center, and back or any combination of these were considered chalky kernels. Milled rice was prepared to test the amylose and starch contents and the gel consistency by grinding into flour with a stainless steel grinder and then sifting with a 0.25-mm sieve. The gel consistency and amylose content were measured according to the Rice Quality Measurement Standards. Rice paste properties were determined using a Rapid Visco Analyzer (RVA, Super 3, Newport Scientific, Australia) by following the procedure of Wei et al. [30]. First, 3-g samples of flour were sifted with a 0.15-mm sieve and were mixed with 25 g of deionized water in an RVA sample can. The peak viscosity, hot viscosity, final viscosity in centipoise units (cP), and their derived parameters breakdown (peak viscosity minus hot viscosity) and setback (cool viscosity minus peak viscosity) were recorded with Thermal Cline for Windows (TCW) software.

2.3. Statistical Analysis

Statistical analyses consisted of analyses of variance (ANOVAs). Means were compared by the least significant difference (LSD) test at the 0.05 probability level. All statistical analyses were conducted using SPSS software (18.0; SPSS Inc., Chicago, IL, USA), and graphs were generated using Origin 8.0 (OriginLab, Hampton, MA, USA).

3. Results

Climatic data at the experimental sites during the trial periods are shown in Figure 1 and Table 1. Except the sunshine hours in 2017 that were 33 h more than that in 2016, there were no differences in other weather parameters (Table 1). Statistical analyses showed significant differences in root bleeding and root length among the different irrigation methods and different soil types in 2016 and 2017, but years × soil types, years × irrigation methods, soil types × irrigation methods, and years × soil types × irrigation methods were not significant. There were significant differences in root bleeding and root length between two years. The results showed a significant interaction between years and soil types in root dry weight and root shoot ratio (Table 4, Table 5 and Table 6).

3.1. Effects of Irrigation Methods on Root Dry Weights under Different Soil Types

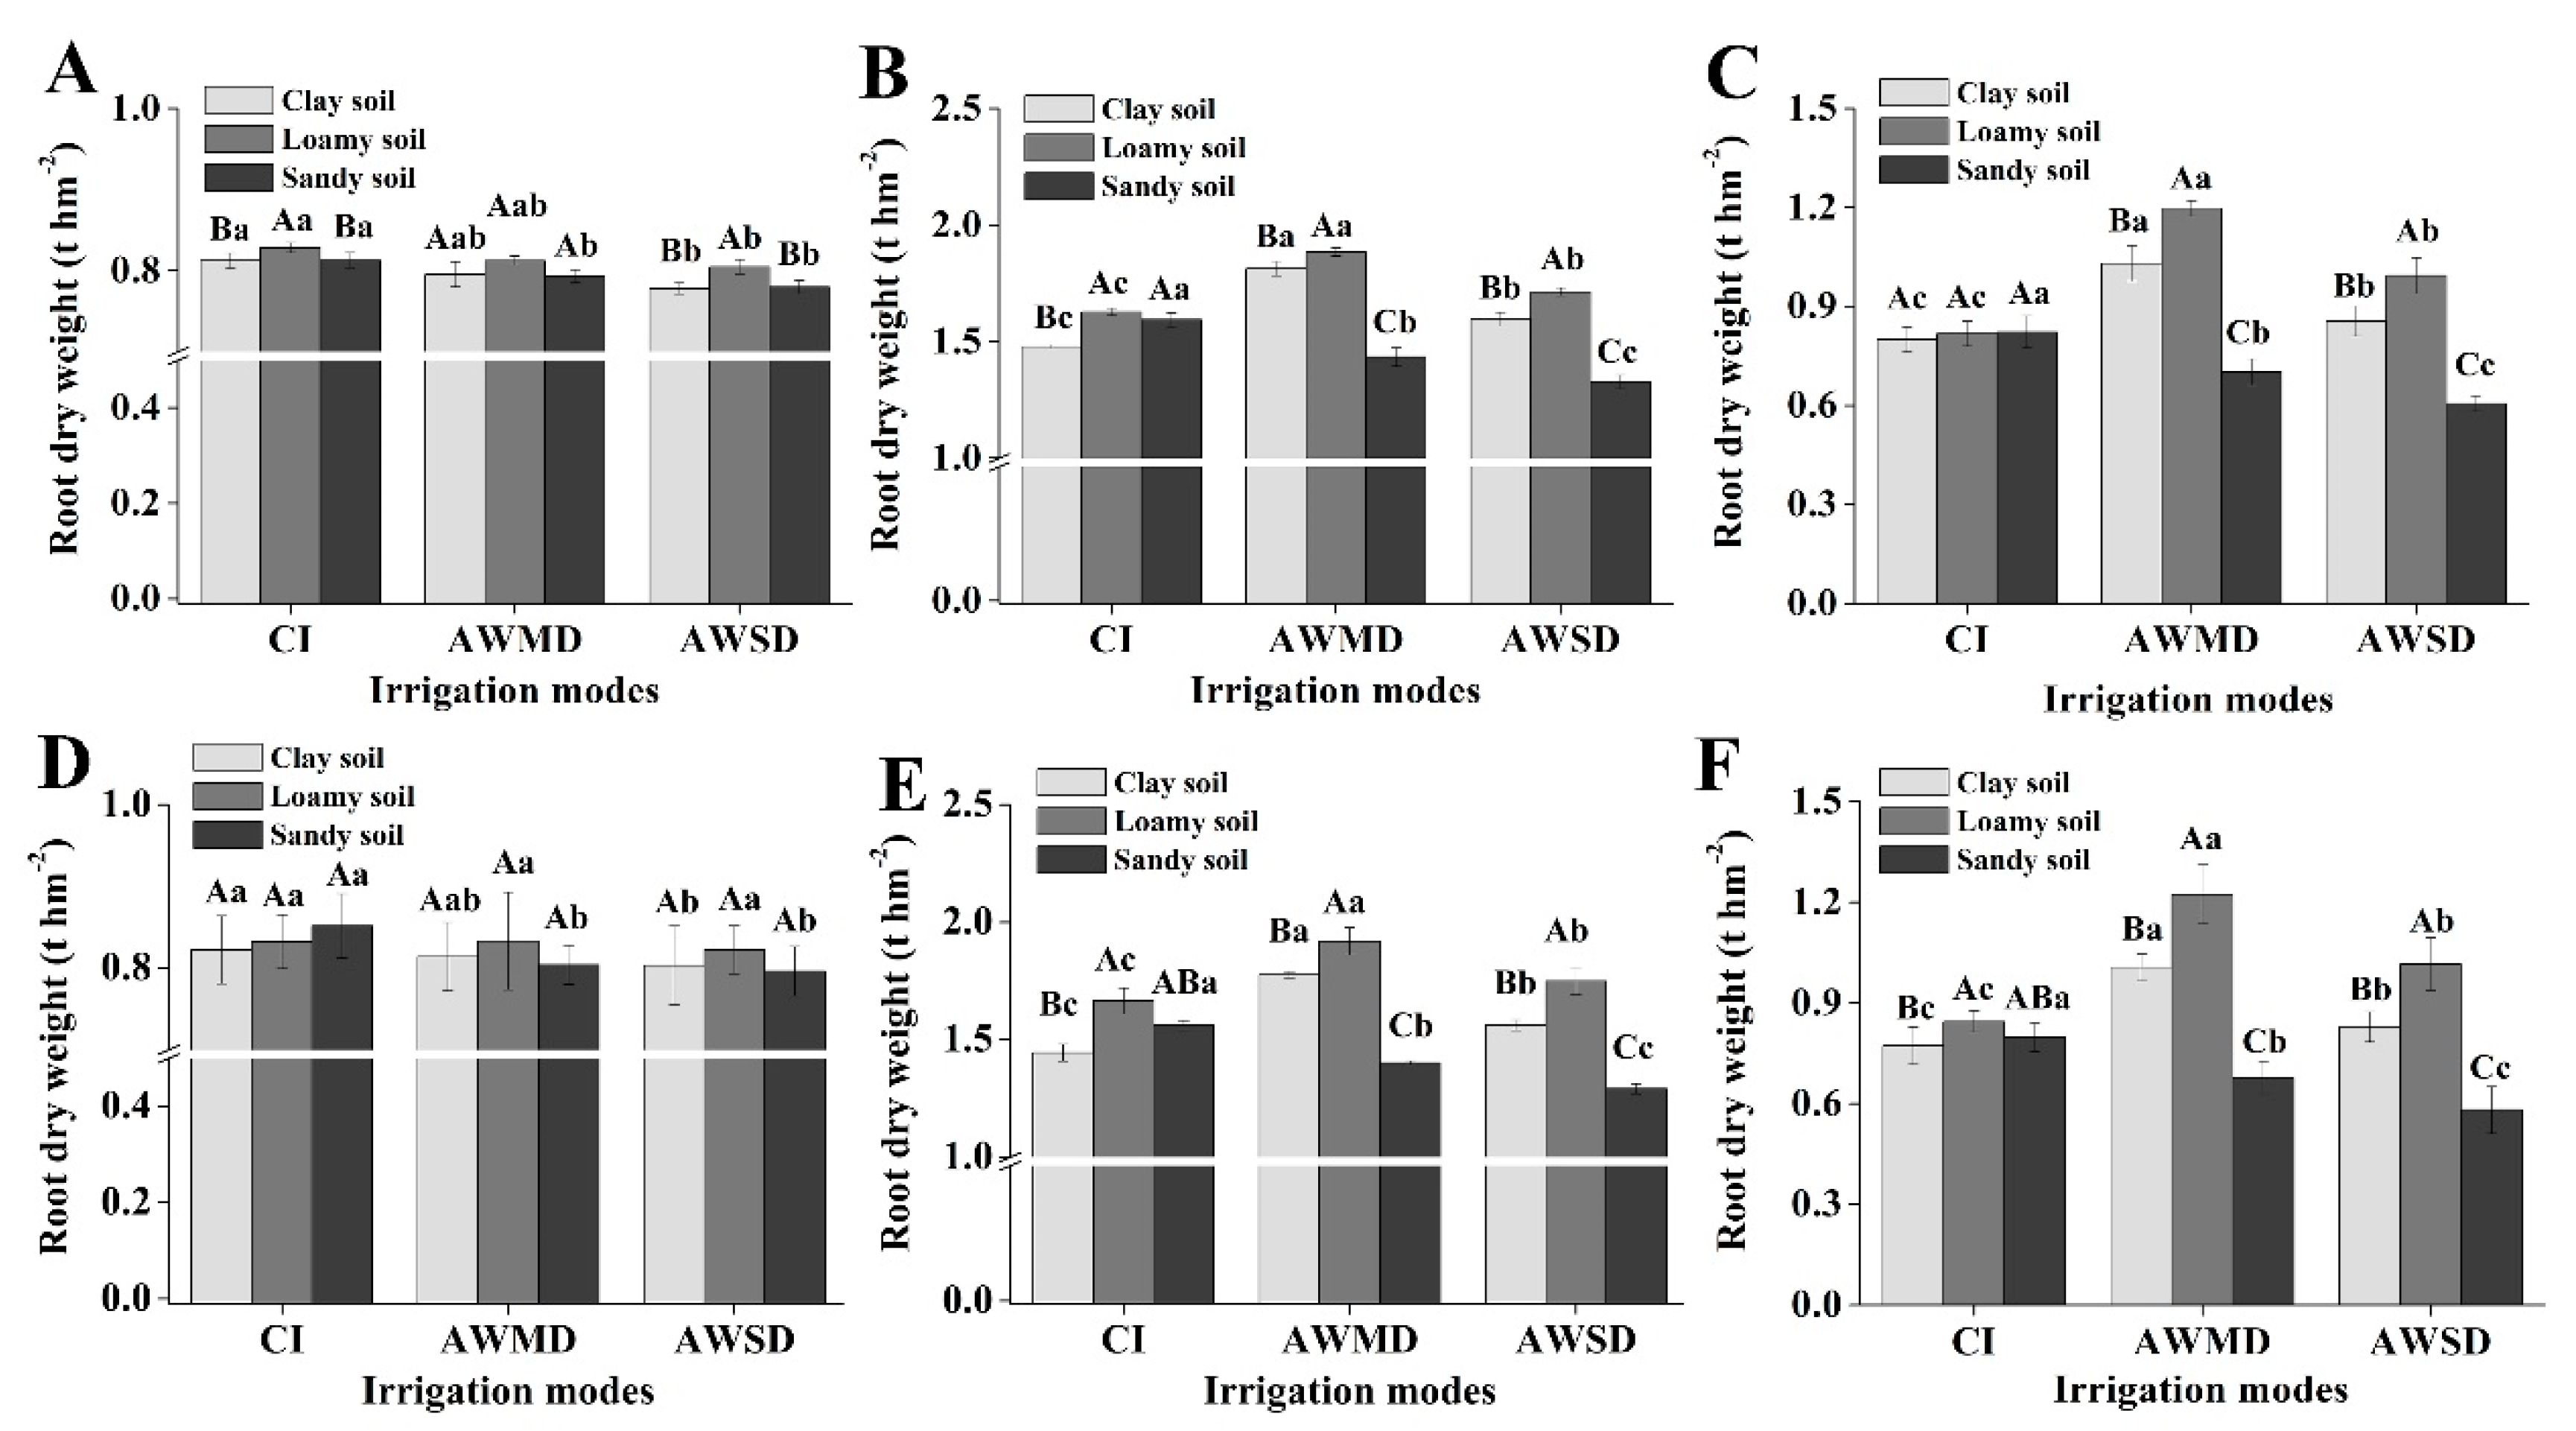
Root dry weights under the conventional irrigation mode (CI) were highest at the jointing stage and were 1.02–5.93% and 1.22–6.95% higher than those under alternate wetting and moderate drying (AWMD), and alternate wetting and severe drying (AWSD), respectively. Compared with those under clay and sandy soils, the root dry weights under loamy soil were highest at the jointing stage (Figure 2A,D). At the heading stage, in addition to those of the sandy soil, the root dry weights in clay and loamy soils under AWMD were the highest, with values 9.68–13.8% and 15.23–23% higher than those under CI and AWSD across 2016 and 2017, respectively (Figure 2B,E). Under sandy soil conditions, the root dry weights under CI were highest, which were 11.12–20.85% higher than under AWMD and AWSD at the heading stage across 2016 and 2017. Under CI, root dry weights in loamy soil were 2.14–15.28% higher than for clay and sandy soils. The root dry weights in loamy soil were 3.88–7.99% and 31.38–36.75% higher than those in clay and sandy soil under AWMD across 2016 and 2017, respectively. Compared to the root dry weights in clay and sandy soil under AWSD, the root dry weights were the highest both in 2016 and 2017 in loamy soil (Figure 1B,E). Similar to the root dry weights at the heading stage, at the maturity stage, except for sandy soil, the root dry weights of roots in loamy soil under AWMD were the highest and were 20.44–20.53% and 46.41–50.06% higher than those under CI and AWSD across 2016 and 2017, respectively (Figure 2C,F). Under sandy soil conditions, the root dry weights of CI were the highest, with values 17.30% and 35.93% higher than those of AWMD and AWSD at the maturity stage, respectively. At the maturity stage, the root dry weights in sandy soil were the highest under CI both in 2016 and 2017. Under AWMD, the root dry weights in loamy soil were 16.27–21.64% and 70.71–81.11 higher than those in clay and sandy soil across 2016 and 2017, respectively (Figure 2C,F).

3.2. Effects of Irrigation Methods on Root Shoot Ratios and Root Oxidation Activity under Different Soil Types

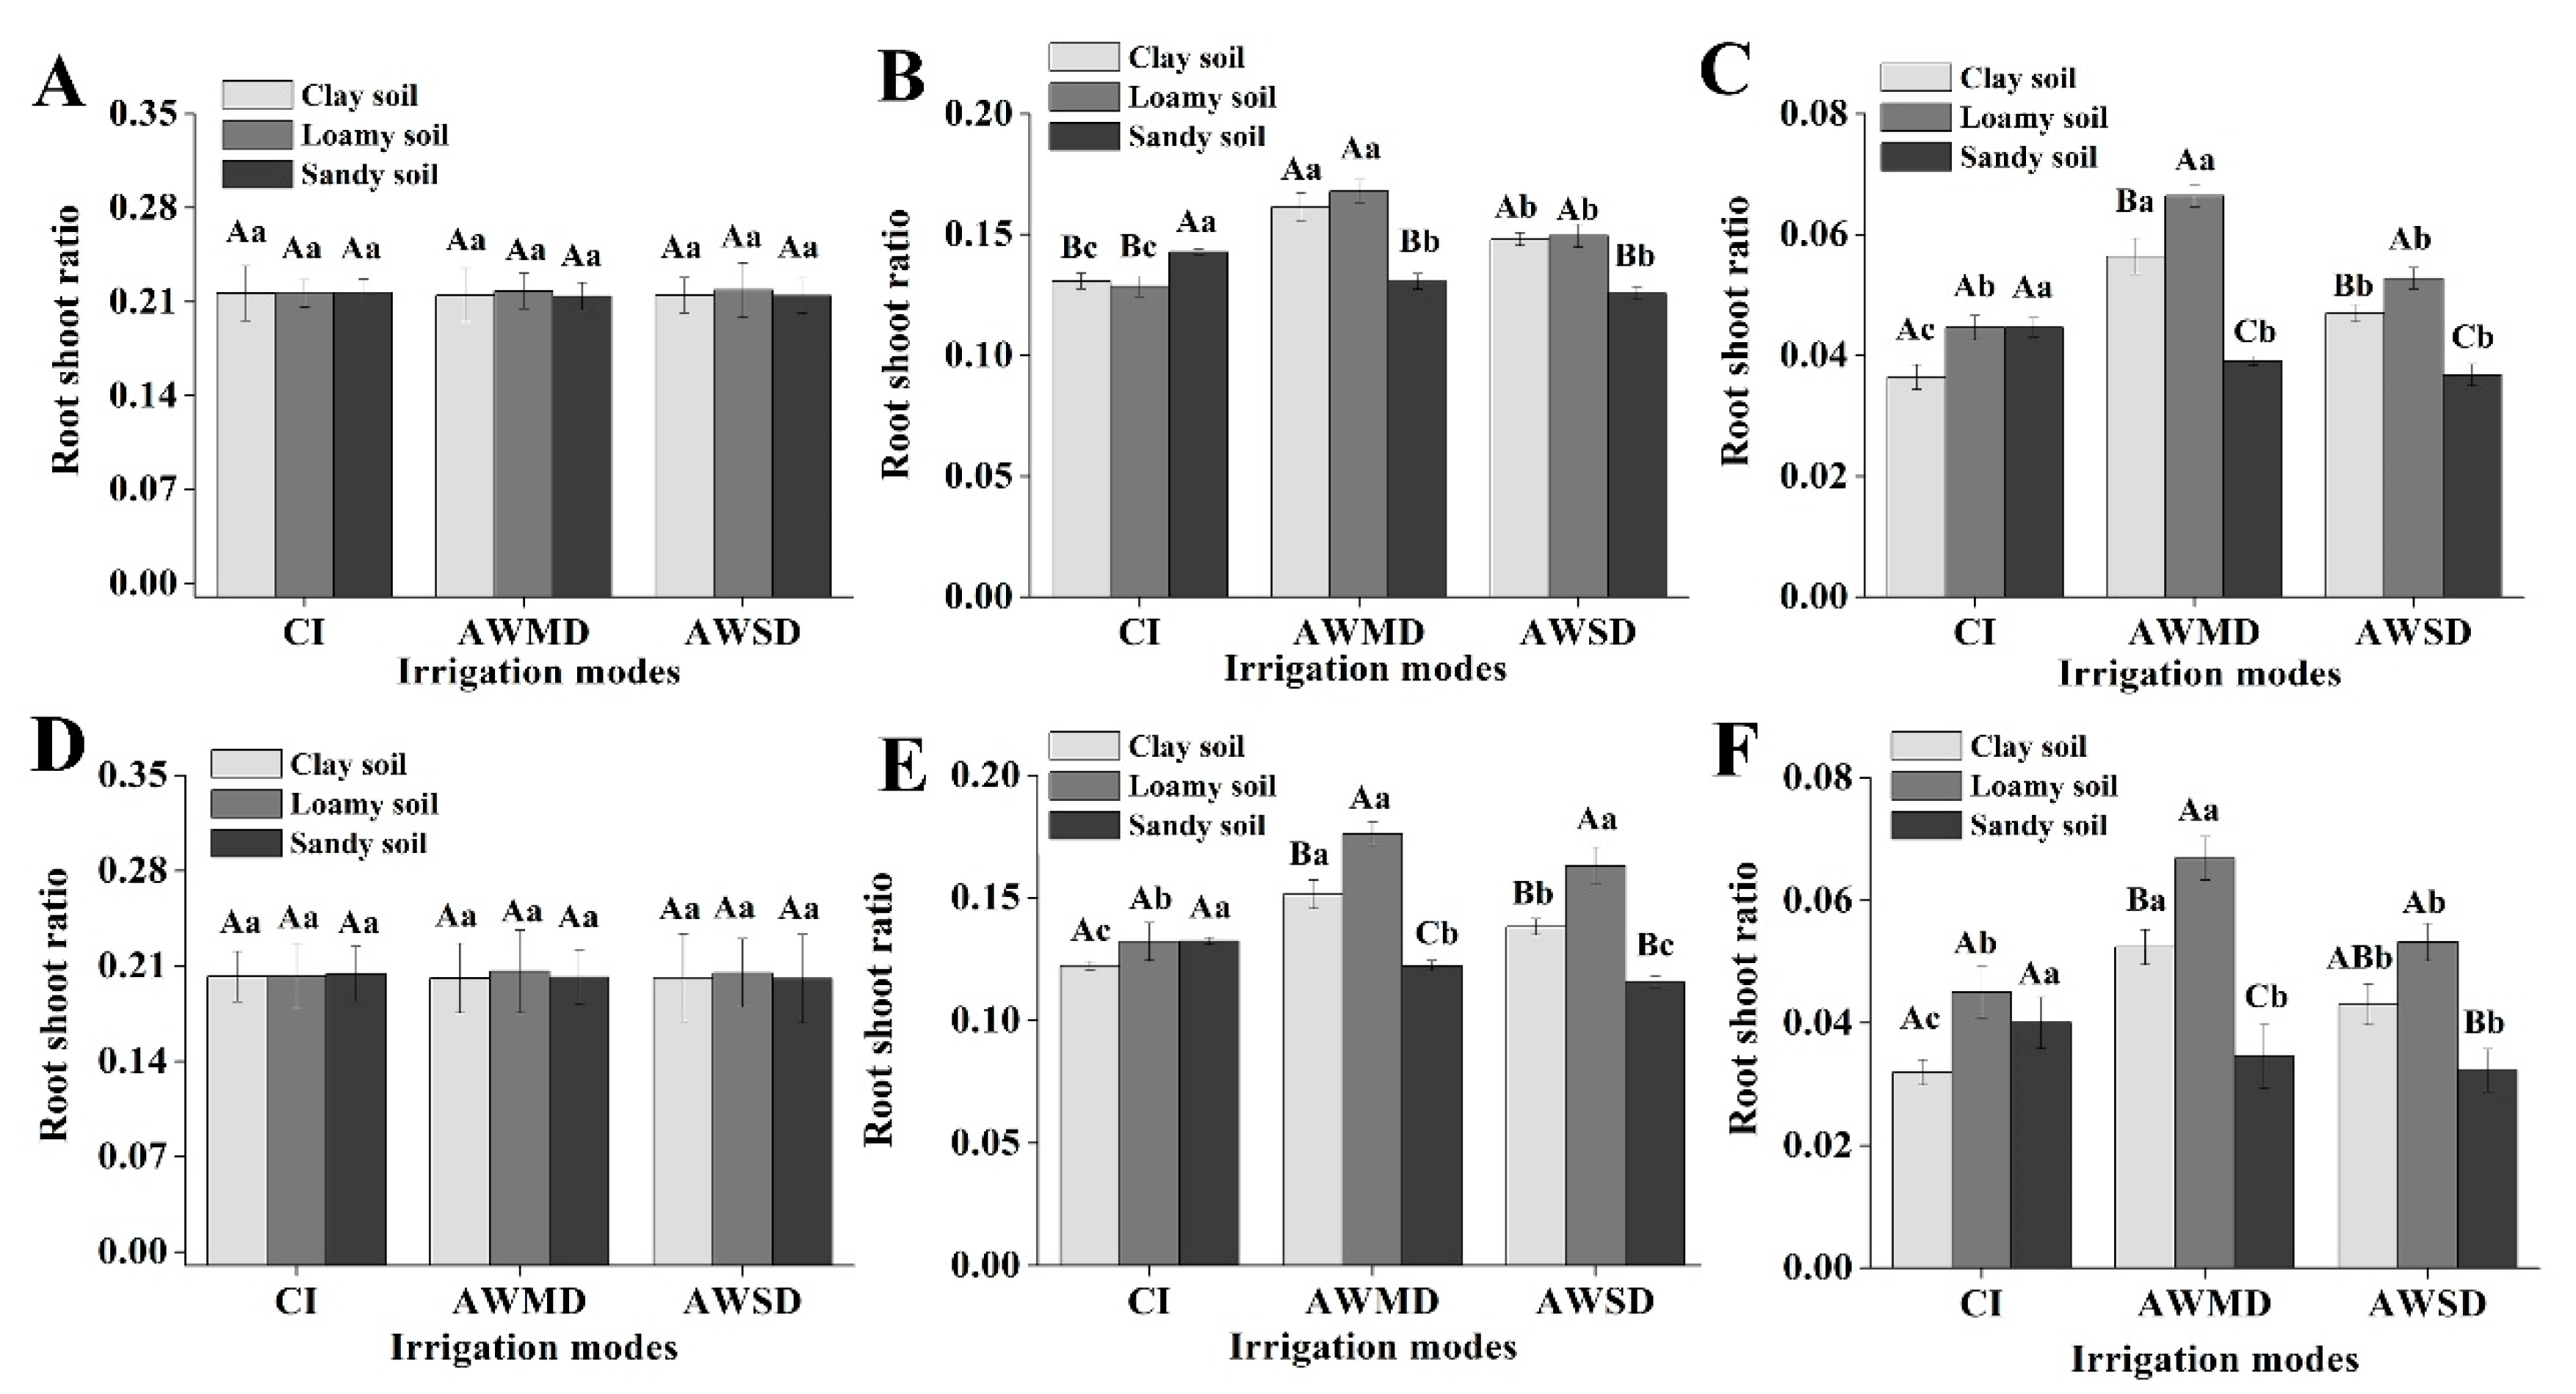
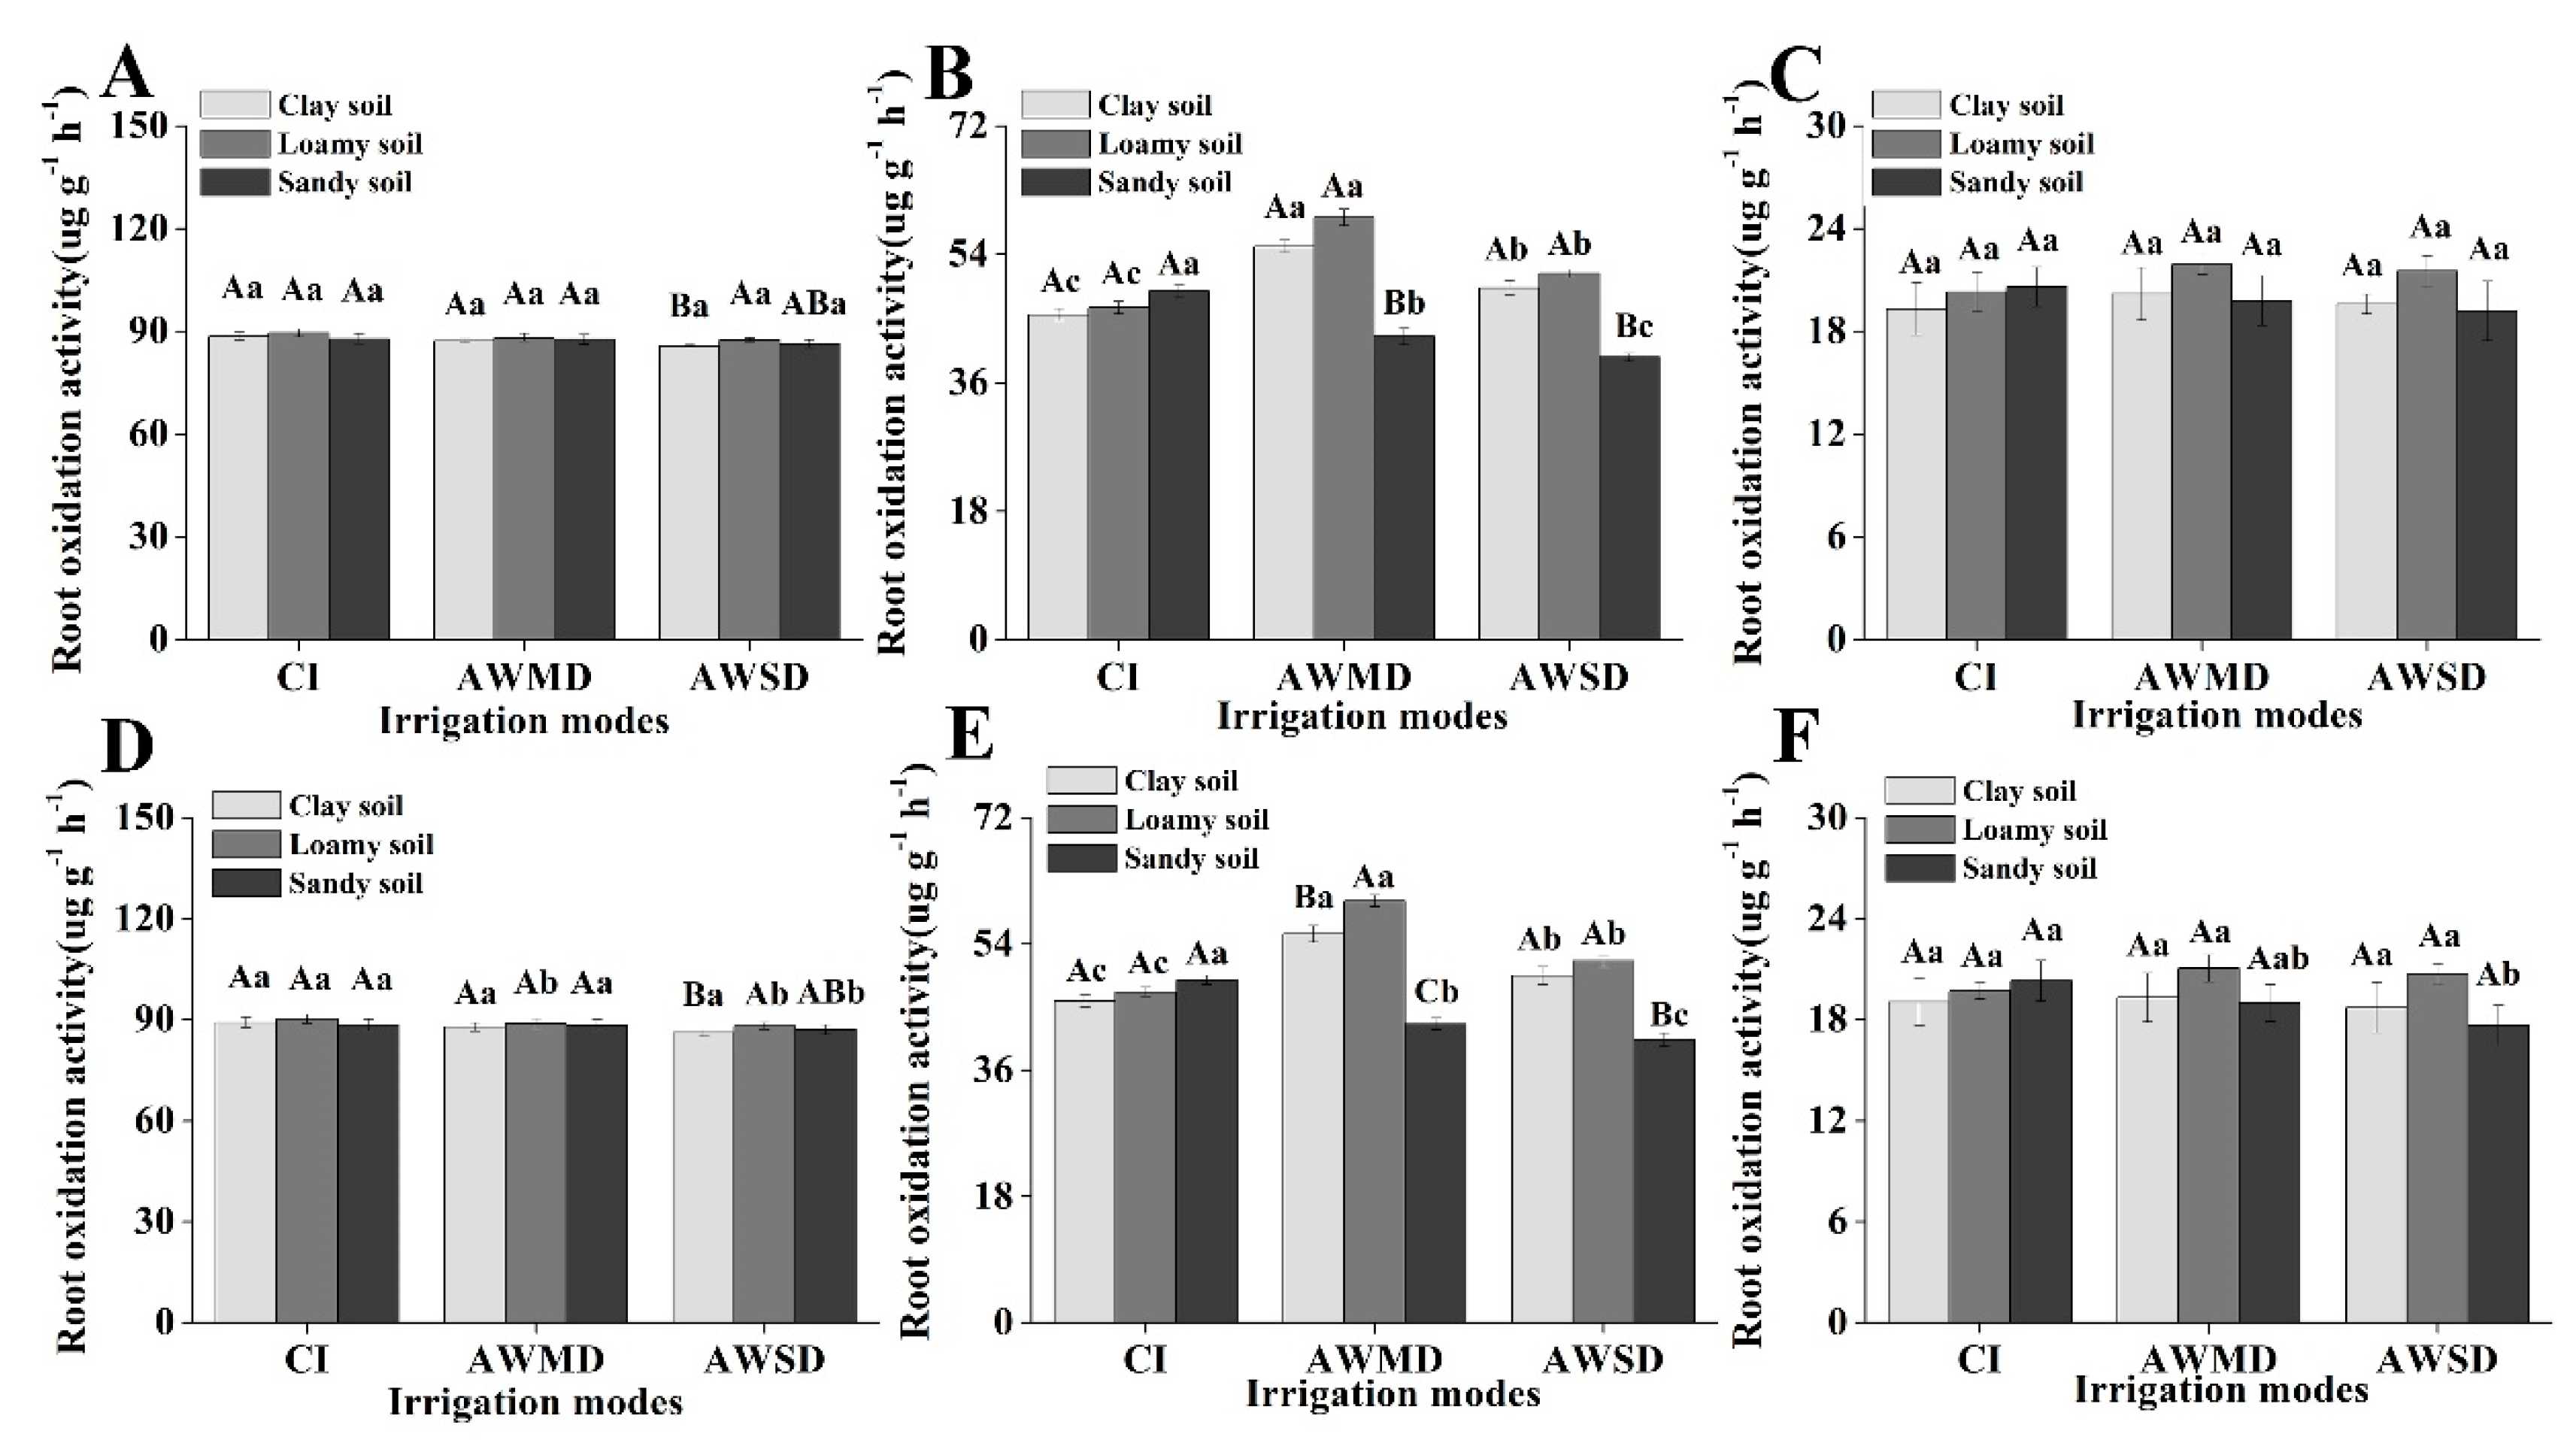
There were no significant differences in the root shoot ratios at the jointing stage among the different soil types under three irrigation methods (Figure 3A,D). The root shoot ratios under AWMD were significantly (8.00–33.33%) higher than those under CI and AWSD in clay and loamy soil conditions at the heading stage across 2016 and 2017. Under CI conditions, the root shoot ratios in 2016 and 2017 were 8.3–14.62% higher than those under AWMD and AWSD in sandy soil. Under CI conditions, root shoot ratios in sandy soil were the highest and were 9.28% and 11.10% higher than those in clay and loamy soil at the heading stage, respectively (Figure 3B,E). At the maturity stage, the root shoot ratios were highest in loamy soil under AWMD conditions, with values 17.79–93.67% higher than those in clay and sandy soil. The root shoot ratios under AWMD were 19.91% and 54.80% higher than those for CI and AWSD in clay soil, respectively. The root shoot ratios under AWMD were 25.9–48.95% higher than those of CI and AWSD in loamy soil across 2016 and 2017. There were no significant differences in the root shoot ratios among the three soil types under CI at the maturity stage. Under AWMD, the root shoot ratios in loamy soil were significantly higher than those in clay and sandy soil by 17.79–69.91%. Under AWSD, the root shoot ratios in loamy soil were 12.19–43.52% higher than those in clay and sandy soil across 2016 and 2017 (Figure 3C,F). There were no significant differences in the root oxidation activity among the three irrigation methods at the jointing and maturity stages (Figure 4A,C,D,F). At the heading stage, the root oxidation activities under AWMD were 11.83–21.08% higher than those under CI and AWSD in clay soil. Under loamy soil conditions, the root oxidation activities under AWMD were 15.40–27.22% higher than those under CI and AWSD in 2016 and 2017 (Figure 4B,E). However, the root oxidation activities under CI were 14.82% and 23.23% higher than those under AWMD and AWSD in sandy soil, respectively. There were no significant differences among the three soil types under CI. Under AWMD, the root oxidation activities in loamy soil were the highest, with values 7.38% and 39.29% higher than those in clay and sandy, respectively. Under AWSD, the root oxidation activities in loamy soil were the highest and were 4.06% and 29.55% higher than those in clay and sandy, respectively (Figure 4B,E).

3.3. Effects of Irrigation Methods on Root Bleeding and Root Lengths under Different Soil Types

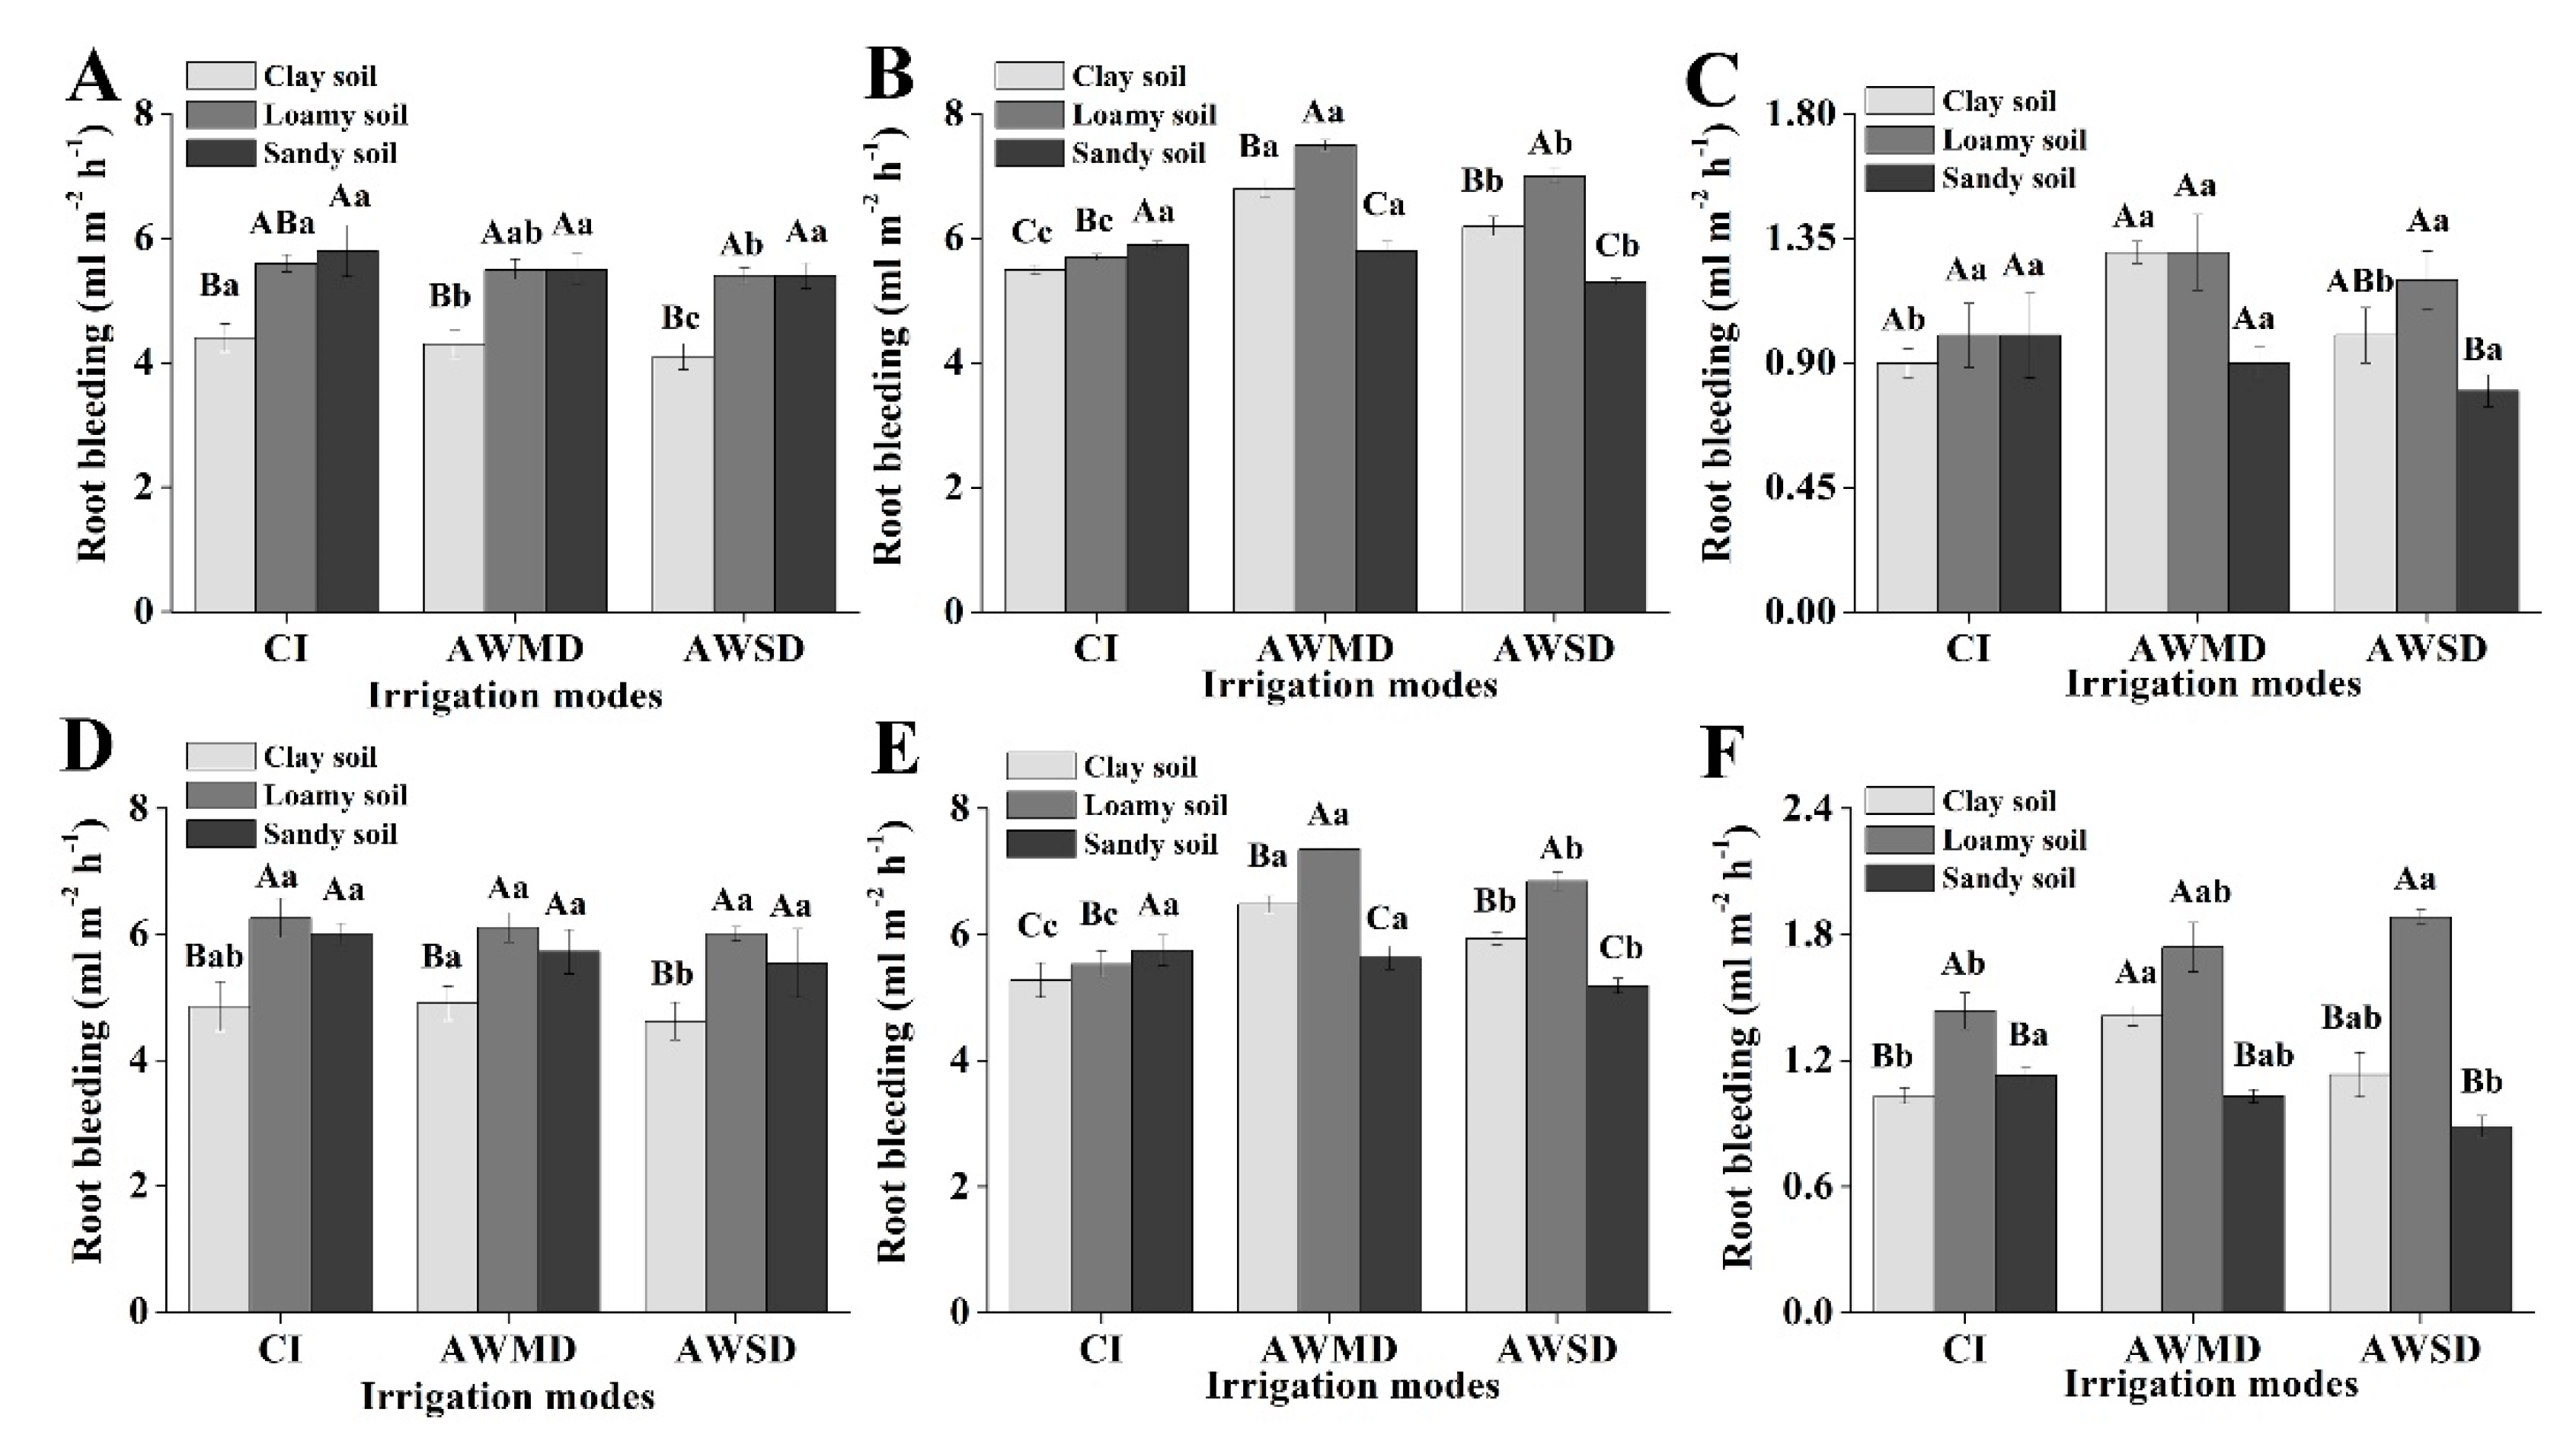
Root bleeding under CI was highest and was 2.33–7.32% higher than that under AWMD and AWSD in clay soil at the jointing stage (Figure 5A,D). Root bleeding under CI was the highest and was 1.82–7.41% higher than that under AWMD and AWSD in clay and sandy soil at the jointing stage (Figure 5A,D). Under CI at the jointing stage, root bleeding under sandy soil was 3.57% and 31.82% higher than that in clay and loamy, respectively (Figure 5A,D). Root bleeding in loamy and sandy soil was significantly higher than that in clay under the AWSD and AWMD modes. Root bleeding under AWMD was significantly higher than that under CI and AWSD at the heading stage in clay soil (Figure 5B,E). Similar patterns were also found for loamy soil and root bleeding under AWMD, with values 31.58% and 7.14% higher than those under CI and AWSD, respectively. However, under CI, root bleeding was 1.72–11.32% higher than that under AWMD and AWSD in sandy soil at the heading stage across 2016 and 2017 (Figure 5B,E). Under CI, root bleeding in sandy soil was 7.27–3.51% higher than that in clay and loamy soil, respectively. Under AWMD, the root bleeding of loamy was 10.29% and 29.31% higher than that in clay and sandy, respectively. Under AWSD, root bleeding in loamy was 12.90–32.08% higher than that in clay and sandy. The root bleeding under AWMD was significantly higher than that under CI and AWSD at the maturity stage in clay, but there were no significant differences among the three irrigation methods for loamy and sandy soil across 2016 and 2017 (Figure 5C,F).
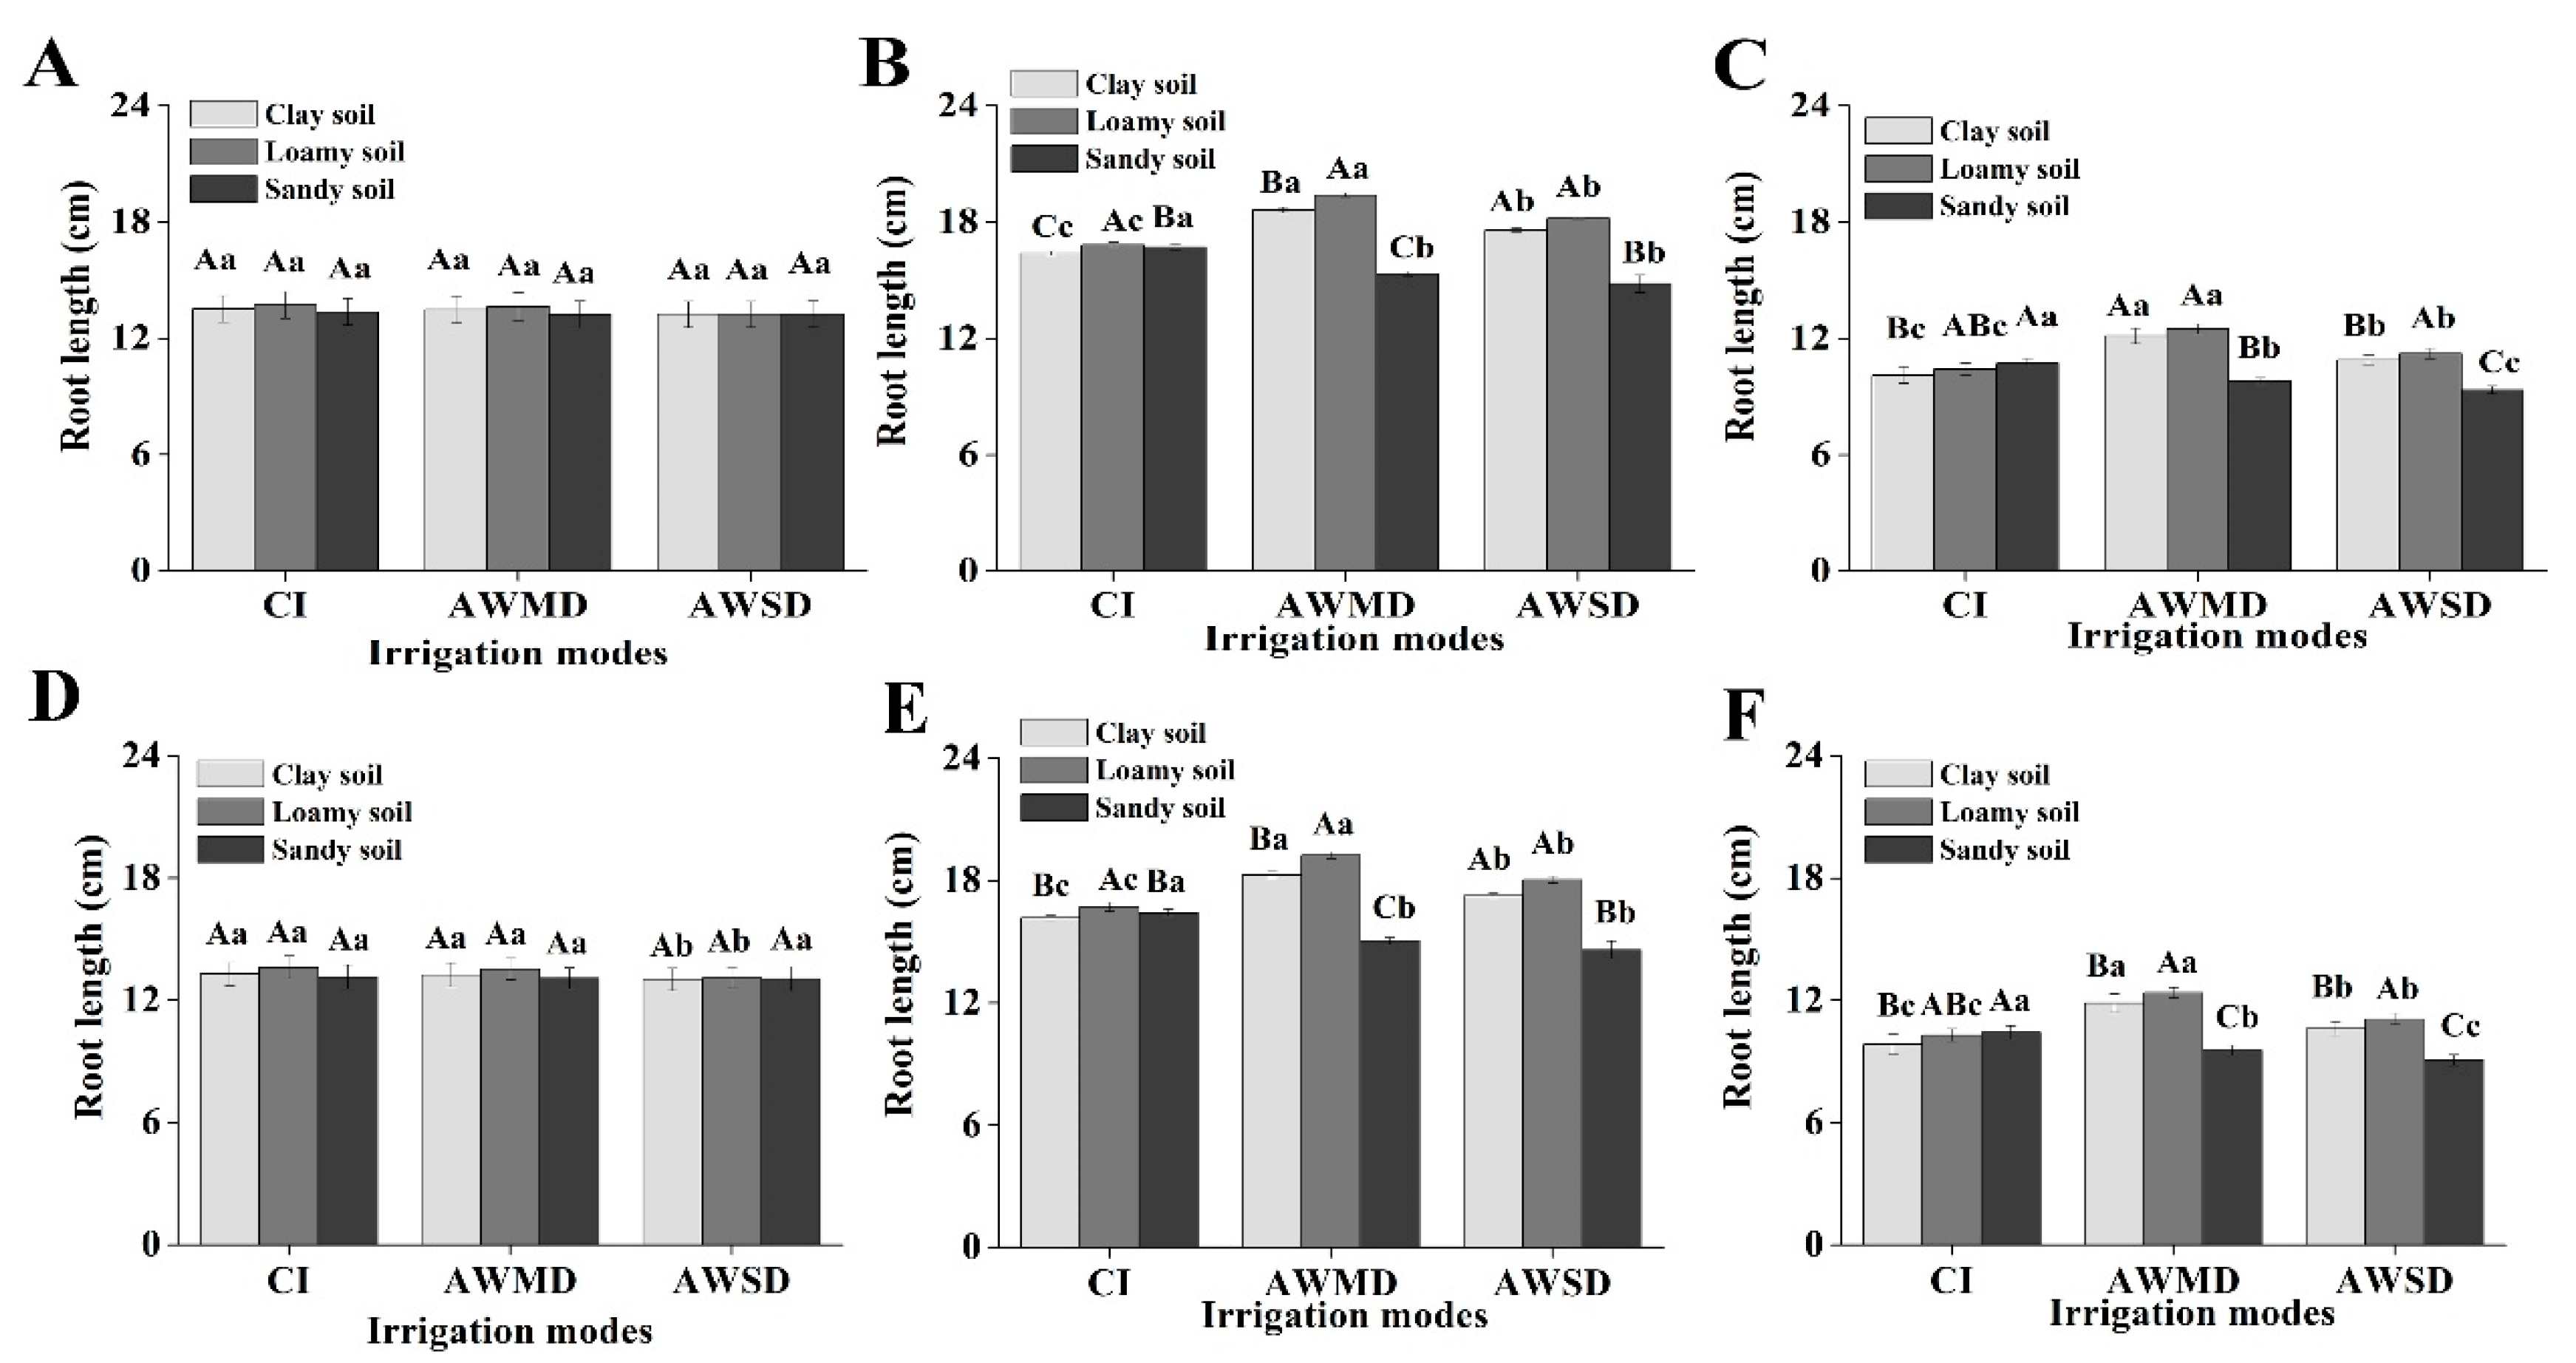
There were no significant differences in root lengths under the different soil types at the jointing stage (Figure 6A,D). The root lengths under AWMD were significantly greater than those under CI and AWSD at the heading stage in clay soil. In loamy soil, the root lengths under AWMD were 15.22–6.54% greater than those under CI and AWSD across 2016 and 2017. The root lengths under CI were significantly greater than those under AWMD and AWSD in sandy soil. Under CI, the root lengths in loamy soil were 2.62–0.72% greater than those in clay and sandy soil. The root lengths in loamy soil were 4.14–26.42% greater higher than those in clay and sandy soil under AWMD. The root lengths in loamy soil were 3.47% and 22.82% greater than those in clay and sandy soil under AWSD at the heading stage, respectively (Figure 6B,E). The root lengths under AWMD were significantly greater than those under CI and AWSD in clay soil at the maturity stage (Figure 6C,F). The root lengths under AWMD were 19.98–11.32% greater than those under CI and AWSD in loamy soil in 2016 and 2017. However, the root length under CI was significantly greater than that under AWMD and AWSD in sandy soil. Under CI, the root length in clay soil was significantly shorter than that in loamy and sandy soil. The root length under AWMD was 3.05–27.45% greater than that under CI and AWSD in loamy soil. Compared with clay and sandy soil, the root length under AWSD was 3.03–20.13% greater than that under AWSD in loamy soil (Figure 6C, 65).

3.4. Effects of Irrigation Methods on Milling and Appearance Quality of Rice under Different Soil Types

Statistical analyses showed no significant differences in milling and appearance quality of rice between 2016 and 2017, and years × soil types, years × irrigation methods, soil types × irrigation methods, and years × soil types × irrigation methods were not significant. There were significant differences in milling and appearance quality of rice among soil types and irrigation methods. The results showed a significant interaction between soil types and irrigation methods in rice milling and appearance quality (Table 7).
The rates of brown rice, milled rice, and head rice under AWMD were significantly higher than those under CI and AWSD in clay soil. The rates of brown rice, milled rice, and head rice under AWMD were significantly higher than those under CI and AWSD in loamy soil. Under AWMD, the rates of brown rice, milled rice, and head rice were 2.88–7.52%, 1.87–10.27%, and 5.08–10.08% higher than those under CI and AWSD in clay and loamy soil in 2016, respectively. It is worth mentioning that the related indexes of rice milling quality in loamy soil were significantly higher than those in clay and sandy soil (Table 7). The chalky kernel rate, chalky area, and chalkiness under AWMD were 27.98%, 27.12%, and 47.89% lower than those under conventional irrigation and were 16.45%, 18.89%, and 31.87% lower than those under AWSD in clay soil in 2016, respectively,. The chalky kernel rate, chalky area, and chalkiness under AWMD were 26.41%, 26.41%, and 45.77% lower, than those under CI and were 19.04%, 15.43%, and 31.40% lower than those under AWSD in loamy soil, respectively. The chalky kernel rate, chalky area, and chalkiness under CI were significantly higher than those under AWMD and AWSD in sandy soil. Under CI in 2016, the chalky kernel rate and chalky area of rice in sandy soil were 16.7–21.8% and 16.21–27.36% lower than those under AWMD and AWSD, respectively. Under AWMD, the chalky kernel rate, chalky area, and chalkiness in loamy were 4.08–21.89%, 5.91–31.86%, and 9.79–46.69% lower than those for clay and sandy soil, respectively. Under AWSD, the chalky kernel rate, chalky area, and chalkiness in loamy were 0.55–11.18%, 9.76–32.35%, and 10.41–39.98% lower than those in clay and sandy soil, respectively (Table 7).

3.5. Effects of Irrigation Methods on Rice-Eating Quality and Starch Viscosity Characteristics under Different Soil Types

Statistical analyses showed no significant differences in rice-eating quality and starch viscosity characteristics between 2016 and 2017, and years × soil types, years × irrigation methods, soil types × irrigation methods, and years × soil types × irrigation methods were not significant. There were significant differences in rice-eating quality and starch viscosity characteristics among soil types and irrigation methods. The results showed a significant interaction between soil types and irrigation methods in rice-eating quality and starch viscosity characteristics (Table 8 and Table 9). Regardless of soil type, the three irrigation methods had no significant effects on gel consistency, protein content, and amylose content of rice (Table 8). The peak viscosity under AWMD was significantly higher than those under CI and AWSD in clay and loamy soil in 2016 (Table 9). However, the peak viscosities of rice flour under CI were 0.91% and 7.32% higher than those under ADMD and AWSD in sandy soil, respectively. The hot viscosity, final viscosity, and setback under CI were significantly higher than those under AWMD and AWSD in clay and loamy soil. The hot viscosity and final viscosity under AWSD were significantly higher than those under AWMD and CI in sandy soil (Table 9). The breakdown under AWMD was significantly higher than that under CI and AWSD by 44.21–86.64% in clay and loamy soil. The breakdown under CI was significantly higher than that under AWMD and AWSD by 18.81–81.14% in sandy soil in 2016. Regardless of the irrigation mode, the peak viscosity under loamy was significantly higher than that under clay and sandy soil (Table 9). Under CI, the hot viscosity and final viscosity in loamy soil were 4.12–23.91% and 0.95–9.09% higher than those in clay and sandy soil, respectively. The hot viscosity and final viscosity in sandy soil were 6.20–6.69% and 6.90–9.65% higher than those in clay and sandy soil under AWMD, respectively. The hot viscosity, breakdown, and setback in loamy soil were significantly higher than those in clay and sandy soil under AWSD. The final viscosity in sandy soil was 6.66–5.41% higher than that in clay and loamy soil under AWSD (Table 9).

3.6. Correlation Analysis

There were no significant correlations among root morphological and physiological indexes, soil water content, and irrigation water use at the jointing, heading, and maturity stages (Table 10). Root dry weight, root shoot ratio, root oxidation activity, root bleeding, and root length were very significantly correlated with water use efficiency (data are from Chen et al. [31]). The rate of brown rice, rate of milled rice, rate of head rice, chalky kernel rate, chalky area, chalkiness, gel consistency, protein content, amylose content, peak viscosity, hot viscosity, final viscosity, breakdown, and setback showed no significant correlations with soil water content or with irrigation water use. The rate of brown rice, rate of milled rice, rate of head rice, gel consistency, and peak viscosity were significantly or extremely significantly positively correlated with water use efficiency. Chalky kernel rate, chalky area, chalkiness, and setback were significantly negatively correlated with water use efficiency (Table 11). Root morphological and physiological indexes showed no significant correlations with those indexes related to rice grain quality and starch viscosity characteristics. Root dry weight, root shoot ratio, root oxidation activity, root bleeding, and root length were very significantly correlated with the rate of brown rice, rate of milled rice, rate of head rice, gel consistency, amylose content, peak viscosity, hot viscosity, and breakdown and were negatively correlated with the chalky kernel rate, chalky area, chalkiness, final viscosity, and setback at the heading and maturity stages (Table 11).

4. Discussion

4.1. Effects of Irrigation Methods on Root Morphological and Physiological Characteristics under Different Soil Types

Roots are supporting organs for water and nutrient absorption, material exchange, and metabolism between the upper and lower parts of rice [32,33,34]. We found that the root dry weight, root shoot ratio, root oxidation activity, root bleeding, and root length under AWMD were higher than under CI and AWSD (Figure 2, Figure 3, Figure 4, Figure 5 and Figure 6). Combined with our previous results, the higher physiological morphological indexes of roots contributed to higher yields and dry matter accumulations [31], which are consistent with the results of Chu et al. [17]. In the CI regime, continuous irrigation can lead to accumulation of toxic reducing substances such as Fe2+ and H2S in soil and can inhibit root growth and development [17,35]. In contrast, AWMD can effectively improve the redox ability of soil and can remove toxic reducing products in the soil, which contributes to root growth [10,36,37]. Luo [38] observed that cultivars with improved root penetration ability can capture the maximum amount of soil moisture and therefore preserve a favorable water status under water stress.
The number and quality of roots under flooding irrigation in loamy soil were lower than under water-saving irrigation, and the senescence rate was faster than under water-saving irrigation [39]. Previous studies have shown that, when fields were kept moist without a water layer, the diurnal temperature differences between the surface and soil layers increased, daily average temperatures increased, and daily maximum temperatures rose due to the decreased soil heat capacity [7]. Zhang et al. [23] found that the AWMD regime can reduce soil moisture, can significantly increase root dry weight, and can increase root lengths at the tillering stage. Our results showed that the AWMD regime significantly increased root dry weights, root shoot ratios, and root lengths under loamy and clay soil conditions when compared with CI (Figure 2, Figure 3, Figure 4, Figure 5 and Figure 6). The water-saving irrigation regime can delay root senescence, can improve root absorption capacity, can promote production of new roots and tillers, and can contribute to rice growth by improving root morphology under loamy and clay. We also found that the root morphological and physiological indexes under AWMD were significantly lower than under CI in sandy soil (Figure 2, Figure 3, Figure 4, Figure 5 and Figure 6). Our previous studies found that AWMD could increase yields [31], and our present results showed that the root oxidation activity was higher under AWMD in clay and loamy soil (Figure 3). Root oxidation activity directly affects water and nutrient uptake and utilization, and shoot growth and yield formation in rice [40]. We found that, when compared with AWMD, root dry weights, root shoot ratios, root oxidation activities, root bleeding, and root lengths decreased significantly under AWSD (Figure 2, Figure 3, Figure 4, Figure 5 and Figure 6). These results indicated that the cell morphologies in root were damaged, which affected the maintenance of root function [21].
Qin et al. [41] showed that AWMD could promote root lengths and could improve root oxidation activities and soil aeration conditions at the tillering and heading stages. A higher root activity can promote nutrient absorption by roots and is beneficial for plant growth [42,43]. The results of this study are consistent with those of previous studies; that is, root oxidation activity and root bleeding can be improved under AWMD. However, root oxidation activity and root bleeding in sandy soil were higher under CI (Figure 4 and Figure 5). The results showed that light water-saving irrigation could promote root growth in loamy and clay soil. Strong roots can provide sufficient nutrition, water, and hormones for the shoots and can then promote growth of the aboveground parts [20,33].

4.2. Effects of Irrigation Methods on Rice Grain Quality and Starch Viscosity Characteristics under Different Soil Types

We found that AWMD significantly increased the rate of brown rice, rate of milled rice, and rate of head rice; reduced the chalky kernel rate, chalky area, and chalkiness; and improved the rice milling and appearance quality in both clay and loamy soil (Table 7). These results are consistent with those of previous studies [44,45,46]. Rice quality not only is controlled by the genetic characteristics of rice varieties but also is affected by climate, light, and other environmental conditions and cultivation factors, among which water is one of the most important environmental factors. In loamy soil, AWMD not only can save water and improve water use efficiency but also can significantly improve milling quality and appearance quality of rice (Table 7). Under the AWMD regime, rice transparency was improved and chalky kernel rate, chalky area, and chalkiness were decreased; under an AWSD regime, rice transparency was significantly reduced and the appearance quality was significantly higher than for CI and AWMD (Table 7). The reason may be that the AWMD regime can promote material transfer rates and rice grain filling and can ultimately improve rice milling and appearance quality.
The AWMD regime can reduce protein and amylose contents of rice and can improve the rice-eating quality [47]. The protein content, maximum viscosity, and disintegration value of rice increased significantly, and 1000-grain weights decreased under the alternating wetting and drying regime [44]. We found that there were no significant differences in gel consistency, protein content, and amylose content among the three soils under different water-saving irrigation regimes (Table 8). Under AWMD and AWSD, breakdown increased in loamy and clay soil while setback decreased (Table 9). Moreover, breakdown was highest under CI in sandy soil while setback was lowest (Table 9). Overall, our results showed that AWMD improved the eating quality of rice in loamy and clay soil (Table 9). A correlation analysis showed that root morphological and physiological characteristics at the heading and maturity stages were significantly positively correlated with rice milling quality and were significantly negatively correlated with rice appearance quality (Table 11). The root morphological and physiological characteristics at the heading and maturity stages were significantly or extremely significantly positively correlated with gel consistency, amylose content, peak viscosity, hot viscosity, and breakdown and were negatively correlated with final viscosity and setback (Table 11). Root morphophysiological traits such as root activity and root exudates affect rice quality by influencing grain filling characteristics. It was reported that there were significant positive correlations between endosperm division rates, endosperm cell numbers in rice, and cytokinin contents in rice roots. The division and growth of rice endosperm cells affected the appearance quality and eating quality of rice [20,48]. The hormone contents of roots and root exudates are closely related to rice quality [49]. The zeatin + zeatin riboside concentrations in roots were positively correlated with gel consistency and alkalization values but were negatively correlated with amylose content. An increase in the abscisic acid concentrations in roots would decrease the gel consistency and alkalization value and increase the amylose content [49,50]. The tartaric acid, citric acid, and amino acids in root exudates showed significant or extremely significant negative correlations with rice appearance quality, while the malic acid and oxalic acid contents showed opposite relationships [51]. In addition to water, soil is a very important factor for rice growth. Soil texture affects plant growth and nutrient uptake because it alters the availability of water in the soil [52]. The contents of exchangeable Ca, Mg, Cu, and Mo in soil are significantly related to the protein content of rice [53]. A correlation analysis indicated a close relationship between mineral elements and starch quality [54]. It was reported that the key for improving rice grain quality is increasing mineral element contents in the soil such as available sulfur content and exchangeable calcium and magnesium contents [55]. Soil physical and chemical properties such as soil porosity, soil respiration, soil nutrients, and enzyme activities of soil directly or indirectly affect the growth of roots and shoots and ultimately affect rice grain quality [56]. The mechanism underlying the effects of soil physical and chemical properties on rice root growth and rice grain quality need further studies under the water-saving irrigation regimes.

5. Conclusions

The effects of irrigation regimes on rice root morphophysiological traits and grain quality were diverse and depended on soil type in 2016 and 2017. For the same soil type, the alternate wetting and moderate drying regime improved root morphophysiological traits and rice grain quality both in 2016 and 2017. Under the same irrigation regime, the indexes related to root morphophysiological traits in loamy soil were higher than those in clay and sandy soil. The alternate wetting and moderate drying regime improved rice starch viscosity characteristics in clay and loamy soil to the same extent. A correlation analysis confirmed the close relationship among root morphophysiological traits, rice grain quality, and water use efficiency. These results suggest that the alternate wetting and moderate drying regime can affect the rice morphophysiological traits and can improve the rice grain quality in loamy soil.

Author Contributions

Conceptualization, Z.H.; methodology, C.Z.; software, C.Z. and M.C.; validation, M.C., X.L., and Y.H.; formal analysis, C.Z. and Z.H.; investigation, M.C. and X.L.; resources, Y.H., B.G., and W.W.; data curation, C.Z. and M.C.; writing—original draft preparation, C.Z.; writing—review and editing, Z.H., K.X., and Q.D.; visualization, B.G.; supervision, Z.H. and Q.D.; project administration, K.X. and Q.D.; funding acquisition, Z.H. All authors have read and agreed to the published version of the manuscript.

Funding

This research was financially supported by the National Key Research and Development Program (2018YFD0300802) and by the Key Research Program of Jiangsu Province, China (BE2018362 and BE2019377).

Institutional Review Board Statement

Not applicable.

Informed Consent Statement

Not applicable.

Data Availability Statement

Data is contained within the article.

Acknowledgments

The authors thank Guangming Liu and Lingtian Zhao for their assistance with the experiments.

Conflicts of Interest

The authors do not have any conflict of interest to declare.

Abbreviations

ANOVAanalysis of variance
AWDalternate wetting and drying
AWSDalternate wetting and severe drying
AWMDalternate wetting and moderate drying
CIconventional irrigation
LSDleast significant difference
RGIrain-gathering irrigation
RMTroot morphophysiological traits
RVArapid visco analyzer
SPSSstatistic package for social science
SWIshallow-wet irrigation

References

  1. Fageria, N.K. Yield Physiology of Rice. J. Plant Nutr. 2007, 30, 843–879. [Google Scholar] [CrossRef]
  2. FAOSTAT, FAO Statistical Databases. Food and Agriculture Organization (FAO) of the United Nations, Rome. Available online: http://www.fao.org (accessed on 12 May 2019).
  3. Cai, H.; Chen, Q. Rice research in China in the early 21st century. Chin. Rice Res. Newsl. 2000, 8, 14–16. [Google Scholar]
  4. Li, Y. Water saving irrigation in China. Irrig. Drain. 2006, 55, 327–336. [Google Scholar] [CrossRef]
  5. Li, Y.; Shao, X.; Sheng, Z.; Guan, W.; Xiao, M. Water Conservation and Nitrogen Loading Reduction Effects with Controlled and Mid-Gathering Irrigation in a Paddy Field. Pol. J. Environ. Stud. 2016, 25, 1085–1091. [Google Scholar] [CrossRef]
  6. Wang, M.; Yu, S.; Shao, G.; Gao, S.; Wang, J.; Zhang, Y. Impact of Alternate Drought and Flooding Stress on Water Use, and Nitrogen and Phosphorus Losses in a Paddy Field. Pol. J. Environ. Stud. 2018, 27, 345–355. [Google Scholar] [CrossRef]
  7. Peng, S.; He, Y.; Yang, S.; Xu, J. Effect of controlled irrigation and drainage on nitrogen leaching losses from paddy fields. Paddy Water Environ. 2014, 13, 303–312. [Google Scholar] [CrossRef]
  8. Yang, R.; Tong, J.; Hu, B.X.; Li, J.; Wei, W. Simulating water and nitrogen loss from an irrigated paddy field under continuously flooded condition with Hydrus-1D model. Environ. Sci. Pollut. Res. 2017, 24, 15089–15106. [Google Scholar] [CrossRef]
  9. Yan, J.; Yu, J.; Tao, G.C.; Vos, J.; Bouman, B.; Xie, G.H.; Meinke, H. Yield formation and tillering dynamics of direct-seeded rice in flooded and nonflooded soils in the Huai River Basin of China. Field Crops Res. 2010, 116, 252–259. [Google Scholar] [CrossRef]
  10. Yao, F.; Huang, J.; Cui, K.; Nie, L.; Xiang, J.; Liu, X.; Wu, W.; Chen, M.; Peng, S. Agronomic performance of high-yielding rice variety grown under alternate wetting and drying irrigation. Field Crops Res. 2012, 126, 16–22. [Google Scholar] [CrossRef]
  11. Zhang, Z.Y.; Feng, G.X.; Kong, L.L.; Bakhtawar, W. Effect of irrigation methods on nitrogen and phosphorus loss by runoff in paddy field through ephemeral storm process. Fresen. Environ. Bull. 2016, 25, 3484–3492. [Google Scholar]
  12. Zhuang, Y.; Zhang, L.; Li, S.; Liu, H.; Zhai, L.; Zhou, F.; Ye, Y.; Ruan, S.; Wen, W. Effects and potential of water-saving irrigation for rice production in China. Agric. Water Manag. 2019, 217, 374–382. [Google Scholar] [CrossRef]
  13. Cabangon, R.J.; Tuong, T.P.; Castillo, E.G.; Bao, L.X.; Lu, G.; Wang, G.; Cui, Y.; Bouman, B.A.M.; Li, Y.; Chen, C.; et al. Effect of irrigation method and N-fertilizer management on rice yield, water productivity and nutrient-use efficiencies in typical lowland rice conditions in China. Paddy Water Environ. 2004, 2, 195–206. [Google Scholar] [CrossRef]
  14. Yang, J.; Liu, K.; Wang, Z.; Du, Y.; Zhang, J. Water-Saving and High-Yielding Irrigation for Lowland Rice by Controlling Limiting Values of Soil Water Potential. J. Integr. Plant Biol. 2007, 49, 1445–1454. [Google Scholar] [CrossRef]
  15. Belder, P.; Bouman, B.; Cabangon, R.; Guoan, L.; Quilang, E.; Yuanhua, L.; Spiertz, J.; Tuong, T. Effect of water-saving irrigation on rice yield and water use in typical lowland conditions in Asia. Agric. Water Manag. 2004, 65, 193–210. [Google Scholar] [CrossRef]
  16. Zhang, H.; Zhang, S.; Yang, J.-C.; Zhang, J.; Wang, Z. Postanthesis Moderate Wetting Drying Improves Both Quality and Quantity of Rice Yield. Agron. J. 2008, 100, 726–734. [Google Scholar] [CrossRef]
  17. Chu, G.; Chen, T.; Wang, Z.; Yang, J.; Zhang, J. Morphological and physiological traits of roots and their relationships with water productivity in water-saving and drought-resistant rice. Field Crops Res. 2014, 162, 108–119. [Google Scholar] [CrossRef]
  18. Wu, W.; Cheng, S. Root genetic research, an opportunity and challenge to rice improvement. Field Crops Res. 2014, 165, 111–124. [Google Scholar] [CrossRef] [Green Version]
  19. Yang, J.; Zhang, J.; Wang, Z.; Xu, G.; Zhu, Q. Activities of Key Enzymes in Sucrose-to-Starch Conversion in Wheat Grains Subjected to Water Deficit during Grain Filling. Plant Physiol. 2004, 135, 1621–1629. [Google Scholar] [CrossRef] [Green Version]
  20. Yang, J.C. Relationships of rice root morphology and physiology with the formation of grain yield and quality and the nutrient absorption and utilization. Sci. Agric. Sin. 2011, 44, 36–46. [Google Scholar]
  21. Yang, J.C.; Zhang, H.; Zhang, J.H. Root morpho-physiological traits in relation to the yield formation of rice. J. Integr. Agr. 2012, 11, 920–926. [Google Scholar] [CrossRef]
  22. Yang, L.; Wang, Y.; Kobayashi, K.; Zhu, J.; Huang, J.; Yang, H. Seasonal changes in the effects of free-air CO2 enrichment (FACE) on growth, morpho-physiological traits of rice root at three levels of nitrogen fertilization. Global. Chang. Biol. 2008, 14, 1–10. [Google Scholar] [CrossRef]
  23. Zhang, H.; Xue, Y.; Wang, Z.; Yang, J.; Zhang, J. An Alternate Wetting and Moderate Soil Drying Regime Improves Root and Shoot Growth in Rice. Crop. Sci. 2009, 49, 2246–2260. [Google Scholar] [CrossRef]
  24. Samejima, H.; Kondo, M.; Ito, O.; Nozoe, T.; Shinano, T.; Osaki, M. Root-shoot interaction as a limiting factor of biomass productivity in new tropical rice lines. Soil Sci. Plant Nutr. 2004, 50, 545–554. [Google Scholar] [CrossRef]
  25. Samejima, H.; Kondo, M.; Ito, O.; Nozoe, T.; Shinano, T.; Osaki, M. Characterization of Root Systems with Respect to Morphological Traits and Nitrogen-Absorbing Ability in the New Plant Type of Tropical Rice Lines. J. Plant Nutr. 2005, 28, 835–850. [Google Scholar] [CrossRef]
  26. Alhaj Hamoud, Y.; Wang, Z.; Guo, X.; Shaghaleh, H.; Sheteiwy, M.; Chen, S. Effect of irrigation regimes and soil texture on the potassium utilization efficiency of rice. Agronomy 2019, 9, 100. [Google Scholar] [CrossRef] [Green Version]
  27. Zhu, A.; Gao, J.; Huang, J.; Wang, H.; Chen, Y.; Liu, L.J. Advances in morphology and physiology of root and their relationships with grain quality in rice. Crops 2020, 2, 1–8. [Google Scholar]
  28. Agricultural Standards Publishing Research Center. NY/T83-Determination of Rice Quality. In The Agricultural Industry Standard of the People’s Republic of China; China Agricultural Press: Beijing, China, 1988. [Google Scholar]
  29. Ministry of Agriculture of the People’s Republic of China. GB/T 17891. High Quality Paddy Rice. In National Standard of the People’s Republic of China; China Agricultural Press: Beijing, China, 1999. [Google Scholar]
  30. Wei, H.-Y.; Chen, Z.-F.; Xing, Z.-P.; Zhou, L.; Liu, Q.-Y.; Zhang, Z.-Z.; Jiang, Y.; Hu, Y.-J.; Zhu, J.-Y.; Cui, P.-Y.; et al. Effects of slow or controlled release fertilizer types and fertilization modes on yield and quality of rice. J. Integr. Agric. 2018, 17, 2222–2234. [Google Scholar] [CrossRef]
  31. Chen, M.Y.; Li, X.F.; Chen, Y.F.; Ren, H.R.; Wang, W.; Jing, P.P. Effects of different irrigation methods on yield and water use efficiency of rice in different soil types. Chin. Rice 2018, 24, 10–15. [Google Scholar]
  32. Xu, G.; Lu, D.-K.; Wang, H.-Z.; Li, Y. Morphological and physiological traits of rice roots and their relationships to yield and nitrogen utilization as influenced by irrigation regime and nitrogen rate. Agric. Water Manag. 2018, 203, 385–394. [Google Scholar] [CrossRef]
  33. Yang, C.; Yang, L.; Yang, Y.; Ouyang, Z. Rice root growth and nutrient uptake as influenced by organic manure in continuously and alternately flooded paddy soils. Agric. Water Manag. 2004, 70, 67–81. [Google Scholar] [CrossRef]
  34. Chu, G.; Chen, S.; Xu, C.; Danying, W.; Xiufu, Z. Agronomic and physiological performance of indica/japonica hybrid rice cultivar under low nitrogen conditions. Field Crops Res. 2019, 243, 107625. [Google Scholar] [CrossRef]
  35. Bouman, B.A.M.; Tuong, T.P. Field water management to save water and increase its productivity in irrigated lowland rice. Agric. Water Manag. 2001, 49, 11–30. [Google Scholar] [CrossRef]
  36. Li, H.; Liu, L.; Wang, Z.; Yang, J.-C.; Zhang, J. Agronomic and physiological performance of high-yielding wheat and rice in the lower reaches of Yangtze River of China. Field Crops Res. 2012, 133, 119–129. [Google Scholar] [CrossRef]
  37. Chu, G.; Wang, Z.; Zhang, H.; Liu, L.; Yang, J.; Zhang, J. Alternate wetting and moderate drying increases rice yield and reduces methane emission in paddy field with wheat straw residue incorporation. Food Energy Secur. 2015, 4, 238–254. [Google Scholar] [CrossRef]
  38. Luo, L. Breeding for water-saving and drought-resistance rice (WDR) in China. J. Exp. Bot. 2010, 61, 3509–3517. [Google Scholar] [CrossRef] [Green Version]
  39. Song, T.; Xu, F.; Yuan, W.; Zhang, Y.; Liu, T.; Chen, M.; Hu, Q.; Tian, Y.; Xu, W.; Zhang, J. Comparison on physiological adaptation and phosphorus use efficiency of upland rice and lowland rice under alternate wetting and drying irrigation. Plant Growth Regul. 2018, 86, 195–210. [Google Scholar] [CrossRef]
  40. Chu, G.; Wang, Z.; Zhang, H.; Yang, J.; Zhang, J. Agronomic and Physiological Performance of Rice under Integrative Crop Management. Agron. J. 2016, 108, 117–128. [Google Scholar] [CrossRef] [Green Version]
  41. Qin, H.D.; Jiang, L.G.; Xiao, Q.Z.; Xu, S.H. Effect of moisture management on rice root growth and rice grain yield at different growth stages under no tillage. Chin. J. Rice Sci. 2013, 27, 209–212. [Google Scholar]
  42. Zhu, D.F.; Lin, X.Q.; Cao, W.X. Effects of deep roots on growth and yield in two rice varieties. Sci. Agric. Sin. 2001, 34, 429–432. [Google Scholar]
  43. Zhang, W.Y.; Zhu, L.Q.; Wang, W.; Zhang, Z.W.; Bian, X.M. Effect of wheat straw returning under different irrigation methods on rice growth. Crops 2014, 2, 113–118. [Google Scholar]
  44. Zhang, Z.C.; Li, H.W.; Chen, T.T.; Wang, X.M.; Wang, Z.Q.; Yang, J.C. Effect of furrow irrigation and alternate wetting and drying irrigation on grain yield and quality of rice. Sci. Agric. Sin. 2011, 44, 4988–4998. [Google Scholar]
  45. Liu, K.; Zhang, H.; Zhang, S.F.; Wang, Z.Q.; Yang, J.C. Effects of soil moisture and irrigation patterns during grain filling on grain yield and quality of rice and their physiological mechanism. Acta Agron. Sin. 2008, 34, 268–276. [Google Scholar] [CrossRef]
  46. Guo, L.; Liu, M.; Tao, Y.; Zhang, Y.; Li, G.; Lin, S.; Dittert, K. Innovative water-saving ground cover rice production system increases yield with slight reduction in grain quality. Agric. Syst. 2020, 180, 102795. [Google Scholar] [CrossRef]
  47. Wang, Q.J.; Li, M.X.; Zhao, H.L.; Chi, L.Y. Study of the effect of control irrigation on the growth of rice root. Chin. Agr. Sci. Bull. 2008, 24, 206–208. [Google Scholar]
  48. Yang, J.C.; Yuan, L.M.; Tang, C.; Wang, Z.Q.; Liu, L.J.; Zhu, Q.S. Effect of dry-wet alternate irrigation on rice quality and activities of some enzymes in grains during the Filling. Acta Agron. Sin. 2005, 31, 1052–1057. [Google Scholar]
  49. Yang, J.-C.; Chang, E.-H.; Zhang, W.-J.; Wang, Z.-Q.; Liu, L. Relationship Between Root Chemical Signals and Grain Quality of Rice. Agric. Sci. China 2007, 6, 47–57. [Google Scholar] [CrossRef]
  50. Yang, J.; Zhang, J.; Huang, Z.; Wang, Z.; Zhu, Q.; Liu, L. Correlation of Cytokinin Levels in the Endosperms and Roots with Cell Number and Cell Division Activity during Endosperm Development in Rice. Ann. Bot. 2002, 90, 369–377. [Google Scholar] [CrossRef] [Green Version]
  51. Chang, E.H.; Zhang, H.; Zhang, S.F.; Wang, Z.Q.; Yang, J.C. Effects of nitrogen and phosphorus on the root exudates during grain filling and their relations with grain quality of rice. Acta Agron. Sin. 2007, 33, 1949–1959. [Google Scholar]
  52. Hamoud, Y.A.; Guo, X.; Wang, Z.; Shaghaleh, H.; Chen, S.; Hassan, A.; Bakour, A. Effects of irrigation regime and soil clay content and their interaction on the biological yield, nitrogen uptake and nitrogen-use efficiency of rice grown in southern China. Agric. Water Manag. 2019, 213, 934–946. [Google Scholar] [CrossRef]
  53. Tang, H.T.; Ma, G.H.; Liao, Y.L.; Tang, H.M.; Tang, R. Effects of soil nutrient elements on rice qualities. Res. Agric. Mod. 2009, 30, 735–738. [Google Scholar]
  54. Zhang, H.; Yu, C.; Hou, D.; Liu, H.; Zhang, H.; Tao, R.; Cai, H.; Gu, J.; Liu, L.; Zhang, Z.; et al. Changes in mineral elements and starch quality of grains during the improvement of japonica rice cultivars. J. Sci. Food Agric. 2018, 98, 122–133. [Google Scholar] [CrossRef] [PubMed]
  55. Liu, L.J.; Li, H.W.; Zhao, B.H.; Wang, Z.Q.; Yang, J.C. Effects of alternate-drying wetting irrigation during grain filling on grain quality and its physiological mechanisms in rice. Chin J. Rice Sci. 2012, 26, 77–84. [Google Scholar]
  56. Liu, Y.; Zhang, C.; Zhao, Y.; Sun, S.; Liu, Z. Effects of growing seasons and genotypes on the accumulation of cadmium and mineral nutrients in rice grown in cadmium contaminated soil. Sci. Total. Environ. 2017, 579, 1282–1288. [Google Scholar] [CrossRef] [PubMed]
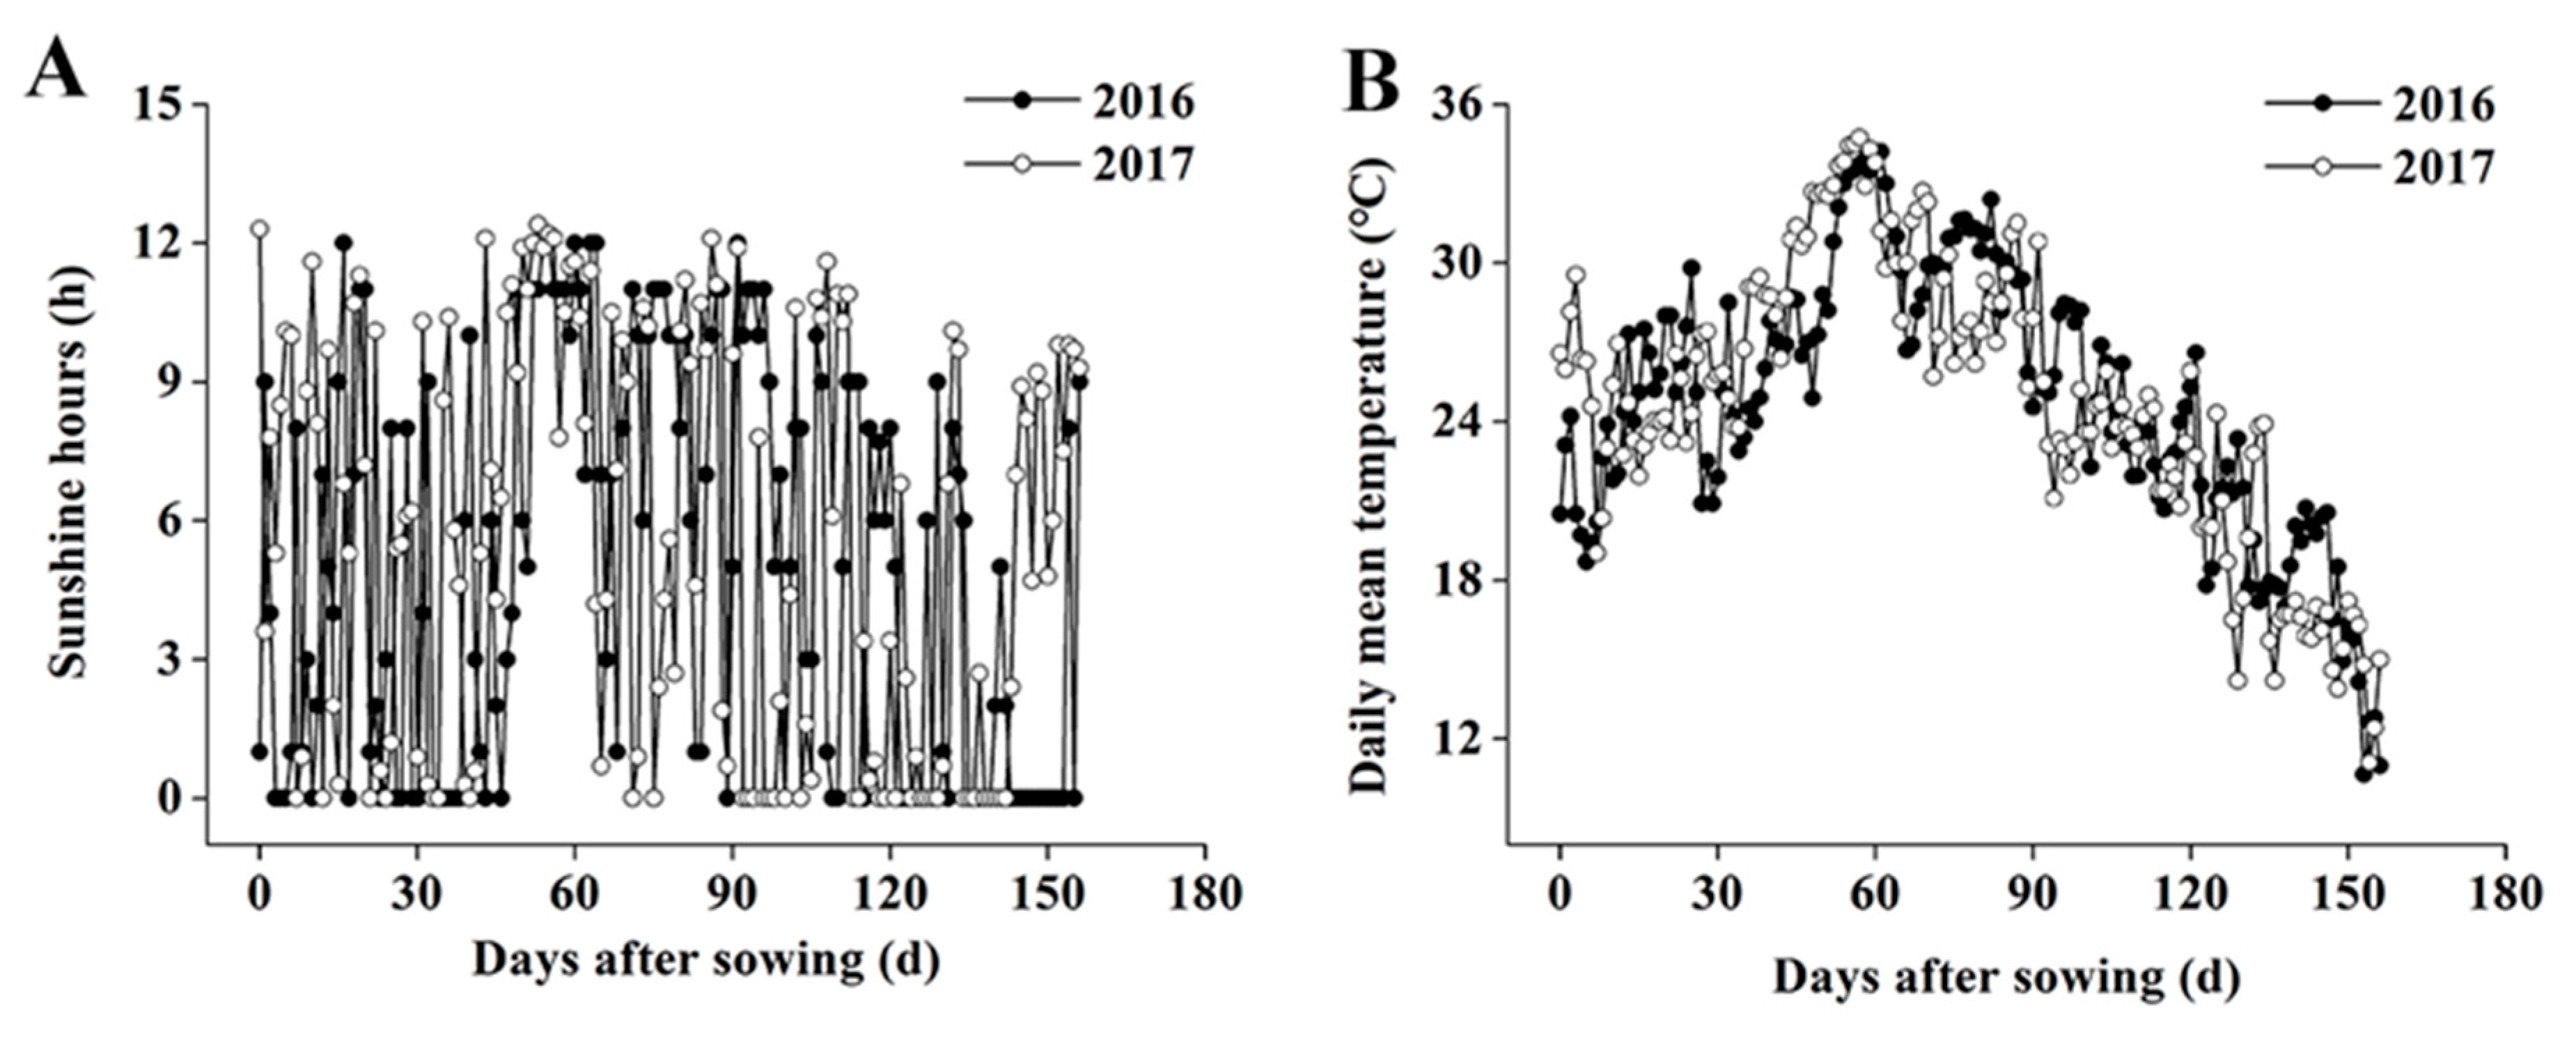
Figure 1. Sunshine hours (A) and daily mean temperature (B) during the growing season of rice in 2016 and 2017.
Agronomy 11 00120 g001
Figure 2. Effects of the irrigation regimes on root dry weights under different soil types at the jointing stage (A,D), heading stage (B,E), and maturity stage (C,F) in 2016 (AC) and 2017 (DF): CI, conventional irrigation; AWMD, alternate wetting and moderate drying; AWSD, alternate wetting and severe drying. Different lowercase letters indicate statistically significant differences among three irrigation regimes under the same soil type according to a Duncan’s multiple range test (p < 0.05). Different capital letters indicate statistically significant differences among three soil types under the same irrigation regime according to a Duncan’s multiple range test (p < 0.05). The data are presented as mean ± SE (n = 3).
Agronomy 11 00120 g002
Figure 3. Effects of the irrigation regimes on root shoot ratios under different soil types at the jointing stage (A,D), heading stage (B,E), and maturity stage (C,F) in 2016 (AC) and 2017 (DF): CI, conventional irrigation; AWMD, alternate wetting and moderate drying; AWSD, alternate wetting and severe drying. Different lowercase letters indicate statistically significant differences among three irrigation regimes under the same soil type according to a Duncan’s multiple range test (p < 0.05). Different capital letters indicate statistically significant differences among three soil types under the same irrigation regime according to a Duncan’s multiple range test (p < 0.05). The data are presented as mean ± SE (n = 3).
Agronomy 11 00120 g003
Figure 4. Effects of the irrigation regimes on root oxidation activity under different soil types at the jointing stage (A,D), heading stage (B,E), and maturity stage (C,F) in 2016 (AC) and 2017 (DF): CI, conventional irrigation; AWMD, alternate wetting and moderate drying; AWSD, alternate wetting and severe drying. Different lowercase letters indicate statistically significant differences among three irrigation regimes under the same soil type according to a Duncan’s multiple range test (p < 0.05). Different capital letters indicate statistically significant differences among three soil types under the same irrigation regime according to a Duncan’s multiple range test (p < 0.05). The data are presented as mean ± SE (n = 3).
Agronomy 11 00120 g004
Figure 5. Effects of the irrigation regimes on root bleeding under different soil types at the jointing stage (A,D), heading stage (B,E), and maturity stage (C,F) in 2016 (AC) and 2017 (DF): CI, conventional irrigation; AWMD, alternate wetting and moderate drying; AWSD, alternate wetting and severe drying. Different lowercase letters indicate statistically significant differences among three irrigation regimes under the same soil type according to a Duncan’s multiple range test (p < 0.05). Different capital letters indicate statistically significant differences among three soil types under the same irrigation regime according to a Duncan’s multiple range test (p < 0.05). The data are presented as mean ± SE (n = 3).
Agronomy 11 00120 g005
Figure 6. Effects of the irrigation regimes on root length under different soil types at the jointing stage (A,D), heading stage (B,E), and maturity stage (C,F) in 2016 (AC) and 2017 (DF): CI, conventional irrigation; AWMD, alternate wetting and moderate drying; AWSD, alternate wetting and severe drying. Different lowercase letters indicate statistically significant differences among three irrigation regimes under the same soil type according to a Duncan’s multiple range test (p < 0.05). Different capital letters indicate statistically significant differences among three soil types under the same irrigation regime according to a Duncan’s multiple range test (p < 0.05). The data are presented as mean ± SE (n = 3).
Agronomy 11 00120 g006
Table 1. The minimum (Tmin), maximum (Tmax), mean (Tmean) temperature, rainfall, mean relative humidity (RHmean), and sunshine hours (SH) in the rice growing season.
Tmin (°C)Tmax (°C)Tmean (°C)Rainfall (mm)RHmean(%)SH(h)
201620172016201720162017201620172016201720162017
May12.914.331.433.820.122.58119.683.973.365.5151230.4
June15.716.134.933.924.124.6186.2309.18176116163.2
July21.82338.54028.930.8477.399.677.473.4188251.2
August19.419.736.73929.128.378.7217.169.983.1251185.4
September16.915.434.730.82423.1187.4176.471.187.5119115.3
October8.8727.129.918.217.1308.48183.182.848127.7
November−21.523.823.611.312.295.47.478.867.5121152
Table 2. The soil properties of the experiment.
Soil TypePHOrganic Matter (g/kg)Total N (g/kg)Alkali Hydrolysable N (mg/kg)Olsen-P (mg/kg)Exchangeable K (mg/kg)
Clay soil7.9317.70.41929.512.6475.8
Loamy soil7.8617.90.75326.314.8462.5
Sandy soil7.6515.50.63218.713.0750.3
Table 3. Soil water content and irrigation water use under different irrigation methods of 2016 and 2017.
YearSoil TypeIrrigation ModesSoil Water Content (%)Irrigation Water Use (m3/m2)
0–5 cm5–10 cm10–15 cm
2016Clay soilCI24.426.630.50.78
AWMD20.423.428.00.68
AWSD18.119.622.10.66
Loamy soilCI23.525.628.70.80
AWMD19.720.126.20.69
AWSD16.618.020.90.66
Sandy soilCI21.323.623.50.93
AWMD11.612.914.90.75
AWSD10.211.713.60.71
2017Clay soilCI26.2827.7330.990.78
AWMD22.2825.2528.450.68
AWSD20.0221.3922.60.66
Loamy soilCI25.2927.3629.150.80
AWMD21.4921.9326.740.69
AWSD18.1819.8521.440.67
Sandy soilCI23.2225.48240.93
AWMD13.5214.6915.380.76
AWSD12.1113.3514.050.71
CI, conventional irrigation; AWMD, alternate wetting and moderate drying; AWSD, alternate wetting and severe drying. Within a column for a given dependent variable, means followed by different lowercase letters are significantly different (p ≤ 0.05).
Table 4. Analysis of variance of the main root characteristics under the conditions of the irrigation regimes and soil types at the jointing stage.
Source of
Variation
Degree of
Freedom
Root Dry Weight (t hm−2)Root-Shoot RatioRoot Oxidation Activity (μg g−1 h−1)Root Bleeding (mL m−2 h−1)Root Length (cm)
Y1NSNSNS22.7346 **13.7842 **
S2NSNSNS73.5894 **13.0479 **
I2NSNS7.0696 **3.5729 *14.1705 **
Y × S2NSNSNSNSNS
Y × I2NSNSNSNSNS
S × I4NSNSNSNS2.7970 *
Y × S × I4NSNSNSNSNS
NS indicates statistical significance at p > 0.05 within a column. *, ** Correlation significance at the p < 0.05 and p < 0.01 levels, respectively. Y, year; S, soil types; I, Irrigation regimes.
Table 5. Analysis of variance of the main root characteristics under the conditions of the irrigation regimes and soil types at the heading stage.
Source of
Variation
Degree of
Freedom
Root Dry Weight
(t hm−2)
Root-Shoot RatioRoot Oxidation Activity (μg g−1 h−1)Root Bleeding (mL m−2 h−1)Root Length (cm)
Y1NSNSNS11.8778 **7.1280 *
S2237.96 **62.5490 **154.1769 **127.6875 **325.7388 **
I272.39 **41.6557 **73.8943 **109.1474 **63.5733 **
Y × S23.74 *10.9464 **NSNSNS
Y × I2NSNSNSNSNS
S × I459.28 **29.6795 **69.6888 **47.5812 **81.1294 **
Y × S × I4NSNSNSNSNS
NS indicates statistical significance at p > 0.05 within a column. *, ** Correlation significance at the p < 0.05 and p < 0.01 levels, respectively. Y, year; S, soil types; I, Irrigation regimes.
Table 6. Analysis of variance of the main root characteristics under the conditions of the irrigation regimes and soil types at the maturity stage.
Source of VariationDegree of
Freedom
Root dry Weight (t hm−2)Root-Shoot RatioRoot Oxidation Activity (μg g−1 h−1)Root bleeding (mL m−2 h−1)Root length (cm)
Y1NS5.6744 *NS44.4832 **24.1413 **
S258.993 **72.3543 **NS51.6861 **401.4815 **
I219.971 **38.7094 **NS9.2362 **236.1606 **
Y × S2NSNSNS12.1896 **NS
Y × I2NSNSNSNSNS
S × I414.079 **20.4494 **NS8.5552 **171.9024 **
Y × S × I4NSNSNSNSNS
NS indicates statistical significance at p > 0.05 within a column. *, ** Correlation significance at the p < 0.05 and p < 0.01 levels, respectively. Y, year; S, soil types; I, Irrigation regimes.
Table 7. Effects of the irrigation methods on milling and appearance quality of rice under different soil types.
YearSoil TypeIrrigation ModesThe Rate ofThe Rate ofThe Rate ofChalky Kernel Rate (%)Chalky Area (%)Chalkiness (%)
Brown Rice (%)Milled Rice (%)Head Rice (%)
2016Clay soilCI77.64Bc68.27Ac65.28ABc32.02Aa25.11Aa8.04Aa
AWMD83.48Ba74.35Ba71.74Aa23.06Bc18.12Bc4.19Bc
AWSD80.37Bb72.48Bb68.27Ab27.48Bb22.34Bb6.15Bb
Loamy soilCI78.66Ac68.31Ac65.80Ac30.06Ba23.17Ba6.97Ba
AWMD84.30Aa75.28Aa72.43Aa22.12Cc17.05Cc3.78Cc
AWSD81.94Ab72.81Ab68.33Ab27.33Bb20.16Cb5.51Cb
Sandy soilCI77.38Ba67.76Aa65.03Ba25.04Cc23.32Bc5.84Cc
AWMD73.17Cb66.09Cb63.12Bb28.32Ab25.02Ab7.09Ab
AWSD69.40Cc64.02Cc62.27Bc30.77Aa29.80Aa9.18Aa
2017Clay soilCI77.42ABc68.38Ac65.49Cc32.26Aa25.38Aa8.21Aa
AWMD83.26Aa74.46Aa71.95Aa22.81Bc17.85Bc4.11Bc
AWSD80.23Ab72.59Ab68.48Bb27.74Bb22.64Bb6.31Bb
Loamy soilCI79.15Ac68.42Ac66.10Ac30.32Ba22.82Ba6.96Ba
AWMD84.73Aa75.38Aa72.7Ba21.87Cc16.70Cc3.69Cc
AWSD82.41Ab72.92Ab68.54Cb27.57Bb19.89Cb5.51Cb
Sandy soilCI76.88Ba67.37Aa64.65Ba24.87Cc23.02Bc6.00Cc
AWMD72.65Bb65.70Bb62.65Cb28.08Ab25.35Ab7.15Ab
AWSD68.97Bc63.70Bc61.93Ac31.01Aa30.1Aa9.36Aa
YNSNSNSNSNSNS
S811.5283 **606.8075 **494.9278 **10.5280 **213.9916 **87.3171 **
I94.4210 **170.6805 **183.3029 **126.4379 **112.3477 **110.8804 **
Y × SNSNSNSNSNSNS
Y × INSNSNSNSNSNS
S × I149.5434 **116.3975 **101.6312 **84.0152 **58.6131 **75.2048 **
Y × S × INSNSNSNSNSNS
NS indicates statistical significance at p > 0.05 within a column. *, ** Correlation significance at the p < 0.05 and p < 0.01 levels, respectively. Y, year; S, soil types; I, Irrigation regimes. CI, conventional irrigation; AWMD, alternate wetting and moderate drying; AWSD, alternate wetting and severe drying. Different lowercase letters indicate statistically significant differences among three irrigation regimes under the same soil type according to a Duncan’s multiple range test (p < 0.05). Different capital letters indicate statistically significant differences among three soil types under the same irrigation regime according to a Duncan’s multiple range test (p < 0.05).
Table 8. Effects of the irrigation methods on the cooking and eating quality of rice under different soil types.
YearSoil TypeIrrigation ModesGel Consistency (mm)Protein Content (%)Amylose Content (%)
2016Clay soilCI82.87Aa8.13Aa14.33Ca
AWMD85.03Aa8.15Aa14.76Aa
AWSD84.21Aa8.09Ba14.45Aa
Loamy soilCI83.05Ab8.12Aa14.45Aa
AWMD86.20Aa8.17Aa14.68ABa
AWSD85.43Aa8.17Aa14.47Aa
Sandy soilCI82.92Aa8.07Aa14.37Ba
AWMD81.57Aa7.95Aa14.36Ba
AWSD79.87Aa7.53Ca13.94Ba
2017Clay soilCI82.07Ab7.99Aa14.48Ac
AWMD85.24ABa8.00Aa14.96Aa
AWSD84.08Aab7.86ABa14.61Ab
Loamy soilCI83.32Aa8.15Aa14.64Aab
AWMD86.43Aa8.22Aa14.94Aa
AWSD85.48Aa8.26Aa14.61Ab
Sandy soilCI82.72Aa7.92Aa14.51Aa
AWMD81.44Bab7.69Aab14.6Ba
AWSD79.63Bb7.28Bb14.14Bb
YNSNS31.987 **
S14.863 **7.637 **35.846 **
INSNS39.386 **
Y × SNSNSNS
Y × INSNSNS
S × I3.508 *NS8.524 **
Y × S × INSNSNS
NS indicates statistical significance at p > 0.05 within a column. *, ** Correlation significance at the p < 0.05 and p < 0.01 levels, respectively. Y, year; S, soil types; I, Irrigation regimes. CI, conventional irrigation; AWMD, alternate wetting and moderate drying; AWSD, alternate wetting and severe drying. The data are presented as mean ± SE (n = 3). Different lowercase letters indicate statistically significant differences among three irrigation regimes under the same soil type according to a Duncan’s multiple range test (p < 0.05). Different capital letters indicate statistically significant differences among three soil types under the same irrigation regime according to a Duncan’s multiple range test (p < 0.05).
Table 9. Effects of the irrigation methods on rice starch viscosity characteristics under different soil types.
YearSoil TypeIrrigation ModesPeak Viscosity (cP)Hot Viscosity (cP)Final Viscosity (cP)Breakdown (cP)Setback (cP)
2016Clay soilCI2082Bc1553Ba2318Aa530Cc236Aa
AWMD2275Ba1300Bc2021Cc975Ba−254Bc
AWSD2117Bb1457Bb2191Cb661Bb74Bb
Loamy soilCI2171Ac1617Aa2340Aa554Bc169Ba
AWMD2340Aa1306Bc2073Bc1034Aa−267Cc
AWSD2202Ab1485Ab2217Bb717Ab15Ab
Sandy soilCI2007Ca1305Cc2145Bc701Aa138Cc
AWMD1977Cb1387Ab2216Ab590Cb240Ab
AWSD1865Cc1478Ca2337Aa387Cc472Ca
2017Clay soilCI2080Bc1543Ba2328Aa550Bc235Aa
AWMD2278Ba1295Bc2018Bc992Aa−256Bc
AWSD2114Bb1460Bb2181Bb662Ab72Cb
Loamy soilCI2174Ac1615Aa2345Aa555Bc171Ba
AWMD2344Aa1300Bc2053Bc1022Ba−266Bb
AWSD2205Ab1488Ab2207Bb714Ab152Ba
Sandy soilCI2001Ca1298Cc2143Bc716Aa136Cc
AWMD1971Cb1395Ab2218Ab619Cb239Ab
AWSD1868Cc1482Aa2346Aa415Bc470Aa
YNSNSNSNSNS
S7837.993 **383.899 **67.257 **387.245 **4706.933 **
I1819.768 **1936.763 **681.039 **916.893 **6207.040 **
Y × SNSNSNSNSNS
Y × INSNSNSNSNS
S × I494.884 **1087.712 **362.300 **358.701 **2037.366 **
Y × S × INSNSNSNSNS
NS indicates statistical significance at p > 0.05 within a column. *, ** Correlation significance at the p < 0.05 and p < 0.01 levels, respectively. Y, year; S, soil types; I, Irrigation regimes. CI, conventional irrigation; AWMD, alternate wetting and moderate drying; AWSD, alternate wetting and severe drying. Different lowercase letters indicate statistically significant differences among three irrigation regimes under the same soil type according to a Duncan’s multiple range test (p < 0.05). Different capital letters indicate statistically significant differences among three soil types under the same irrigation regime according to a Duncan’s multiple range test (p < 0.05).
Table 10. Correlation analysis.
Soil Water ContentIrrigation Water UseWater Use Efficiency
Jointing stageRoot dry weight0.763 *0.504−0.156
Root shoot ratio0.3450.0350.321
Root oxidation activity0.5760.482−0.28
Root bleeding−0.2920.471−0.442
Root length0.750 *0.2190.08
Heading stageRoot dry weight0.504−0.2680.723 *
Root shoot ratio0.256−0.4020.784 *
Root oxidation activity0.48−0.2810.740 *
Root bleeding0.16−0.490.830 **
Root length0.498−0.3810.817 **
Maturity stageRoot dry weight0.455−0.3530.781 *
Root shoot ratio0.255−0.4010.783 *
Root oxidation activity0.18−0.1090.493
Root bleeding0.37−0.3790.771 *
Root length0.435−0.3330.766 *
The rate of brown rice0.624−0.3050.758 *
The rate of milled rice0.423−0.5120.890 **
The rate of head rice0.45−0.4730.857 **
Chalky kernel rate−0.130.137−0.516
Chalky area−0.4660.309−0.745 *
Chalkiness−0.3510.224−0.664 *
Gel consistency0.504−0.3670.8 **
Protein content0.745 *0.0070.442
Amylose content0.554−0.2290.644
Peak viscosity0.582−0.3830.782 *
Hot viscosity0.141−0.025−0.194
Final viscosity−0.1490.19−0.527
Breakdown0.343−0.2640.674 *
Setback−0.4720.271−0.683 *
*, ** Correlation significance at the p < 0.05 and p < 0.01 levels, respectively. CI, conventional irrigation; AWMD, alternate wetting and moderate drying; AWSD, alternate wetting and severe drying. Irrigation water use refers to total applied irrigation water. n = 9.
Table 11. Correlation analysis.
The Rate of Brown RiceThe Rate of Milled RiceThe Rate of Head RiceChalky Kernel RateChalky AreaChalkinessGel consistencyProtein ContentAmylose ContentPeak ViscosityHot ViscosityFinal ViscosityBreakdownSetback
Jointing stageRoot dry weight0.3860.1430.196−0.064−0.337−0.2450.3090.5690.3880.4550.2190.0530.207−0.27
Root shoot ratio0.5590.4740.429−0.308−0.515−0.4560.633 *0.5130.3150.524−0.034−0.1620.397−0.239
Root oxidation activity0.163−0.063−0.010.121−0.154−0.0470.110.4170.230.2910.3090.2190.040.088
Root bleeding−0.297−0.372−0.338−0.0520.150.063−0.225−0.225−0.256−0.216−0.0660.173−0.1220.253
Root length0.4370.280.393−0.15−0.389−0.2850.340.4480.4520.5770.153−0.0480.333−0.456
Heading stageRoot dry weight0.950 **0.927 **0.949 **−0.815 **−0.980 **−0.952 **0.944 **0.754 *0.916 **0.953 **−0.437−0.754 *0.930 **0.930 **
Root shoot ratio0.853 **0.927 **0.943 **−0.909 **−0.913 **−0.942 **0.881 *0.570.815 **0.810 **−0.678 *−0.898 *0.960 **−0.919 **
Root oxidation activity0.942 **0.945 **0.966 **−0.849 **−0.967 **−0.954 **0.947 **0.726 *0.888 **0.920 **−0.529−0.809 **0.957 **−0.946 **
Root bleeding0.844 **0.911 **0.900 **−0.822 **−0.922 **−0.914 **0.910 **0.5920.791 *0.849 **−0.527−0.768 *0.905 **−0.835 **
Root length0.976 **0.980 **0.976 **−0.759 *−0.965 **−0.917 **0.981 **0.759 *0.880 **0.951 **−0.383−0.723 *0.899 **−0.903 **
Maturity stageRoot dry weight0.938 **0.945 **0.958 **−0.784 *−0.962 **−0.919 **0.959 **0.727 *0.868 **0.947 **−0.44−0.733 *0.927 **−0.910 **
Root shoot ratio0.849 **0.898 **0.930 **−0.868 **−0.925 **−0.929 **0.882 *0.5580.808 **0.878 **−0.538−0.778 *0.931 **−0.859 **
Root oxidation activity0.683 *0.673 *0.652 *−0.687 *−0.770 *−0.774 *0.762 *0.5510.6020.699 *−0.377−0.5230.713 *−0.603
Root bleeding0.909 **0.924 **0.944 **−0.833 **−0.967 **−0.947 **0.920 **0.675 *0.890 **0.917 **−0.502−0.799 **0.940 **−0.910 **
Root length0.931 **0.950 **0.978 **−0.871 **−0.970 **−0.963 **0.932 **0.689 *0.899 **0.918 **−0.556−0.840 **0.970 **−0.961 **
*, ** Correlation significance at the p < 0.05 and p < 0.01 levels, respectively.
Publisher’s Note: MDPI stays neutral with regard to jurisdictional claims in published maps and institutional affiliations.