Article

Temporal Variations of Soil Organic Carbon and pH at Landscape Scale and the Implications for Cropping Intensity in Rice-Based Cropping Systems

by
Md. Noor E. Alam Siddique
1,2,*,
Lisa Lobry de Bruyn
1,*,
Chris N. Guppy
1 and
Yui Osanai
1
1
School of Environmental and Rural Science, University of New England, Armidale 2350, NSW, Australia
2
Soil Resource Development Institute, Ministry of Agriculture, Rangpur 5402, Bangladesh
*
Authors to whom correspondence should be addressed.
Agronomy 2021, 11(1), 59; https://doi.org/10.3390/agronomy11010059
Submission received: 25 November 2020 / Revised: 23 December 2020 / Accepted: 25 December 2020 / Published: 29 December 2020
(This article belongs to the Special Issue Effects of Agricultural Management on Soil Properties and Health)

Abstract

:
Landscape scale assessment of temporal variations in soil organic carbon (SOC) contents and soil pH and the implications for long-term agricultural sustainability was determined using legacy datasets collected over two periods separated by 20 years: the 1990s and 2010s. Soil data on SOC and pH were categorized according to the prevailing land types (based on inundation as highland (HL), medium highland (MHL), and medium lowland (MLL)), and physiographic types (i.e., Himalayan Piedmont plain, Tista Floodplain and Barind tract/Terrace) to determine which variable or combination of variables was more influential in spatial and temporal changes of these properties. SOC contents in the physiographic types were generally found to be low, varying between 8 to 12 g/kg. While, SOC contents were significantly higher in MHL and MLL compared with HL that experienced less inundation. The change in SOC contents over 20 years was significant with a 14.5% increase of SOC. There was a greater influence of land type compared with physiography on SOC contents over time. Inundation land types and associated cropping intensity were considered likely to influence SOC of soils under rice-based cropping systems. Furthermore, the levels of soil pH decreased by 0.5 units over 20 years with an approximately 50% increase in soils within a pH category of 4.6–5.5. The majority of soil pH results shift from slightly acidic to strongly acidic in the intervening 20-year period between samplings. Soil acidification is potentially a combination of inefficient and excess use of ammonium-based fertilizers with higher application rates and low input from residues. We conclude that acidification may continue with more intensive land use. However, trends in SOC contents over time under certain combinations of physiography and land type either increased slightly or showed a significant loss and in the latter, specifically, the role of land management is not clear. The legacy datasets would be useful for monitoring spatial and temporal soil quality trends at a regional scale, but has limited capacity to capture field level variations in soil properties as data on smallholder cropping practice and management were not collected. Therefore, future research examining the role of management in SOC and pH dynamics at the field-scale would guide the use of fertilizers, crop residue management, and amelioration of acidic soil, to improve the sustainability of rice-based cropping systems in Bangladesh.

1. Introduction

Understanding the changes in soil properties under agriculture is essential because if soil condition declines it effects land management, environmental sustainability and crop production. Different agricultural activities and land management practices in intensive cropping systems affect soil health over time [1] and influence soil physio-chemical and biological properties, which affect soil productivity and resilience of agroecosystems [2]. Thus, it is important to elucidate the effects of agriculture on various soil properties to determine spatial and temporal trends of soil organic carbon (SOC) and soil pH, and whether these properties are being maintained at levels sufficient to sustain current land use and future agricultural development [3,4,5,6]. The spatial and temporal variability of SOC and soil pH are two of the fundamental soil properties that can be used to assess the impact of land use change on soil productivity and the sustainability of agricultural systems [7,8,9]. The spatial and temporal evaluation of SOC and soil pH is important for soil health restoration and to assess carbon sequestration potential of agricultural soils [10,11,12]. SOC is a key indicator of soil quality [13] that performs a significant role in increasing crop productivity. It is of utmost importance to increase SOC and maintain a balanced soil pH to secure the fertility and productivity of agricultural soils. In addition, understanding if the changes in SOC and pH over time is positive and essential for achieving food security and reducing carbon emissions that result in global warming and unsustainable land use [14,15].
Soil pH performs a significant role in regulating soil conditions and ecosystem functioning [16]. The pH of acidic soil has certain effects on SOC: reduction of the solubility of SOC, a change in organo-mineral interactions of tropical soils, an increase in toxic cations (i.e., Al, Mn), and a decline in soil microbial and enzyme activity [17]. The effect of soil pH is an integral part of SOC turnover with less SOC turnover under acidic conditions. Thus, it is necessary to quantify the temporal variation of SOC and pH at the same time. However, soil acidity tends to be buffered naturally by mineral ions, and the natural change of soil pH occurs very slowly over the centuries [18]. Despite soil’s buffering capacity, soil acidification may become a concern in intensive rice-based agricultural systems. Researchers worldwide have reported soil acidification in intensified cropping systems, primarily due to agrochemicals and fertilization [3,5,6,11,16,19,20]. The intensive and conventional rice-based systems of South Asia are not much different, but the smallholder farmers rely on agrochemicals and fertilizers for high yield goals, which are characterized as having low crop residue incorporation and organic amendments. In this context, the characterization of SOC in rice-based systems in South Asia is limited by data, inconsistency in SOC measurements and variable management of intensive agriculture by smallholder farmers [21]. Intensive farming in these regions has been held responsible for significantly depleting the SOC stock of agricultural soils due to widespread practices of tillage, unbalanced fertilization, and removal of crop residues, but often land management data is lacking to determine accurately its contribution [21,22]. In countries like India, Nepal, Bhutan [21] and China [3,22,23,24] studies reported that intensive farming over time has depleted the SOC content in agricultural soils.
In Bangladesh, since the early 1990s the Rice-based Cropping System (RBCS) have been intensified using hybrid varieties, intensive tillage and higher quantities (250–300 kg/ha) of chemical fertilizer but mostly unbalanced doses of individual fertilizers [25], which has been suspected to unfavorably impact soil health. Typically, above ground crop residues and stubble (rice straw) after harvest are mostly removed for homestead use and animal fodder. This practice makes the agricultural soils of Bangladesh vulnerable to a decline in SOC and land degradation over time. To develop an understanding of the temporal changes in SOC and soil pH at a landscape scale that would identify areas that are more affected by declines in SOC and/or soil pH or areas that show potential to increase SOC in agricultural soils. Hence, knowing the capacity of agricultural soils to store SOC and maintain a balanced pH could prioritize where initiatives to restore soil fertility can best be directed [12]. The status of SOC and soil pH is also a prerequisite for assessing soil quality, fertilization, and assists farmers making decisions on land management they employ or soil amendments they will apply [26,27,28]. In Bangladesh, most farmers practice RBCS in their agricultural lands based on dry and wet cropping season, land inundation (depth of seasonal flooding), yield goal and livelihood expectations.
Previous research on SOC contents recorded in the double and triple cropped agricultural lands of Bangladesh were found to be low in the Brahmaputra and Ganges alluvium soils and that land inundation affects SOC contents in these soils [8]. However, the spatial and temporal relationships between land use and SOC and soil pH were not determined at a finer scale of resolution. The potential impact of cropping intensity and variable smallholder fertilization on SOC and soil pH has not been fully studied for the RBCS of Bangladesh. Additionally, SOC contents and soil pH have not been examined in a spatio-temporal context in the northwestern physiographic types linking cropping intensity and land inundation by flooding. The northwestern region of Bangladesh consists of three physiographic types, i.e., the old Himalayan Piedmont plain, Tista Meander Floodplain, and Barind Tracts/Terrace, which will henceforth be referred to as “Piedmont plain”, “Floodplain”, and “Terrace”. These physiographic types consist of three land type categories based on land inundation, i.e., highland (HL), medium highland (MHL) and medium lowland (MLL), which will be hereafter referred as “land types”. The spatial and temporal variability of SOC and soil pH in these physiographic types has not been studied using historic soil survey information, such as national legacy soil datasets. In addition, the long-term trends in SOC and pH have not been determined to assess the influence of time, physiography and land types. Therefore, we tested that the existing legacy soil datasets of the 1990s and 2010s could potentially identify the spatial and temporal trend of SOC and soil pH in RBCS of Bangladesh. There are advantages of using legacy data for spatial and temporal monitoring and evaluation of soils, as it is generally cost-effective and results based on past soil information are available while gathering new data requires costly and time consuming re-sampling and laboratory analysis [6]. Legacy soil datasets have been used to quantify variation in SOC and soil pH in China [7], South Korea [5], England and Wales [29] and Australia [6]. Thus, assessment of the variability of SOC and soil pH using the legacy soil data of Dinajpur district could identify the change in the levels of these properties over time, and what parts of the land types were more vulnerable to the loss of SOC and decline in soil pH. Consequently, the value of legacy datasets would be assessed to identify the spatial and temporal changes in SOC and soil pH, and these datasets offer multiple benefits such as identification of areas prone to land degradation, soil acidification, site selection and if farm-level decisions such as residue management, choice of crop, fertilization, amendments and inputs are affecting these soil properties.
Hence, the legacy soil datasets of the 1990s and 2010s were analyzed to understand the spatial and temporal change in SOC and soil pH under three soil physiographic types (i.e., Piedmont plain, Floodplain and Terrace) across inundation land types. In the intervening time between soil sampling, Bangladesh undertook many changes in its agricultural land use and management. The level of change in cropping intensity and fertilizer use from the 1990s to 2019 was assessed in the Dinajpur district to identify the trends. The potential link of cropping intensity and fertilizer application levels was explored to understand its impact on SOC and soil pH over time. Detailed examination of SOC and soil pH spatial and temporal change in the physiography across land types, cropping intensity and smallholder management is lacking in rice-based cropping systems in northwestern Bangladesh. Therefore, this study hypothesized that due to agricultural intensification over this 20-year period the SOC content and pH levels will be affected differently with certain physiographic types and land types (i.e., HL, MHL, MLL) either being more or less vulnerable to SOC and soil pH decline. The primary objective was to identify the spatial patterns in SOC content and soil pH due to the effects of the physiographic types, land types, and then both factors combined. The secondary objective was to identify the net change in SOC and soil pH by year (i.e., time periods, 1990s and 2010s), and then the interactions with physiography and land types were assessed to understand their contribution, and which areas were more or less vulnerable to SOC and soil pH over 20 years.

2. Materials and Methods

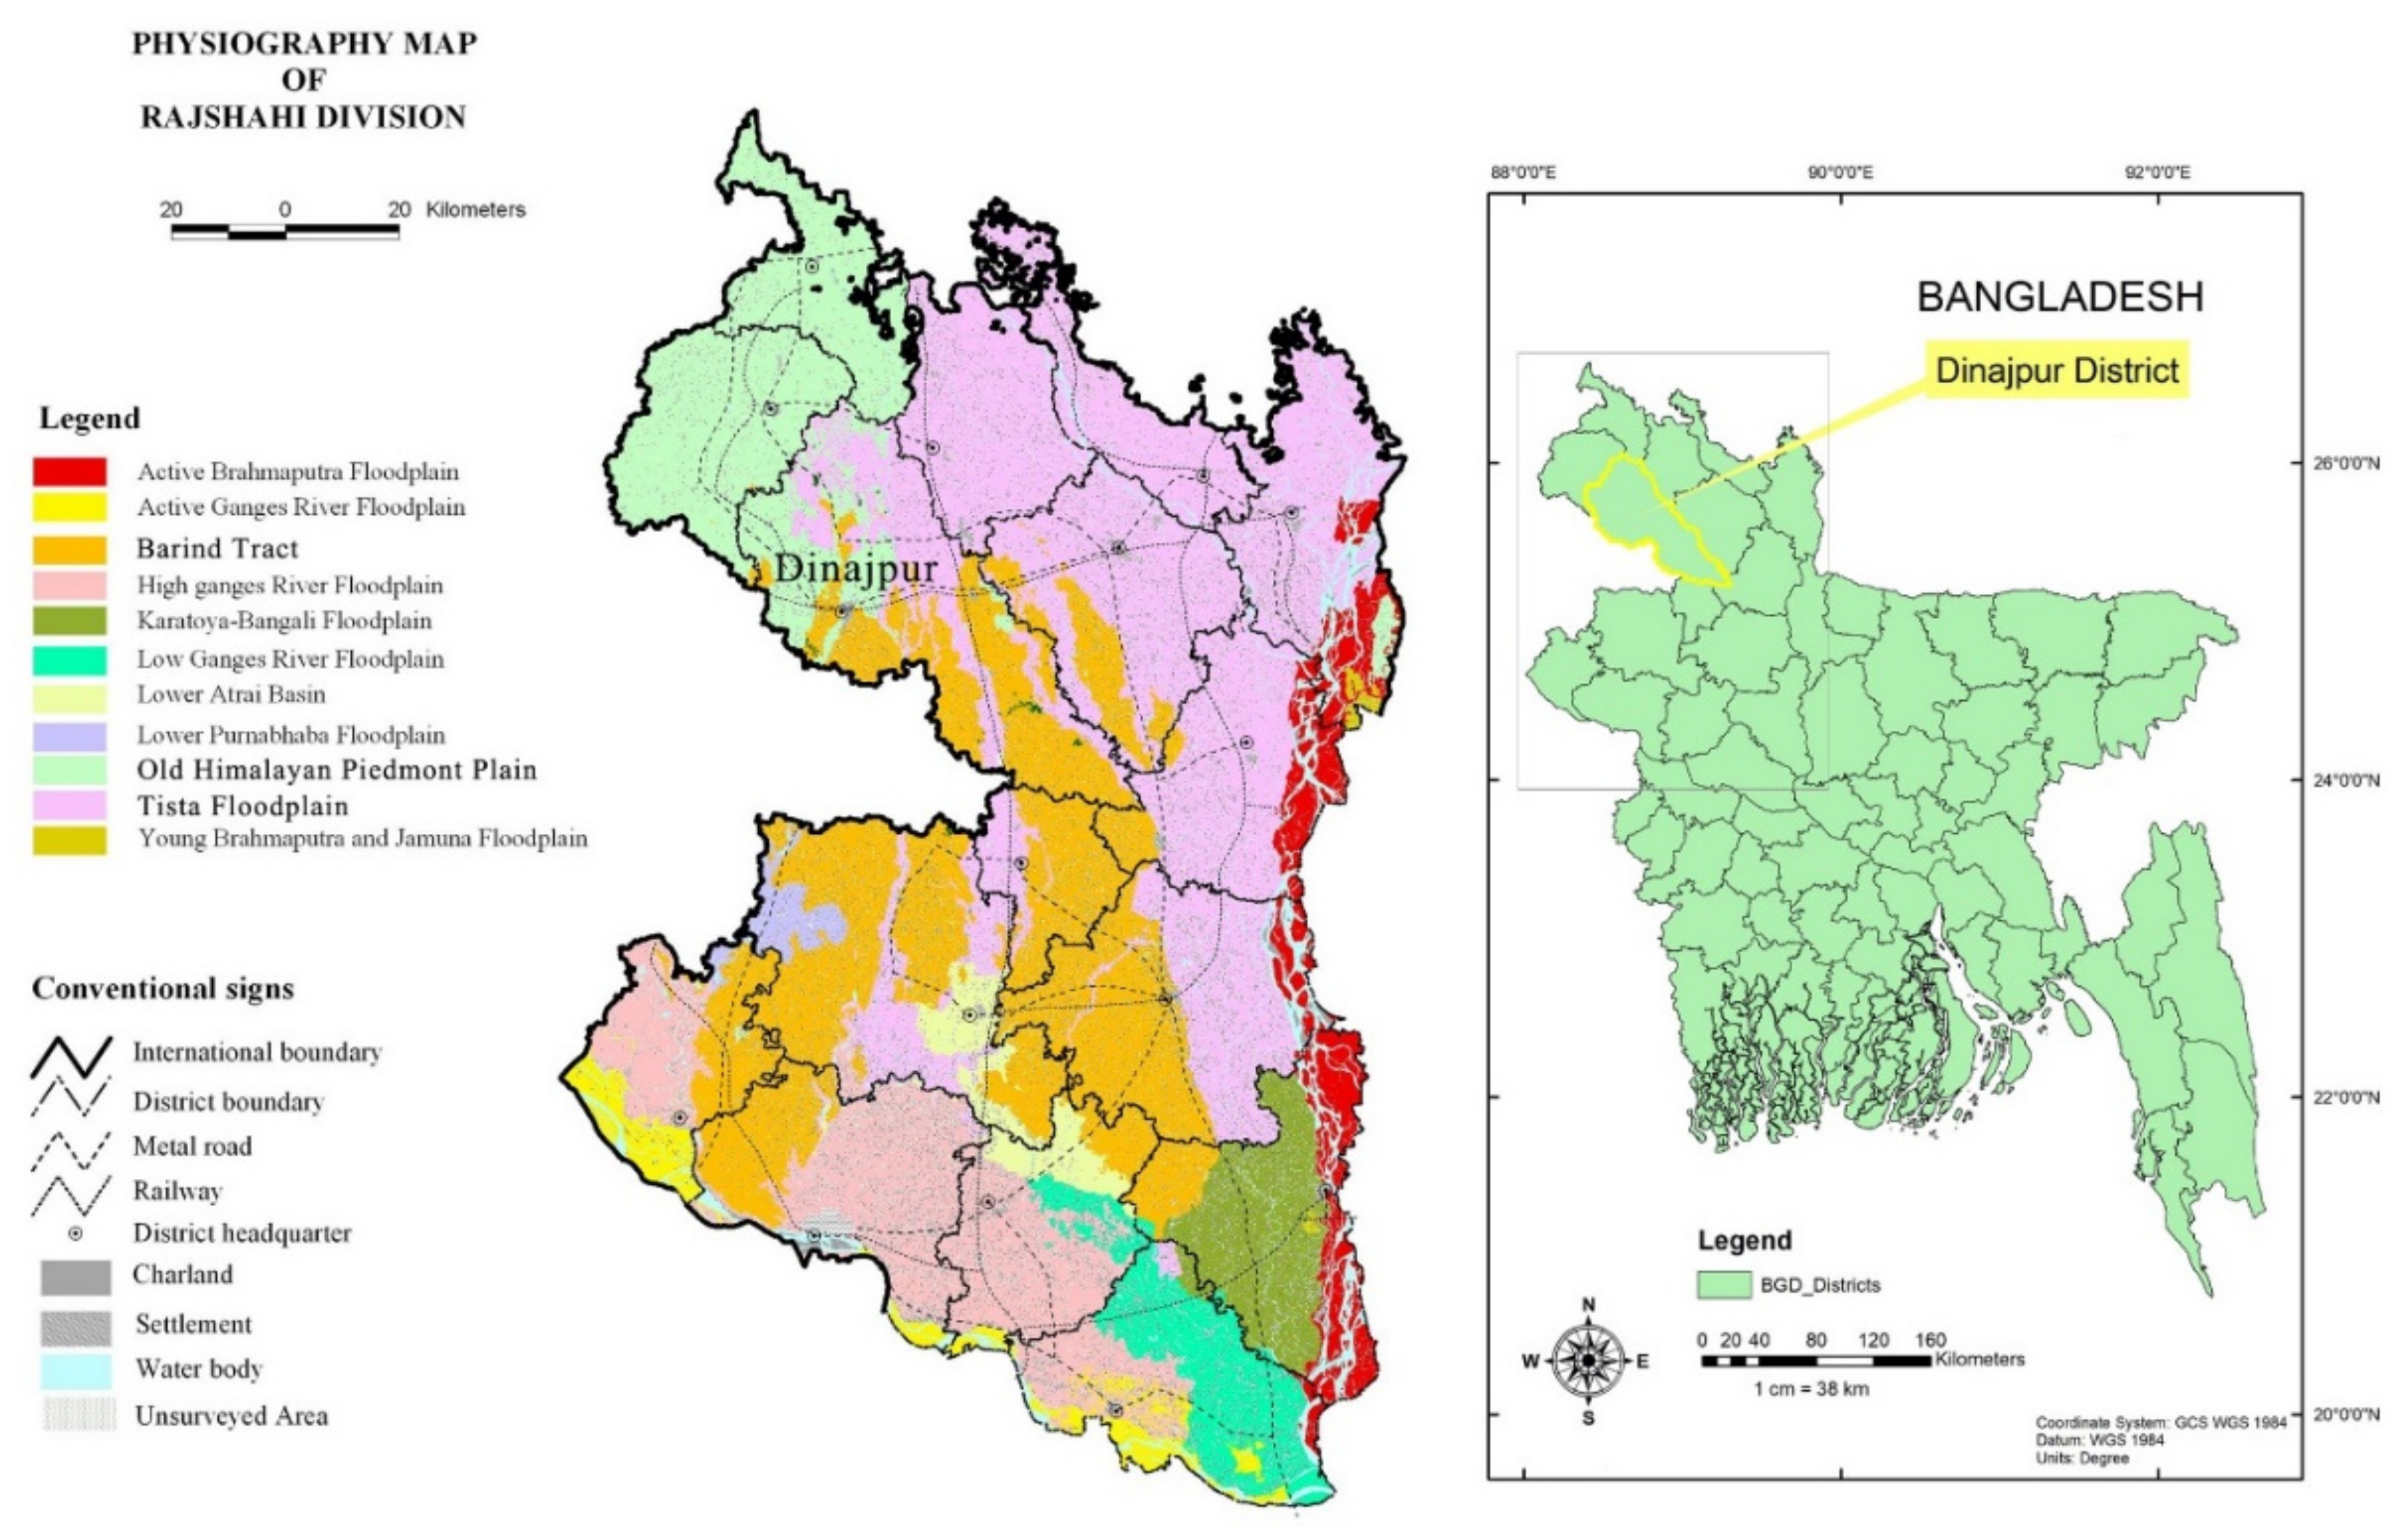
2.1. Study Area Description

Dinajpur district lies between 26°04′ north latitude and 89°18′ east longitude in the Northwestern region of Bangladesh (Figure 1). The total area of Dinajpur is 3438 km2 [30]. The cropped area was 2707 km2 in 2014–2015 [31]. Dinajpur is among one of the most intensively used agricultural areas in Bangladesh. The region has a humid, wet and hot subtropical climate with distinct summer, monsoon and winter seasons. The majority of soils are located in three physiographic types, i.e., Piedmont plain, Tista Floodplain and Barind Tract/Terrace (Figure 1). The soils of Piedmont plain and Tista Floodplain are non-calcareous grey soils (i.e., Gleysols) and Terrace is shallow grey soils (i.e., Planosols) [32]. The lands of Dinajpur possess three land types, based on flooding during the monsoon and/or flood season, which are HL (i.e., land above the normal flooding level) and MHL (i.e., land flooded up to 90 cm for at least two weeks) and the remainder is MLL (i.e., land flooded up to 90–180 cm for more than two weeks) [32]. The surface soil (i.e., 0–15 cm generally) texture is mainly loam and silt loam, but varies from silt loam to sandy loam and silty clay loam to clay loam [33]. Farmers throughout the year depend on monsoon rain and/or irrigation, and commonly practice double crops (i.e., Aman rice in monsoon and Boro rice in winter/dry season rice) or triple crops (i.e., Aman and Boro rice with rotation crop) in MHL and HL or single crop (i.e., Aman rice) in MLL areas [32]. Land management is characterized by conventional farming, agrochemicals, irrigation in dry season and high yielding crop varieties. Puddling (i.e., wet-tillage) is a traditional soil management practice for land preparation before transplanting of seedlings in paddy fields, which involves plowing and harrowing of surface soil in water-saturated conditions. After paddy crop harvest, crop residues and stubbles are often removed for animal fodder and homestead purposes in Dinajpur.

2.2. Soil Legacy Data, Cropping Intensity and Fertilizer

SOC and pH datasets from two separate periods (i.e., 1990s and 2010s) were extracted from legacy soil data that was collected for a national semi-detailed soil survey program, conducted by the Soil Resource Development Institute in Bangladesh. The first soil survey initiative was published in the Land and Soil Resource Utilization Guide (LSRUG) (recognized as Upazila Nirdeshika) for each upazila’s (sub-district) in Bangladesh [32]. The second phase of the survey (i.e., follow-up soil survey) was published as reports with a soil polygon map (1:50,000). Dinajpur district consists of thirteen upazila, soil survey datasets were accessed from the primary survey (first phase) and follow-up survey (second phase). These soil datasets are referred to as “legacy data of 1990s and 2010s periods”. The potential contribution of increasing cropping intensity and fertilization on the trends of SOC and soil pH was explored from 1990 to 2019 in Dinajpur. The cropping intensity (%), which is [(gross cropped area (total cropping area sown once and/or more in a year)/Net-cropped area (total cropping area) × 100)]; and fertilizers (Nitrogen (N), Phosphorus (P), Potassium (K), Sulphur (S)) usage (kg/ha) data from 1990 to 2019 were collected from the District Agriculture Office and Bangladesh Bureau of Statistics (BBS).
The legacy datasets of SOC and soil pH included a total number of 778 surface (0–15 cm) soil samples (i.e., Floodplain 389, Piedmont plain 89 and Terrace 300) each with two sets (1990s and 2010s) at the landscape scale (1:50,000). In both time periods, SOC was measured using Walkley and Black’s wet oxidation method [34] and soil pH was measured in 1:5 soil:water extracts. The total number of soil samples was higher in all physiography during the 2010s survey. The additional soil samples were not included in this analysis so that the samples that were collected during the 1990s were comparable to 2010s. The sample reduction was done to avoid any bias in the results. The soil samples of 1990s and 2010s were subjected to spatial matching within approximately of one-minute difference in latitude and longitude intervals (i.e., grid size of 1600 m). The soil map legend information (i.e., physiography, soil polygons, land types, soil series) and LSRUG report of respective upazila served as basis for sorting the soil samples of both time periods. Firstly, soil sample locations were identified according to the number of samples in the respective soil polygon map of each upazila. Then, the samples were matched individually within the grids following objective selection [35] based on physiography, land types and soil series.

2.3. Statistical Analysis

For data analysis and visualization, the statistical software R for Windows version 1.2.5019 and Microsoft Excel were used. Statistical significance was taken at the p < 0.05 level. Data were tabulated and visualized for physiography, land types and the interactions between the two factors. The contents of SOC and soil pH in physiographic types, land types were visualized in line and bar graphs. To establish the relationships statistically among the variables, SOC and soil pH were considered as dependent variables, and soil sampling years (i.e., time periods 1990s and 2010s), physiography and land type were considered as independent variables. Three-way partial (unbalanced) factorial linear regression models were carried out for the analysis of variance. The partial factorial model was used because the land type category MLL is only present in the Floodplain and is absent in the Piedmont plain and Terrace physiography, so that the model was not constrained by the number of categories within variables. For comparing the means of SOC and soil pH between the 1990s and 2010s for each physiography across land types the Fisher’s Least Significance Difference (LSD) post hoc multiple comparison tests was applied. Prior to analysis, the box-cox transformation was applied to the dependent variables (i.e., SOC and soil pH), ANOVA assumptions were checked and the normality distributions were assessed through Q-Q plots.

3. Results

3.1. Soil Organic Carbon (SOC)

3.1.1. Spatial Pattern of SOC in the Physiography and Land Types

The effect of the physiography and land types on SOC contents were assessed first to examine the spatial effects on SOC contents. The main effect of land type on SOC contents was strong and significant (p < 0.0001, Table 1), with MLL (16.2 g/kg) containing almost double the contents recorded in HL (8.4 g/kg) and MHL (9.8 g/kg). While the main effect of physiography on SOC contents was not significant (p = 0.084), there was a significant interaction between physiography and land type on SOC contents (p = 0.004, Table 1), indicating that the effect of land type on SOC contents differed between the physiography. In the Floodplain, SOC contents were highest in MLL followed by MHL, and lowest in HL (Figure 2), with the Piedmont plain following the same effect of land type for MHL and HL, albeit SOC contents were higher in the Floodplain (Figure 2). In the Terrace physiography, on the other hand, the effect of land type was less pronounced, with nearly similar SOC contents in both HL and MHL (Figure 2).

3.1.2. Temporal Changes in SOC and Effects of Physiography and Land Types

There was a strong, significant difference in SOC contents between soil sample collection periods (p < 0.0001, F = 75, Table 1). Across all the physiography and land type, the average SOC contents increased by 14.5% from 8.3 g/kg in 1990s to 9.5 g/kg in 2010s. The magnitude of this increase differed between physiography (i.e., year × physiography interaction, p = 0.011), where the increasing trend in SOC contents over the 20 year period was more evident for the Floodplain and Terrace compared with the Piedmont plain physiography (Figure 3). The temporal changes in SOC contents also differed between land types (i.e., year × land type interaction, p < 0.0001). In both HL and MHL, SOC contents increased by 16.5% and 13.1% respectively over the 20-year period, while SOC contents decreased by 40.9% in MLL (Figure 4).
The temporal changes in SOC contents were further examined for each physiography and land type combination to identify which areas were particularly vulnerable to changes in SOC contents (Figure 5). For the Piedmont plain, SOC contents over the 20 year period remained the same in HL at 8.6 g/kg (LSD = 0.0, p = 0.956, Figure 5A) and in MHL at 10.3 g/kg (LSD = 0.6, p = 0.626). For the Floodplain, SOC contents after 20 years increased by 24.3% in HL (LSD = 1.7, p < 0.0001, Figure 5B) and by 19.3% in MHL (LSD = 1.7, p < 0.0001), but decreased by 40.9% in MLL (LSD = −8.3, p < 0.0001) from 20.3 g/kg in 1990s to 12.0 g/kg in 2010s. For the Terrace, SOC contents increased by 14.8% over the 20 year period in HL (LSD = 1.2, p < 0.0001, Figure 5C), but remained the same in MHL (LSD = 0.5, p = 0.093).

3.2. Soil pH

3.2.1. Spatial Pattern of Soil pH in the Physiography and Land Types

Soil pH was most significantly influenced by physiography (p < 0.0001), but also by land type (p = 0.007) and their interaction (p = 0.007, Table 2). Soil pH values are lower in the Piedmont plain (5.3) and Terrace (5.2) than Floodplain (5.4) physiography (Figure 6). Soil pH values were highest in MHL (5.5) of Floodplain physiography followed by HL (5.3) and MHL (5.3) of Piedmont plain physiography, MLL (5.2) of Floodplain physiography and lowest in HL (5.1) and MHL (5.1) of Terrace physiography, with Piedmont Plain and Terrace following similar trends, albeit levels of soil pH were higher in Floodplain physiography (Figure 6 and Table S2). The physiographic types were affected more on the levels of soil pH than the interaction effect of physiography with the land inundation types.

3.2.2. Temporal Changes in Soil pH and Effects of Physiography and Land Types

There was a strong, significant difference in soil pH between soil sample collection periods (p < 0.0001, Table 2). Soil pH decreased by 0.5 unit from 5.5 in 1990s to 5.0 in 2010s. Hence, after 20 years all the soil samples shifted towards more acidic conditions (Figure 7 and Table S2). The magnitude of this decline in soil pH over time also differed between the physiography (i.e., year × physiography interaction, p = 0.010). The decline in soil pH was most pronounced in the Piedmont plain (0.4 unit reduction on average), and less pronounced in the Floodplain (0.2 unit reduction). Temporal changes in soil pH was not affected by land type (p = 0.618) nor by physiography × land type interaction (p = 0.628, Table 2).
The temporal changes in soil pH were further examined for each physiography and land type combination to identify which areas were particularly vulnerable to changes in soil pH (Figure 8, Table S2). For the Piedmont plain physiography, soil pH was significantly lower by 0.4 units in both HL (LSD = 0.4, p < 0.0001) and MHL (LSD = 0.4, p = 0.002) compared with 1990s sample (Figure 8A). For the Floodplain, soil pH was significantly lower in 2010s than 1990s by 0.2, 0.3 and 0.4 unit in HL (LSD = 0.2, p < 0.0001), MHL (LSD = 0.3, p < 0.0001) and MLL (LSD = 0.4, p = 0.009), respectively (Figure 8B). For the Terrace physiography, soil pH was also significantly lower in 2010s compared to 1990s by 0.4 and 0.3 unit in HL (LSD = 0.4, p < 0.0001) and MHL (LSD = 0.3, p < 0.0001) respectively (Figure 8C).

3.2.3. Comparing Soil pH Categories in the 1990s and 2010s

The trend shift in percentage of the pH categories over time in three physiography was identified based on the soil pH categorization in Bangladesh (Figure 9). In the 1990s, soil pH showed approximately even distribution of slightly acidic (pH 5.6 to 6.5) and strongly acidic (pH 4.6 to 5.5) category. In contrast, strongly acidic category (pH 4.6 to 5.5) dominated approximately 50% of soil samples (i.e., Floodplain 37%, Piedmont plain 56% and Terrace 46%) during the 2010s. In addition, the percentage of very strongly acidic (pH < 4.5) category has increased over time, which means that majority of the soil samples of the 2010s fall in the strongly acidic and very strongly acidic category compared with soil samples of the 1990s. The percentage of soil samples within pH ranges between 5.6 to 6.5 and 6.6 to 7.3 decreased, but the percentage of soil samples within pH ranges between 4.6 to 5.5 and <4.5 increased in the 2010s compared with soil data collected from the 1990s. This indicates a temporal shift of soil pH from neutral and slightly acidic category towards strongly and very strongly acidic soil pH category over 20 years in the legacy datasets (Figure 9).

3.3. Trend in Cropping Intensity and Fertilizer Use over Time

The average annual cropping intensity (%) and use of fertilizers (kg/ha) was increased greatly in the Dinajpur district of Bangladesh from 1990 to 2019. The mean cropping intensity during the 1990s was 160%, which over 29 years increased to 231%. The mean usage of fertilizer has also increased from 150 kg/ha to 300 kg/ha from 1990 to 2019 (Figure 10).

4. Discussion

The spatial patterns will be discussed first followed by temporal change (over a 20 year period from 1990s to 2010s) in SOC content and then soil pH in the three physiographic types (i.e., Piedmont plain, Tista Floodplain and Terrace), three land types (HL, MHL, MLL) and the interactions between these two factors. The role of crop intensification and land management practices at a regional level was also examined to highlight any plausible relationships with changes in SOC content and pH observed over time in the legacy data sets.

4.1. Geomorphological Setting and Effect of Land Types on SOC

The overall SOC content was considered low across the three physiographic types (i.e., Piedmont plain 9.0 g/kg, Floodplain 8.8 g/kg and Terrace 9.0 g/kg) despite their differences in genesis, relief, geomorphology, and land types (i.e., HL, MHL and MLL). Further, Table S1 shows the SOC content for each physiography and land types combined. Land type had a more significant effect on SOC content, and also interacted with physiography (Table 1 and Figure 2). The Piedmont plain consists of alluvium soils at the base of the Himalayas. These soils are less inundated due to the dominance of HL compared to Floodplain physiography. On the contrary, Floodplain physiography consists of recent alluvium soils with broad ridge area and level basin. The HL in the ridge area is generally not exposed to seasonal flooding, although soils of the ridges become wet due to heavier rains in the monsoon season. The lower parts of the ridges and basins are usually flooded during the monsoon, for example, MHL is flooded up to 90 cm for at least two weeks and MLL is flooded up to 90–180 cm for more than two weeks. While the Terrace physiography consists of highly weathered soils developed over the Madhupur clay (i.e., tertiary clay), with local differences in elevation and seasonal inundation during the monsoon [32].
The three physiographic types also possess distinctive geomorphological features, and inundation land types, which affects the intensity of the RBCS [37]. The floodplain physiography and MLL had the highest loss of SOC, between the two time periods which could be related to cropping intensity in association with land type. The HL area of the physiographic types are more vulnerable to SOC decline and the SOC content observed in 2010s remained low (8.6 g/kg). A possible explanation is that intensive agriculture takes place in this area with highland crops (i.e., potato, vegetables) because they are less affected by flooding compared to Floodplain and Terrace physiography. However, this amount of SOC is considered too low for maintaining the quality of agricultural soils and below the critical limit of 12 g/kg [38,39] in Bangladesh. A threshold of 20 g/kg SOC is recognised as the optimum content that can improve soil aggregate stability and soil quality in hot-tropical agroecosystems [40,41], but it is a threshold value that does not take into account the spatial patterns of SOC recorded in this study. Even though in this study, the SOC content of legacy soil samples from the 2010s had increased from those amounts recorded in 1990s (by 14.5%) the values were below the threshold SOC value. Establishing a threshold SOC value for Dinajpur needs to take into account contextual differences and be tailored to the conditions of the region in order to be realistic and achievable for smallholder farmers.
Land inundation has a greater influence on SOC content compared with physiography but as shown the two factors are related to each other. SOC increases over time in the land types along the following order: HL > MHL > MLL (Figure 5). Saha [39] and Xie [24] reported higher SOC in lower landscape positions than the surrounding upland positions. Fundamental soil processes such as erosion, runoff and deposition in land types in a landscape to another could also contribute to changes in SOC contents [42]. The steeper the slope the more soil is likely to be lost due to erosion and deposited further down the slope. MHL and MLL receive run-on from higher parts of surrounding land compared with the HL, especially HL located in Piedmont physiography. The consequence of steeper landscape position is therefore potentially responsible for the higher amount of sediments with organic materials being deposited in MHL and MLL. Hence, SOC content is higher in sediment settling and depositional areas relative to the upland area in a landscape [43]. However, in this study, we have also reported similar levels of SOC content across the land types within a physiographic type with the exception of MLL where SOC content decreased by 40.9% from 1990s levels in Floodplain soils. The decrease of SOC content in MLL could be potentially linked to single cropping practice, longer fallow period and less crop residue incorporation but would require a detailed record of land management, as well as a cycle of erosion/deposition events to be more definitive of the reasons. Although the influence of landscape might not be straightforward because landscape position on the dynamics of SOC involves a combination of processes. These processes include separation of soil aggregates, variability in sediment removal during runoff, re-distribution of mobilized organic materials and the deposition of carbon-rich materials in settling sites of a landscape [42,44]. The state of mineralization is another important factor that governs these processes if inundation is shortened (i.e., lands under shorter seasonal flooding). Mineralization rates would likely be faster due to an accelerated rate of decomposition and more intensive tillage [22]. Thus, it is likely that at the landscape scale, there would be variability of SOC due to land types over time. It is a matter of further study to determine the variability of SOC due to differences in land type, cropping intensity and management, hence it requires SOC quantification at field-scale of 1:5000 rather than 1:50,000.

4.2. Potential Influence of Cropping Intensity on SOC over Time

The green revolution was well-established in Bangladesh by the 1990s, which underpinned more intensive agriculture with dry and wet season rice and other rotational crops. This form of intensive agriculture is supported by the increasing use of agrochemicals, hybrid crop varieties and irrigation [45]. These changes have resulted in increased cropping intensity over the past two decades (Figure 10). The national average cropping intensity is 192%, whilst the study area is the most intensively cultivated agricultural ecotone with an average cropping intensity of 226% [31]. The trend of increasing cropping intensity has evolved over time with certain land types and farmers’ preferences. This means that HL is more intensively cultivated because it is less vulnerable to inundation (i.e., seasonal flooding) compared with MHL cropping area. Likewise, MHL is intensively cultivated compared with MLL cropping area. Therefore, these land types (HL, MHL) are subject to intensive tillage where farmers practice triple and double cropping respectively compared with MLL that is single cropped. MLL is subject to frequent seasonal flooding during the monsoon season as located in lower parts of the landscape. Therefore, the cropping intensity was low (i.e., usually one wetland crop/year) in the MLL. Hence, cropping intensity across the land types increases in the following order: MLL (single crop) < MHL (double cropping) < HL (triple cropping). In this study, we have reported that SOC is higher in MLL (12.0 g/kg) than MHL (10.5 g/kg) and HL (8.7 g/kg) in Floodplain soils of the 2010s (Figure 5 and Table S1). These amounts of SOC might be attributed to the combined effects of land types and associated cropping intensities. These findings were consistent with Ritchie [43] and Fertilizer Recommendation Guide [33], who reported that land types in a landscape affect SOC content, as in lower parts of landscape it was likely more for fine soil particles to be deposited over time. Higher tillage and relatively short inundation in HL and MHL may result in faster mineralization of plant materials and crop residues in tropical agroecosystems [8,40,43]. Hence, these results indicated lower SOC contents in higher cropping intensity areas (i.e., MHL and HL) than less intensively cultivated lowland areas (MLL). In addition, due to intensive cropping throughout a year, time between crops is becoming shorter and repeated inversion tillage resulting in limited natural recovery of plant available nutrients. This change in land cultivation might be affecting the fertility and productivity of these soils. The conventional practice, fertilization, limited use of organic manure and residue retention (mainly limited to root biomass) might be influencing SOC and soil pH dynamics in RBCS. However, the legacy datasets were unable to quantify the effect of these management-related factors on the SOC contents due to the scale of data collection and lack of land management data for soil samples.

4.3. Soil pH as Affected by Physiography, Land Type and Agriculture Intensification over Time

The spatial pattern of soil pH indicated that the level of soil pH was lower (i.e., more acidic condition) in the Piedmont plain and Terrace than the Floodplain physiography (Figure 6 and Table S2). Likewise, the temporal pattern of soil pH levels indicated that pH decreased by 0.5 units from 5.5 in the 1990s to approximately 5.0 in the 2010s in all physiography with associated land types (Table S2). Hence the dominant soil pH category shifted from slightly acidic (5.5 to 6.5) to strongly acidic (4.6–5.5) in 20 years (Figure 9). Therefore, it indicates a significant shift in the soil pH towards more acidic conditions. This shift in soil pH could cause increase in toxic cations (i.e., Al, Mn) and reduced phosphorus availability in soils and rise in yield constraints. However, these results are consistent with other studies in soils under intensive agriculture [4,11,16] and could well be related to increased use of N fertilizer as part of agricultural intensification in the past 20 years. Information related to site-specific management and agricultural intensification is not available with legacy data, although since the 1990s, agriculture has been intensified conventionally with sole dependence on chemical fertilizers and little addition of organic manures. The gross use of synthetic fertilizers such as N, P, K, S increased from 1731 to 4095 thousand metric tons per annum, resulting in 237% increase from the year 1990 to 2015 in Bangladesh [31]. The cropping and fertilizer intensification over the last 29 years (Figure 10) may explain the observed temporal trend of soil pH during the study period. However, the inherent soil characteristics of the physiographic types might also be important in potentially contributing to soil pH stability and changes. Agricultural intensification and increased fertilization were reported elsewhere to have a definite influence on accelerated soil acidification due to mainly nitrogen and ammonia-based fertilizer application [20]. The use of synthetic fertilizers has become a common practice to meet demands for higher yields in Bangladesh. Consequently, farmers mostly practice unbalanced fertilization in agricultural fields and the provision of soil test-based fertilizer recommendation is limited in Bangladesh [46]. Though it is unclear with legacy date due to lack of land management information, whether the increase amount of fertilizer and/or unbalanced fertilization is responsible for soil acidification. Nevertheless, these changes in soil management could have contributed to soil acidification, which is a prominent constraint for highland crops, e.g., potato, maize, wheat and vegetable in the Piedmont plain and Terrace, as the productivity of highland crops are likely to be affected more by soil acidification than wetland paddy cultivation in the Floodplain soils.

4.4. Temporal Variation of Temperature and Rainfall in Dinajpur

The period between soil samples spanned 20 years, during this time there were fluctuations in temperature and rainfall, but the trend line of those fluctuations would not be the order of magnitude required to significantly alter geomorphic processes, although there could be an increase in frequency of storm events or lengthening of dry periods. A study examined climatic data from 1981 to 2016 reported the mean annual temperature declined by 0.017 ℃/year, while for rainfall the mean annual reduction was 11 mm/year, and no change in thunderstorms frequency in Dinajpur [47]. The mean annual reduction in rainfall would lead to more dry days and longer periods of drought, which in turn would affect SOC content and soil pH in the study area. However, due to the annual trends of temperature and rainfall being very slight to what extent the SOC content under the land types would be impacted requires further study involving the climate variables over a longer period.

5. Conclusions

The spatial and temporal trend in the contents of SOC derived from legacy datasets of the 1990s and 2010s identified that in general SOC contents was influenced by both physiography and land inundation type, and that the magnitude and direction of the temporal changes in SOC contents also depended on physiology and land type. The effect of land type is greater on SOC than physiography. Despite the overall increase of 14.5% in SOC contents in 20 years, we identified one area, MLL under the Floodplain physiography, to be the most vulnerable area for SOC losses, as it had a sharp decline (40.9%) in SOC contents over the 20 years. The decline of SOC in MLL could be related to lower soil carbon inputs from single cropping, greater periods of fallow and less crop residue retained but such detailed land management information was not available from legacy data to allow such conclusions to be drawn. Nevertheless, MLL constituted a small area (5%) of the landscape. However, in the 1990s, the high SOC contents (20.3 g/kg) of MLL in the Floodplain physiography indicates that this area has a better prospect for greater storage of SOC through management practices matched to specified land type. Furthermore, there was a small but significant increase in SOC contents in HL and MHL of the Floodplain and HL of the Terrace over the 20 years. With the legacy datasets, it is imprecise whether field-scale variation of SOC contents is more responsive due to variations in cropping systems and management as information on these factors were not collected in the legacy data. However, identifying what factors have contributed to this increase in SOC contents will ensure that this increasing trend will continue and reach the optimal SOC contents that can maintain agricultural productivity in these areas.
The dominant trend observed in soil pH datasets was a 0.5 unit decline in soil pH that was consistent across the physiography and land type. The number of soil samples falling within the strongly acidic pH range (4.5–5.5) during 2010s was found to be higher (by 50%) than the number of slightly acidic (5.5–6.5) soil samples during 1990s. This indicates that soil acidification is increasing over time, which is likely to impact highland crops of the Piedmont plain and Terrace more so than wetland paddy in the Floodplain soils. The decrease in soil pH could be linked to a higher rate of fertilizer application, due to more crops being planted per unit of area. It is therefore essential to optimize fertilizer application depending annual cropping practice and soil testing. The inclusion of organic manure and soil amendment is also essential to balance soil pH. This would help farmers to reduce and control soil acidification by optimizing fertilizer rates, so that land degradation could be avoided and the productivity of RBCS would be maintained in future.
This study provides valuable information on the trends in SOC and pH levels at the regional level in Bangladesh. Soil legacy data enables the assessment of soil quality change over time, but this baseline legacy information requires careful interpretation to initiate and facilitate decision-making in soil fertility management at field-scale. Therefore, further investigation is warranted to understand SOC dynamics and soil pH at a field-scale, focusing on different cropping systems and cropping intensity (i.e., single/double/triple cropping), land management, crop residue management and crop choice by the smallholder farmers. Field-scale knowledge will be crucial in developing an effective management strategy to avoid land degradation and further soil acidification and to ensure the sustainability of agricultural production in Bangladesh.

Supplementary Materials

The following are available online at https://www.mdpi.com/2073-4395/11/1/59/s1, Table S1: SOC exploratory statistics of the physiographic types and inundation land types (highland = HL, medium highland = MHL, medium lowland = MLL), Table S2: Soil pH exploratory statistics of the physiographic types and inundation land types (highland = HL, medium highland = MHL, medium lowland = MLL).

Author Contributions

Conceptualization: M.N.E.A.S., L.L.d.B., C.N.G. and Y.O.; methodology, M.N.E.A.S.; software, M.N.E.A.S.; formal analysis, M.N.E.A.S.; investigation, M.N.E.A.S.; resources, L.L.d.B.; data curation, M.N.E.A.S.; writing—original draft preparation, M.N.E.A.S.; writing—review and editing, L.L.d.B., Y.O. and C.N.G.; visualization, M.N.E.A.S.; supervision, L.L.d.B., C.N.G. and Y.O.; project administration, L.L.d.B.; funding acquisition, L.L.d.B. All authors have read and agreed to the published version of the manuscript.

Funding

This study was funded by a postgraduate international scholarship awarded to the first author for a PhD from the University of New England, Australia.

Acknowledgments

We are thankful to the Soil Resource Development Institute, Bangladesh for providing the soil legacy data.

Conflicts of Interest

The authors declare no conflict of interest.

References

  1. Yang, T.; Siddique, K.H.M.; Liu, K. Cropping systems in agriculture and their impact on soil health-A review. Glob. Ecol. Conserv. 2020, 23, e01118. [Google Scholar] [CrossRef]
  2. Kumar, V.; Jat, H.S.; Sharma, P.C.; Balwinder, S.; Gathala, M.K.; Malik, R.K.; Kamboj, B.R.; Yadav, A.K.; Ladha, J.K.; Raman, A.; et al. Can productivity and profitability be enhanced in intensively managed cereal systems while reducing the environmental footprint of production? Assessing sustainable intensification options in the breadbasket of India. Agric. Ecosyst. Environ. 2018, 252, 132–147. [Google Scholar] [CrossRef] [PubMed]
  3. Liu, X.; Shi, H.; Bai, Z.; Liu, X.; Yang, B.; Yan, D. Assessing soil acidification of croplands in the poyang lake basin of China from 2012 to 2018. Sustainability 2020, 12, 3072. [Google Scholar] [CrossRef]
  4. Ou, Y.; Rousseau, A.N.; Wang, L.; Yan, B. Spatio-temporal patterns of soil organic carbon and pH in relation to environmental factors—A case study of the Black Soil Region of Northeastern China. Agric. Ecosyst. Environ. 2017, 245, 22–31. [Google Scholar] [CrossRef]
  5. Minasny, B.; Hong, S.Y.; Hartemink, A.E.; Kim, Y.H.; Kang, S.S. Soil pH increase under paddy in South Korea between 2000 and 2012. Agric. Ecosyst. Environ. 2016, 221, 205–213. [Google Scholar] [CrossRef]
  6. Marchant, B.P.; Crawford, D.M.; Robinson, N.J. What can legacy datasets tell us about soil quality trends? Soil acidity in Victoria. IOP Conf. Ser. Earth Environ. Sci. 2015, 25, 012015. [Google Scholar] [CrossRef]
  7. Guo, X.; Li, H.; Yu, H.; Li, W.; Ye, Y.; Biswas, A. Drivers of spatio-temporal changes in paddy soil pH in Jiangxi Province, China from 1980 to 2010. Sci. Rep. 2018, 8, 2702. [Google Scholar] [CrossRef]
  8. Uddin, M.J.; Hooda, P.S.; Mohiuddin, A.S.M.; Smith, M.; Waller, M. Land inundation and cropping intensity influences on organic carbon in the agricultural soils of Bangladesh. Catena 2019, 178, 11–19. [Google Scholar] [CrossRef] [Green Version]
  9. Li, M.; Zhang, X.; Pang, G.; Han, F. The estimation of soil organic carbon distribution and storage in a small catchment area of the Loess Plateau. Catena 2013, 101, 11–16. [Google Scholar] [CrossRef]
  10. Telo da Gama, J.; Rato Nunes, J.; Loures, L.; Lopez Piñeiro, A.; Vivas, P. Assessing spatial and temporal variability for some edaphic characteristics of mediterranean rainfed and irrigated soils. Agronomy 2019, 9, 132. [Google Scholar] [CrossRef] [Green Version]
  11. Zhang, M.K.; Chang, Y.C. Changing characteristics of organic matter and pH of cultivated soils in Zhejiang province over the last 50 years. Huan Jing Ke Xue 2013, 34, 4399–4404. [Google Scholar] [PubMed]
  12. Qi, L.; Wang, S.; Zhuang, Q.; Yang, Z.; Bai, S.; Jin, X.; Lei, G. Spatial-temporal changes in soil organic carbon and pH in the liaoning province of China: A modeling analysis based on observational data. Sustainability 2019, 11, 3569. [Google Scholar] [CrossRef] [Green Version]
  13. Kiani, M.; Hernandez-Ramirez, G.; Quideau, S.; Smith, E.; Janzen, H.; Larney, F.J.; Puurveen, D. Quantifying sensitive soil quality indicators across contrasting long-term land management systems: Crop rotations and nutrient regimes. Agric. Ecosyst. Environ. 2017, 248, 123–135. [Google Scholar] [CrossRef]
  14. Lal, R. Soil carbon sequestration impacts on global climate change and food security. Science 2004, 304, 1623–1627. [Google Scholar] [CrossRef] [Green Version]
  15. Lal, R. Soil carbon sequestration to mitigate climate change. Geoderma 2004, 123, 1–22. [Google Scholar] [CrossRef]
  16. Guo, J.H.; Liu, X.J.; Zhang, Y.; Shen, J.L.; Han, W.X.; Zhang, W.F.; Christie, P.; Goulding, K.W.; Vitousek, P.M.; Zhang, F.S. Significant acidification in major Chinese croplands. Science 2010, 327, 1008–1010. [Google Scholar] [CrossRef] [Green Version]
  17. Haynes, R.J.; Naidu, R. Influence of lime, fertilizer and manure applications on soil organic matter content and soil physical conditions: A review. Nutr. Cycl. Agroecosyst. 1998, 51, 123–137. [Google Scholar] [CrossRef]
  18. Chadwick, O.A.; Chorover, J. The chemistry of pedogenic thresholds. Geoderma 2001, 100, 321–353. [Google Scholar] [CrossRef]
  19. Sultana, B.M.M.; Jahiruddin, M.; Rahman, M.M.; Siddique, M.N.E.; Sultana, J. Liming and soil amendments for acidity regulation and nutrients uptake by potato-mungbean-rice cropping pattern in the old himalayan piedmont plain. AJAHR 2019, 3, 1–15. [Google Scholar] [CrossRef] [Green Version]
  20. Tian, D.; Niu, S. A global analysis of soil acidification caused by nitrogen addition. Environ. Res. Lett. 2015, 10, 024019. [Google Scholar] [CrossRef]
  21. Ghimire, R.; Lamichhane, S.; Acharya, B.S.; Bista, P.; Sainju, U.M. Tillage, crop residue, and nutrient management effects on soil organic carbon in rice-based cropping systems: A review. J. Integr. Agric. 2017, 16, 1–15. [Google Scholar] [CrossRef]
  22. Lal, R. Soil carbon sequestration in China through agricultural intensification, and restoration of degraded and desertified ecosystems. Land Degrad. Dev. 2002, 13, 469–478. [Google Scholar] [CrossRef]
  23. Song, G.; Li, L.; Pan, G.; Zhang, Q. Topsoil organic carbon storage of China and its loss by cultivation. Biogeochemistry 2005, 74, 47–62. [Google Scholar] [CrossRef]
  24. Xie, Z.; Zhu, J.; Liu, G.; Cadisch, G.; Hasegawa, T.; Chen, C.; Sun, H.; Tang, H.; Zeng, Q. Soil organic carbon stocks in China and changes from 1980s to 2000s. Glob. Chang. Biol. 2007, 13, 1989–2007. [Google Scholar] [CrossRef]
  25. Hossain, M.A.S.; Siddique, M.N.A. Online fertilizer recommendation system (OFRS): A step towards precision agriculture and optimized fertilizer usage by smallholder farmers in Bangladesh. EJGEO 2020, 1, 1–9. [Google Scholar] [CrossRef]
  26. Chen, S.; Arrouays, D.; Angers, D.A.; Martin, M.P.; Walter, C. Soil carbon stocks under different land uses and the applicability of the soil carbon saturation concept. Soil Tillage Res. 2019, 188, 53–58. [Google Scholar] [CrossRef]
  27. Lehmann, A.; Stahr, K. The potential of soil functions and planner-oriented soil evaluation to achieve sustainable land use. J. Soils Sediments 2010, 10, 1092–1102. [Google Scholar] [CrossRef]
  28. Wiesmeier, M.; Urbanski, L.; Hobley, E.; Lang, B.; von Lützow, M.; Marin-Spiotta, E.; van Wesemael, B.; Rabot, E.; Ließ, M.; Garcia-Franco, N.; et al. Soil organic carbon storage as a key function of soils-A review of drivers and indicators at various scales. Geoderma 2019, 333, 149–162. [Google Scholar] [CrossRef]
  29. Skinner, R.J.; Todd, A.D. Twenty-five years of monitoring pH and nutrient status of soils in England and Wales. Soil Use Manag. 1998, 14, 162–169. [Google Scholar] [CrossRef]
  30. Bangladesh Bureau of Statistics (BBS). Zila Statistics 2011; Bangladesh Bureau of Statistics (BBS): Dhaka, Bangladesh, 2011. [Google Scholar]
  31. Bangladesh Bureau of Statistics (BBS). Agricultural Yearbook 2015; Bangladesh Bureau of Statistics: Dhaka, Bangladesh, 2015. [Google Scholar]
  32. Huq, S.I.S.; Shoaib, J.M. The Soils of Bangladesh; Springer: Berlin/Heidelberg, Germany, 2016. [Google Scholar]
  33. Hassan, A.A.; Jahiruddin, M.; Shamsun, N.; Jalal, U.S.; Abdul, L.S.; Monowar, K.K.; Bokhtiar, S.M.; Quddus, A.; Nazmul, H.; Sultana, R.; et al. FRG. Fertilizer Recommendation Guide; Bangladesh Agricultural Research Council: Dhaka, Bangladesh, 2012. [Google Scholar]
  34. Jackson, M.L. Soil Chemical Analysis; Prentice Hall Inc: Englewood Cliffs, NJ, USA, 1976. [Google Scholar]
  35. Hounkpatin, K.O.L.; Schmidt, K.; Stumpf, F.; Forkuor, G.; Behrens, T.; Scholten, T.; Amelung, W.; Welp, G. Predicting reference soil groups using legacy data: A data pruning and Random Forest approach for tropical environment (Dano catchment, Burkina Faso). Sci. Rep. 2018, 8, 9959. [Google Scholar] [CrossRef]
  36. DAO—District Agriculture Office, Dinajpur. Cropping Intensity and Fertilizer Data of Dinajpur District; Departmnet of Agriculture Extension: Khamarbari, Dinajpur, 2019; p. 5200. [Google Scholar]
  37. Brammer, H. The Geography of the Soils of Bangladesh; The University Press Limited: Dhaka, Bangladesh, 1996. [Google Scholar]
  38. Hossain, M.B. SPGR Sub-Project Completion Report. In Coordinated Sub-Project on Carbon Sequestration in Soils of Bangladesh (BINA Component); Soil Science Division Bangladesh Institute of Nuclear Agriculture: Mymensingh, Bangladesh, 2014; pp. 1–50. [Google Scholar]
  39. Saha, P.R.; Khatun, M.; Hossain, A.; Saleque, M. Bangladesh journal of agricultural research. Assess. Soil Carbon Stock Some Sel. Agroecol. Zones Bangladesh 2013, 38, 625–635. [Google Scholar]
  40. Chaplot, V.; Cooper, M. Soil aggregate stability to predict organic carbon outputs from soils. Geoderma 2015, 243, 205–213. [Google Scholar] [CrossRef]
  41. Musinguzi, P.; Tenywa, J.S.; Ebanyat, P.; Tenywa, M.M.; Mubiru, D.N.; Basamba, T.A.; Leip, A. Soil organic carbon thresholds and nitrogen management in tropical agroecosystems: Concepts and prospects. J. Sustain. Dev. 2013, 6. [Google Scholar] [CrossRef]
  42. Lal, R. Soil erosion and the global carbon budget. Environ. Int. 2003, 29, 437–450. [Google Scholar] [CrossRef]
  43. Ritchie, J.C.; McCarty, G.W.; Venteris, E.R.; Kaspar, T.C. Soil and soil organic carbon redistribution on the landscape. Geomorphology 2007, 89, 163–171. [Google Scholar] [CrossRef]
  44. Quinton, J.N.; Govers, G.; van Oost, K.; Bardgett, R.D. The impact of agricultural soil erosion on biogeochemical cycling. Nat. Geosci. 2010, 3, 311–314. [Google Scholar] [CrossRef] [Green Version]
  45. Rahman, S. Six decades of agricultural land use change in Bangladesh: Effects on crop diversity, productivity, food availability and the environment, 1948–2006. Singap. J. Trop. Geogr. 2010, 31, 254–269. [Google Scholar] [CrossRef] [Green Version]
  46. Sultana, J.; Siddique, M.; Abdullah, M. Fertilizer recommendation for agriculture: Practice, practicalities and adaptation in Bangladesh and The Netherlands. Int. J. Bus. Manag. Soc. Res. 2015, 1, 21–40. [Google Scholar] [CrossRef]
  47. Karmakar, S. Patterns of climate change and its impact in northwestern Bangladesh. J. Eng. Sci. 2019, 10, 33–48. [Google Scholar]
Figure 1. Location and soil physiography of Dinajpur, Northwestern Bangladesh, with those physiographic types examined bolded in the legend.
Agronomy 11 00059 g001
Figure 2. The main effect of land type (highland = HL, medium highland = MHL, medium lowland = MLL) on SOC contents (0–15 cm) in the Floodplain, Piedmont plain and Terrace physiography.
Agronomy 11 00059 g002
Figure 3. The effect of soil sample collection period (1990s, 2010s) on SOC contents (0–15 cm) in the Floodplain, Piedmont plain and Terrace physiography.
Agronomy 11 00059 g003
Figure 4. The effect of soil sample collection period (1990s, 2010s) on SOC contents (0–15 cm) in the land types (highland = HL, medium highland = MHL, medium lowland = MLL).
Agronomy 11 00059 g004
Figure 5. Soil organic carbon (SOC) contents (0–15 cm) across land types sampled in 1990s and 2010s in the (A) Piedmont plain, (B) Floodplain and (C) Terrace physiography. The error bars represent respective standard errors. The significant difference is indicated by ‘*’ and non-significant difference is indicated by ‘ns’ sign.
Agronomy 11 00059 g005
Figure 6. The main effect of land type (highland = HL, medium highland = MHL, medium lowland = MLL) on soil pH (0–15 cm) in the Floodplain, Piedmont plain and Terrace physiography.
Agronomy 11 00059 g006
Figure 7. The effect of soil sampling collection periods (1990s, 2010s) on soil pH (0–15 cm) in the Piedmont plain, Floodplain and Terrace physiography.
Agronomy 11 00059 g007
Figure 8. Soil pH (0–15 cm) across land types sampled in 1990s and 2010s in the (A) Piedmont plain, (B) Floodplain and (C) Terrace physiography. The error bars represent respective standard errors. The significant difference is indicated by ”*“ sign.
Agronomy 11 00059 g008
Figure 9. Percentage of soil pH (0–15 cm) category in legacy soil samples collected in the 1990s and 2010s in three physiography. The legend consists of the pH categories [33] in Bangladesh.
Agronomy 11 00059 g009
Figure 10. Trend of cropping intensity (%) and fertilizers (kg/ha) from 1990 to 2019 [31,36] in Dinajpur district, Bangladesh.
Agronomy 11 00059 g010
Table 1. Three-way partial factorial model for the main and interactive effects of year, physiography and land type on SOC contents between two data collection periods: 1990s and 2010s.
VariablesdfSOC
FP
Spatial
Physiography22.480.084ns
Land type277.300.000 ***
Physiography: Land type25.610.004 **
Temporal
Year (1990s, 2010s)175.000.000 ***
Year: Physiography24.540.011 *
Year: Land type215.580.000 ***
Year: Physiography: Land type20.830.435ns
df = degrees of freedom; F = F ratios; P = probabilities. Significance codes: p < 0 ‘***’, 0.001 ‘**’, 0.01 ‘*’, >0.05 ‘ns’.
Table 2. Three-way partial factorial model for the main and interactive effects of year, physiography and land types on soil pH between two data collection periods: 1990s and 2010s.
Variables pH
dfFP
Spatial
Physiography225.630.000 ***
Land type24.950.007 **
Physiography: Land type25.010.007 **
Temporal
Year (1990s, 2010s)1128.310.000 ***
Year: Physiography24.610.010 *
Year: Land type20.480.618ns
Year: Physiography: Land type20.470.628ns
df = degrees of freedom; F = F ratios; P = probabilities. Significance codes: p < 0 ‘***’, 0.001 ‘**’, 0.01 ‘*’, >0.05 ‘ns’.
Publisher’s Note: MDPI stays neutral with regard to jurisdictional claims in published maps and institutional affiliations.

