Article

Genome-Wide Identification, Characterization, and Expression Analyses of P-Type ATPase Superfamily Genes in Soybean

1
College of Life and Environmental Sciences, Hangzhou Normal University, Hangzhou 311121, China
2
Institute of Industrial Crops, Jiangsu Academy of Agricultural Sciences, Nanjing 210014, China
3
Department of Biochemistry and Molecular Biology, College of Life Science, Nanjing Agricultural University, Nanjing 210095, China
4
College of Resources and Environmental Sciences, Nanjing Agricultural University, Nanjing 210095, China
*
Authors to whom correspondence should be addressed.
Agronomy 2021, 11(1), 71; https://doi.org/10.3390/agronomy11010071
Submission received: 13 November 2020 / Revised: 23 December 2020 / Accepted: 29 December 2020 / Published: 31 December 2020
(This article belongs to the Section Crop Breeding and Genetics)

Abstract

:
P-type ATPases are transmembrane pumps of cations and phospholipids. They are energized by hydrolysis of ATP and play important roles in a wide range of fundamental cellular and physiological processes during plant growth and development. However, the P-type ATPase superfamily genes have not been characterized in soybean. Here, we performed genome-wide bioinformatic and expression analyses of the P-type ATPase superfamily genes in order to explore the potential functions of P-type ATPases in soybean. A total of 105 putative P-type ATPase genes were identified in the soybean genome. Phylogenetic relationship analysis of the P-type ATPase genes indicated that they can be divided into five subfamilies including P1B, P2A/B, P3A, P4 and P5. Proteins belonging to the same subfamily shared conserved domains. Forty-seven gene pairs were related to segmental duplication, which contributed to the expansion of the P-type ATPase genes during the evolution of soybean. Most of the P-type ATPase genes contained hormonal- and/or stress-related cis-elements in their promoter regions. Expression analysis by retrieving RNA-sequencing datasets suggested that almost all of the P-type ATPase genes could be detected in soybean tissues, and some genes showed tissue-specific expression patterns. Nearly half of the P-type ATPase genes were found to be significantly induced or repressed under stresses like salt, drought, cold, flooding, and/or phosphate starvation. Four genes were significantly affected by rhizobia inoculation in root hairs. The induction of two P2B-ATPase genes, GmACA1 and GmACA2, by phosphate starvation was confirmed by quantitative RT-PCR. This study provides information for understanding the evolution and biological functions of the P-type ATPase superfamily genes in soybean.

1. Introduction

The P-type ATPases are cation and lipid pumps energized by hydrolysis of ATP. They were named P-type ATPases because they form a phosphorylated (hence P-type) reaction cycle intermediate during catalysis [1]. The ATP hydrolyzing machinery of P-type ATPases consists of three interconnected cytoplasmic domains: the phosphorylation (P), nucleotide binding (N), and actuator (A) domain. A conserved sequence motif, DKTGT, is contained in the P domain of P-type ATPases, where the Asp (D) residue is phosphorylated during catalysis [1]. The P-type ATPases form a large superfamily that can be divided into five distinct evolutionarily related subfamilies, P1–P5. Each of the subfamilies can be further divided into subgroups [2,3]. The major subgroups of P-type ATPases include P1A-ATPases (part of bacterial K+ transport system), P1B-ATPases (heavy metal pumps), P2A-ATPases (Ca2+ pumps), P2B-ATPases (Ca2+ pumps), P2C-ATPases (Na+/K+ and H+/K+ pumps of animals), P2D-ATPases (Na+ pumps of fungi), P3A-ATPases (H+ pumps), P4-ATPases (phospholipid pumps), and P5-ATPases (the substrate of P5-ATPases is still unclear) [1,4,5]. The P-type ATPases play critical roles in a wide range of fundamental cellular processes, such as generating and maintaining the electrochemical gradient that is used as the driving force for secondary transporters (H+-ATPases in plants and fungi and Na+/K+-ATPases in animals), calcium signaling (Ca2+-ATPases), the transport of essential micronutrients (heavy metal-ATPases), and the generation of membrane phospholipid asymmetry [6,7,8,9,10].
The subfamilies of P1B-, P2A-, P2B-, P3A-, P4-, and P5-ATPases have been found to exist in higher plants, while the genes of P1A, P2C, and P2D subfamilies are absent [3,11,12]. In Arabidopsis (Arabidopsis thaliana L.), a total of 47 P-type ATPase genes have been identified, including eifht P1B, four P2A, eleven P2B, eleven P3A, twelve P4, and one P5 gene(s) [11,12,13]. In rice (Oryza sativa L.), a total of 45 P-type ATPase genes have been identified, including nine P1B, three P2A, twelve P2B, ten P3A, ten P4, and one P5 gene(s) [11,13]. P1B-ATPase is a subfamily of P-type ATPases. It is also named as heavy metal ATPase (HMA). HMAs are divided into two groups based on their substrate specificity: Cu/Ag transporters (Cu+-ATPases) and Zn/Cd/Co/Pb transporters (Zn2+-ATPases) [14,15]. In addition to the conserved domains of P-type ATPases, HMAs typically possess six to eight transmembrane domains, an HP locus, a CPx/SPC motif, and putative metal-binding domains in the N- and/or C-terminal regions [9]. HMAs mainly function in the transport of metal cations (e.g., Cu+, Cu2+, Ag+, Zn2+, Co2+, Cd2+, and Pb2+) across biological membranes in a wide range of organisms [9,16,17]. P1B-ATPases in Arabidopsis and rice have been divided into six groups [9,11]. Arabidopsis AtHMA1–4 have been suggested to be Zn2+-ATPases, while AtHMA5–8 have been suggested to be Cu+-ATPases [9,17,18]. Rice OsHMA1–3 belong to the Zn2+-ATPase group, while OsHMA4–9 have been indicated to belong to the Cu+-ATPase group [16,19,20].
P2-ATPases in plants, which are also named Ca2+ pumps, are divided into two subgroups: P2A (ER-type Ca2+-ATPases, ECAs) and P2B (autoinhibited Ca2+-ATPases, ACAs) [8,21]. Both ECAs and ACAs contain all the characteristic motifs of P-type ATPases and of the P2 subfamily ATPases, such as the highly conserved sequence DKTGT, the PEGL motif playing a critical role in energy transduction, and the KGAXE sequence involved in nucleotide binding [8,11,21]. ACAs contain an N-terminal autoinhibitory domain that binds to calmodulin and activates the Ca2+ pump [22,23]. Plant P-type ATPases are implicated in Ca2+ signaling and Ca2+ homeostasis by pumping Ca2+ from the cytoplasm into intracellular compartments or into the apoplast [8,21]. Plant P2-ATPases are involved in many cellular and physiological processes, such as pollen tube growth, and abiotic and biotic stress tolerance [21,24,25,26,27].
The P3A-ATPases are plasma membrane (PM) H+-ATPases, which are universal electrogenic H+ pumps hydrolyzing ATP to pump H+ out of the cytosol from fungi to vascular plants [28,29]. The PM H+-ATPase is a functional monomer with a molecular weight about 100 kDa that can oligomerize to form dimeric and hexameric complexes [30]. The PM H+-ATPases have N- and C-terminal segments protruding into the cytoplasm, and ten transmembrane segments [28]. Generally, the C-terminal region of the PM H+-ATPase consisting of approximately 100 amino acids is known as an autoinhibitory domain keeping the H+-ATPase in a low-activity state via an interaction with the catalytic domain under normal conditions [28]. The phosphorylation of the penultimate Thr and subsequent binding of the 14-3-3 protein to the phosphorylated penultimate Thr results in the activation of H+-ATPase [31,32]. All 12 PM H+-ATPase gene members in Arabidopsis (AHA1–AHA12), 10 members in rice (OSA1–OSA10), and 12 members in sorghum (Sorghum bicolor L.) have been classified into five subfamilies [11,29,33]. By generating an H+ electrochemical gradient, maintaining intracellular pH homeostasis, and providing driving force for the active influx and efflux of ions and metabolites across the PM, PM H+-ATPases have been indicated to be involved in many important physiological processes during plant growth and development, such as nutrient uptake and transportation, stomatal movement, cell elongation, and environmental stress tolerance [6,7,28,30,34,35,36].
The P4-ATPases, also known as phospholipid flippases, are unique to eukaryotic organisms. They are present in the plasma membrane and membranes of the secretory pathway to generate phospholipid asymmetry, which is required for vesicle budding and fusion in the secretory pathway [4,37]. A characteristic feature of the P4-ATPase subfamily proteins is the high frequency of hydrophobic or aromatic residues within those transmembrane domains that are commonly involved in cation transport in other P-type ATPases [4]. Mutation of some of these residues causes changes in lipid specificity, but none of these residues seem to be involved in direct lipid binding [37,38]. There are 12 P4-ATPase subfamily proteins in Arabidopsis, designated as Aminophospholipid ATPase1 (ALA1) to ALA12 [12]. Ten ALA proteins were identified in rice [11]. Some Arabidopsis ALA proteins have been characterized to be phospholipid flippases and have diverse physiological functions [37]. For example, AtALA1 is involved in chilling tolerance [39]; AtALA3 is a broad-specificity phospholipid flippase localized in the Golgi apparatus, where it contributes to the formation of secretory vesicles [10]; AtALA10 transports up to six different phospholipids, including sphingomyelin, a ceramide-derived phospholipid [40]. In contrast to the well-known cation transporters of the P-type ATPases, the substrate of P5 ATPases is still unclear [5]. In both Arabidopsis and rice, there is only one P5 ATPase gene [11]. In addition to model plants Arabidopsis and rice, genes encoding P-type ATPase proteins have been identified at the whole-genome scale in some other plants [41,42].
Soybean is an important economic crop providing oil- and protein-rich food for humans around the world. The genome sequence of a cultivated soybean developed in the 1980s (Glycine max L. var. Williams 82) has been released ten years ago [43]. The reference genome has opened the door for soybean functional genomics [44,45]. The entire P-type ATPase superfamily in the whole genome of soybean has not been identified, and its roles in developmental regulation and environmental stress tolerance are largely unknown. In this study, we carried out a genome-wide search and characterized and analyzed all the putative P-type ATPase genes in the soybean genome. RNA-sequencing and microarray data were used to analyze their expression patterns in different tissues of soybean and their transcriptional responses to environmental stresses and rhizobia infection. Quantitative reverse-transcription polymerase chain reaction (qRT-PCR) was used to validate the expression of two genes in response to phosphorus deficiency. These results provide useful information for further functional studies on P-type ATPase genes and their possible roles in stress tolerance, nutrient utilization, and symbiosis.

2. Materials and Methods

2.1. Identification and Annotation of P-Type ATPase Genes in the Soybean Genome

Proteins encoding putative P-type ATPase proteins in the soybean genome were identified by searching the soybean genome database SoyBase (https://www.soybase.org/) by BLASTP with the representative P-type ATPase proteins (including all five subfamilies of P-type ATPases, P1B, P2A/B, P3A, P4, and P5) from Arabidopsis and rice. The default settings were used. The nucleotide and protein sequences were obtained from the SoyBase website (https://www.soybase.org/). Protein domains were analyzed by using HMMScan (https://www.ebi.ac.uk/Tools/hmmer/search/hmmscan) [46] and the InterPro database (http://www.ebi.ac.uk/interpro/) [47]. The TMHMM2.0 program (http://www.cbs.dtu.dk/services/TMHMM/) was used to predict transmembrane helices [48]. Proteins that do not contain the characteristic domains and motifs of the P-type ATPase subfamilies were eliminated. Putative genes encoding P-type ATPase proteins were named according to their orthologues in Arabidopsis and their positions in the phylogenetic trees.

2.2. Phylogenetic Tree Construction and Chromosome Distribution

The full-length amino acid sequences of P-type ATPase proteins from soybean, Arabidopsis, and rice were retrieved from TAIR (http://www.arabidopsis.org/), RGAP (http://rice.plantbiology.msu.edu/index.shtml), and SoyBase (https://www.soybase.org/), respectively. These sequences were aligned using ClustalW, and the neighbor-joining trees were constructed using the Molecular Genetics Analysis (MEGA) 6.0 with the “pairwise deletion” option and “Poisson correction” model [49]. Bootstrap replications were set to 1000 to evaluate the reliability of internal branches. Chromosomal locations of all the putative genes encoding P-type ATPase proteins were obtained from the SoyBase website (https://www.soybase.org/). The P-type ATPase genes were mapped on the 20 soybean chromosomes based on their physical positions on chromosomes.

2.3. Gene Duplication Analysis and Calculation of Ka/Ks Values

The duplication of putative P-type ATPase genes on segmentally duplicated regions was determined according to the results of phylogenetic trees and through searching the plant genome duplication database (PGDD) [50]. If the distance between two neighboring paralogous genes were less than 100 kb and separated by five or less genes, they were considered to be tandemly duplicated genes [51]. The history of selection performed on coding sequences can be measured by the Ka (non-synonymous substitution rates)/Ks (synonymous substitution rates) ratio, and the Ka/Ks can be used to identify pairwise combinations of genes, where encoded proteins may have changed functions [52]. The direction and magnitude of natural selection enforcing on the different genes could be interpreted by the Ka/Ks ratio. A pair of sequences having Ka/Ks < 1 indicates purifying selection; Ka/Ks = 1 implies both sequences drift neutrally; and Ka/Ks > 1 indicates positive or Darwinian selection [53]. The Ks and Ka of each gene pair was calculated by using TBtools [54]. The divergence time (T) was calculated by T = Ks/(2 × 6.1 × 10−9) × 10−6 MYA (million years ago), in which 6.1 × 10⁻⁹ is divergence rate in millions of years translated from Ks value [53].

2.4. In Silico Expression Analysis of P-Type ATPase Genes in Soybean

The expression patterns of P-type ATPase genes in different tissues of soybean were retrieved from two published soybean RNA-seq datasets [55,56]. The normalized Illumina-Solexa reads number (The Reads/Kb/Million, RPKM) was log2-transformed and visualized in the heatmap, which was drawn by the MultiExperiment Viewer program (http://mev.tm4.org/). Microarray and high-throughput sequencing datasets of short-term salt stress (1 h, 6 h, and 12 h) in soybean roots [57], 1 d cold stress in soybean shoots [58], 4 d dehydration stress in soybean shoots [58], 7 d flooding stress in soybean leaves [59], 7 d drought stress in soybean leaves [59], and 7 d phosphate starvation stress in soybean roots [60], were acquired from published datasets. The published dataset of transcriptome response to symbiotic bacteria (Bradyrhizobium japonicum) in soybean root hairs was also retrieved [61].

2.5. Analysis of Cis-Acting Regulatory Elements

Promoter sequences of 1.5 kb upstream from the transcription start sites of putative genes encoding P-type ATPase proteins were obtained from the SoyBase database (http://www.soybase.org/). The location of cis-acting regulatory elements was analyzed using Regulatory Sequence Analysis Tools (RSAT) (http://rsat.eead.csic.es/plants/) [62].

2.6. Plant Growth and qRT-PCR Analysis

Soybean seeds (Glycine max L. var. Williams 82) were germinated at room temperature in the dark between two layers of filter paper moistened with sterilized water. After four days, soybean seedlings were grown hydroponically in half-strength modified Hoagland nutrient solution, the pH of the nutrient solution was adjusted to 5.6, and the nutrient solution was changed every three days [63]. The seedlings were grown in a growth chamber with a photoperiod set at 16-h-light/8-h-dark at 26/22 °C and with a light intensity of 150 μmol m−2 s−1. After cultivating for two weeks, soybean seedlings were used for phosphorus deficiency treatment. Seedlings were transferred into normal nutrient solution (control) and phosphorus deficient solution (without KH2PO4). For the phosphorus deficient treatment, we replaced KH2PO4 with K2SO4 to keep the concentration of K+. Roots and leaves of soybean seedlings were separately sampled after treatment of phosphorus deficiency for one and seven days. Quantitative RT-PCR (qRT-PCR) was performed on a real-time PCR system (CFX96 system, Bio-Rad Company, Hercules, California, USA) as described previously [64]. Relative expression levels were normalized to that of an internal control GmACTIN11 (Glyma.18g290800). The primers used for amplification were as follows: 5′-CGGTGGTTCTATCTTGGCATC-3′ and 5′-GTCTTTCGCTTCAATAACCCTA-3′ for GmACTIN11; 5′-TCGAGGCTTTCTTGGGTTGG-3′ and 5′-GCAGTTTGCCATGTCTCAGTC-3′ for GmACA1; and 5′-ACTACTTTTGGGGAAGTGGTAG-3′ and 5′- CATTTGGCCACTGTTACTATCG-3′ for GmACA2. The calculated efficiency (E) of these primers was all around 2.0.

3. Results

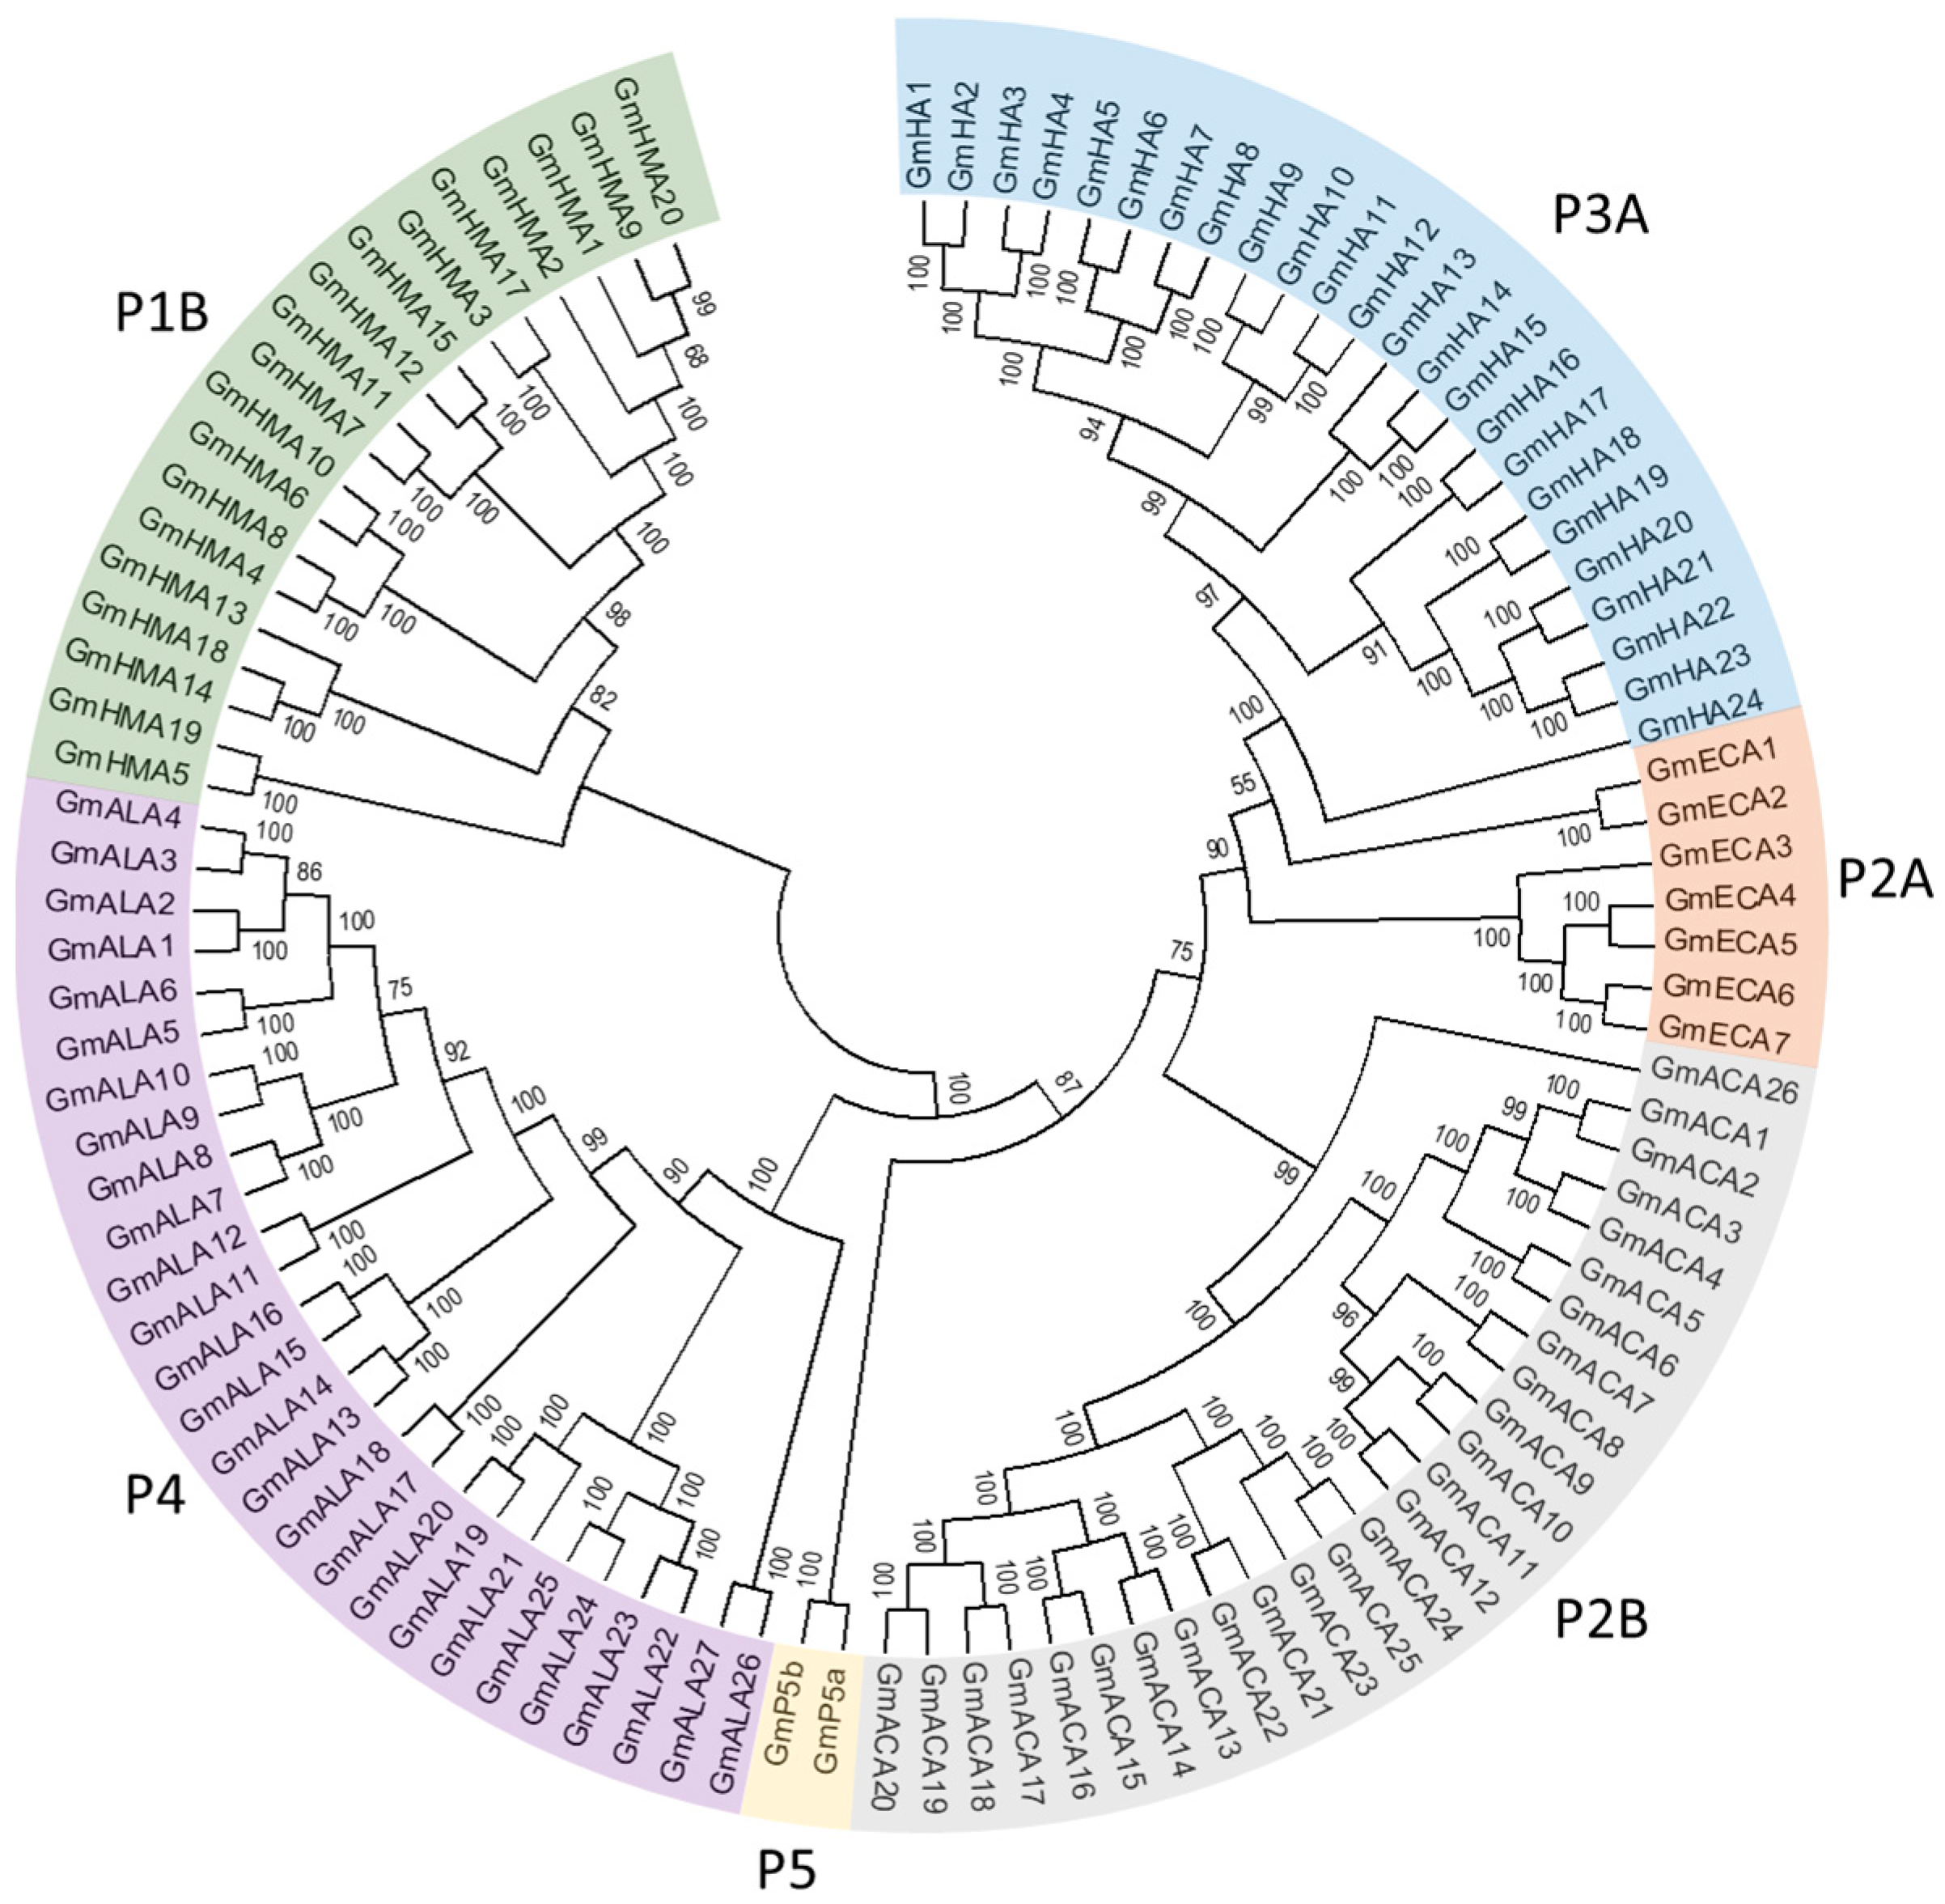
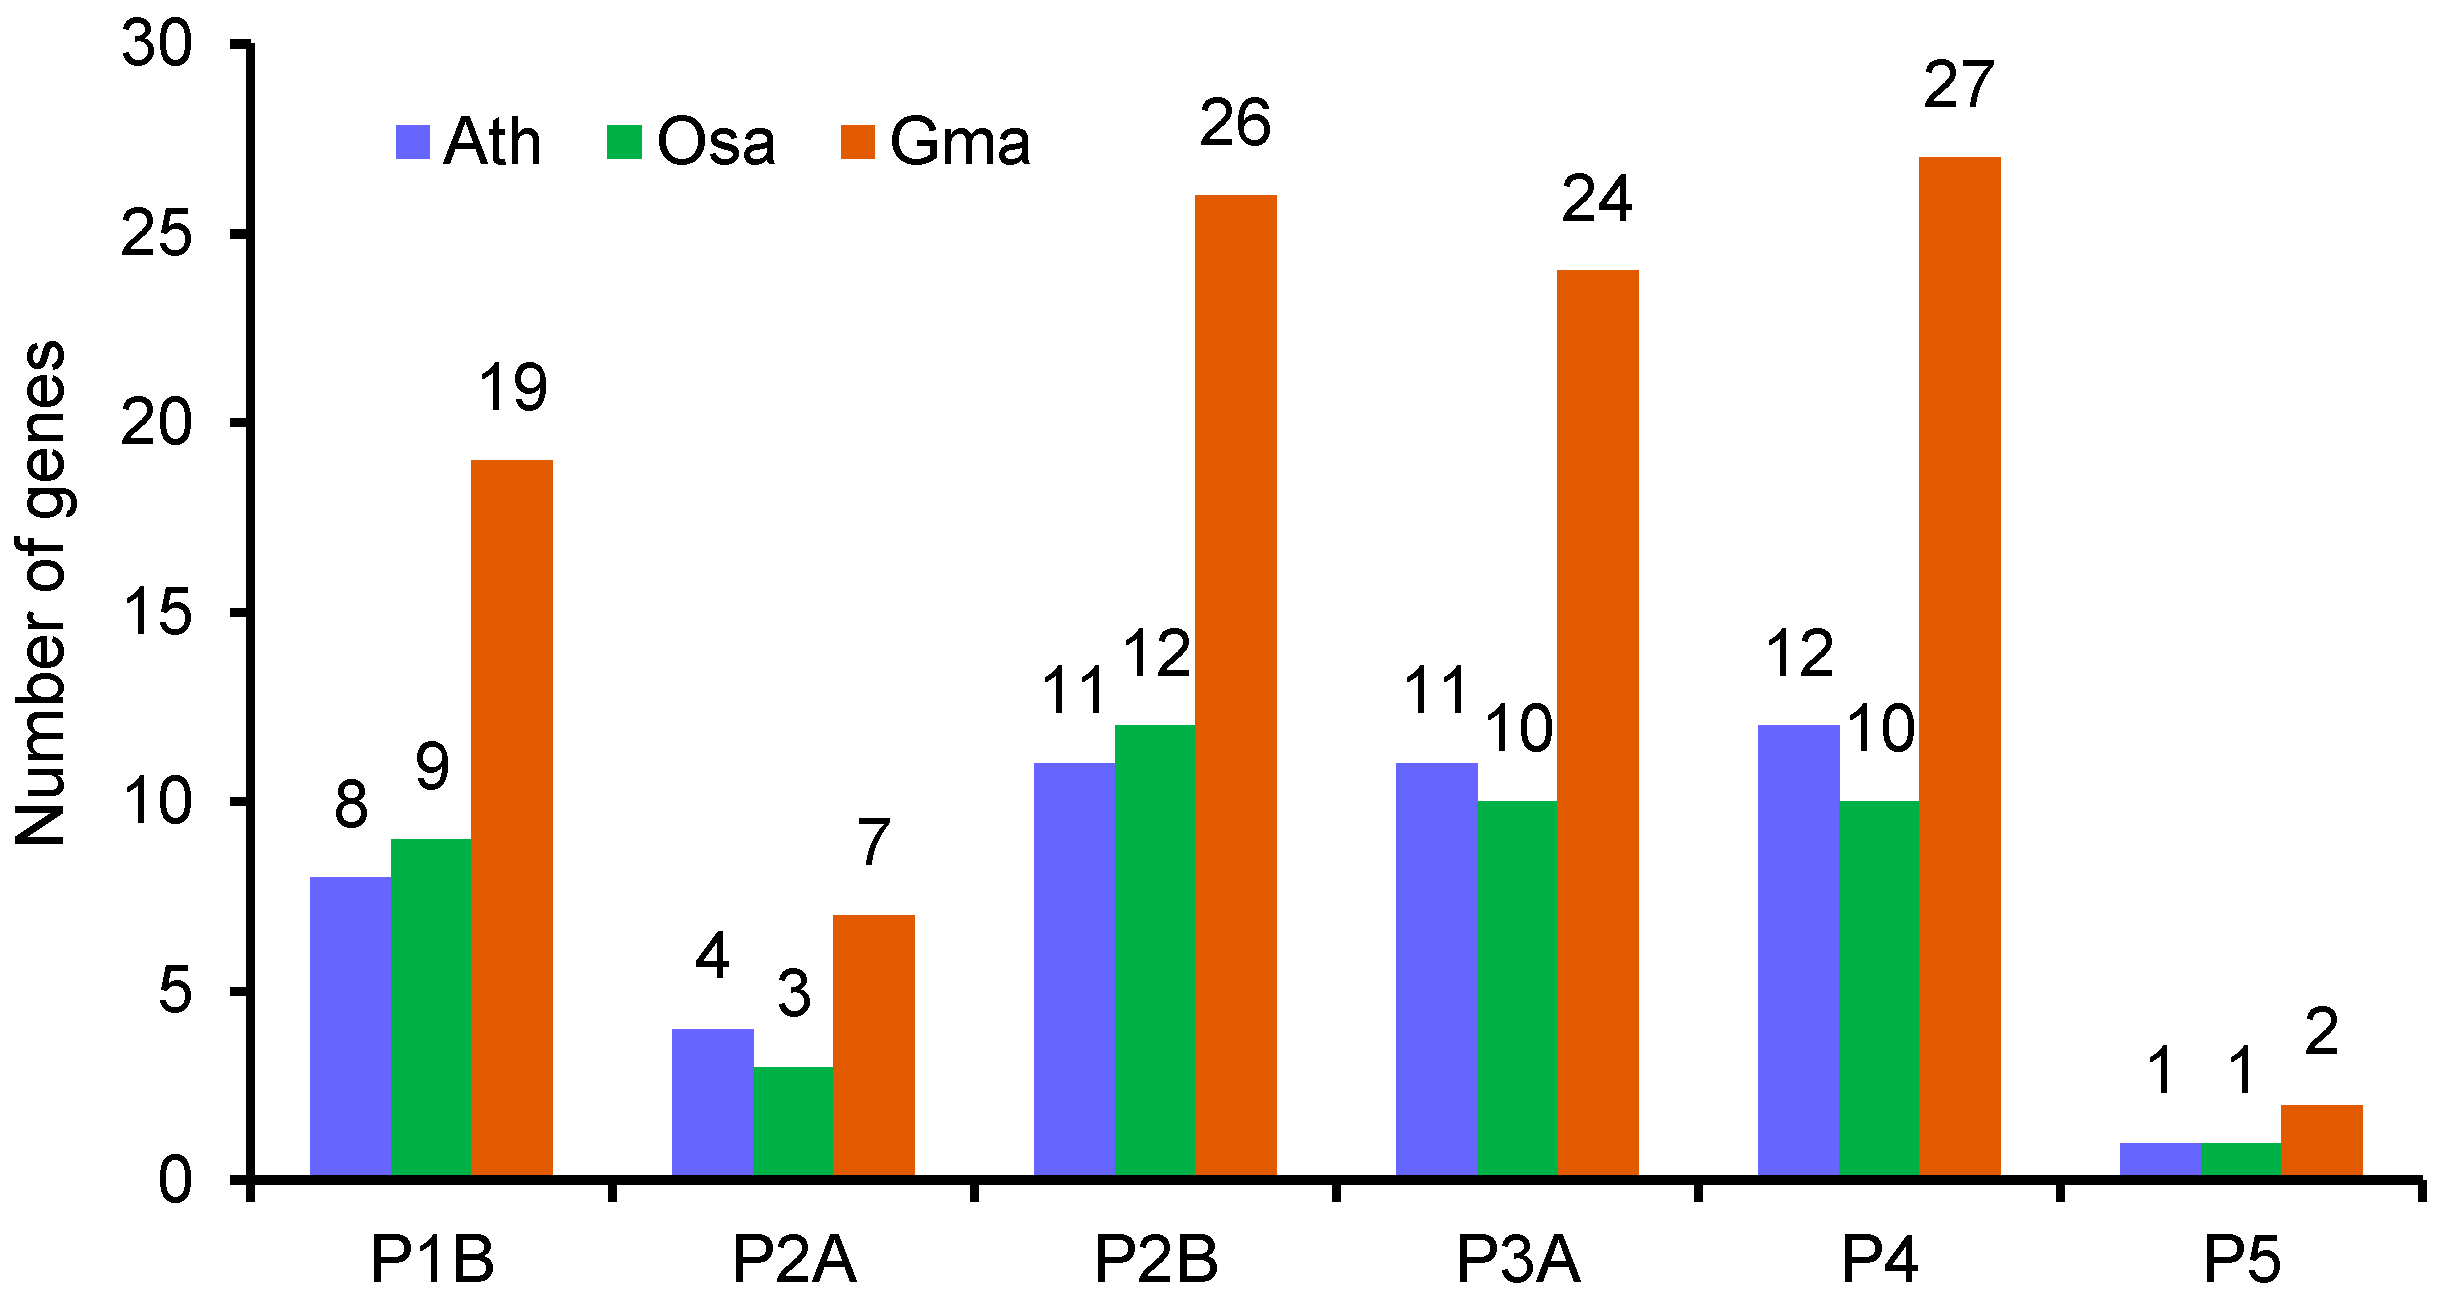
3.1. Identification of Putative Genes Encoding P-Type ATPase Proteins in the Soybean Genome

To investigate the P-type ATPase gene superfamily in the soybean genome, the BLAST algorithm was used to search the soybean genome database in the SoyBase website (https://www.soybase.org/) using Arabidopsis and rice P-type ATPase protein sequences as the query. In total, 105 genes were identified to putatively encode P-type ATPase proteins (Table S1). These genes can be classified into five subfamilies, e.g., P1B, P2A/B, P3A, P4, and P5, based on their homologues in Arabidopsis and rice (Figure 1 and Table S1). There were nineteen P1B genes, seven P2A genes, twenty-six P2B genes, twenty-four P3A genes, twenty-seven P4 genes, and two P5 genes identified in the soybean genome (Figure 1 and Figure 2). The total number of P-type ATPase proteins in soybean is about 2.2 and 2.3 folds that in Arabidopsis and rice, respectively (Figure 2).

3.2. P1B Subfamily Genes in Soybean

Twenty P1B subfamily genes have been identified previously in soybean and they were sequentially named GmHMA1 to GmHMA20 according to their chromosomal positions [65]. Here, we used P1B proteins from Arabidopsis and rice as queries to BLAST against the soybean genome database (SoyBase, https://www.soybase.org/). These 20 genes were all covered in the BLAST result, but the gene or protein length of these GmHMAs in the latest version of soybean genome annotation (Wm82.a4.v1) is different from the previous report (Wm82.a1.v1) [65]. For example, the protein length of GmHMA16 is 278 amino acids, while the length was 793 in the previous report. Because of the lack of characteristic domains of P1B ATPases, GmHMA16 was removed in the P1B subfamily members. The gene and protein sequences of the other 19 GmHMAs in the latest version were then used for further analysis. The coding region of these soybean P1B ATPase genes was interrupted by 4 to 16 introns (Table S2). The protein length of GmHMAs ranged from 505 to 1096 amino acids (Table S2). All of the GmHMA proteins were predicted to contain a E1-E2 ATPase domain (Figure S1). Twelve GmHMA proteins were predicted to contain one to three heavy-metal-associated domains (Figure S1). All GmHMA proteins were predicted to contain two to eight transmembrane helices by using the TMHMM2.0 program (http://www.cbs.dtu.dk/services/TMHMM/), with the exception that there was no transmembrane helix for GmHMA4 (Table S2), which is consistent with a previous report [65]. An unrooted phylogenetic analysis was conducted to explore the evolutionary relationships of HMAs in soybean, Arabidopsis and rice plants. The topology of the phylogenetic tree revealed that the P1B subfamily can be divided into six clades (I–VI) (Figure 3). In each clade, genes from the three plant species were present, suggesting a common ancestor of the same clade in these plants.

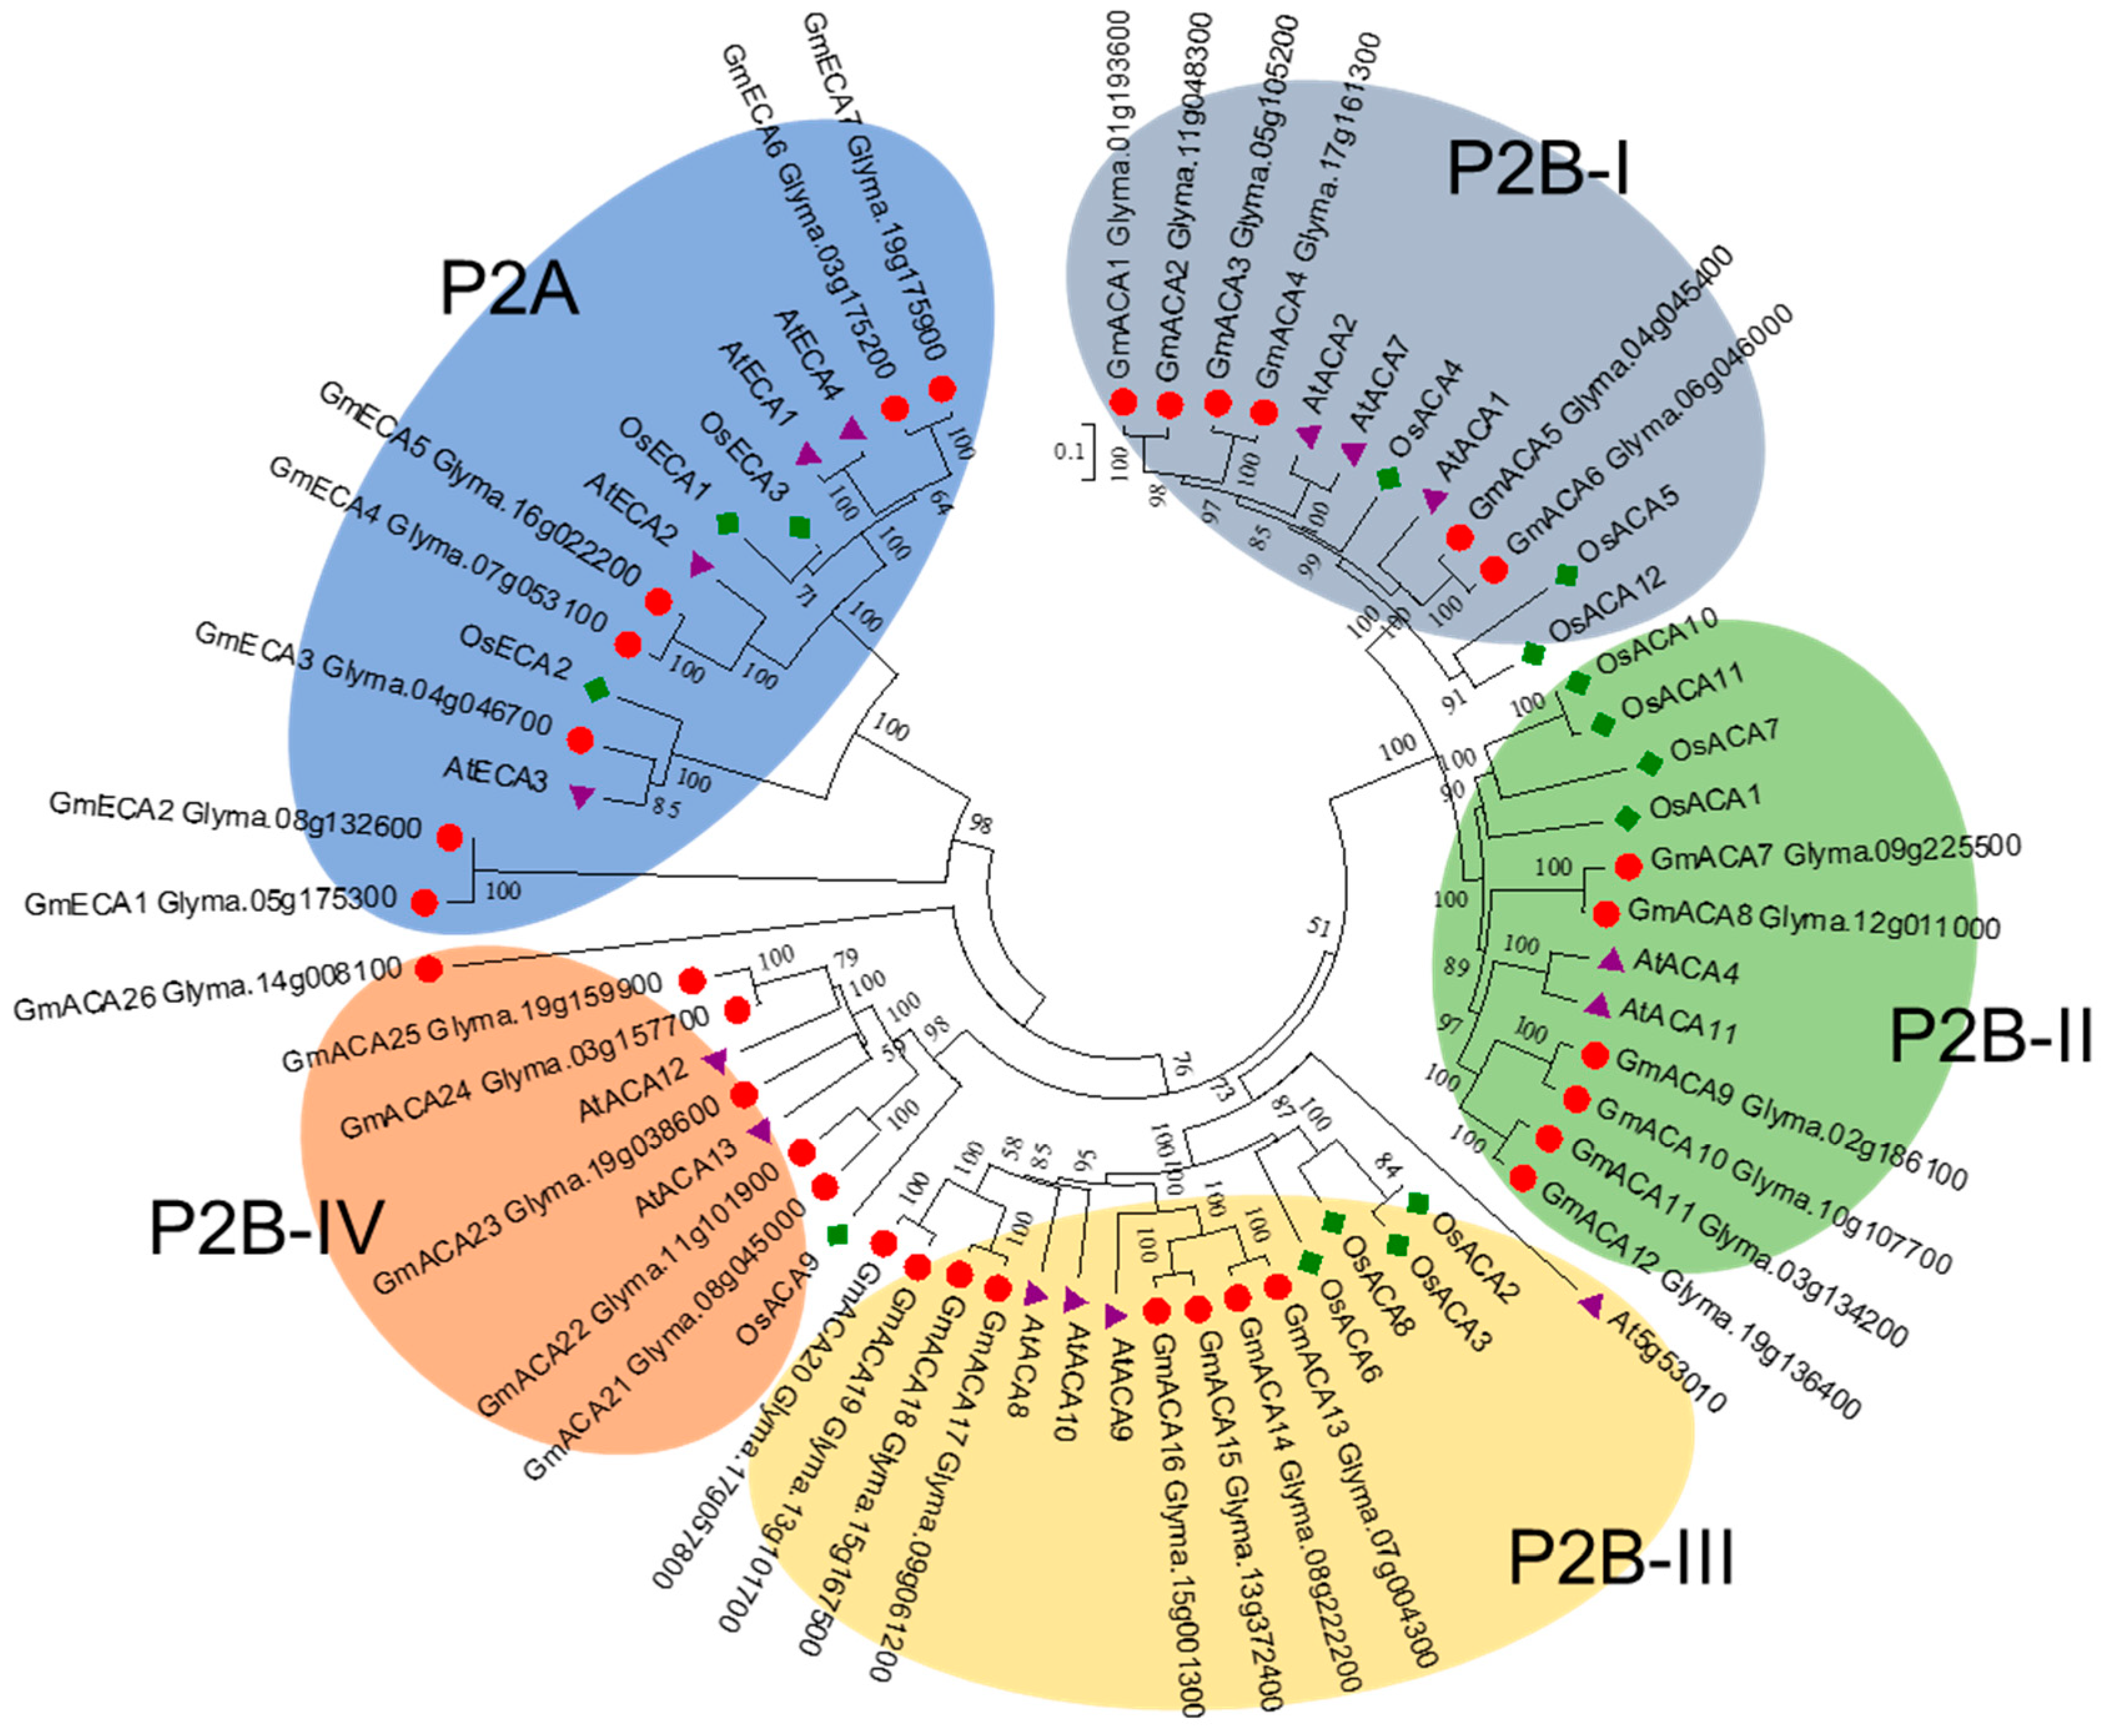
3.3. P2 Subfamily Genes in Soybean

The P2 subfamily ATPases can be classified in two groups: P2A (ECA) and P2B (ACA). Previously, we identified 8 P2A subfamily genes and 25 P2B subfamily genes in the soybean genome [66]. The soybean P2 ATPase proteins were predicted to contain five to ten transmembrane helices (Table S3). Domain prediction analysis showed that five domains characteristic for P2 subfamily ATPase, such as N-terminal autoinhibitory domain, N-terminus cation transporter/ATPase, E1-E2 ATPase, haloacid dehalogenase-like hydrolase, and C-terminus cation transporter/ATPase, were predicted to exist in most of the soybean P2 subfamily proteins [66]. Most of the soybean P2B proteins were predicted to contain an N-terminal autoinhibitory domain [66]. A phylogenetic tree was constructed using deduced amino acid sequences to analyze the evolutionary relatedness among the members of P2 subfamily from soybean, rice, and Arabidopsis (Figure 4). The phylogenetic analysis suggested that the P2 subfamily formed five distinct clades; P2B can be divided into four clades, i.e., P2B-I, P2B-II, P2B-III, and P2B-IV (Figure 4). Gene members in the same clade have a high degree of evolutionary relatedness in these three plant species, suggesting the common ancestry of P2 type ATPases in these plants.

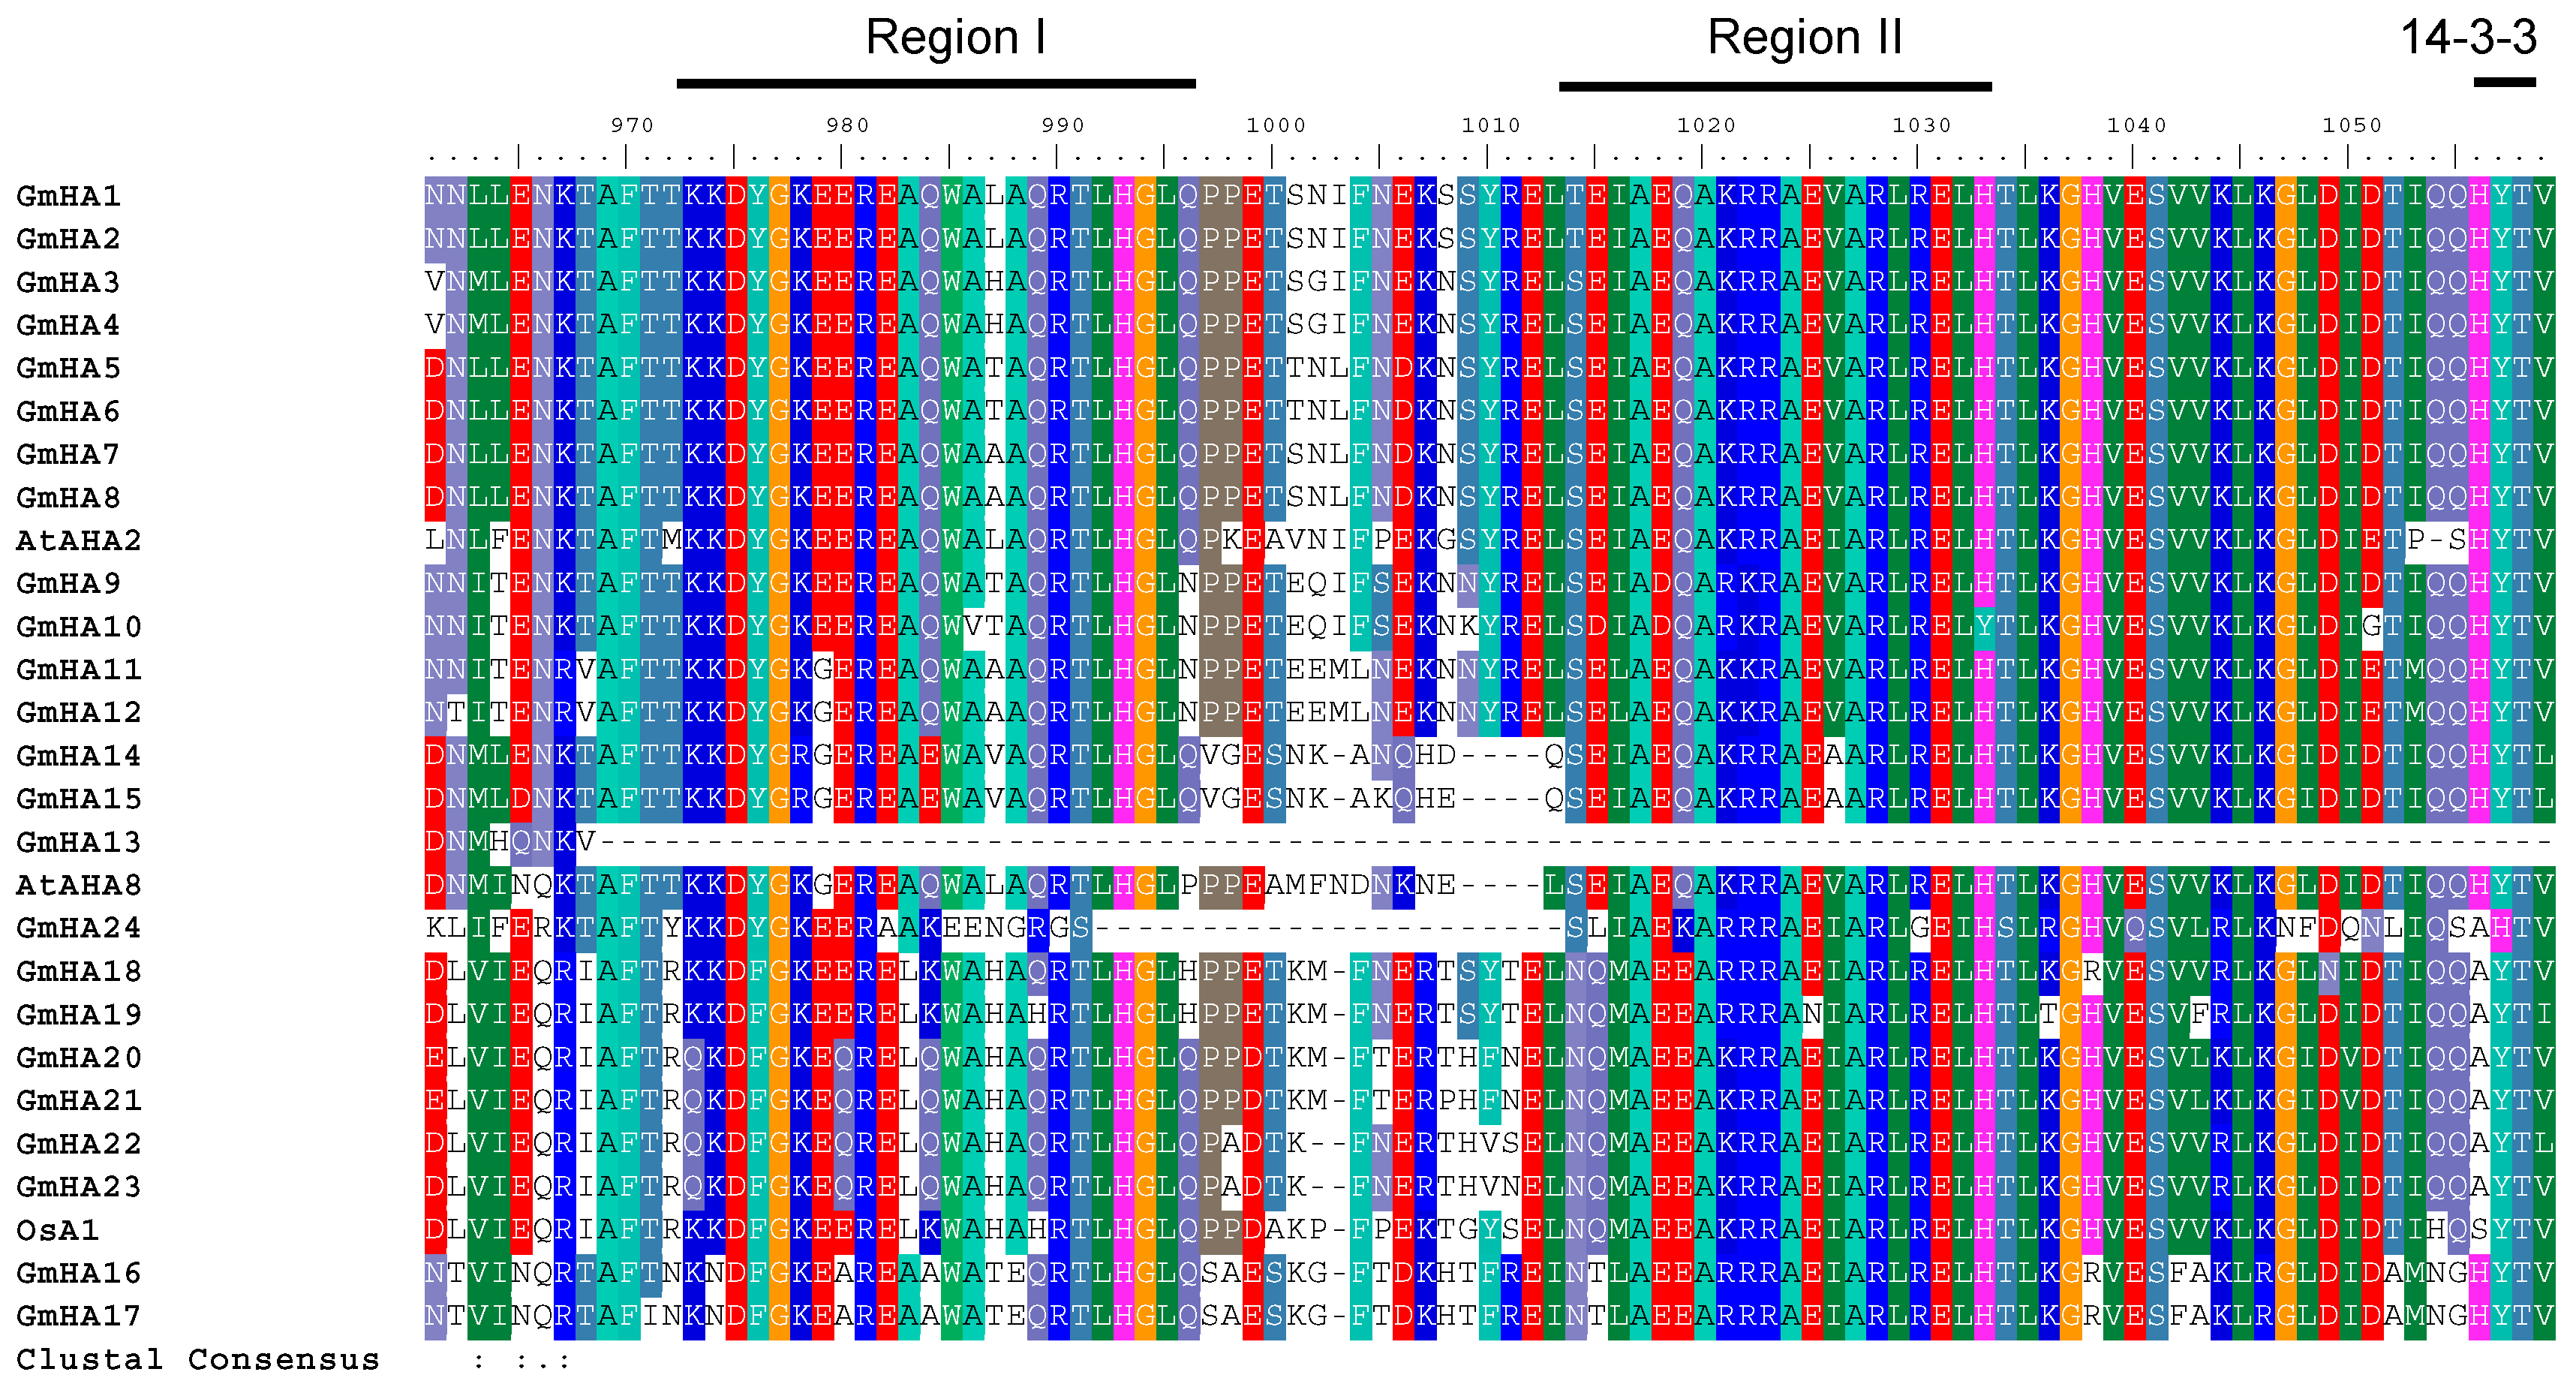
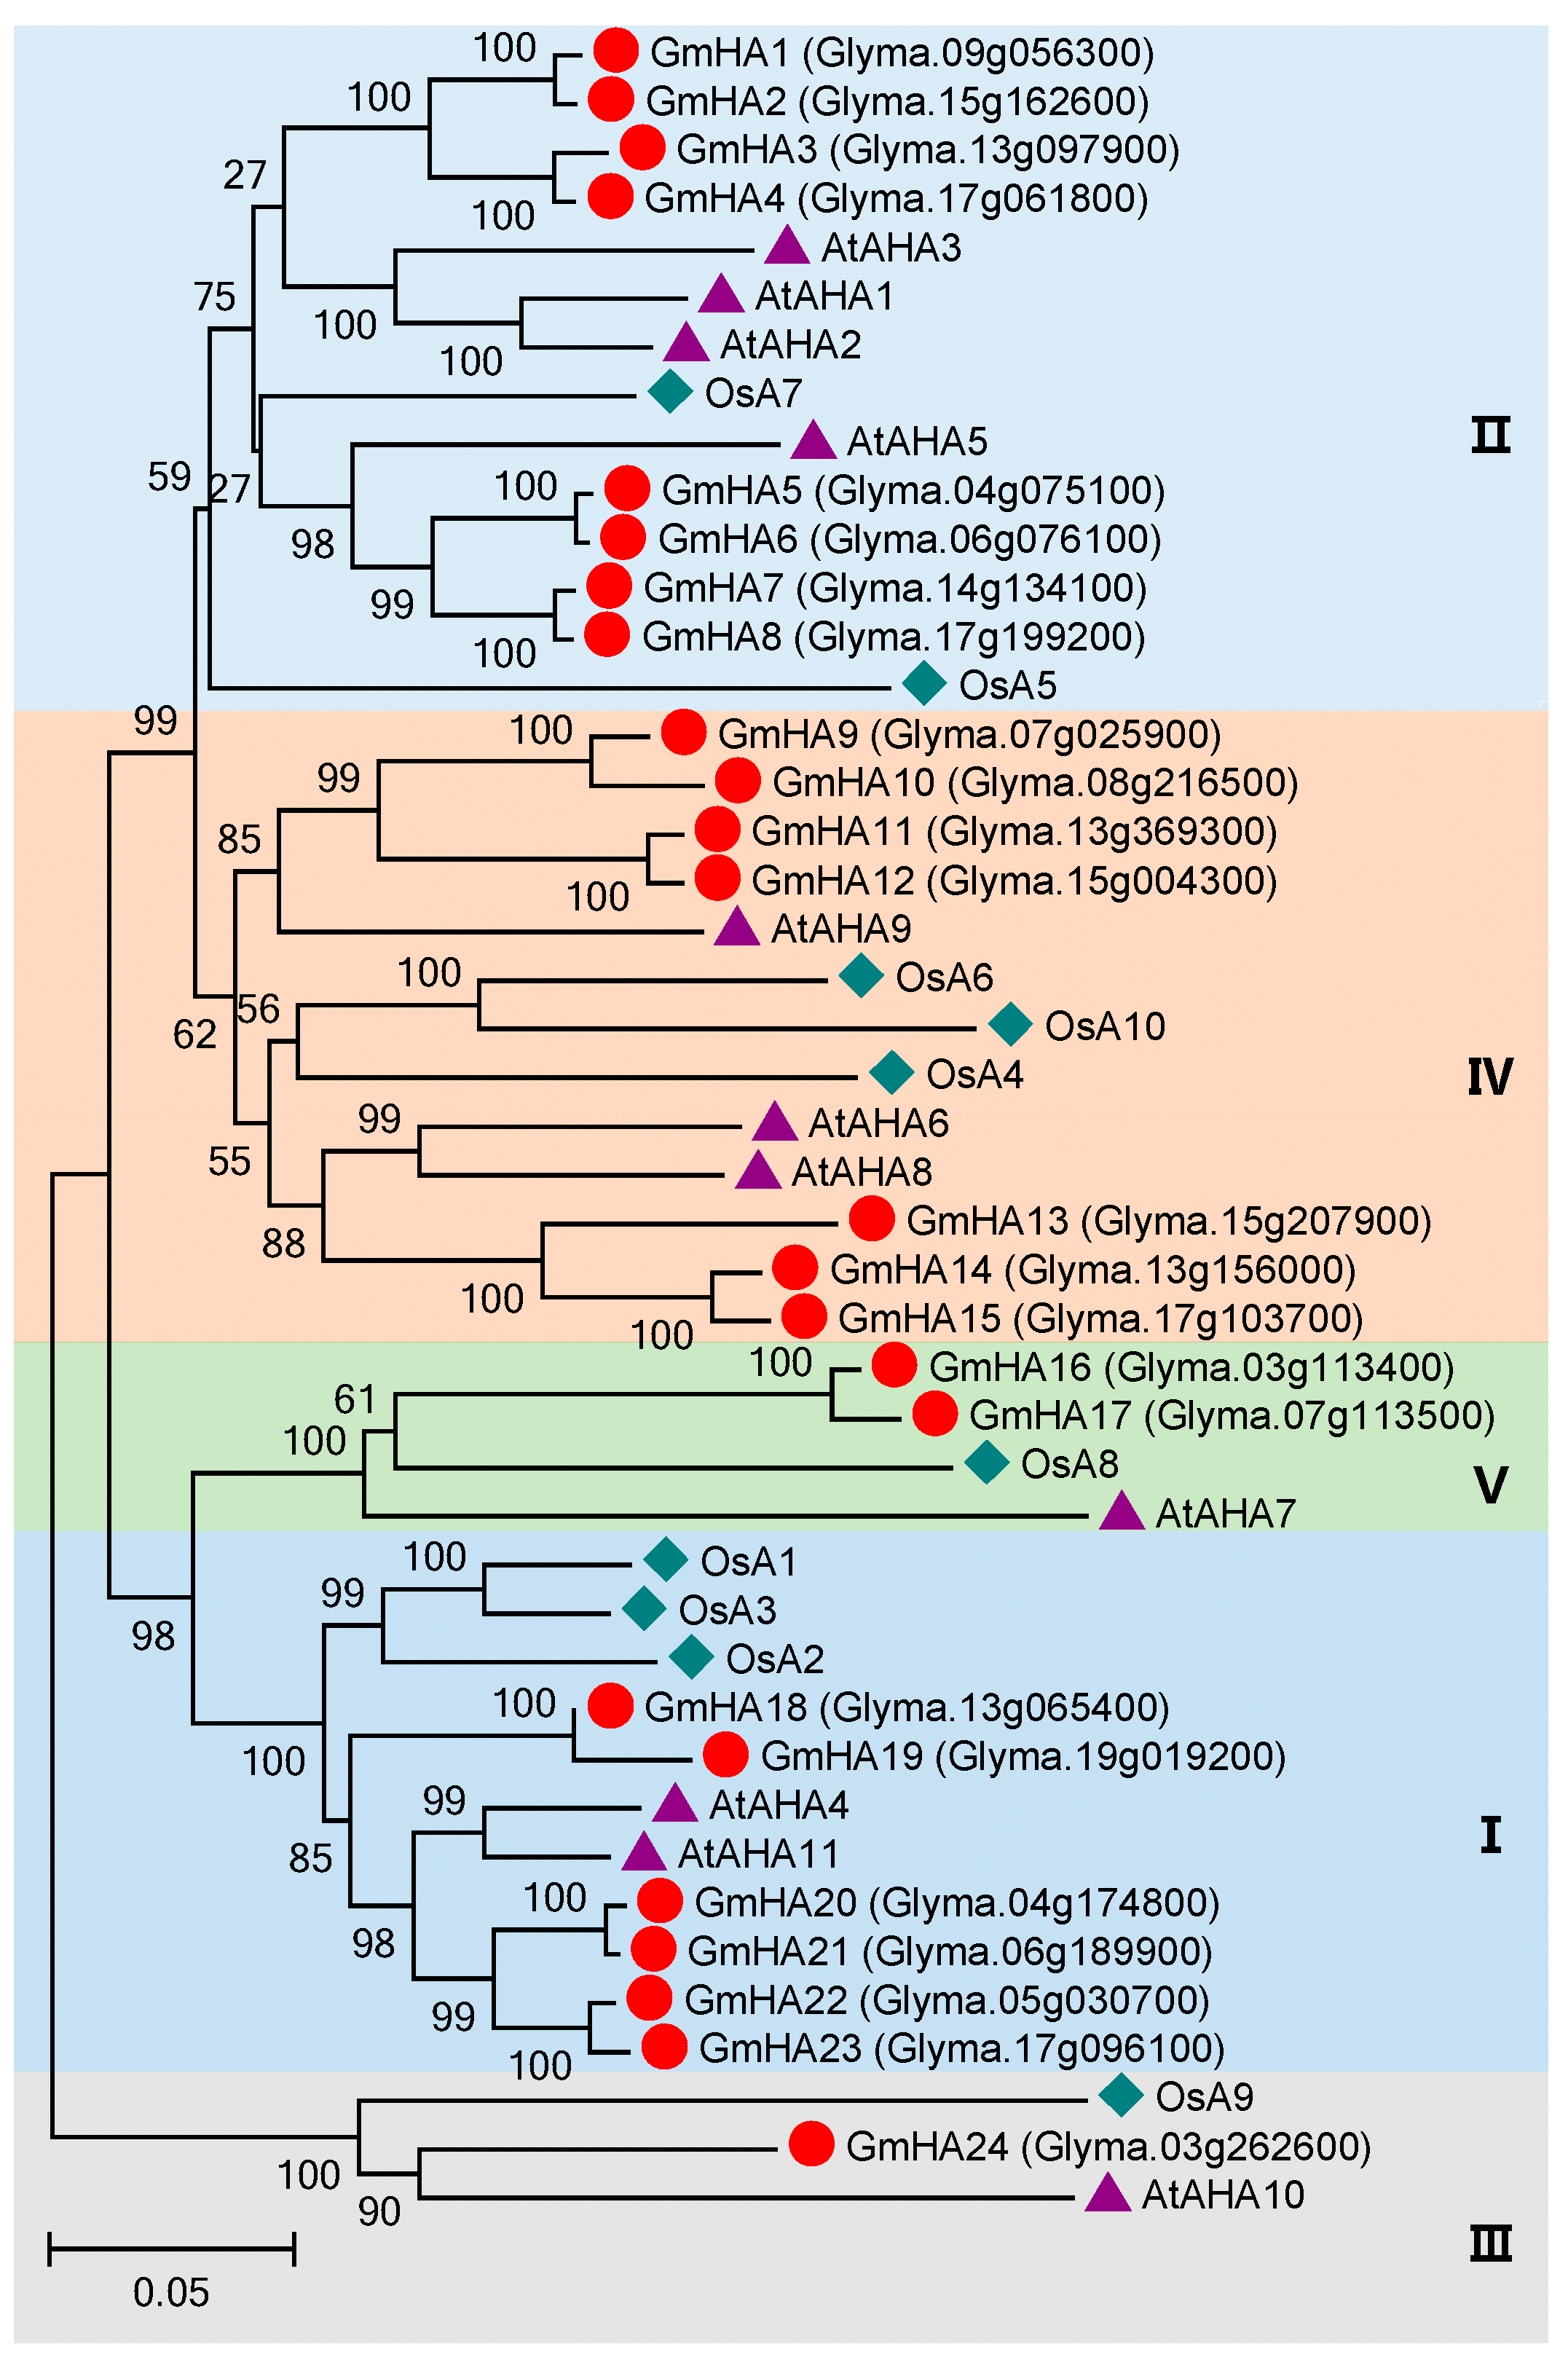
3.4. P3 Subfamily Genes in Soybean

A total of 24 putative genes encoding PM H+-ATPases which belong to the P3 subfamily were identified in soybean (Table S4). These genes were designated as GmHA1 to GmHA24. The intron number of GmHA genes varied from 8 to 21, and the protein length of GmHAs ranged from 888 to 1017 amino acids (Table S4). All of the GmHA proteins were predicted to contain 6 to 10 transmembrane helices (Table S4). All of the GmHA proteins were predicted to contain an N-terminus cation transporter/ATPase domain, a E1-E2 ATPase domain, and a haloacid dehalogenase-like hydrolase domain, with the exception that there is no N-terminus cation transporter/ATPase domain for GmHA18 (Figure S2). By sequencing alignment, the protein sequences of PM H+-ATPases were found to be highly conserved among the P3 subfamily proteins in Arabidopsis, rice and soybean (Figure S3). All of the 24 GmHA proteins possess a penultimate Thr, a conserved region I, and a conserved region II in the C-terminal regions with the exception of GmHA13 (Figure 5). Region I and region II have been identified to be important for autoinhibitory effects on the PM H+-ATPase [67]. The phosphorylation of penultimate Thr or Ser is required for 14-3-3 protein binding, which results in the activation of PM H+-ATPases [32,68]. A phylogenetic tree was constructed using full-length amino acid sequences of all the PM H+-ATPase in soybean, Arabidopsis, and rice. These proteins could be grouped into five distinct clades (Figure 6). In each clade, PM H+-ATPase genes from soybean, Arabidopsis, and rice are all included (Figure 6).

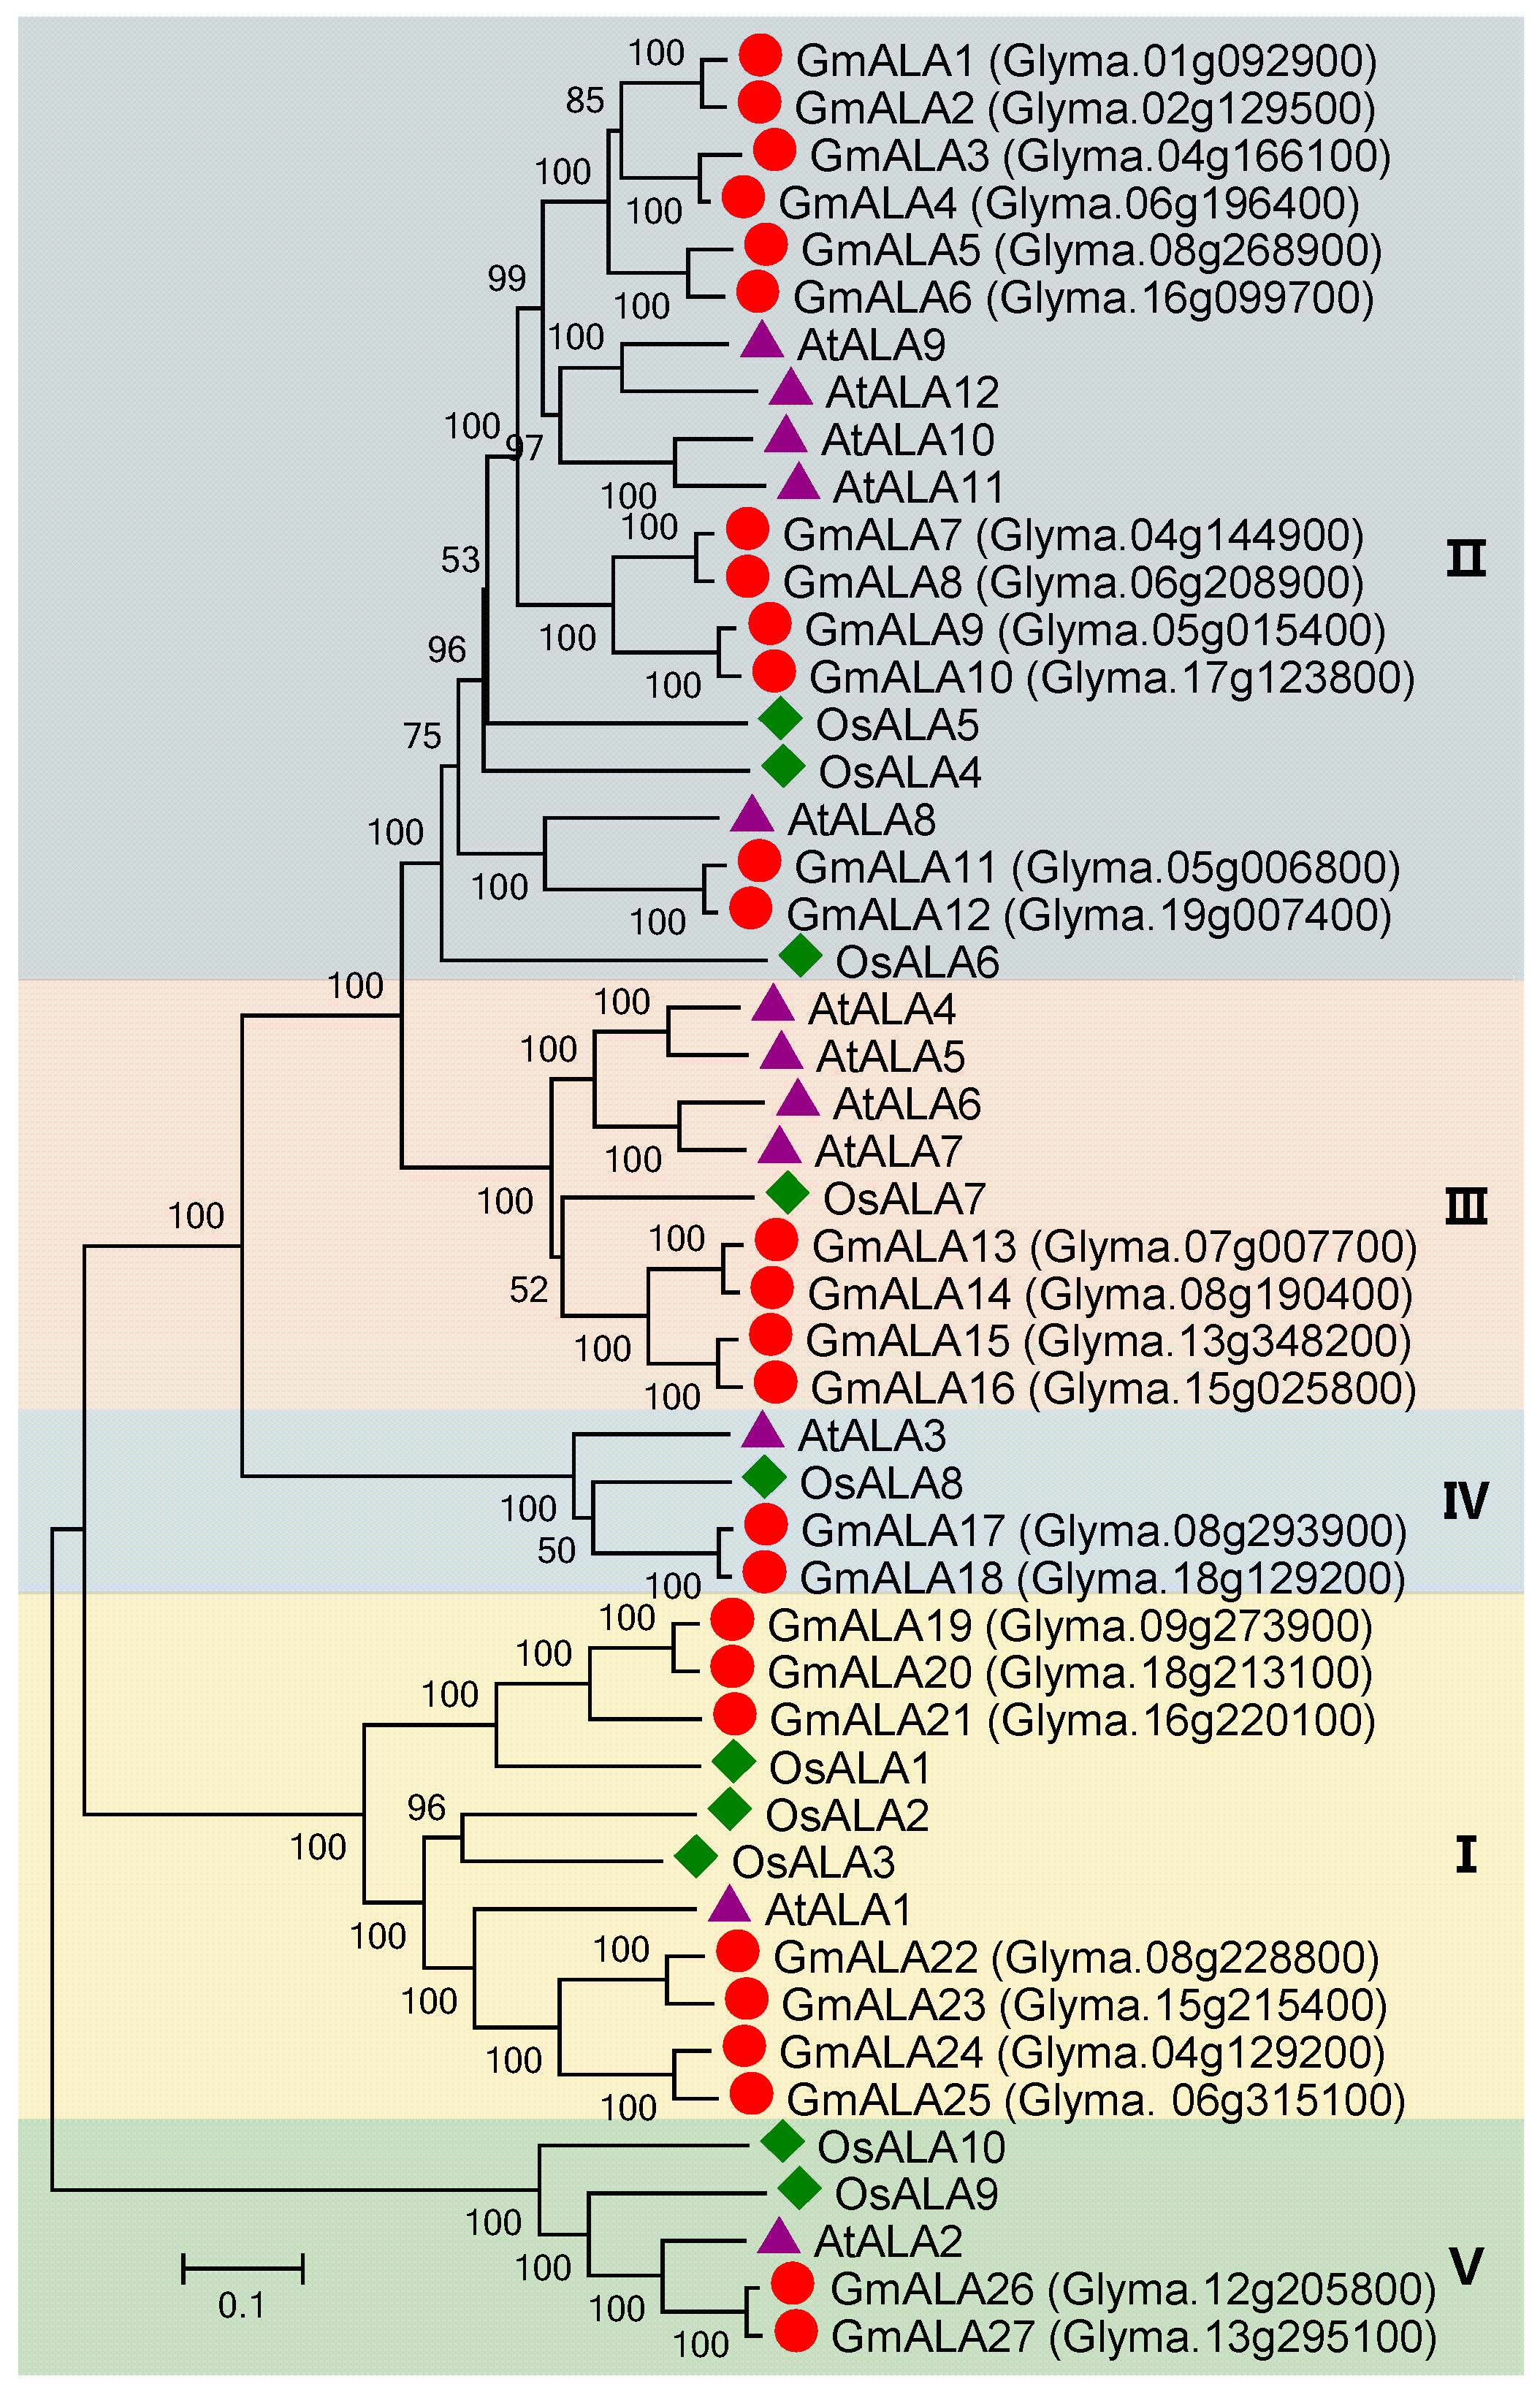
3.5. P4 Subfamily Genes in Soybean

In this study, 27 P4 subfamily genes were identified in the soybean genome (Table S5). These genes were designated as GmALA1 to GmALA27 according to their positions in the phylogenetic tree (Figure 7). The intron number of GmALA genes varied from 6 to 24, and the protein length of GmALAs ranged from 943 to 1297 amino acids (Table S5). All the P4 ATPase proteins in soybean were predicted to contain seven to ten transmembrane helices (Table S5). All of these proteins were predicted to contain several conserved domains of P4-ATPases, such as an N-terminal phospholipid-translocating P-type ATPase domain, a E1-E2 ATPase domain, a cation-transport ATPase domain, a haloacid dehalogenase-like hydrolase, and a C-terminal phospholipid-translocating P-type ATPase domain (Figure 8). A phylogenetic tree was constructed using the neighbor-joining method to determine the homology between the P4 subfamily genes in soybean, Arabidopsis and rice. The topology of the phylogenetic tree showed that the P4 subfamily can be divided into five clades (I–V) (Figure 7). Genes coming from the monocot rice, the dicotyledon Arabidopsis, and the legume soybean were all included in each of these clades (Figure 7), suggesting common ancestors of P4 ATPases in these angiosperms.

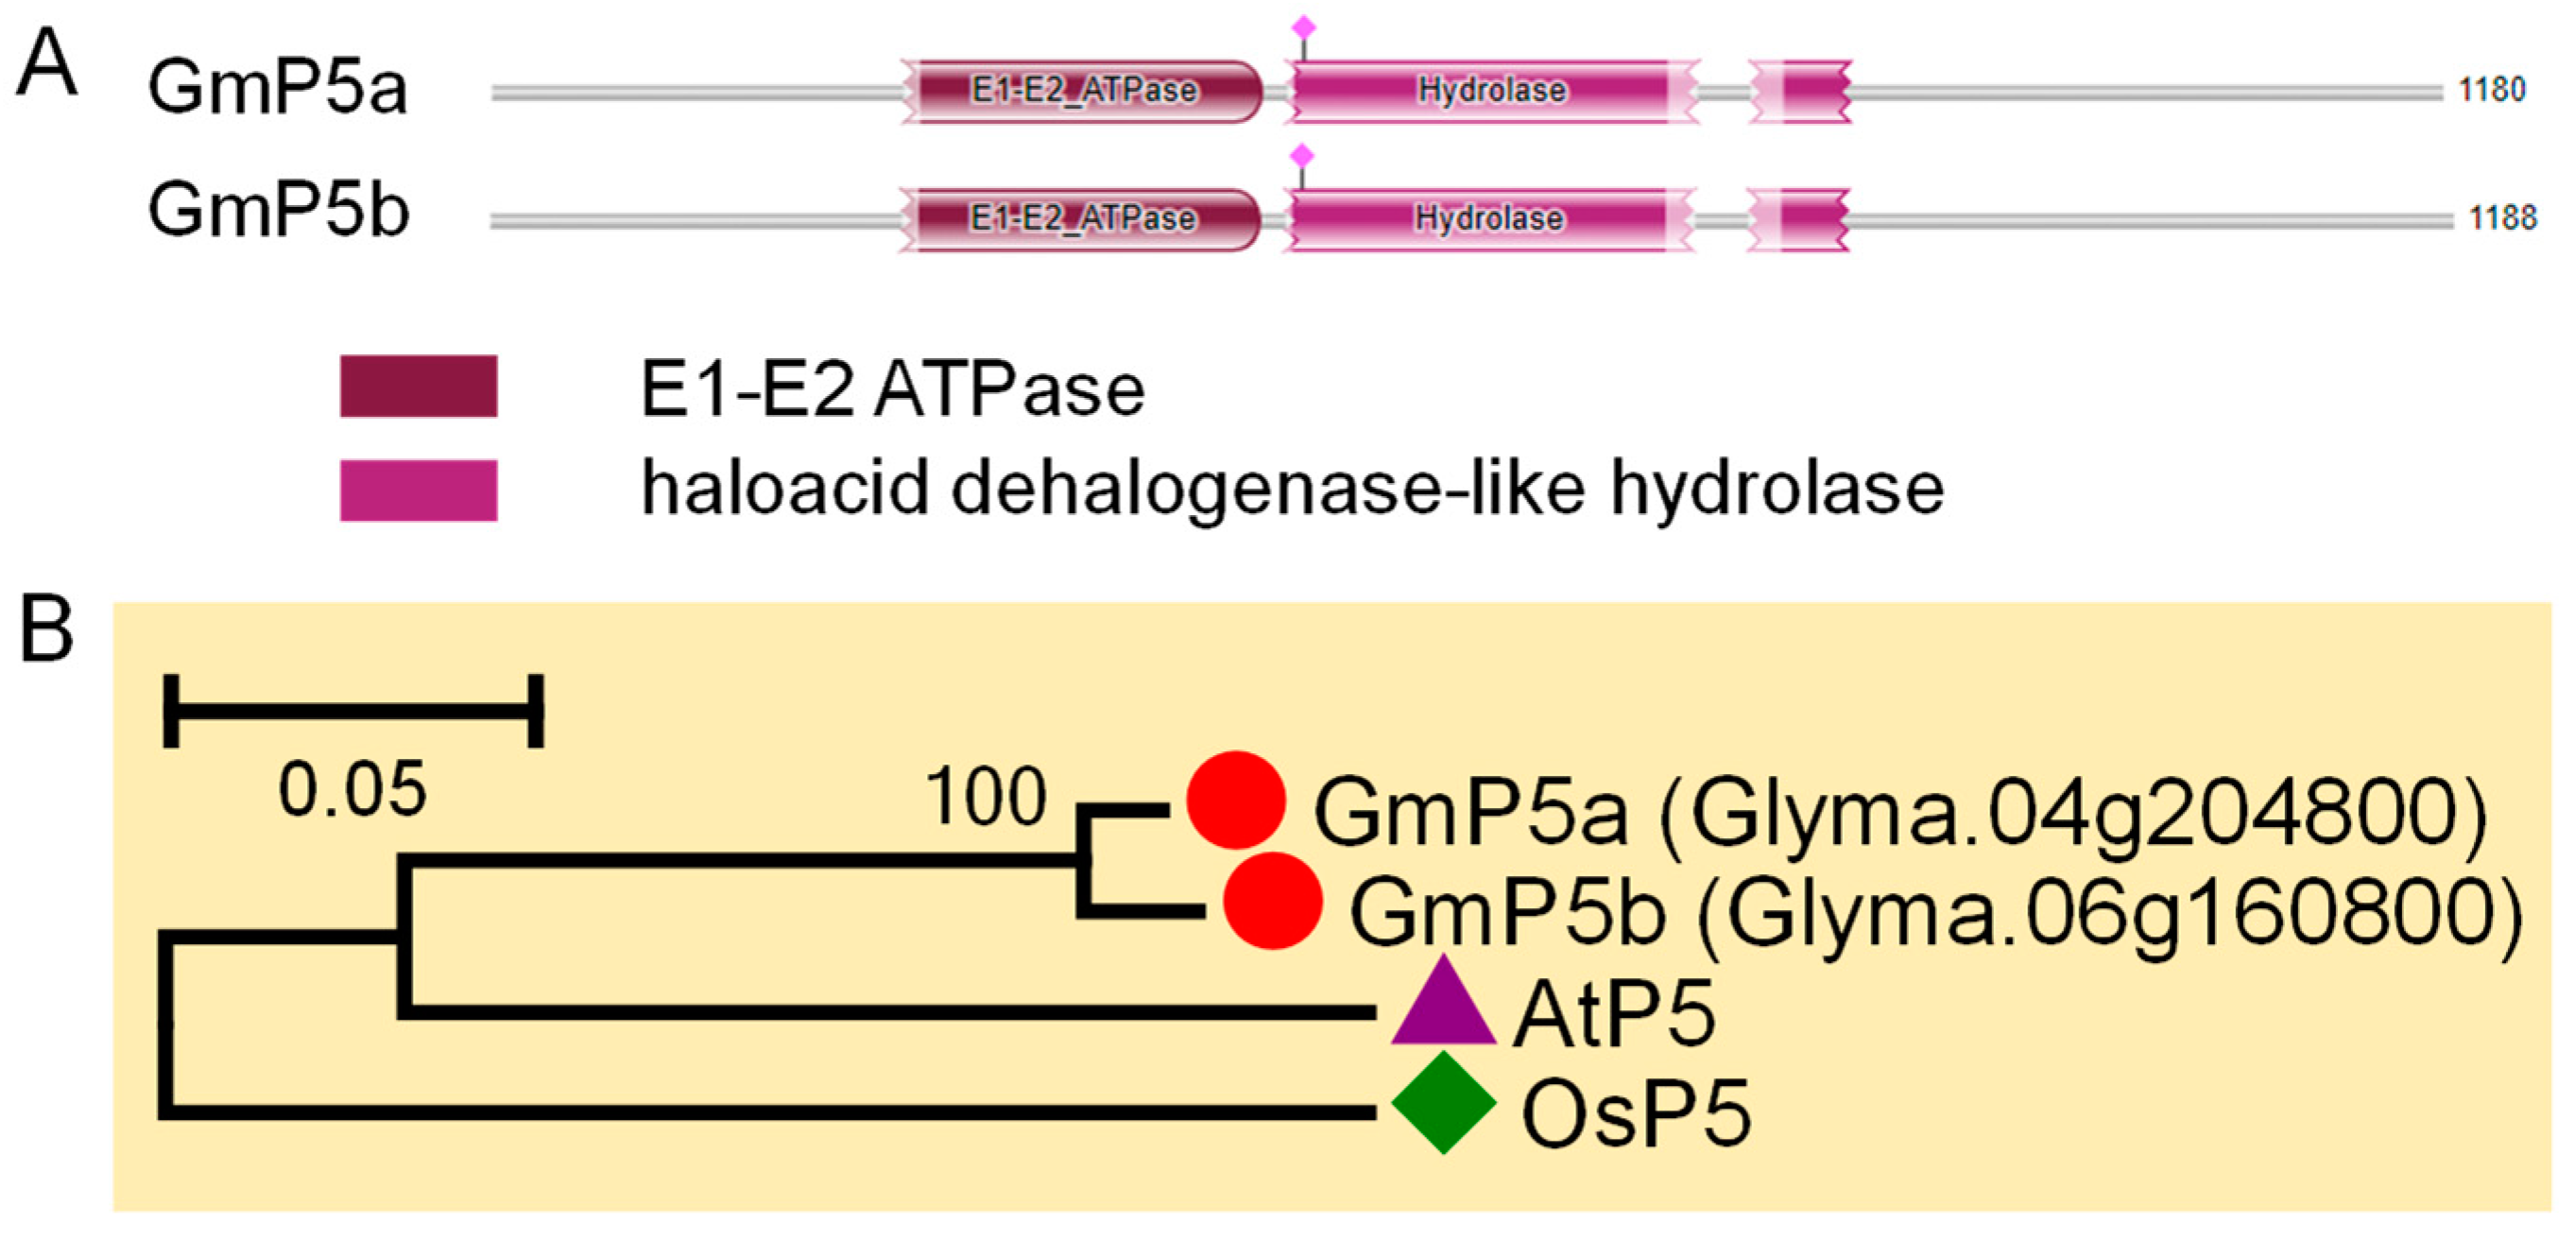
3.6. P5 Subfamily Genes in Soybean

By homolog searching, two putative genes were identified to encode P5 subfamily ATPases in soybean; they were named GmP5a and GmP5b (Table S6). The coding regions of these two genes are both interrupted by 20 introns. The encoded proteins of these two genes were predicted to contain 10 transmembrane helices (Table S6). GmP5a and GmP5b were both predicted to contain a E1-E2 ATPase domain and a haloacid dehalogenase-like hydrolase domain (Figure 9A). The protein sequences of GmP5a and GmP5b are similar to the P5 proteins in Arabidopsis and rice (Figure S4). A phylogenetic tree suggested that GmP5a and GmP5b are closely related to their orthologous proteins in Arabidopsis and rice (Figure 9B).

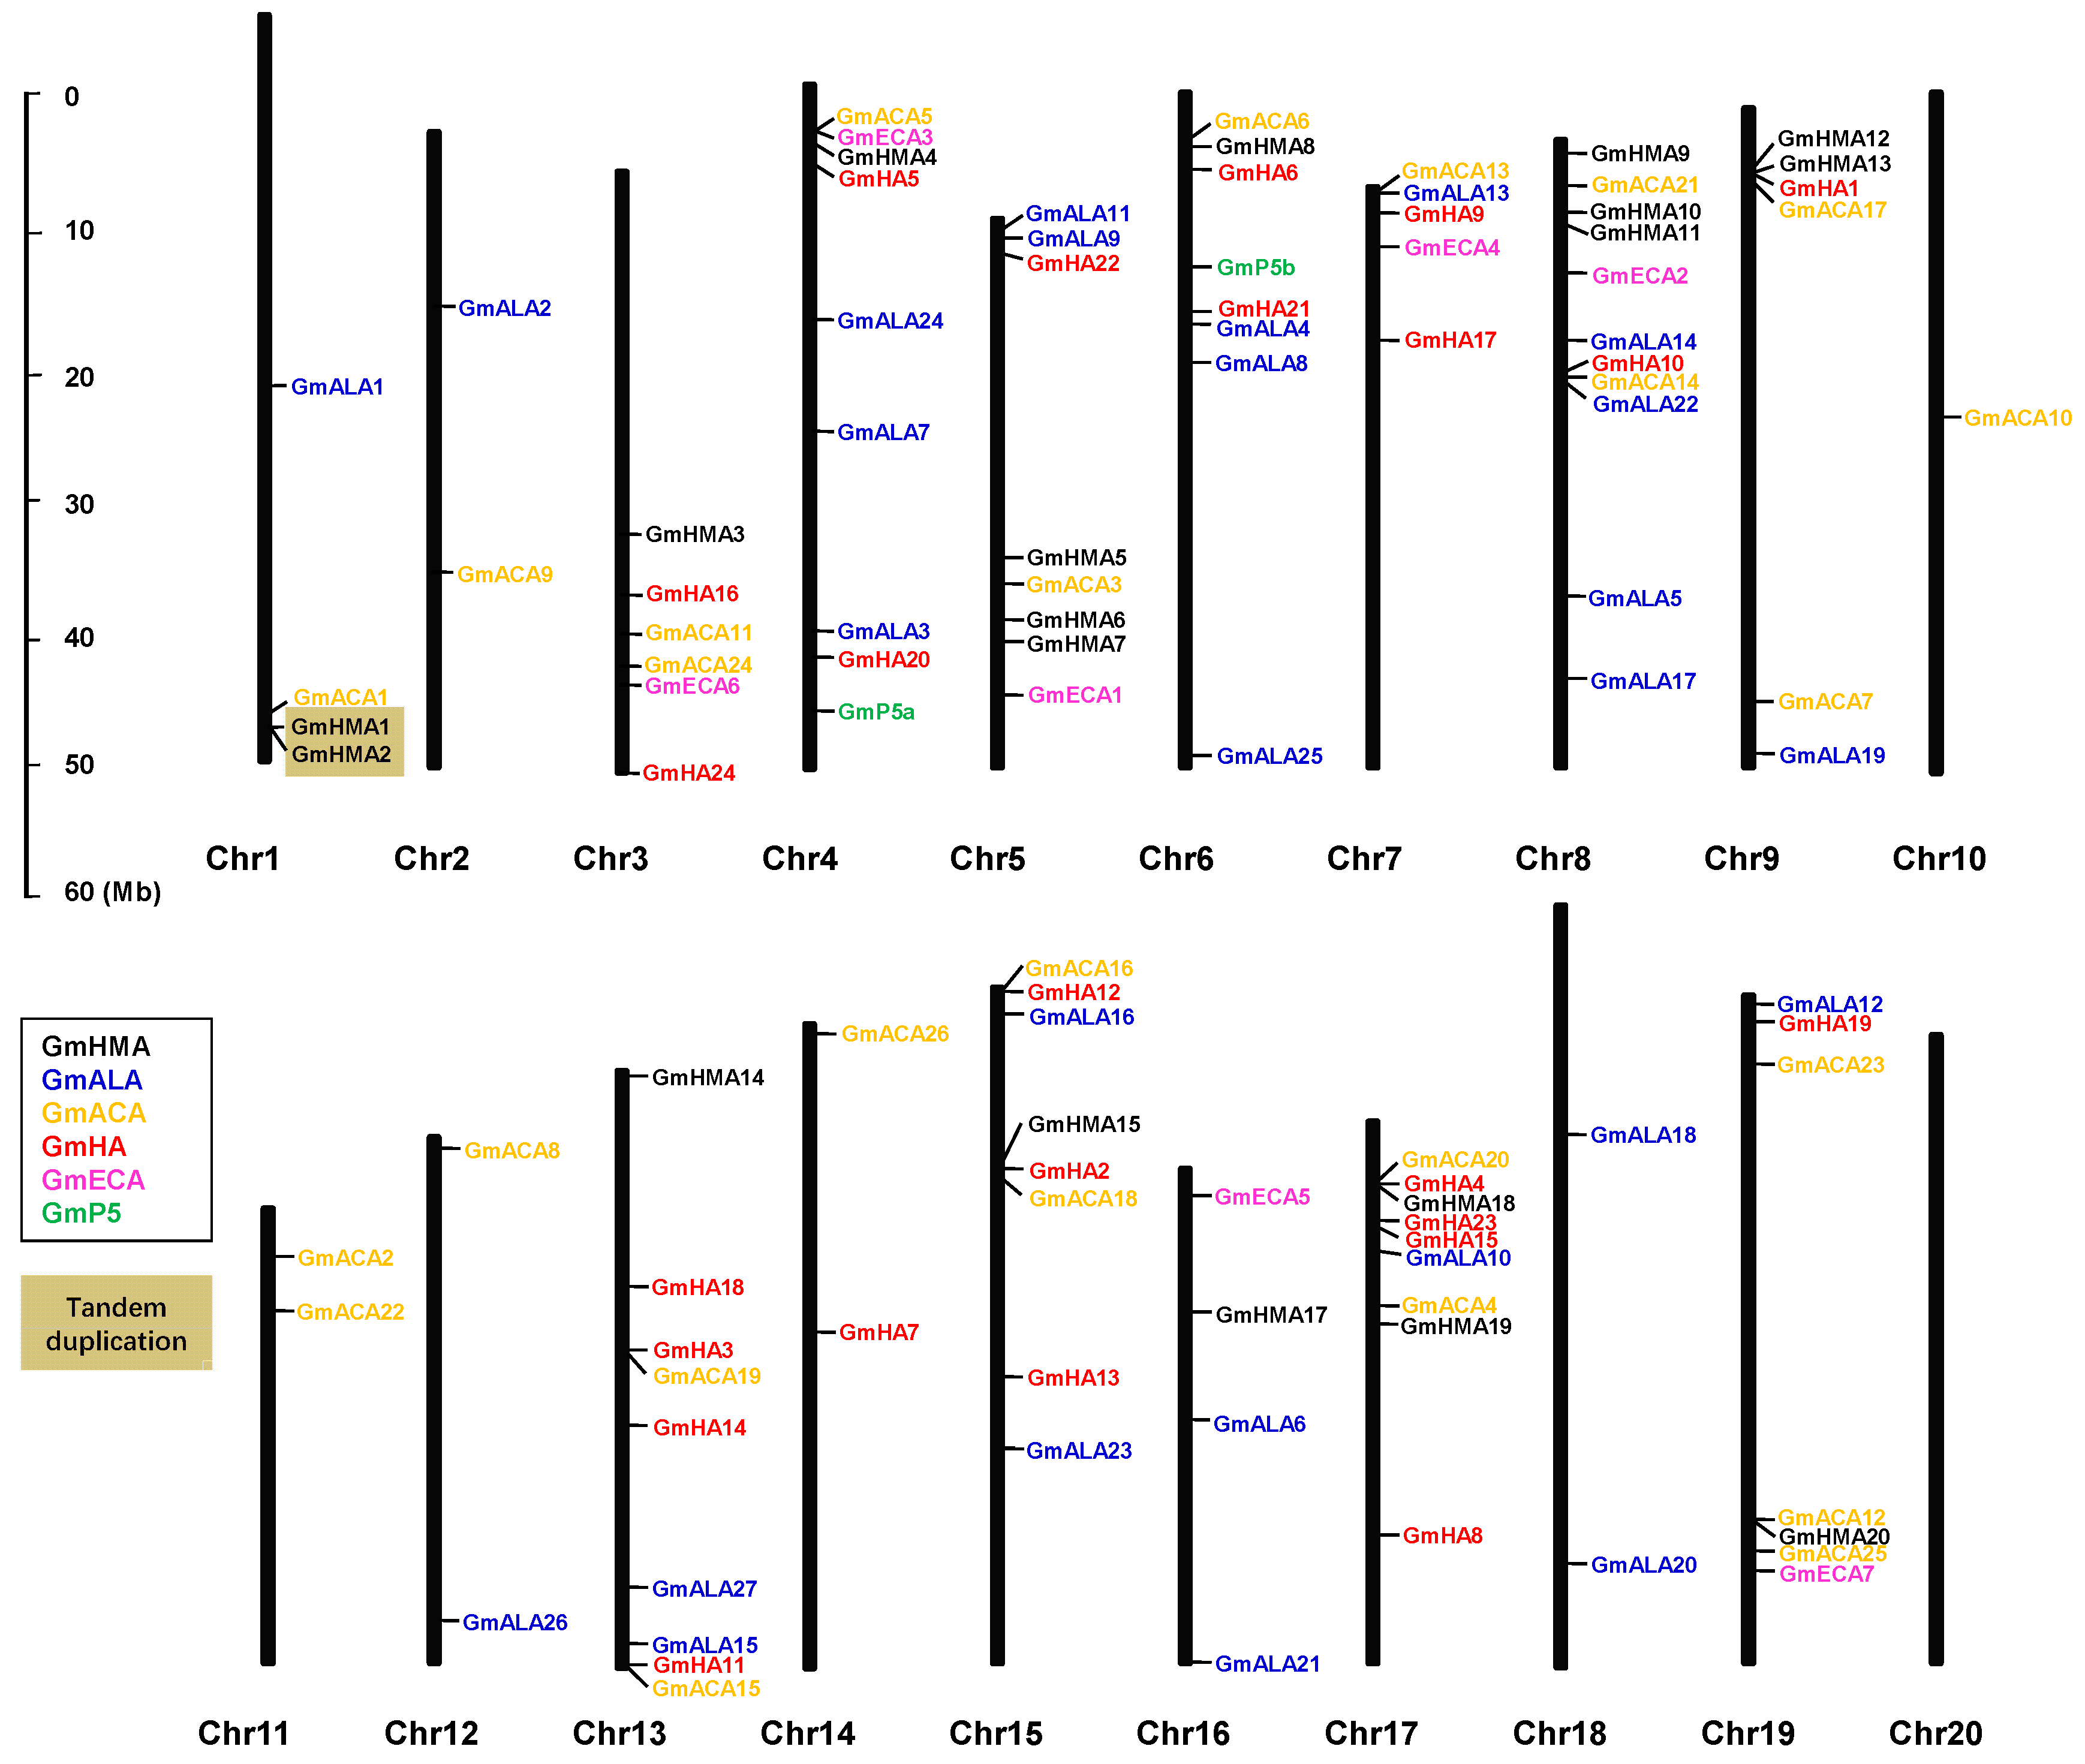
3.7. Chromosomal Distribution and Gene Duplication of Soybean P-Type ATPase Genes

The identified 105 putative genes encoding P-type ATPases were distributed on 19 of the 20 chromosomes in soybean (Figure 10). There is no P-type ATPase gene on chromosome 20. On each of the other 19 chromosomes, the number of P-type ATPase genes ranged from one to eleven; only one gene (GmACA10) was found on chromosome 10, while 11 genes were found on chromosome 8 (Figure 10). The duplication of genes resulted in gene family expansion. GmHMA1 and GmHMA2 were found to be tandem duplicated because their distance is less than 100 kb and no intervening gene was found (Figure 10). In addition, 47 segmentally duplicated gene pairs were identified with higher bootstrap values (>90%) (Table S7). The synonymous substitution rates (Ks), the nonsynonymous substitution rates (Ka) and the Ka/Ks ratio for the 47 duplicated gene pairs indicated high similarities in their coding sequence alignments. The Ks values of these 47 gene pairs ranged from 0.056 for gene pair GmALA26/GmALA27 to 0.372 for gene pair GmACA21/GmACA22 with an average Ks of 0.115 (Table S7). The Ka/Ks of all the 47 duplicated gene pairs were found to be between 0.023 and 0.338 (Table S7), suggesting the influence of purifying selection on the evolution of these gene pairs, because a pair of genes having Ka/Ks < 1 could indicate purifying selection enforcing on the different protein coding genes during the evolution [53]. The duplication time for each gene pairs was calculated based on the divergence rate of λ = 6.1 × 10⁻⁹ proposed for soybean [53]. All the segmentally duplicated gene pairs showed a time frame between 4.59 and 30.52 MYA, having an average time of 9.4 MYA (Table S7).

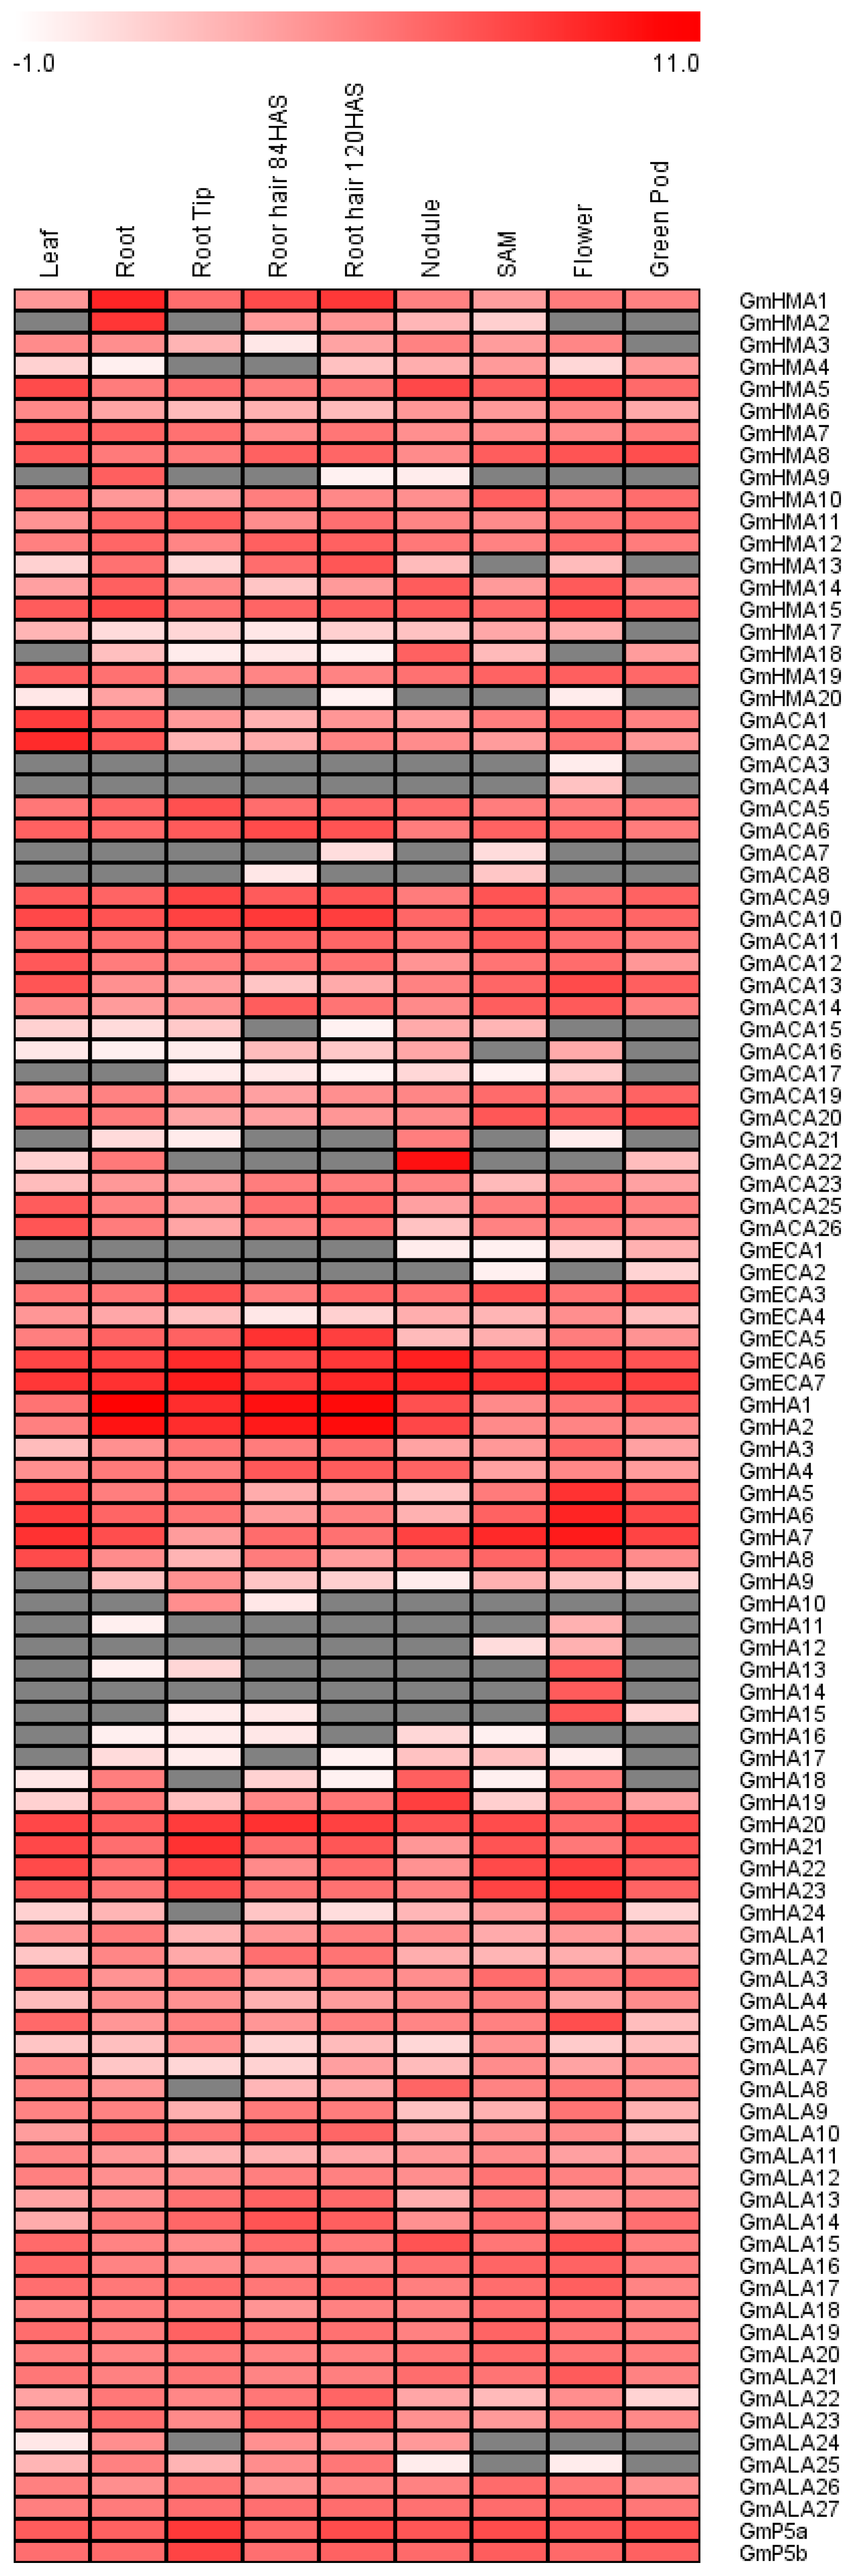
3.8. Tissue Expression Patterns of Soybean P-Type ATPase Genes

The tissue expression patterns of putative genes encoding P-type ATPase proteins in soybean were analyzed by using two published RNA-seq datasets. The first dataset contains nine tissues, i.e., leaves, shoot apical meristem (SAM), flower, green pods, root, root tip, mature nodules, and root hair cells isolated 84 and 120 h after sowing (HAS) [56]. The second dataset contains 14 tissues, i.e., three vegetative tissues (leaves, root, and nodules) and whole seed at 11 stages of reproductive tissue development (flower, pod, and seeds) [55]. In the first dataset, with the exception of GmACA18 and GmACA24, which do not have corresponding locus names of version 1.0 (Wm82.a1.v1, used in the published RNA-seq data), the expression of the other 103 putative P-type ATPase genes could be detected in at least one of the nine tissues (Figure 11 and Table S8), suggesting authentic expression of these identified P-type ATPase genes. In the second dataset, the expression of 93 putative P-type ATPase genes could be detected in at least one of the 14 tissues, while the expression of ten genes (GmHMA20, GmACA3/4/7/8, and GmHA9/10/11/12/16) could not be found (Figure S5). Consistently, the expression of the ten genes showed very low expression levels in tissues of soybean in the first dataset (Figure 11 and Table S8), suggesting that these genes could be expressed under specific conditions and that their functions may be very weak under normal conditions. It is notable that the previously identified GmHMA16 could not be detected in any of these two datasets, suggesting that it is a pseudogene. As shown in both datasets, many genes were expressed ubiquitously in various tissues, such as GmHMA5-8/10-12/14/15/19, GmACA1/2/5/6/9-14/19/20/23/25/26, GmP5a/b, and GmHA3-8/20-23, whereas some genes were tissue-specifically expressed. For example, GmACA3/4, and GmHA11-15 were predominantly expressed in flowers; GmHMA1/2 and GmHA1/2 were strongly expressed in roots; and GmHMA18, GmACA21/22, and GmALA15/16 were predominantly expressed in root nodules (Figure 11 and Figure S5).

3.9. Analysis of Cis-Acting Element in the Promoter Regions of Soybean P-Type ATPase Genes

The presence of 10 classes of cis-elements related to hormonal signal and/or stress responses was surveyed in the 1.5 kb promoter regions upstream from the predicted transcription start sites of these putative P-type ATPase genes. These cis-elements include dehydration and cold response element DRE/CRTE, abscisic acid response element ABRE, ethylene responsive element GCC-box, auxin signaling component ARF1 binding site (AuxRE), salicylic acid-responsive element SARE, phosphate starvation signaling transcription factor PHR1 binding site (P1BS), sulfur-responsive element (SURE), stress-related CAMTA transcription factor binding site CG-box, and stress-related WRKY transcription factor binding site W-box (Table S9) [69,70,71,72,73,74,75,76,77,78]. The positions of cis-elements located in the promoter regions are shown in Table S10. With the exception of GmALA4 and GmALA21, all of the other P-type ATPase genes contained at least one of the ten cis-elements in their promoter regions (Figure S6). More than 60 of these genes contained more than four kinds of cis-elements in their promoters, especially for GmACA20 and GmHA6; each of them contained eight kinds of cis-elements (Figure S6). Among the P-type ATPase genes, more than half of them contained SARE, W-box and/or SURE, while only around 15% of them contained DRE/CRT or P1BS (Figure S6). Some cis-elements have more than one copy in the promoter region. For example, four ABRE elements were found in the promoter of GmHA11; seven SARE elements were found in the promoter of GmACA14; and nine SURE elements were found in the promoter of GmHMA17 (Figure S6 and Table S10).

3.10. Expression Analysis of Soybean P-Type ATPase Genes in Response to Stresses and Rhizobia Inoculation

The expression profiles of soybean P-type ATPase genes in response to various environmental stresses, like salt, drought/dehydration, cold, flooding, and phosphate starvation, were retrieved from published microarray or RNA-seq datasets [57,58,59,60]. Among all the P-type ATPase genes in soybean, the expressions of 51 genes (48.6%) were found to be significantly changed under at least one of these environmental stresses (Figure 12). Five GmHMA genes (GmHMA6/7/10/11/15) were induced by cold, while six GmHMA genes (GmHMA2/5/8/13/14/18) were repressed by salt or dehydration stress. GmACA1/2/23/25 were strongly induced by multiple stresses, like cold, salt and drought. The expression of GmHA1/3/19 was increased, while the expression of GmHA6/16/17/20/21/22/23/24 was repressed under cold, drought, and/or salt stress.
The expression profile of P-type ATPase genes in response to rhizobia (Bradyrhizobium japonicum) inoculation (12–48 h after inoculation (HAI)) was also analyzed in soybean root hairs by acquiring published transcriptome data [61]. With the exception of GmHA12, GmHA14, GmACA4, GmACA22, and GmECA2, almost all of the P-type ATPase genes (98 genes) could be detected in the root hairs with or without rhizobia inoculation (Figure 13 and Table S11). It is interesting that some of these genes were significantly affected during the inoculation of rhizobia. For example, GmHMA2 was significantly induced at 12 and 24 HAI; GmACA19 and GmALA1 were remarkably repressed at 12 HAI and 48 HAI, respectively; and GmALA7 was dramatically increased at 12 HAI (Figure 13).
Two P-type ATPase genes, GmACA1 and GmACA2, were suggested to be responsive to phosphorus deficiency by RNA-seq (Figure 12). In order to confirm their transcriptional responses to phosphorus deficiency, we analyzed their expression patterns under phosphorus deficiency stress in soybean leaves and roots by qRT-PCR. Consistent with the RNA-seq data, GmACA1 and GmACA2 were found to be significantly induced by phosphorus deficiency one day and seven days after phosphorus deficiency treatment in both leaves and roots (Figure 14).

4. Discussion

The P-type ATPase superfamily comprises a large number of ATP-hydrolyzing transporters of cations and phospholipids [1]. Based on their evolutionary relationships and transporting targets, the superfamily genes are divided into five subfamilies, e.g., P1 to P5 [2,3]. Many P-type ATPase genes have been indicated to be involved in various cellular and physiological processes during the whole life of plants [6,7,8,9,37]. The P-type ATPase superfamily genes have been characterized genome-wide in the model plants Arabidopsis and rice, as well as in some other plants [3,12,41,42,79,80,81]. The total number of P-type ATPase genes in Arabidopsis and rice is 47 and 45, respectively [11,12,13]. In this study, a total of 105 genes were identified to encode putative P-type ATPases in the soybean genome (Figure 1 and Tables S1–S6). Phylogenetic analysis suggested that soybean P-type ATPase genes can be grouped into five subfamilies, i.e., P1B, P2A/B, P3A, P4, and P5, which is consistent with that in Arabidopsis and other flowering plants [11,41]. The P2C- and P2D-type Na+ pumps exist in Chlorophyceae (e.g., Ostreococcus tauri and Chlamydomonas reinhardtii) and moss (e.g., Physcomitrella patens) but appear to have been lost in vascular plants [3].
The number of the total P-type ATPase genes in soybean is about 2.2 and 2.3 times higher than that in Arabidopsis and rice, respectively (Figure 2). Soybean is a paleopolyploid with 75% of the genes present in multiple copies [43]. The larger size of the P-type ATPase gene family in soybean could be attributed to the two whole-genome duplication events occurred approximately 59 and 13 MYA [43]. Among the P-type ATPase genes in soybean, one pair of genes (GmHMA1 and GmHMA2) was found to be tandemly duplicated, and 47 pairs of genes were possibly duplicated segmentally (Figure 10 and Table S7). The time frame of segmental duplication of these genes was estimated to be between 4.59 and 30.52 MYA (Table S7). Thus, the whole genome segmental duplication could play a major role in the expansion of P-type ATPase genes during the evolution of soybean. Other gene families like SWEET transporters, calcium transporters, and WRKY transcription factors were also found to be expanded mainly by segmental duplication in the soybean genome [52,66,82]. Duplicated genes could enhance the adaptation to various environmental conditions during the evolution of soybean.
In this study, nearly all of the P-type ATPase genes could be detected in at least one of the soybean tissues and most of them were expressed in multiple tissues (Figure 11 and Figure S5), suggesting that these genes are authentic and that they may have functions during the growth and development of soybean. Some genes in the same subfamily showed different expression patterns in various tissues, suggesting that they may have distinct functions during the growth and development of soybean. It is notable that many of the duplicated gene pairs showed similar tissue expression patterns, suggesting that they may have redundant functions. However, they may have potential different roles at specific developmental stages or under specific environmental stresses. The ion transport of each P-type ATPase is dependent on the ion binding capabilities and affinity constants [15,83]. Further biochemical experiments are needed to address the specific roles of homologous proteins. In addition, a number of genes were found to be constitutively expressed in various tissues (Figure 11 and Figure S5), such as GmHA3-8/20-23, GmHMA5-8/10-12/14/15/19, and GmACA1/2/5/6/9-14/19/20/23/25/26, suggesting that they may have general functions during the whole life of soybean. However, some soybean P-type ATPase genes were expressed in a tissue-specific manner (Figure 11 and Figure S5). The genes predominantly expressed in the flowers, like GmACA3/4 and GmHA11-15, could play potential roles in reproductive growth of soybean. Genes strongly expressed in the roots, like GmHMA1/2 and GmHA1/2, could have putative functions in nutrient uptake and translocation. Some P-type ATPase genes have been suggested to be expressed strongly in specific tissues and to play critical roles in diverse physiological processes, such as stomatal regulation, root development, pollen tube growth, and flower coloration [25,40,84,85,86,87]. For example, Arabidopsis PM H+-ATPase genes AHA1 and AHA2 are the dominating isoforms in the majority of tissues, whereas AHA8, AHA7, AHA6, and AHA9 exhibited high expression levels in pollen [88]. Recently, it has been found that the simultaneous loss of function mutation of AHA6, AHA8, and AHA9 delays pollen germination, causes pollen tube growth defects, and drastically reduces fertility in Arabidopsis [84].
Some P-type ATPase genes play important roles in plant symbiosis with arbuscular mycorrhizal fungi and rhizobial bacteria [89,90,91,92]. For example, Medicago truncatula P2A-ATPase gene MCA8 has been suggested to be critical for the generation of Ca2+ spiking in the nucleus, which is essential for legume symbiosis [91]; tomato PM H+-ATPase SlHA8 is critical for arbuscule development and energizing the periarbuscular membrane for symbiotic phosphate and nitrogen uptake [92]. It is interesting that almost all of the putative P-type ATPase genes could be detected in soybean root hairs with or without rhizobia inoculation (Bradyrhizobium japonicum) (Figure 13). Some genes, like GmHMA18, GmACA21/22, and GmALA15/16 were predominantly expressed in root nodules (Figure 11 and Figure S5). In addition, the expression of some genes, like GmACA19, GmHMA2, and GmALA1/7 were significantly changed at 12 or 24 HAI (Figure 13). These results suggest that P-type ATPase genes could participate in the establishment of symbiosis and nodule development in soybean. Further research is needed to investigate their potential roles in symbiosis.
The production of soybean all over the world is frequently influenced by various environmental stresses. By retrieving published microarray and RNA-seq transcriptome data, the expression of 51 putative P-type ATPase genes was found to be remarkably affected by environmental stresses like salt, drought, cold, flooding, and/or phosphate starvation. These genes included five GmHMA genes (GmHMA6/7/10/11/15) that were induced by cold; six GmHMA genes (GmHMA2/5/8/13/14/18) that were repressed by salt or dehydration; four GmACA genes (GmACA1/2/23/25) and three GmHA genes (GmHA1/3/19) that were induced cold, salt, and/or drought; and eight GmHA genes (GmHA6/16/17/20/21/22/23/24) that were repressed by cold, drought, and/or salt (Figure 12). Modification of the expression of HMA genes could affect the transport and distribution of Cu and Zn in plant cells and could further affect the activities of Cn/Zn superoxide dismutase, which are closely related to stress tolerance. Many P-type ATPase genes have been indicated to be involved in stress response and tolerance in plants [26,39,93,94]. For example, AtHMA1, an Arabidopsis P1B-type ATPase localized in the chloroplast envelope, is involved in Cu and Zn transport, and the loss of function mutant hma1 is sensitive to high light and excess Zn stress [95,96]; rice OsACA6 is involved in salt and drought tolerance by increasing reactive oxygen species scavenging [24]; and PM H+-ATPase plays a key role in salt and alkali resistance [97,98]. Ca2+ signals play a very important role in plant response and tolerance to various stresses. The Ca2+-ATPase has been indicated to be associated with the generation of Ca2+ signaling and cellular Ca2+ homeostasis [8]. It is interesting that many Ca2+-ATPase genes were found to be induced by stresses like salt, cold, drought, and phosphate starvation (Figure 12). By using qRT-PCR, GmACA1 and GmACA2 were confirmed to be induced by phosphate starvation after treatment for short and moderate periods (Figure 13). Similarly, the expression of a tomato Ca2+-ATPase gene LCA1 was also increased by phosphate starvation [99]. Whether the induction of Ca2+-ATPase genes is involved in the generation of Ca2+ signaling under phosphate starvation, and whether the increased expression of specific Ca2+-ATPases can enhance phosphate starvation adaptation deserve further investigations.

5. Conclusions

In this study, 105 putative P-type ATPase genes were identified in the soybean genome. According to the phylogenetic relationships and the conserved protein domains, they were classified into five subfamilies. All of the P-type ATPase genes identified included nineteen P1B, seven P2A, twenty-six P2B, twenty-four P3A, twenty-seven P4, and two P5 genes. Comprehensive bioinformatic and expression analyses of the P-type ATPase superfamily provide a foundation for future exploration of the potential cellular and physiological functions of P-type ATPase genes in growth and development, symbiosis establishment, and environmental stress tolerance in soybean. Considering the important roles of P-type ATPases in stress resistance and nutrient utilization in model plants like Arabidopsis and rice, further research is needed to develop stress-resistant and nutrient-efficient plants by modulating the expression of P-type ATPase genes in soybean.

Supplementary Materials

The following data is available online at https://www.mdpi.com/2073-4395/11/1/71/s1. Figure S1: Schematic representation of functional domains of soybean P1B subfamily proteins; Figure S2: Schematic representation of functional domains of soybean P3A subfamily proteins; Figure S3: Alignment of the amino acid sequences of 24 soybean PM H+-ATPases and three representative PM H+-ATPases from Arabidopsis and rice (AHA2, AHA8, and OsA1); Figure S4: Alignment of the amino acid sequences of P5 ATPases from soybean, Arabidopsis, and rice; Figure S5: Heat map representation for tissue-specific expression patterns of the predicted P-type ATPase family genes in soybean according to Illumina RNA sequencing data (https://www.soybase.org/soyseq/); Figure S6: The distribution of cis-elements in the 1.5 kb promoter regions of soybean P-type ATPase family genes, Table S1: A list of all the putative genes encoding P-type ATPase proteins in the soybean genome; Table S2: A list of putative P1B subfamily ATPase genes and their sequence details in soybean; Table S3: A list of putative P2 subfamily ATPase genes and their sequence details in soybean; Table S4: A list of putative P3 subfamily ATPase genes and their sequence details in soybean; Table S5: A list of putative P4 subfamily ATPase genes and their sequence details in soybean; Table S6: A list of putative P5 subfamily ATPase genes and their sequence details in soybean; Table S7: Identification of substitution rates for soybean P-type ATPase superfamily gene pairs; Table S8: Expression patterns of soybean P-type ATPase genes in 9 different tissues; Table S9: Summary of cis-acting elements that are related to plant hormone and stress response; Table S10: Distribution of hormone- and stress-related cis-elements in promoters of putative P-type ATPase genes in soybean; Table S11: Expression pattern of soybean P-type ATPase genes in root hair (RH) and stripped roots in response to B. japonicum.

Author Contributions

H.Z. and H.C. conceived the study and wrote the manuscript. B.Z., H.W., W.X., W.Z. and H.Z. performed the bioinformatic analyses and the experiments. H.Z., X.C. and Y.Z. analyzed the data. All authors have read and agreed to the published version of the manuscript.

Funding

This work was supported by the National Key Research and Development Program of China (No. 2018YFE0112200), the Zhejiang Provincial Natural Science Foundation of China (No. LY20C150002), the Key Research and Development Project of Jiangsu Province (No. BE2019376), and the Agriculture Project of Hangzhou Science and Technology Bureau (No. 20180432B11).

Institutional Review Board Statement

Not applicable.

Informed Consent Statement

Not applicable.

Data Availability Statement

Not applicable.

Conflicts of Interest

The authors declare no conflict of interest.

References

  1. Palmgren, M.G.; Nissen, P. P-Type ATPases. Annu. Rev. Biophys. 2011, 40, 243–266. [Google Scholar] [CrossRef] [PubMed]
  2. Axelsen, B.K.; Palmgren, G.M. Evolution of Substrate Specificities in the P-Type ATPase Superfamily. J. Mol. Evol. 1998, 46, 84–101. [Google Scholar] [CrossRef] [PubMed]
  3. Pedersen, C.N.; Axelsen, K.B.; Harper, J.F.; Palmgren, M.G. Evolution of plant P-type ATPases. Front. Plant Sci. 2012, 3, 31. [Google Scholar] [CrossRef] [PubMed] [Green Version]
  4. Palmgren, M.; Østerberg, J.T.; Nintemann, S.J.; Poulsen, L.R.; López-Marqués, R.L. Evolution and a revised nomenclature of P4 ATPases, a eukaryotic family of lipid flippases. Biochim. Et Biophys. Acta (Bba) Biomembr. 2019, 1861, 1135–1151. [Google Scholar] [CrossRef]
  5. Sørensen, D.M.; Holen, H.W.; Holemans, T.; Vangheluwe, P.; Palmgren, M.G. Towards defining the substrate of orphan P5A-ATPases. Biochim. Et Biophys. Acta (Bba) Gen. Subj. 2015, 1850, 524–535. [Google Scholar]
  6. Inoue, S.I.; Kinoshita, T. Blue Light Regulation of Stomatal Opening and the Plasma Membrane H(+)-ATPase. Plant Physiol. 2017, 174, 531–538. [Google Scholar] [CrossRef] [Green Version]
  7. Falhof, J.; Pedersen, J.T.; Fuglsang, A.T.; Palmgren, M. Plasma Membrane H(+)-ATPase Regulation in the Center of Plant Physiology. Mol. Plant 2016, 9, 323–337. [Google Scholar] [CrossRef] [Green Version]
  8. Huda, K.M.K.; Banu, M.S.A.; Tuteja, R.; Tuteja, N. Global calcium transducer P-type Ca2+-ATPases open new avenues for agriculture by regulating stress signalling. J. Exp. Bot. 2013, 64, 3099–3109. [Google Scholar] [CrossRef]
  9. Williams, L.E.; Mills, R.F. P1B-ATPases—An ancient family of transition metal pumps with diverse functions in plants. Trends Plant Sci. 2005, 10, 491–502. [Google Scholar] [CrossRef]
  10. Poulsen, L.R.; Lopez-Marques, R.L.; McDowell, S.C.; Okkeri, J.; Licht, D.; Schulz, A.; Pomorski, T.; Harper, J.F.; Palmgren, M.G. The Arabidopsis P4-ATPase ALA3 localizes to the golgi and requires a beta-subunit to function in lipid translocation and secretory vesicle formation. Plant Cell 2008, 20, 658–676. [Google Scholar] [CrossRef] [Green Version]
  11. Baxter, I.; Tchieu, J.; Sussman, M.R.; Boutry, M.; Palmgren, M.G.; Gribskov, M.; Harper, J.F.; Axelsen, K.B. Genomic comparison of P-type ATPase ion pumps in Arabidopsis and rice. Plant Physiol. 2003, 132, 618–628. [Google Scholar] [CrossRef] [PubMed] [Green Version]
  12. Axelsen, K.B.; Palmgren, M.G. Inventory of the superfamily of P-type ion pumps in Arabidopsis. Plant Physiol. 2001, 126, 696–706. [Google Scholar] [CrossRef] [PubMed] [Green Version]
  13. Huda, K.M.K.; Yadav, S.; Akhter Banu, M.S.; Trivedi, D.K.; Tuteja, N. Genome-wide analysis of plant-type II Ca(2+)ATPases gene family from rice and Arabidopsis: Potential role in abiotic stresses. Plant Physiol. Biochem. Ppb Soc. Fr. Physiol. Veg. 2013, 65, 32–47. [Google Scholar] [CrossRef] [PubMed]
  14. Rensing, C.; Ghosh, M.; Rosen, B.P. Families of Soft-Metal-Ion-Transporting ATPases. J. Bacteriol. 1999, 181, 5891. [Google Scholar] [CrossRef] [PubMed] [Green Version]
  15. Argüello, J.M.; Eren, E.; González-Guerrero, M. The structure and function of heavy metal transport P1B-ATPases. Biometals 2007, 20, 233. [Google Scholar] [CrossRef]
  16. Huang, X.-Y.; Deng, F.; Yamaji, N.; Pinson, S.R.; Fujii-Kashino, M.; Danku, J.; Douglas, A.; Guerinot, M.L.; Salt, D.E.; Ma, J.F. A heavy metal P-type ATPase OsHMA4 prevents copper accumulation in rice grain. Nat. Commun. 2016, 7, 12138. [Google Scholar] [CrossRef] [Green Version]
  17. Morel, M.; Crouzet, J.; Gravot, A.; Auroy, P.; Leonhardt, N.; Vavasseur, A.; Richaud, P. AtHMA3, a P1B-ATPase allowing Cd/Zn/Co/Pb vacuolar storage in Arabidopsis. Plant Physiol. 2009, 149, 894–904. [Google Scholar] [CrossRef] [Green Version]
  18. Eren, E.; Argüello, J.M. Arabidopsis HMA2, a divalent heavy metal-transporting P(IB)-type ATPase, is involved in cytoplasmic Zn2+ homeostasis. Plant Physiol. 2004, 136, 3712–3723. [Google Scholar] [CrossRef] [Green Version]
  19. Takahashi, R.; Bashir, K.; Ishimaru, Y.; Nishizawa, N.K.; Nakanishi, H. The role of heavy-metal ATPases, HMAs, in zinc and cadmium transport in rice. Plant Signal. Behav. 2012, 7, 1605–1607. [Google Scholar] [CrossRef]
  20. Cai, H.; Huang, S.; Che, J.; Yamaji, N.; Ma, J.F. The tonoplast-localized transporter OsHMA3 plays an important role in maintaining Zn homeostasis in rice. J. Exp. Bot. 2019, 70, 2717–2725. [Google Scholar] [CrossRef] [Green Version]
  21. Bonza, M.C.; De Michelis, M.I. The plant Ca2+-ATPase repertoire: Biochemical features and physiological functions. Plant Biol. 2011, 13, 421–430. [Google Scholar] [CrossRef] [PubMed]
  22. Bonza, M.C.; Morandini, P.; Luoni, L.; Geisler, M.; Palmgren, M.G.; De Michelis, M.I. At-ACA8 encodes a plasma membrane-localized calcium-ATPase of Arabidopsis with a calmodulin-binding domain at the N terminus. Plant Physiol. 2000, 123, 1495–1506. [Google Scholar] [CrossRef] [PubMed] [Green Version]
  23. Chung, W.S.; Lee, S.H.; Kim, J.C.; Heo, W.D.; Kim, M.C.; Park, C.Y.; Park, H.C.; Lim, C.O.; Kim, W.B.; Harper, J.F.; et al. Identification of a calmodulin-regulated soybean Ca(2+)-ATPase (SCA1) that is located in the plasma membrane. Plant Cell 2000, 12, 1393–1407. [Google Scholar] [CrossRef] [PubMed]
  24. Huda, K.M.; Banu, M.; Akhter, S.; Garg, B.; Tula, S.; Tuteja, R.; Tuteja, N. OsACA6, a P-type IIB Ca2+ ATPase promotes salinity and drought stress tolerance in tobacco by ROS scavenging and enhancing stress-responsive genes. Plant J. 2013, 76, 997–1015. [Google Scholar] [CrossRef] [PubMed]
  25. Schiøtt, M.; Romanowsky, S.M.; Baekgaard, L.; Jakobsen, M.K.; Palmgren, M.G.; Harper, J.F. A plant plasma membrane Ca2+ pump is required for normal pollen tube growth and fertilization. Proc. Natl. Acad. Sci. USA 2004, 101, 9502–9507. [Google Scholar] [CrossRef] [PubMed] [Green Version]
  26. Sun, M.; Jia, B.; Cui, N.; Wen, Y.; Duanmu, H.; Yu, Q.; Xiao, J.; Sun, X.; Zhu, Y. Functional characterization of a Glycine soja Ca2+ATPase in salt–alkaline stress responses. Plant Mol. Biol. 2016, 90, 419–434. [Google Scholar] [CrossRef]
  27. Hilleary, R.; Paez-Valencia, J.; Vens, C.; Toyota, M.; Palmgren, M.; Gilroy, S. Tonoplast-localized Ca(2+) pumps regulate Ca(2+) signals during pattern-triggered immunity in Arabidopsis thaliana. Proc. Natl. Acad. Sci. USA 2020, 117, 18849–18857. [Google Scholar] [CrossRef]
  28. Palmgren, M.G. Plant Plasma Membrane H+-ATPases: Powerhouses for Nutrient Uptake. Annu. Rev. Plant Physiol. Plant Mol. Biol. 2001, 52, 817–845. [Google Scholar] [CrossRef] [Green Version]
  29. Arango, M.; Gevaudant, F.; Oufattole, M.; Boutry, M. The plasma membrane proton pump ATPase: The significance of gene subfamilies. Planta 2003, 216, 355–365. [Google Scholar] [CrossRef]
  30. Duby, G.; Boutry, M. The plant plasma membrane proton pump ATPase: A highly regulated P-type ATPase with multiple physiological roles. Pflug Arch. Eur. J. Physiol. 2009, 457, 645–655. [Google Scholar] [CrossRef]
  31. Kinoshita, T.; Shimazaki, K. Blue light activates the plasma membrane H(+)-ATPase by phosphorylation of the C-terminus in stomatal guard cells. Embo J. 1999, 18, 5548–5558. [Google Scholar] [CrossRef] [Green Version]
  32. Olsson, A.; Svennelid, F.; Ek, B.; Sommarin, M.; Larsson, C. A phosphothreonine residue at the C-terminal end of the plasma membrane H+-ATPase is protected by fusicoccin-induced 14-3-3 binding. Plant Physiol. 1998, 118, 551–555. [Google Scholar] [CrossRef] [Green Version]
  33. Zeng, H.Q.; Di, T.J.; Zhu, Y.Y.; Subbarao, G.V. Transcriptional response of plasma membrane H+-ATPase genes to ammonium nutrition and its functional link to the release of biological nitrification inhibitors from sorghum roots. Plant Soil 2016, 398, 301–312. [Google Scholar] [CrossRef]
  34. Yan, F.; Zhu, Y.; Muller, C.; Zorb, C.; Schubert, S. Adaptation of H+-pumping and plasma membrane H+ ATPase activity in proteoid roots of white lupin under phosphate deficiency. Plant Physiol. 2002, 129, 50–63. [Google Scholar] [CrossRef] [Green Version]
  35. Takahashi, K.; Hayashi, K.-I.; Kinoshita, T. Auxin activates the plasma membrane H+-ATPase by phosphorylation during hypocotyl elongation in Arabidopsis. Plant Physiol. 2012, 159, 632–641. [Google Scholar] [CrossRef] [Green Version]
  36. Zhang, M.X.; Ding, M.; Xu, F.Y.; Afzal, M.R.; Chen, X.; Zeng, H.Q.; Yan, F.; Zhu, Y.Y. Involvement of plasma membrane H+-ATPase in the ammonium-nutrition response of barley roots. J. Plant Nutr. Soil Sci. 2018, 181, 878–885. [Google Scholar] [CrossRef]
  37. Lopez-Marques, R.L.; Theorin, L.; Palmgren, M.G.; Pomorski, T.G. P4-ATPases: Lipid flippases in cell membranes. Pflug. Arch. Eur. J. Physiol. 2014, 466, 1227–1240. [Google Scholar] [CrossRef] [Green Version]
  38. Baldridge, R.D.; Graham, T.R. Identification of residues defining phospholipid flippase substrate specificity of type IV P-type ATPases. Proc. Natl. Acad. Sci. USA 2012, 109, E290–E298. [Google Scholar] [CrossRef] [Green Version]
  39. Gomès, E.; Jakobsen, M.K.; Axelsen, K.B.; Geisler, M.; Palmgren, M.G. Chilling Tolerance in Arabidopsis Involves ALA1, a Member of a New Family of Putative Aminophospholipid Translocases. Plant Cell 2000, 12, 2441. [Google Scholar] [CrossRef]
  40. Poulsen, L.R.; López-Marqués, R.L.; Pedas, P.R.; McDowell, S.C.; Brown, E.; Kunze, R.; Harper, J.F.; Pomorski, T.G.; Palmgren, M. A phospholipid uptake system in the model plant Arabidopsis thaliana. Nat. Commun. 2015, 6, 7649. [Google Scholar] [CrossRef] [Green Version]
  41. Zhang, Y.; Li, Q.; Xu, L.; Qiao, X.; Liu, C.; Zhang, S. Comparative analysis of the P-type ATPase gene family in seven Rosaceae species and an expression analysis in pear (Pyrus bretschneideri Rehd.). Genomics 2020, 112, 2550–2563. [Google Scholar] [CrossRef]
  42. Chen, W.; Si, G.-Y.; Zhao, G.; Abdullah, M.; Guo, N.; Li, D.-H.; Sun, X.; Cai, Y.-P.; Lin, Y.; Gao, J.-S. Genomic Comparison of the P-ATPase Gene Family in Four Cotton Species and Their Expression Patterns in Gossypium hirsutum. Molecules 2018, 23, 5. [Google Scholar] [CrossRef] [Green Version]
  43. Schmutz, J.; Cannon, S.B.; Schlueter, J.; Ma, J.; Mitros, T.; Nelson, W.; Hyten, D.L.; Song, Q.; Thelen, J.J.; Cheng, J.; et al. Genome sequence of the palaeopolyploid soybean. Nature 2010, 463, 178–183. [Google Scholar] [CrossRef] [Green Version]
  44. Chan, C.; Qi, X.; Li, M.-W.; Wong, F.-L.; Lam, H.-M. Recent Developments of Genomic Research in Soybean. J. Genet. Genom. 2012, 39, 317–324. [Google Scholar] [CrossRef]
  45. Liu, S.; Zhang, M.; Feng, F.; Tian, Z. Toward a “Green Revolution” for Soybean. Mol. Plant 2020, 13, 688–697. [Google Scholar] [CrossRef]
  46. Potter, S.C.; Luciani, A.; Eddy, S.R.; Park, Y.; Lopez, R.; Finn, R.D. HMMER web server: 2018 update. Nucleic Acids Res. 2018, 46, W200–W204. [Google Scholar] [CrossRef] [Green Version]
  47. Hunter, S.; Apweiler, R.; Attwood, T.K.; Bairoch, A.; Bateman, A.; Binns, D.; Bork, P.; Das, U.; Daugherty, L.; Duquenne, L.; et al. InterPro: The integrative protein signature database. Nucleic Acids Res. 2009, 37 (Suppl. 1), D211–D215. [Google Scholar] [CrossRef] [Green Version]
  48. Krogh, A.; Larsson, B.; von Heijne, G.; Sonnhammer, E.L.L. Predicting transmembrane protein topology with a hidden markov model: Application to complete genomes11Edited by F. Cohen. J. Mol. Biol. 2001, 305, 567–580. [Google Scholar] [CrossRef] [Green Version]
  49. Tamura, K.; Stecher, G.; Peterson, D.; Filipski, A.; Kumar, S. MEGA6: Molecular Evolutionary Genetics Analysis version 6.0. Mol. Biol. Evol. 2013, 30, 2725–2729. [Google Scholar] [CrossRef] [Green Version]
  50. Lee, T.H.; Tang, H.; Wang, X.; Paterson, A.H. PGDD: A database of gene and genome duplication in plants. Nucleic Acids Res. 2013, 41, D1152–D1158. [Google Scholar] [CrossRef]
  51. Zeng, H.; Zhang, Y.; Zhang, X.; Pi, E.; Zhu, Y. Analysis of EF-Hand proteins in soybean genome suggests their potential roles in environmental and nutritional stress signaling. Front. Plant Sci. 2017, 8, 877. [Google Scholar] [CrossRef] [Green Version]
  52. Patil, G.; Valliyodan, B.; Deshmukh, R.; Prince, S.; Nicander, B.; Zhao, M.; Sonah, H.; Song, L.; Lin, L.; Chaudhary, J.; et al. Soybean (Glycine max) SWEET gene family: Insights through comparative genomics, transcriptome profiling and whole genome re-sequence analysis. BMC Genom. 2015, 16, 520. [Google Scholar] [CrossRef] [Green Version]
  53. Lynch, M.; Conery, J.S. The evolutionary fate and consequences of duplicate genes. Science 2000, 290, 1151–1155. [Google Scholar] [CrossRef] [Green Version]
  54. Chen, C.; Chen, H.; Zhang, Y.; Thomas, H.R.; Frank, M.H.; He, Y.; Xia, R. TBtools: An Integrative Toolkit Developed for Interactive Analyses of Big Biological Data. Mol. Plant 2020, 13, 1194–1202. [Google Scholar] [CrossRef]
  55. Severin, A.J.; Woody, J.L.; Bolon, Y.-T.; Joseph, B.; Diers, B.W.; Farmer, A.D.; Muehlbauer, G.J.; Nelson, R.T.; Grant, D.; Specht, J.E. RNA-Seq Atlas of Glycine max: A guide to the soybean transcriptome. BMC Plant Biol. 2010, 10, 160. [Google Scholar] [CrossRef] [Green Version]
  56. Libault, M.; Farmer, A.; Joshi, T.; Takahashi, K.; Langley, R.J.; Franklin, L.D.; He, J.; Xu, D.; May, G.; Stacey, G. An integrated transcriptome atlas of the crop model Glycine max, and its use in comparative analyses in plants. Plant J. 2010, 63, 86–99. [Google Scholar] [CrossRef]
  57. Belamkar, V.; Weeks, N.T.; Bharti, A.K.; Farmer, A.D.; Graham, M.A.; Cannon, S.B. Comprehensive characterization and RNA-Seq profiling of the HD-Zip transcription factor family in soybean (Glycine max) during dehydration and salt stress. BMC Genom. 2014, 15, 950. [Google Scholar] [CrossRef] [Green Version]
  58. Maruyama, K.; Todaka, D.; Mizoi, J.; Yoshida, T.; Kidokoro, S.; Matsukura, S.; Takasaki, H.; Sakurai, T.; Yamamoto, Y.Y.; Yoshiwara, K.; et al. Identification of cis-acting promoter elements in cold- and dehydration-induced transcriptional pathways in Arabidopsis, rice, and soybean. DNA Res. Int. J. Rapid Publ. Rep. Genes Genomes 2012, 19, 37–49. [Google Scholar] [CrossRef]
  59. Chen, W.; Yao, Q.; Patil, G.B.; Agarwal, G.; Deshmukh, R.K.; Lin, L.; Wang, B.; Wang, Y.; Prince, S.J.; Song, L.; et al. Identification and Comparative Analysis of Differential Gene Expression in Soybean Leaf Tissue under Drought and Flooding Stress Revealed by RNA-Seq. Front. Plant Sci. 2016, 7, 1044. [Google Scholar] [CrossRef] [Green Version]
  60. Zeng, H.Q.; Wang, G.P.; Zhang, Y.Q.; Hu, X.Y.; Pi, E.X.; Zhu, Y.Y.; Wang, H.Z.; Du, L.Q. Genome-wide identification of phosphate-deficiency-responsive genes in soybean roots by high-throughput sequencing. Plant Soil 2016, 398, 207–227. [Google Scholar] [CrossRef]
  61. Libault, M.; Farmer, A.; Brechenmacher, L.; Drnevich, J.; Langley, R.J.; Bilgin, D.D.; Radwan, O.; Neece, D.J.; Clough, S.J.; May, G.D.; et al. Complete transcriptome of the soybean root hair cell, a single-cell model, and its alteration in response to Bradyrhizobium japonicum infection. Plant Physiol. 2010, 152, 541–552. [Google Scholar] [CrossRef] [PubMed] [Green Version]
  62. Medina-Rivera, A.; Defrance, M.; Sand, O.; Herrmann, C.; Castro-Mondragon, J.A.; Delerce, J.; Jaeger, S.; Blanchet, C.; Vincens, P.; Caron, C.; et al. RSAT 2015: Regulatory Sequence Analysis Tools. Nucleic Acids Res. 2015, 43, W50–W56. [Google Scholar] [CrossRef]
  63. Zeng, H.; Zhang, X.; Zhang, X.; Pi, E.; Xiao, L.; Zhu, Y. Early Transcriptomic Response to Phosphate Deprivation in Soybean Leaves as Revealed by RNA-Sequencing. Int. J. Mol. Sci. 2018, 19, 2145. [Google Scholar] [CrossRef] [Green Version]
  64. Zeng, H.; Zhang, X.; Ding, M.; Zhang, X.; Zhu, Y. Transcriptome profiles of soybean leaves and roots in response to zinc deficiency. Physiol. Plant 2019, 167, 330–351. [Google Scholar] [CrossRef] [Green Version]
  65. Fang, X.; Wang, L.; Deng, X.; Wang, P.; Ma, Q.; Nian, H.; Wang, Y.; Yang, C. Genome-wide characterization of soybean P1B -ATPases gene family provides functional implications in cadmium responses. BMC Genom. 2016, 17, 376. [Google Scholar] [CrossRef] [Green Version]
  66. Zeng, H.; Zhao, B.; Wu, H.; Zhu, Y.; Chen, H. Comprehensive in Silico Characterization and Expression Profiling of Nine Gene Families Associated with Calcium Transport in Soybean. Agronomy 2020, 10, 1539. [Google Scholar] [CrossRef]
  67. Palmgren, M.; Sommarin, M.; Serrano, R.; Larsson, C. Identification of an autoinhibitory domain in the C-terminal region of the plant plasma membrane H(+)-ATPase. J. Biol. Chem. 1991, 266, 20470–20475. [Google Scholar]
  68. Kinoshita, T.; Shimazaki, K.-I. Biochemical evidence for the requirement of 14-3-3 protein binding in activation of the guard-cell plasma membrane H+-ATPase by blue light. Plant Cell Physiol. 2002, 43, 1359–1365. [Google Scholar] [CrossRef] [Green Version]
  69. Yang, T.; Poovaiah, B.W. A calmodulin-binding/CGCG box DNA-binding protein family involved in multiple signaling pathways in plants. J. Biol. Chem. 2002, 277, 45049–45058. [Google Scholar] [CrossRef] [Green Version]
  70. Sakuma, Y.; Liu, Q.; Dubouzet, J.G.; Abe, H.; Shinozaki, K.; Yamaguchi-Shinozaki, K. DNA-Binding Specificity of the ERF/AP2 Domain of Arabidopsis DREBs, Transcription Factors Involved in Dehydration- and Cold-Inducible Gene Expression. Biochem. Biophys. Res. Commun. 2002, 290, 998–1009. [Google Scholar] [CrossRef]
  71. Osakabe, Y.; Yamaguchi-Shinozaki, K.; Shinozaki, K.; Tran, L.S. ABA control of plant macroelement membrane transport systems in response to water deficit and high salinity. New Phytol. 2014, 202, 35–49. [Google Scholar] [CrossRef]
  72. Ulmasov, T.; Hagen, G.; Guilfoyle, T.J. ARF1, a Transcription Factor That Binds to Auxin Response Elements. Science 1997, 276, 1865. [Google Scholar] [CrossRef]
  73. Williams, M.E.; Foster, R.; Chua, N.H. Sequences flanking the hexameric G-box core CACGTG affect the specificity of protein binding. Plant Cell 1992, 4, 485–496. [Google Scholar]
  74. Rubio, V.; Linhares, F.; Solano, R.; Martin, A.C.; Iglesias, J.; Leyva, A.; Paz-Ares, J. A conserved MYB transcription factor involved in phosphate starvation signaling both in vascular plants and in unicellular algae. Genes Dev. 2001, 15, 2122–2133. [Google Scholar] [CrossRef] [Green Version]
  75. Maruyama-Nakashita, A.; Nakamura, Y.; Watanabe-Takahashi, A.; Inoue, E.; Yamaya, T.; Takahashi, H. Identification of a novel cis-acting element conferring sulfur deficiency response in Arabidopsis roots. Plant J. 2005, 42, 305–314. [Google Scholar] [CrossRef]
  76. Chen, L.; Song, Y.; Li, S.; Zhang, L.; Zou, C.; Yu, D. The role of WRKY transcription factors in plant abiotic stresses. Biochim. Et Biophys. Acta 2012, 1819, 120–128. [Google Scholar] [CrossRef] [PubMed]
  77. Pieterse, C.M.J.; Van Loon, L.C. NPR1: The spider in the web of induced resistance signaling pathways. Curr. Opin. Plant Biol. 2004, 7, 456–464. [Google Scholar] [CrossRef] [PubMed] [Green Version]
  78. Manzara, T.; Carrasco, P.; Gruissem, W. Developmental and organ-specific changes in promoter DNA-protein interactions in the tomato rbcS gene family. Plant Cell 1991, 3, 1305. [Google Scholar] [PubMed] [Green Version]
  79. Li, N.; Xiao, H.; Sun, J.; Wang, S.; Wang, J.; Chang, P.; Zhou, X.; Lei, B.; Lu, K.; Luo, F.; et al. Genome-wide analysis and expression profiling of the HMA gene family in Brassica napus under cd stress. Plant Soil. 2018, 426, 365–381. [Google Scholar] [CrossRef]
  80. Liu, J.; Liu, J.; Chen, A.; Ji, M.; Chen, J.; Yang, X.; Gu, M.; Qu, H.; Xu, G. Analysis of tomato plasma membrane H+-ATPase gene family suggests a mycorrhiza-mediated regulatory mechanism conserved in diverse plant species. Mycorrhiza 2016, 26, 645–656. [Google Scholar] [CrossRef]
  81. Taneja, M.; Upadhyay, S.K. Molecular characterization and differential expression suggested diverse functions of P-type II Ca2+ATPases in Triticum aestivum L. BMC Genom. 2018, 19, 389. [Google Scholar] [CrossRef] [Green Version]
  82. Yin, G.; Xu, H.; Xiao, S.; Qin, Y.; Li, Y.; Yan, Y.; Hu, Y. The large soybean (Glycine max) WRKY TF family expanded by segmental duplication events and subsequent divergent selection among subgroups. BMC Plant Biol. 2013, 13, 148. [Google Scholar] [CrossRef] [PubMed] [Green Version]
  83. Eren, E.; González-Guerrero, M.; Kaufman, B.M.; Argüello, J.M. Novel Zn2+ Coordination by the Regulatory N-Terminus Metal Binding Domain of Arabidopsis thaliana Zn2+-ATPase HMA2. Biochemistry 2007, 46, 7754–7764. [Google Scholar] [CrossRef] [PubMed]
  84. Hoffmann, R.D.; Portes, M.T.; Olsen, L.I.; Damineli, D.S.C.; Hayashi, M.; Nunes, C.O.; Pedersen, J.T.; Lima, P.T.; Campos, C.; Feijó, J.A.; et al. Plasma membrane H+-ATPases sustain pollen tube growth and fertilization. Nat. Commun. 2020, 11, 2395. [Google Scholar] [CrossRef] [PubMed]
  85. Toda, Y.; Kawai, Y.; Kinoshita, T.; Wang, Y.; Takahashi, A.; Tada, Y.; Feng Ma, J.; Yamaji, N.; Ashikari, M. Oryza sativa H+ -ATPase (OSA) is Involved in the Regulation of Dumbbell-Shaped Guard Cells of Rice. Plant Cell Physiol. 2016, 57, 1220–1230. [Google Scholar] [CrossRef] [Green Version]
  86. Yu, H.; Yan, J.; Du, X.; Hua, J. Overlapping and differential roles of plasma membrane calcium ATPases in Arabidopsis growth and environmental responses. J. Exp. Bot. 2018, 69, 2693–2703. [Google Scholar] [CrossRef] [Green Version]
  87. Verweij, W.; Spelt, C.; Di Sansebastiano, G.P.; Vermeer, J.; Reale, L.; Ferranti, F.; Koes, R.; Quattrocchio, F. An H+ P-ATPase on the tonoplast determines vacuolar pH and flower colour. Nat. Cell Biol. 2008, 10, 1456–1462. [Google Scholar] [CrossRef]
  88. Lang, V.; Pertl-Obermeyer, H.; Safiarian, M.J.; Obermeyer, G. Pump up the volume—A central role for the plasma membrane H+ pump in pollen germination and tube growth. Protoplasma 2014, 251, 477–488. [Google Scholar] [CrossRef]
  89. Wang, E.; Yu, N.; Bano, S.A.; Liu, C.; Miller, A.J.; Cousins, D.; Zhang, X.; Ratet, P.; Tadege, M.; Mysore, K.S.; et al. A H+-ATPase That Energizes Nutrient Uptake during Mycorrhizal Symbioses in Rice and Medicago truncatula. Plant Cell 2014, 26, 1818–1830. [Google Scholar] [CrossRef] [Green Version]
  90. Krajinski, F.; Courty, P.E.; Sieh, D.; Franken, P.; Zhang, H.; Bucher, M.; Gerlach, N.; Kryvoruchko, I.; Zoeller, D.; Udvardi, M.; et al. The H+-ATPase HA1 of Medicago truncatula Is Essential for Phosphate Transport and Plant Growth during Arbuscular Mycorrhizal Symbiosis. Plant Cell 2014, 26, 1808–1817. [Google Scholar] [CrossRef] [Green Version]
  91. Capoen, W.; Sun, J.; Wysham, D.; Otegui, M.S.; Venkateshwaran, M.; Hirsch, S.; Miwa, H.; Downie, J.A.; Morris, R.J.; Ane, J.M.; et al. Nuclear membranes control symbiotic calcium signaling of legumes. Proc. Natl. Acad. Sci. USA 2011, 108, 14348–14353. [Google Scholar] [CrossRef] [PubMed] [Green Version]
  92. Liu, J.; Chen, J.; Xie, K.; Tian, Y.; Yan, A.; Liu, J.; Huang, Y.; Wang, S.; Zhu, Y.; Chen, A.; et al. A mycorrhiza-specific H+-ATPase is essential for arbuscule development and symbiotic phosphate and nitrogen uptake. Plant Cell Environ. 2020, 43, 1069–1083. [Google Scholar] [CrossRef] [PubMed]
  93. Yuan, W.; Zhang, D.; Song, T.; Xu, F.; Lin, S.; Xu, W.; Li, Q.; Zhu, Y.; Liang, J.; Zhang, J. Arabidopsis plasma membrane H+-ATPase genes AHA2 and AHA7 have distinct and overlapping roles in the modulation of root tip H+ efflux in response to low-phosphorus stress. J. Exp. Bot. 2017, 68, 1731–1741. [Google Scholar] [CrossRef] [PubMed]
  94. Kumari, A.; Chetelat, A.; Nguyen, C.T.; Farmer, E.E. Arabidopsis H(+)-ATPase AHA1 controls slow wave potential duration and wound-response jasmonate pathway activation. Proc. Natl. Acad. Sci. USA 2019, 116, 20226–20231. [Google Scholar] [CrossRef] [PubMed] [Green Version]
  95. Kim, Y.-Y.; Choi, H.; Segami, S.; Cho, H.-T.; Martinoia, E.; Maeshima, M.; Lee, Y. AtHMA1 contributes to the detoxification of excess Zn(II) in Arabidopsis. Plant J. 2009, 58, 737–753. [Google Scholar] [CrossRef] [Green Version]
  96. Seigneurin-Berny, D.; Gravot, A.; Auroy, P.; Mazard, C.; Kraut, A.; Finazzi, G.; Grunwald, D.; Rappaport, F.; Vavasseur, A.; Joyard, J.; et al. HMA1, A New Cu-ATPase of the Chloro plast Envelope, Is Essential for Growth under Adverse Light Conditions. J. Biol. Chem. 2006, 281, 2882–2892. [Google Scholar] [CrossRef] [Green Version]
  97. Gévaudant, F.; Duby, G.; von Stedingk, E.; Zhao, R.; Morsomme, P.; Boutry, M. Expression of a constitutively activated plasma membrane H+-ATPase alters plant development and increases salt tolerance. Plant Physiol. 2007, 144, 1763–1776. [Google Scholar] [CrossRef] [Green Version]
  98. Yang, Y.; Wu, Y.; Ma, L.; Yang, Z.; Dong, Q.; Li, Q.; Ni, X.; Kudla, J.; Song, C.; Guo, Y. The Ca(2+) Sensor SCaBP3/CBL7 Modulates Plasma Membrane H(+)-ATPase Activity and Promotes Alkali Tolerance in Arabidopsis. Plant Cell 2019, 31, 1367–1384. [Google Scholar] [CrossRef]
  99. Muchhal, U.S.; Liu, C.; Raghothama, K.G. Ca2+-ATPase is expressed differentially in phosphate-starved roots of tomato. Physiol. Plant. 1997, 101, 540–544. [Google Scholar] [CrossRef]
Figure 1. Phylogenetic tree of all P-type ATPase superfamily genes in the soybean genome: genes in the same subfamily are shaded by the same color.
Agronomy 11 00071 g001
Figure 2. The number of genes encoding different P-type ATPase subfamilies in Arabidopsis (Ath), rice (Osa), and soybean (Gma).
Agronomy 11 00071 g002
Figure 3. Phylogenetic tree of P1B family proteins from soybean (Glycine max), rice (Oryza sativa), and Arabidopsis thaliana: the full-length amino acid sequences were aligned by ClustalW. The neighbor-joining phylogenetic tree was constructed by MEGA6 with 1000 bootstrap replications. GmHMAs are denoted by red circles, AtHMAs are denoted by purple triangles, and OsHMAs are denoted by green diamonds. The locus name of a soybean gene is shown in brackets. Roman numerals designate the subfamilies.
Agronomy 11 00071 g003
Figure 4. Phylogenetic tree of P2 subfamily proteins from soybean (Glycine max), rice (Oryza sativa), and Arabidopsis thaliana: the full-length amino acid sequences were aligned by ClustalW. The neighbor-joining phylogenetic tree was constructed by MEGA6 with 1000 bootstrap replications. Soybean genes are denoted by red circles, Arabidopsis genes are denoted by purple triangles, and rice genes are denoted by green diamonds. The locus name of a soybean gene is shown following the gene name. The P2 subfamily is divided into six clades, i.e., P2A, and P2B-I to P2B-IV.
Agronomy 11 00071 g004
Figure 5. Alignment of the C-terminal regions of 24 soybean PM H+-ATPases and three representative PM H+-ATPases from Arabidopsis and rice (AHA2, AHA8, and OsA1): region I, region II, and the 14-3-3 protein binding site within the C-terminal regions are indicated by lines. Region I and region II in the C-terminal region have been identified to be critical for the autoinhibitory effects on the H+-ATPase. The phosphorylation of penultimate Thr or Ser is required for 14-3-3 protein binding, which results in the activation of H+-ATPases.
Agronomy 11 00071 g005
Figure 6. Phylogenetic tree soybean (Glycine max), rice (Oryza sativa), and Arabidopsis thaliana of the P3A subfamily: the full-length amino acid sequences were aligned by ClustalW. The phylogenetic neighbor-joining tree was made by MEGA6 with 1000 bootstrap replications. GmAHAs are denoted by red circles, AtAHAs are denoted by purple triangles, while OsAs are denoted by green diamonds. The locus name of a soybean gene is shown in brackets. Roman numerals designate the subfamilies.
Agronomy 11 00071 g006
Figure 7. Phylogenetic tree of soybean (Glycine max), rice (Oryza sativa), and Arabidopsis thaliana of the P4 subfamily: the neighbor-joining phylogenetic tree was made using MEGA6 with 1000 bootstrap replications by aligning full-length amino acid sequences with ClustalW. GmALAs are denoted by red circles, AtALAs are denoted by purple triangles, while OsALAs are denoted by green diamonds. The locus name of the soybean gene is shown in brackets. Roman numerals designate the subfamilies.
Agronomy 11 00071 g007
Figure 8. Schematic representation of functional domains of soybean P4 subfamily proteins.
Agronomy 11 00071 g008
Figure 9. Schematic representation of functional domains of soybean P5 subfamily proteins (A) and the phylogenetic tree of P5 subfamily genes from soybean (Glycine max), rice (Oryza sativa), and Arabidopsis thaliana (B): the neighbor-joining phylogenetic tree was made using MEGA6 with 1000 bootstrap replications by aligning full-length amino acid sequences with ClustalW. GmP5s are denoted by red circles, AtP5 is denoted by a purple triangle, while OsP5 is denoted by a green diamonds. The locus name of the soybean gene is shown in brackets.
Agronomy 11 00071 g009
Figure 10. Graphical representation of locations for all the P-type ATPase genes on each chromosome of soybean: genes belonging to the same family are shown in the same color. Genes within a light golden box are putatively tandemly duplicated.
Agronomy 11 00071 g010
Figure 11. Heat map representation for tissue expression patterns of the putative P-type ATPase superfamily genes in soybean according to Illumina transcriptome data: the Reads/Kb/Million (RPKM) normalized log2 transformed counts were visualized in the heat map. The red colors indicate expression intensity, and grey color indicates no detected expression. HAS: hours after sowing. SAM: shoot apical meristem.
Agronomy 11 00071 g011
Figure 12. Heatmap representation for the expression profiles of putative genes encoding P-type ATPase proteins under environmental stresses, like short-term salt stress (1 h, 6 h, and 12 h) in roots, 1 d cold stress in shoots, 4 d dehydration stress in shoots, 7 d flooding stress in leaves, 7 d drought stress in leaves, and 7 d phosphate starvation stress in roots: the intensities of the color represent the relative magnitude of fold changes in log2 values according to microarray or high-throughput sequencing data (fold change > 2, and p-value < 0.05). Red color indicates induction, blue color indicates repression, and gray color means no significant change in expression level.
Agronomy 11 00071 g012
Figure 13. Heatmap representation for the expression profiles of putative genes encoding P-type ATPase proteins in root hairs (RH) and stripped roots inoculated (IN) and mock-inoculated (UN) with Bradyrhizobium japonicum at 12, 24, and 48 h after inoculation (HAI) according to Illumina transcriptome data: the Reads/Kb/Million (RPKM) normalized log2-transformed counts were visualized in the heatmap. The asterisk indicates a significant difference between rhizobia-inoculated RH and mock-inoculated RH at the same time point (an absolute fold change of IN/UN > 2, p-value < 0.05 by binomial test).
Agronomy 11 00071 g013
Figure 14. Relative expression levels of GmACA1 and GmACA2 in the roots and leaves of soybean seedlings after phosphorus-deficiency (−P) treatment for one day (1 d) and 7 days (7 d): the relative expression levels of GmACA1 and GmACA2 in roots and leaves under phosphorus-sufficient conditions (+P) were normalized to one. Relative expression levels of these genes in soybean leaves and roots were detected by qRT-PCR. Data presented are mean ± SD from three biological replicates. The asterisks indicate an absolute fold change > 2 (−P/+P) and p-value < 0.05 by Student’s t-test.
Agronomy 11 00071 g014
Publisher’s Note: MDPI stays neutral with regard to jurisdictional claims in published maps and institutional affiliations.

