Article

Serial Transcriptome Analysis Reveals Genes Associated with Late Blight Resistance in Potato Cultivar Qingshu 9

1
State Key Laboratory of Crop Stress Biology for Arid Areas and College of Plant Protection, Northwest A&F University, Xianyang 712100, China
2
Qinghai Academy of Agriculture and Forestry Sciences, Qinghai University, Xining 810016, China
3
State Key Laboratory of Crop Stress Biology for Arid Areas and College of Agronomy, Northwest A&F University, Xianyang 712100, China
*
Author to whom correspondence should be addressed.
Agronomy 2021, 11(10), 1919; https://doi.org/10.3390/agronomy11101919
Submission received: 3 August 2021 / Revised: 17 September 2021 / Accepted: 20 September 2021 / Published: 25 September 2021

Abstract

:
The late blight caused by Phytophthora infestans (P. infestans) has been a major constraint for worldwide sustainable potato production. Chinese potato cultivar Qingshu 9 has shown excellent field performance against late blight. To understand the mechanism underlying its resistance, the transcriptomic dynamics of Qingshu 9 infected with P. infestans was systematically investigated to identify the resistance-related genes. In total, 2027 shared differentially expressed genes (DEGs) were identified when infected with P. infestans at 24, 48 and 72 h post-inoculation. Based on k-mean cluster analysis, the DEGs showed four types of expression patterns, suggesting their divergent functions in response to P. infestans infection. KEGG enrichment analysis showed that the significantly enriched DEGs were involved in the biosynthesis of secondary metabolites, plant–pathogen interaction, and photosynthesis. Furthermore, 980 transcription factor genes belonging to 68 families were found in the DEGs, of which AP2-EREBP and MYB genes were the most abundant. Moreover, many genes related to disease resistance showed differential expression during infection. Finally, the expression of nine DEGs was validated by quantitative real-time PCR. These results provide valuable information for understanding late resistance in potato cultivar Qingshu 9.

1. Introduction

The late blight, caused by P. infestans, is regarded as the most severe disease affecting potato production worldwide. To prevent or alleviate this disease, excessive fungicides are commonly used in potato production, not only leading to increased economic input, but also posing a substantial safety threat to the environment and human health [1]. It has been reported that the economic loss caused by late blight in potato is more than 10 billion dollars annually, and P. infestans has developed tolerance to fungicide metalaxyl used in recent years [2,3]. Extensive studies have demonstrated that breeding for potato varieties with resistance to P. infestans is the safest and most effective approach to controlling this disease.
Potato resistance to P. infestans could be classified as possessing either qualitative or quantitative traits, and the former has been well characterized and widely incorporated into potato breeding [4]. For instance, a qualitative resistance trait to P. infestans has been identified in Mexican hexaploid wild species Solanum demissum (S. demissum), and numerous resistance genes (R1~R11) have been defined and even isolated [5,6]. However, those resistance genes found in S. demissum are all race-specific, and their functions in P. infestans resistance have all been lost with the emergence of new and constantly mutating races. Therefore, it is obviously inefficient to use a few single-disease-resistant R genes to improve P. infestans resistance in potato breeding [7]. Some researchers suggest that tolerant potato cultivars likely employ quantitative defense response against Pectobacterium carotovorum subsp. brasiliense [8]. Therefore, quantitative traits with broad-spectrum resistance have the potential to significantly improve the durability of potato resistance to P. infestans. Compared to qualitative resistance, quantitative resistance is much more difficult to use due to its polygenic nature of inheritance and our poor understanding of its underlying molecular and biochemical mechanisms [9]. The application of quantitative resistance genes with broad-spectrum and durable resistance to P. infestans in potato breeding is one of the effective ways to prevent disease in potato [10].
Several studies have demonstrated that many genes are involved in pathogen recognition and plant defense during the colonization process of P. infestans in potato [11,12,13,14,15,16]. Identifying candidate resistance genes induced by pathogens in plant disease resistance is the main method for studying plant disease resistance [17,18]. The sequencing of P. infestans and the potato genome provides great convenience for studying potato-pathogen interactions and candidate genes involved in potato late blight resistance [19,20]. Extensive studies have been performed to identify genes associated with potato-microbe interactions. For example, plastidic carbonic anhydrase (CA) was found to play a crucial role in regulating the compatible vs. incompatible interactions between Solanum tuberosum and P. infestans [21]. DeepSAGE transcriptome analysis on the interaction of susceptible and resistant potato genotypes with P. infestans showed that more genes associated with defense response predominate in the compatible interaction than in the incompatible interaction [22]. The SuperSAGE technique has also been employed to identify novel candidate resistance genes in potato to late blight which do not compromise late maturity [23].
With the rapid development of sequencing technologies, RNA-seq technology provides an efficient, accurate, and high-throughput method for the identification of candidate genes, as it is able to fully detect gene expression at specific times within specific tissues [24], which is also increasingly used to mine genes potentially associated with late blight resistance in potato. For example, the RNA-seq technique was employed to obtain some insight into the mechanism of potato foliage and tuber defense against P. infestans, R gene dosage and shared biochemical pathways that contribute to RB-mediated resistance in the compatible potato—P. infestans interaction [25]. The RNA-seq technique has also been employed to compare differential response in the compatible and incompatible interactions of potato with P. infestans, and 40 effector targets were identified [26]. The transcriptomic response of susceptible RG and resistant PI613981 apple fruit to wounding and inoculation with Penicillium expansum was studied using RNA-Seq, and the results showed that genes involved in the MYB-domain transcription factor family were over-represented in the resistant genotype [27]. Furthermore, 3354 differentially expressed genes (DEGs) were identified in late blight resistant potato genotype SD20 infected with P. infestans, including genes encoding transcription factors and protein kinases, and four NBS-LRR proteins [28]. By creating a new analysis method, the transcriptome analysis of three wild Solanum species compared to three potato clones identified over 400 expressed putative resistance (R-)genes [29].
Potato cultivar Qingshu 9 is highly adaptable to diverse geographic regions in China and has shown excellent field performance against late blight for many years [30]. Although it does not display full immunity to P. infestans in the field, the disease incidence is significantly delayed, largely as a result of limited lesion expansion and development. This “speed limit” disease resistance may exert less selection pressure on the P. infestans populations, potentially leading to the delayed emergence of new races and enabling a relatively persistent disease resistance. Although Qingshu 9 has been widely planted, little is known regarding the molecular mechanism underlying its late blight resistance.
In this study, we employed RNA-seq method to examine transcriptomic dynamics in Qingshu 9 in response to P. infestans infection. The DEGs were identified and were functionally enriched through Gene Ontology (GO) and Kyoto Encyclopedia of Genes and Genomes (KEGG) analysis. The expression of nine DEGs was further verified by reverse transcription-quantitative real-time polymerase chain reaction (qRT-PCR). The obtained results provide useful information and insights on the late blight resistance in Qingshu 9, an important variety highly adapted to diverse environment conditions and widely planted in China.

2. Materials and Methods

2.1. Plant Materials

The potato cultivar Qingshu 9 was provided by the Qinghai Academy of Agricultural and Forestry Sciences (Qinghai, China) and was grown in a greenhouse at 24 °C under a 16-h photoperiod for four–six weeks. The P. infestans strain Pk5106 was collected from the experimental field of Qinghai Academy of Agriculture and Forestry Sciences (Xining, Qinghai, China). The strain was grown in a mold incubator under the condition of 16-h photoperiod at constant 16 °C regime with a relative humidity of 95%.

2.2. Preparation of Spore Suspension and Incubation

Following collection from the field, the P. infestans strain Pk5106 was isolated and purified prior to infecting potato tuber slices 2–3 times on a Petri dish containing rye agar medium supplemented with 6% sucrose. The inoculation lasted for 8–15 days at 16 °C to induce the formation of sporangia, which were then detected by light microscopy. Pre-cooled sterilized water was added to the Petri dishes to completely infiltrate the hyphae. The Petri dishes containing the inoculations were rinsed repeatedly with a pipette to obtain a sporangial suspension, which was kept in a freezer at 4 °C for 1–2 h to stimulate the release of zoospores. The final concentration of spores was adjusted to approximately 4 × 10⁴ mL−1.

2.3. Collection of Samples and Microscopic Examination

The spore suspension above prepared was sprayed onto the Qingshu 9 plants, which were then covered with moist transparent plastic bags for a period of 24 h to maintain high moisture conditions, as required for infection. Two leaves were collected from potato plants for the control group before spore-spraying, and two more leaves of the same size were collected at 24 h, 48 h and 72 h post-infection (hpi). Three biological replications of the samples were carried out, and immediately frozen in liquid nitrogen then stored at −80 °C.
To view infection and colonization of P. infestans in Qingshu 9, leaf samples were transferred into polypropylene tubes which were filled with diluted trypan blue solution (10 g phenol, 10 mL glycerol, 10 mL lactic acid, 10 mL water and 10 mg of trypan blue). The tubes (lid slightly unscrewed) were treated in a heated water bath and boiled for 2 min. After cooling to room temperature, tubes were boiled for another 2 min. Then, the samples were destained by replacing the staining solution with chloral hydrate solution (5 g chloral hydrate dissolving into 2 mL water) for 24 h. The samples were finally mounted in distilled water and viewed under an Olympus BX51 (Shinjuku-ku, Tokyo, Japan) microscope with differential interference contrast optics [30].

2.4. RNA Extraction, Library Preparation, and Sequencing

Total RNAs from the P. infestans-infected Qingshu 9 leaves as well as the uninfected control leaves were extracted. Sequencing libraries were generated using the NEBNext® Ultra™ RNA Library Prep Kit for Illumina® (NEB, Ipswich, MA, USA) following the manufacturer’s instructions. The clustering of the index-coded samples was performed on a cBot Cluster Generation System using the TruSeq PE Cluster Kit v3-cBot-HS (Illumina) following the manufacturer’s instructions. The libraries were sequenced on an IlluminaHiSeq 4000 platform with PE 150, which conducted by the Novogene Bioinformatics Institute (Beijing, China).

2.5. Analysis of the Differentially Expressed Genes

Clean reads were obtained by removing reads containing adapters or poly N and reads of low quality from the raw reads using FastQC. The reference genome of the doubled haploid S. tuberosum group Phureja clone DM1-3 516R44 (hereafter referred to as DM) genome sequence (SolTub 3.0) were downloaded from the ENSEMBL plant database (ftp://ftp.ensemblgenomes.org/pub/plants/release-34/fasta/solanum_tuberosum/dna/, accessed on 10 October 2018) [31]. Index files of the reference genome were built using HISAT2 [32], which was used to align the clean reads against the reference genome. HTSeq v0.9.1 was used to count the read numbers mapped to each gene. The expected number of fragments per kilobase of transcript sequence per million base pairs (FPKM) was calculated for each gene [33]. The FPKM value of 0.1 or 1 was used as a threshold for determining whether a gene is expressed. Differential expression analysis was performed using the DESeq R package (1.18.0) [34], which provided statistical strategies for determining differential expression in digital gene expression data using the negative binomial distribution model. The resulting p-values were adjusted using Benjamini and Hochberg’s approach for controlling the false discovery rate [35]. Genes with the fold change >2 and adjusted p-value (padj) < 0.05 were considered as significant DEGs.

2.6. GO and KEGG Enrichment Analyses of DEGs

The DEGs were sequence-aligned with the GO and KEGG databases. GO enrichment analysis of DEGs was implemented by the GOseq R package, in which gene length bias was corrected [36]. GO terms with corrected p-values less than 0.05 were considered to be significantly enriched for DEGs. KEGG pathway enrichment (http://www.genome.jp/kegg/, accessed on 15 October 2018) was used to identify significantly enriched signal transduction pathways or metabolic pathways among the DEGs [37]. KOBAS (2.0) was used for the calculation and analysis of KEGG pathway enrichment factor (KS) [38].

2.7. Transcription Factor (TF) Analysis of DEGs

Plant TFs were predicted with iTAK software, the TFs were identified and classified according to the method as described by Perez-Rodriguez et al. [39]. The hmmscan program was used to identify TFs among the DEGs [40]. The potential role of the TFs in the interactions between Qingshu 9 and P. infestans was further analyzed based on the relevant biological processes in which those differentially expressed TFs might be involved in.

2.8. Comparative Analysis of Plant R Gene Database (PRGDB)

The DEGs were compared with the plant R gene database (http://prgdb.crg.eu/wiki/Main_Page, accessed on 21 November 2018). On the basis of the comparison results, we selected the annotated genes related to potato disease resistance.

2.9. Validation of the Expression of DEGs by qRT-PCR

Nine DEGs closely related to plant disease resistance were selected to validate the expression patterns using qRT-PCR. The qRT-PCR primers as provided were synthesized by Shanghai Shenggong Bioengineering Co., Ltd. (Table 1). The potato Actin gene (GenBank accession no. X83206) was used as the reference gene. PrimeScript™ RT reagent Kit with gDNA Eraser (Perfect Real Time) was used for the first-strand reverse transcription. (i) Genomic DNA removal reaction was performed in a 10 µL reaction mixture with 2 µL 5 × gDNA Eraser Buffer, 2 µL gDNA Eraser, and total RNA (add the corresponding volume according to the concentration), up to 10 µL with RNase Free dH2O. (ii) Reverse transcription reaction was performed in a 20 µL reaction mixture with 10 µL of the reaction solution from the previous step, 1 µL PrimeScript RT Enzyme Mix I, 1 µL RT Primer Mix, 4 µL 5 × PrimeScript Buffer 2 (for Real Time), 4 µL RNase Free dH2O. PCR was performed in a 20 µL reaction mixture with 10 µL abm®EvaGreen qPCR MasterMix-No dye, 0.8 µL of both forward and reverse primers, 7.4 µL of double-distilled H2O and 1 µL of cDNA. All qRT-PCRs were performed in triplicate for each cDNA sample with an annealing temperature of 60 °C and a total of 40–45 cycles of amplification. The expression level of each gene was analyzed using the 2∆∆CT method [41].

3. Results

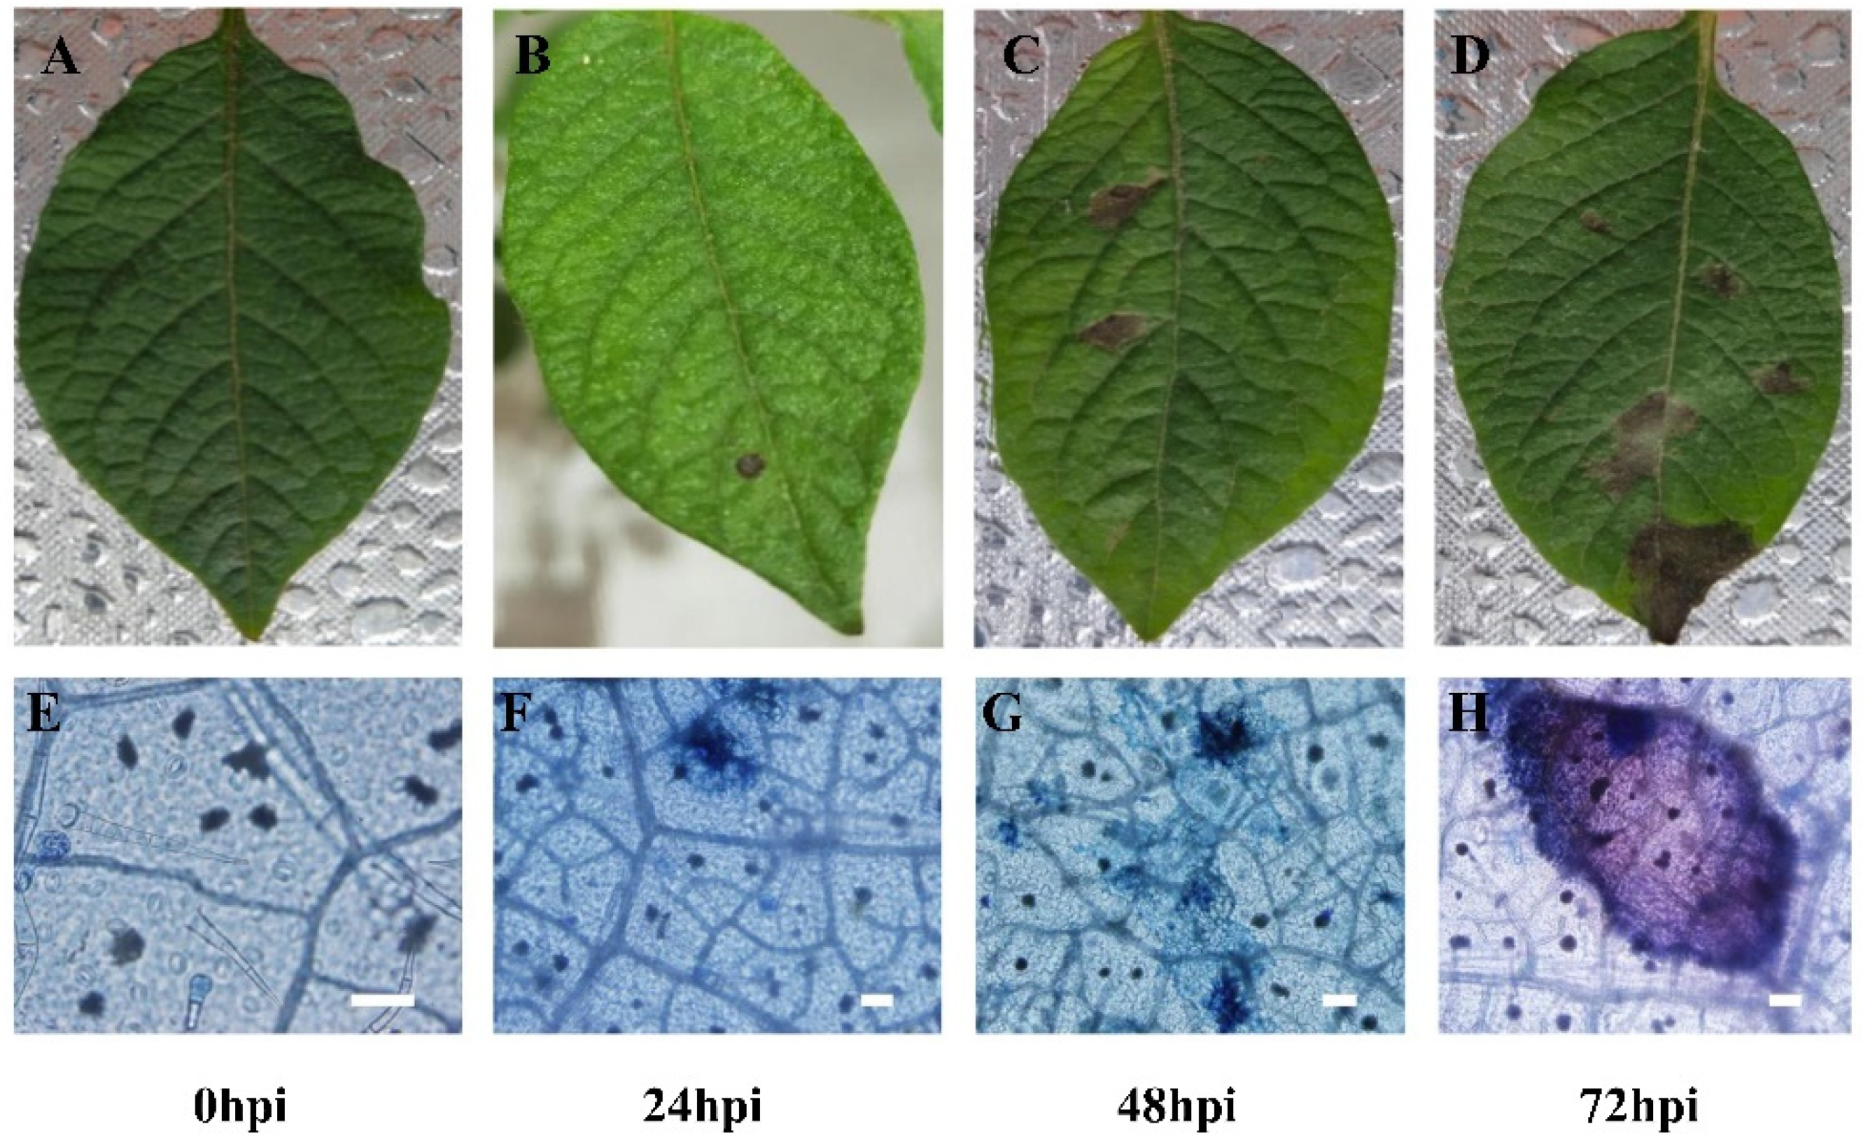
3.1. Leaves at 0, 24, 48, 72 hpi Were Chosen to Prepare in Planta Materials

Inoculated potato leaf materials were continuously harvested at different time points. To choose the right time of infection, the infection process of Qingshu 9 sprayed with P. infestans was monitored by microscopic observation. At 0 hpi, the potato leaves were not infected by P. infestans, and normal stomas could be seen clearly (Figure 1A,E). At 24 hpi, sporadic necrotic spots could be observed in the potato leaves (Figure 1B,F). With increasing infection time, necrosis spots gradually increased and the area of necrosis gradually increased at 48 hpi and 72 hpi (Figure 1C,D,G,H). On the basis of these results, the time points of 24 hpi, 48 hpi and 72 hpi were chosen to prepare infestation material to perform deep sequencing, using 0 hpi as a control.

3.2. A Large Amount of Credible Data Were Obtained through Transcriptome Sequencing

To investigate the transcriptional response of Qingshu 9 to P. infestans, the inoculated leaf tissues were sampled at 0 hpi, 24 hpi, 48 hpi and 72 hpi, and total RNA was isolated for RNA sequencing, which were performed with three biological replicates. The sample symbols were Pi0h_1, Pi0h_2, Pi0h_3, Pi24h_1, Pi24h_2, Pi24h_3, Pi48h_1, Pi48h_2, Pi48h_3, and Pi72h_1, Pi72h_2, Pi72h_3. In total, 588 million raw paired-end reads were generated, and an average of 47,753,443, 50,630,987, 49,302,732 and 48,372,645 raw reads from Pi0h, Pi24h, Pi48h and Pi72h were produced (Table 2). The correlation coefficient (R2) between different biological replicates was very close to 1 (Table 3), indicating the high reproducibility between replications and the reliability of sequencing data. Clean reads were obtained after quality control and used for subsequent mapping, assembly and gene expression calculation. When the clean reads were mapped onto the potato DM reference genome by HISAT 2.0, approximately 71.02–84.9% reads were mapped (Table 2), which is higher than the values of 78.7% [25] and 57.29–72.13% previously reported [28]. Finally, 24,251, 23,579, 23,412 and 23,736 genes were detected on average in the sampling at the four time points, including a large number of plant R genes.

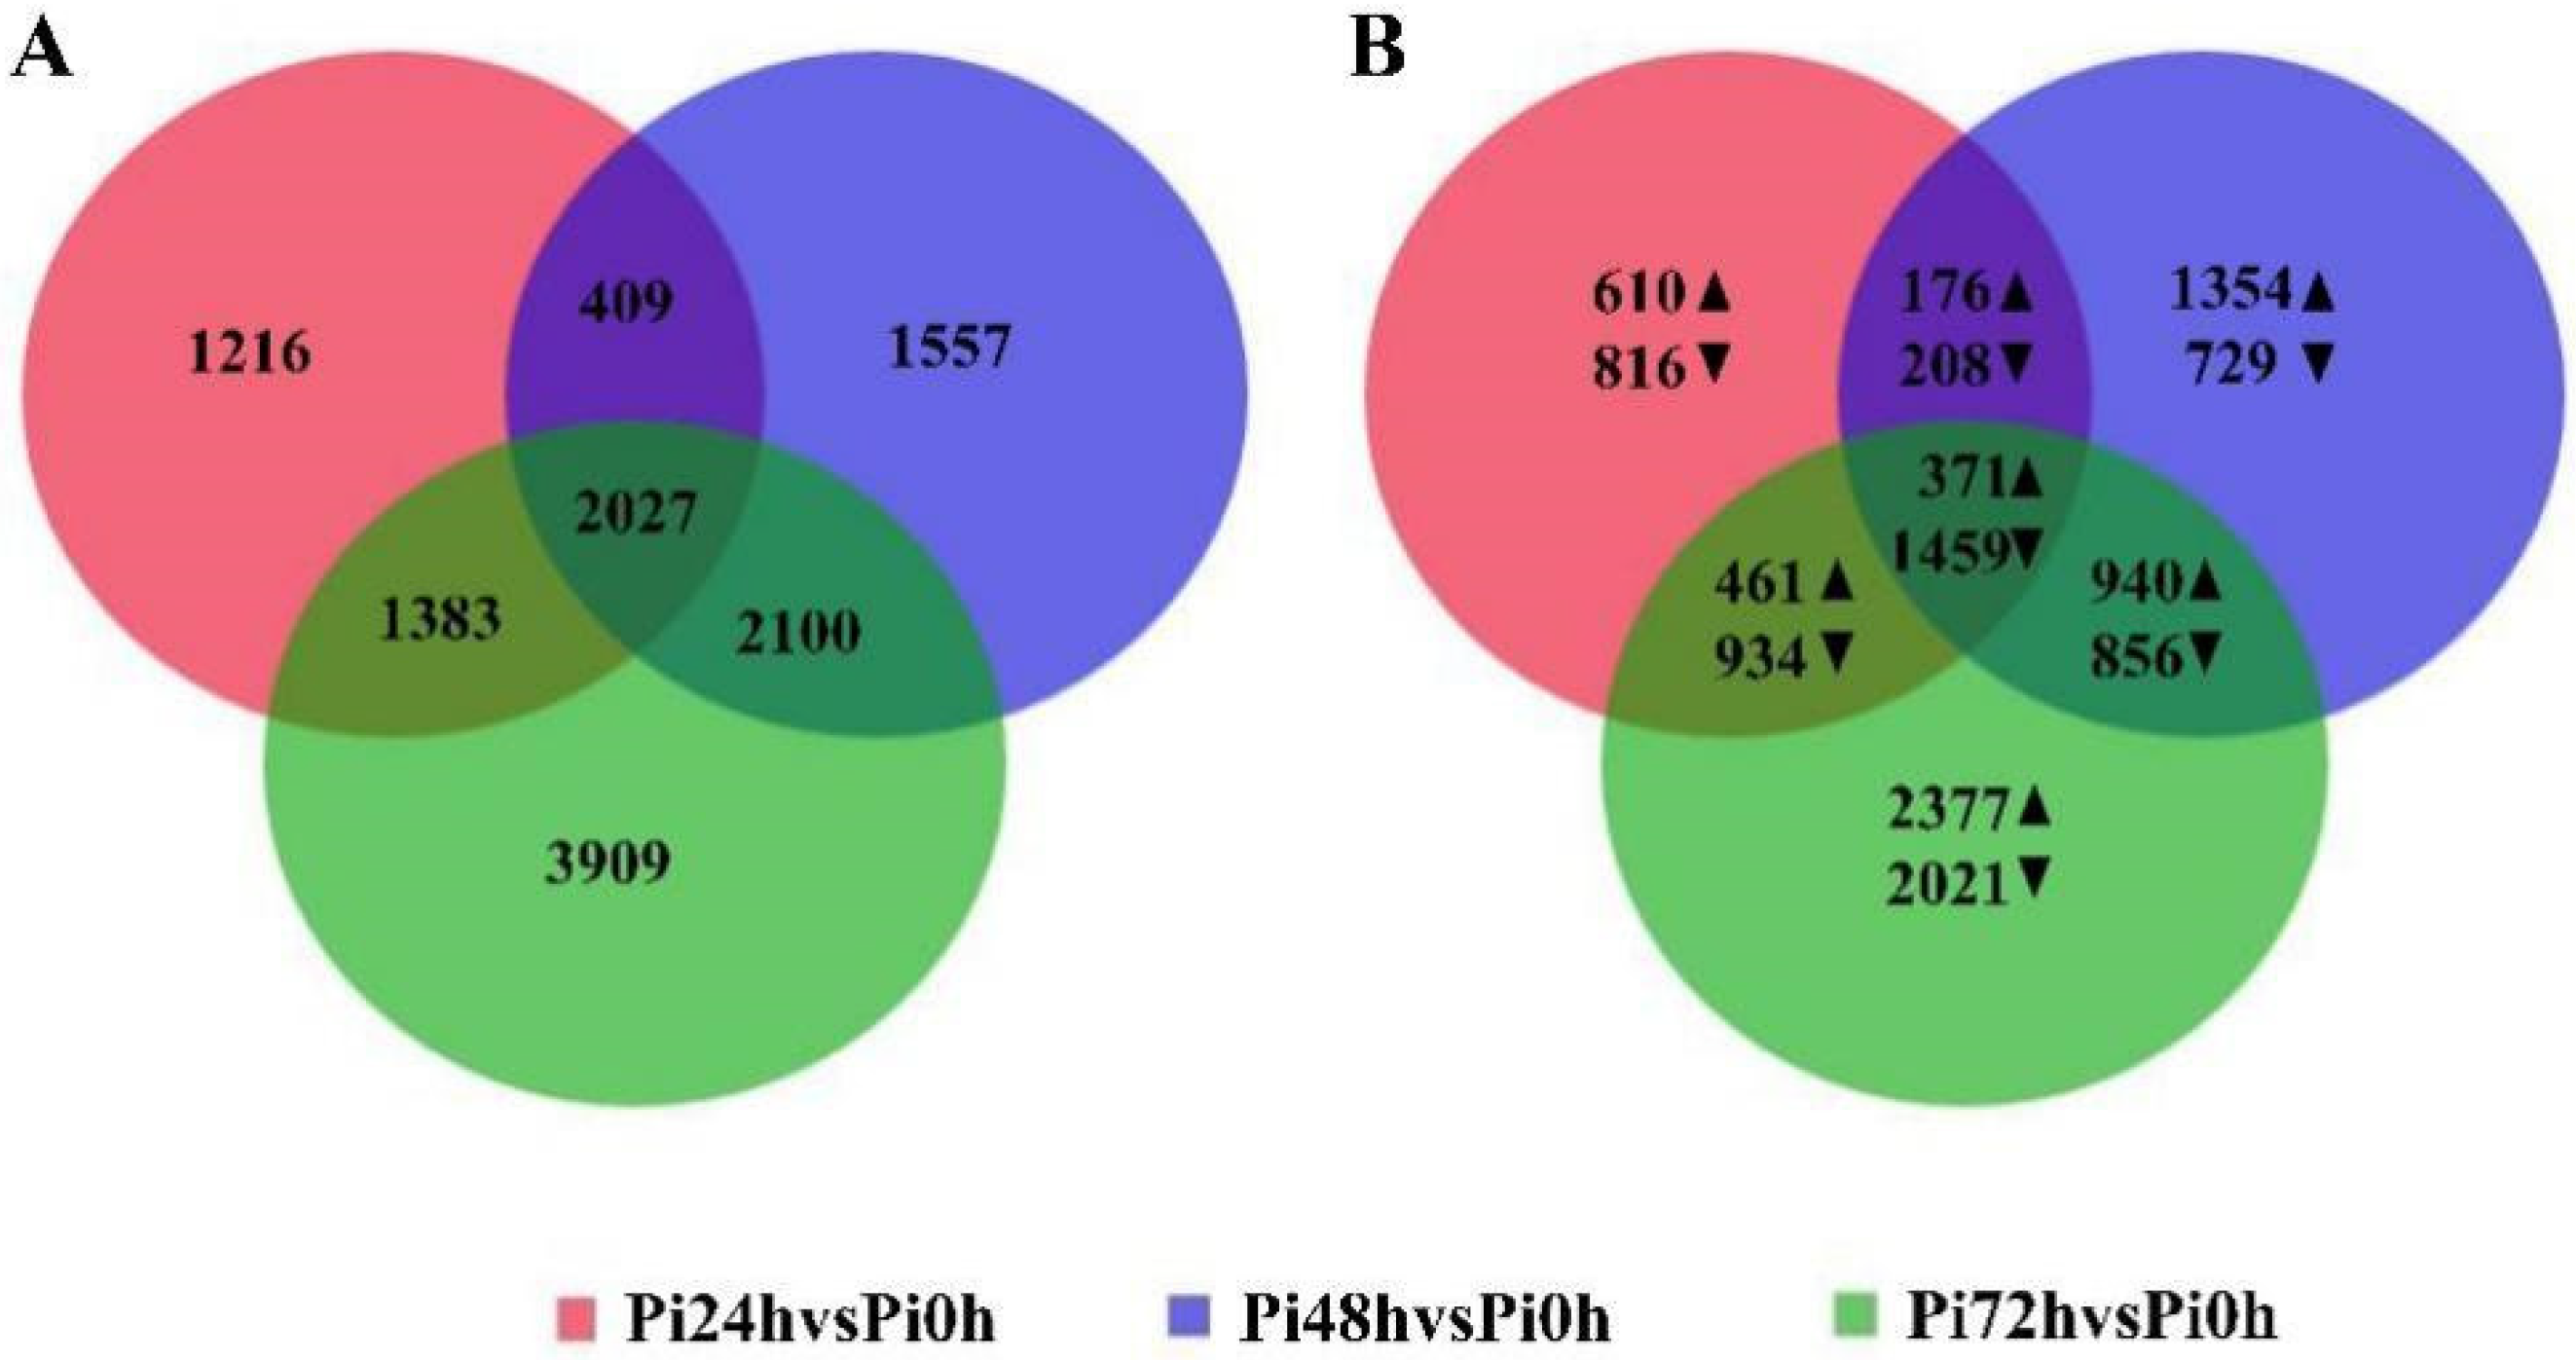
3.3. 24 hpi and 48 hpi Are Important in the Immune Response of Qingshu 9

Because the disease incidence in Qingshu 9 is significantly delayed, we proposed exploring the resistance molecular mechanism of Qingshu 9 by screening the differentially expressed genes during the infection process. DEGs were identified using DESeq software with the corrected Padj < 0.05 and fold change > 2 as a threshold for significant differential expression. We identified 5035, 6093, 9419 and 2027 shared DEGs in the three groups Pi24h vs. Pi0h, Pi48h vs. Pi0h and Pi72h vs. Pi0h (Figure 2A), of which 6289 were upregulated and 7023 were downregulated (Figure 2B). Obviously, the number of DEGs gradually increased with the extension of infection time. Although different infection time points contained many specific DEGs, there were still 371 and 1459 DEGs that were commonly up- and downregulated among the groups (Figure 2B). These DEGs can be induced by infection with P. infestans, and also play an important role in the resistance of Qingshu 9 to late blight.
To further analyze the expression patterns of DEGs, k-mean cluster analysis was performed. There were four different expression patterns obtained, with 5366, 1581, 3265 and 434 genes, respectively (Figure 3). The genes in Subcluster_1 and Subcluster_4 were upregulated on the whole, and the number of upregulated genes at 24 hpi was greater, especially in Subcluster_4. Among them, the expression of genes in Subcluster_1 was slightly upregulated at the four time points, and Subcluster_4 showed the highest expression level at 24 hpi. Due to the high expression of the gene Osmotin (PGSC0003DMG400003044) and the significant upregulation of many genes, including Auxin repressed/dormancy-associated gene (PGSC0003DMG400029732) and PR1 (PGSC0003DMG400005113), at 24 hpi, we believe that these genes are induced by early plant immunity and are closely related to the resistance response of Qingshu 9 to P. infestans. These results indicate that 24 hpi is the critical period of interaction between Qingshu 9 and P. infestans. At the same time, the number of upregulated genes in Subcluster_2 increased significantly at 48 hpi, whereas they were downregulated at 72 hpi, so it is speculated that these genes are mainly involved in the intermediate stage of disease resistance. Many genes in Subcluster_1, Subcluster_2, and Subcluster_4 were upregulated at 48 hpi, indicating that 48 hpi was also critical to the immune response of Qingshu 9. In addition, the genes in Subcluster_3 displayed downregulated expression at all four time points, indicating that they played a negative regulatory role in the interaction between Qingshu 9 and P. infestans.

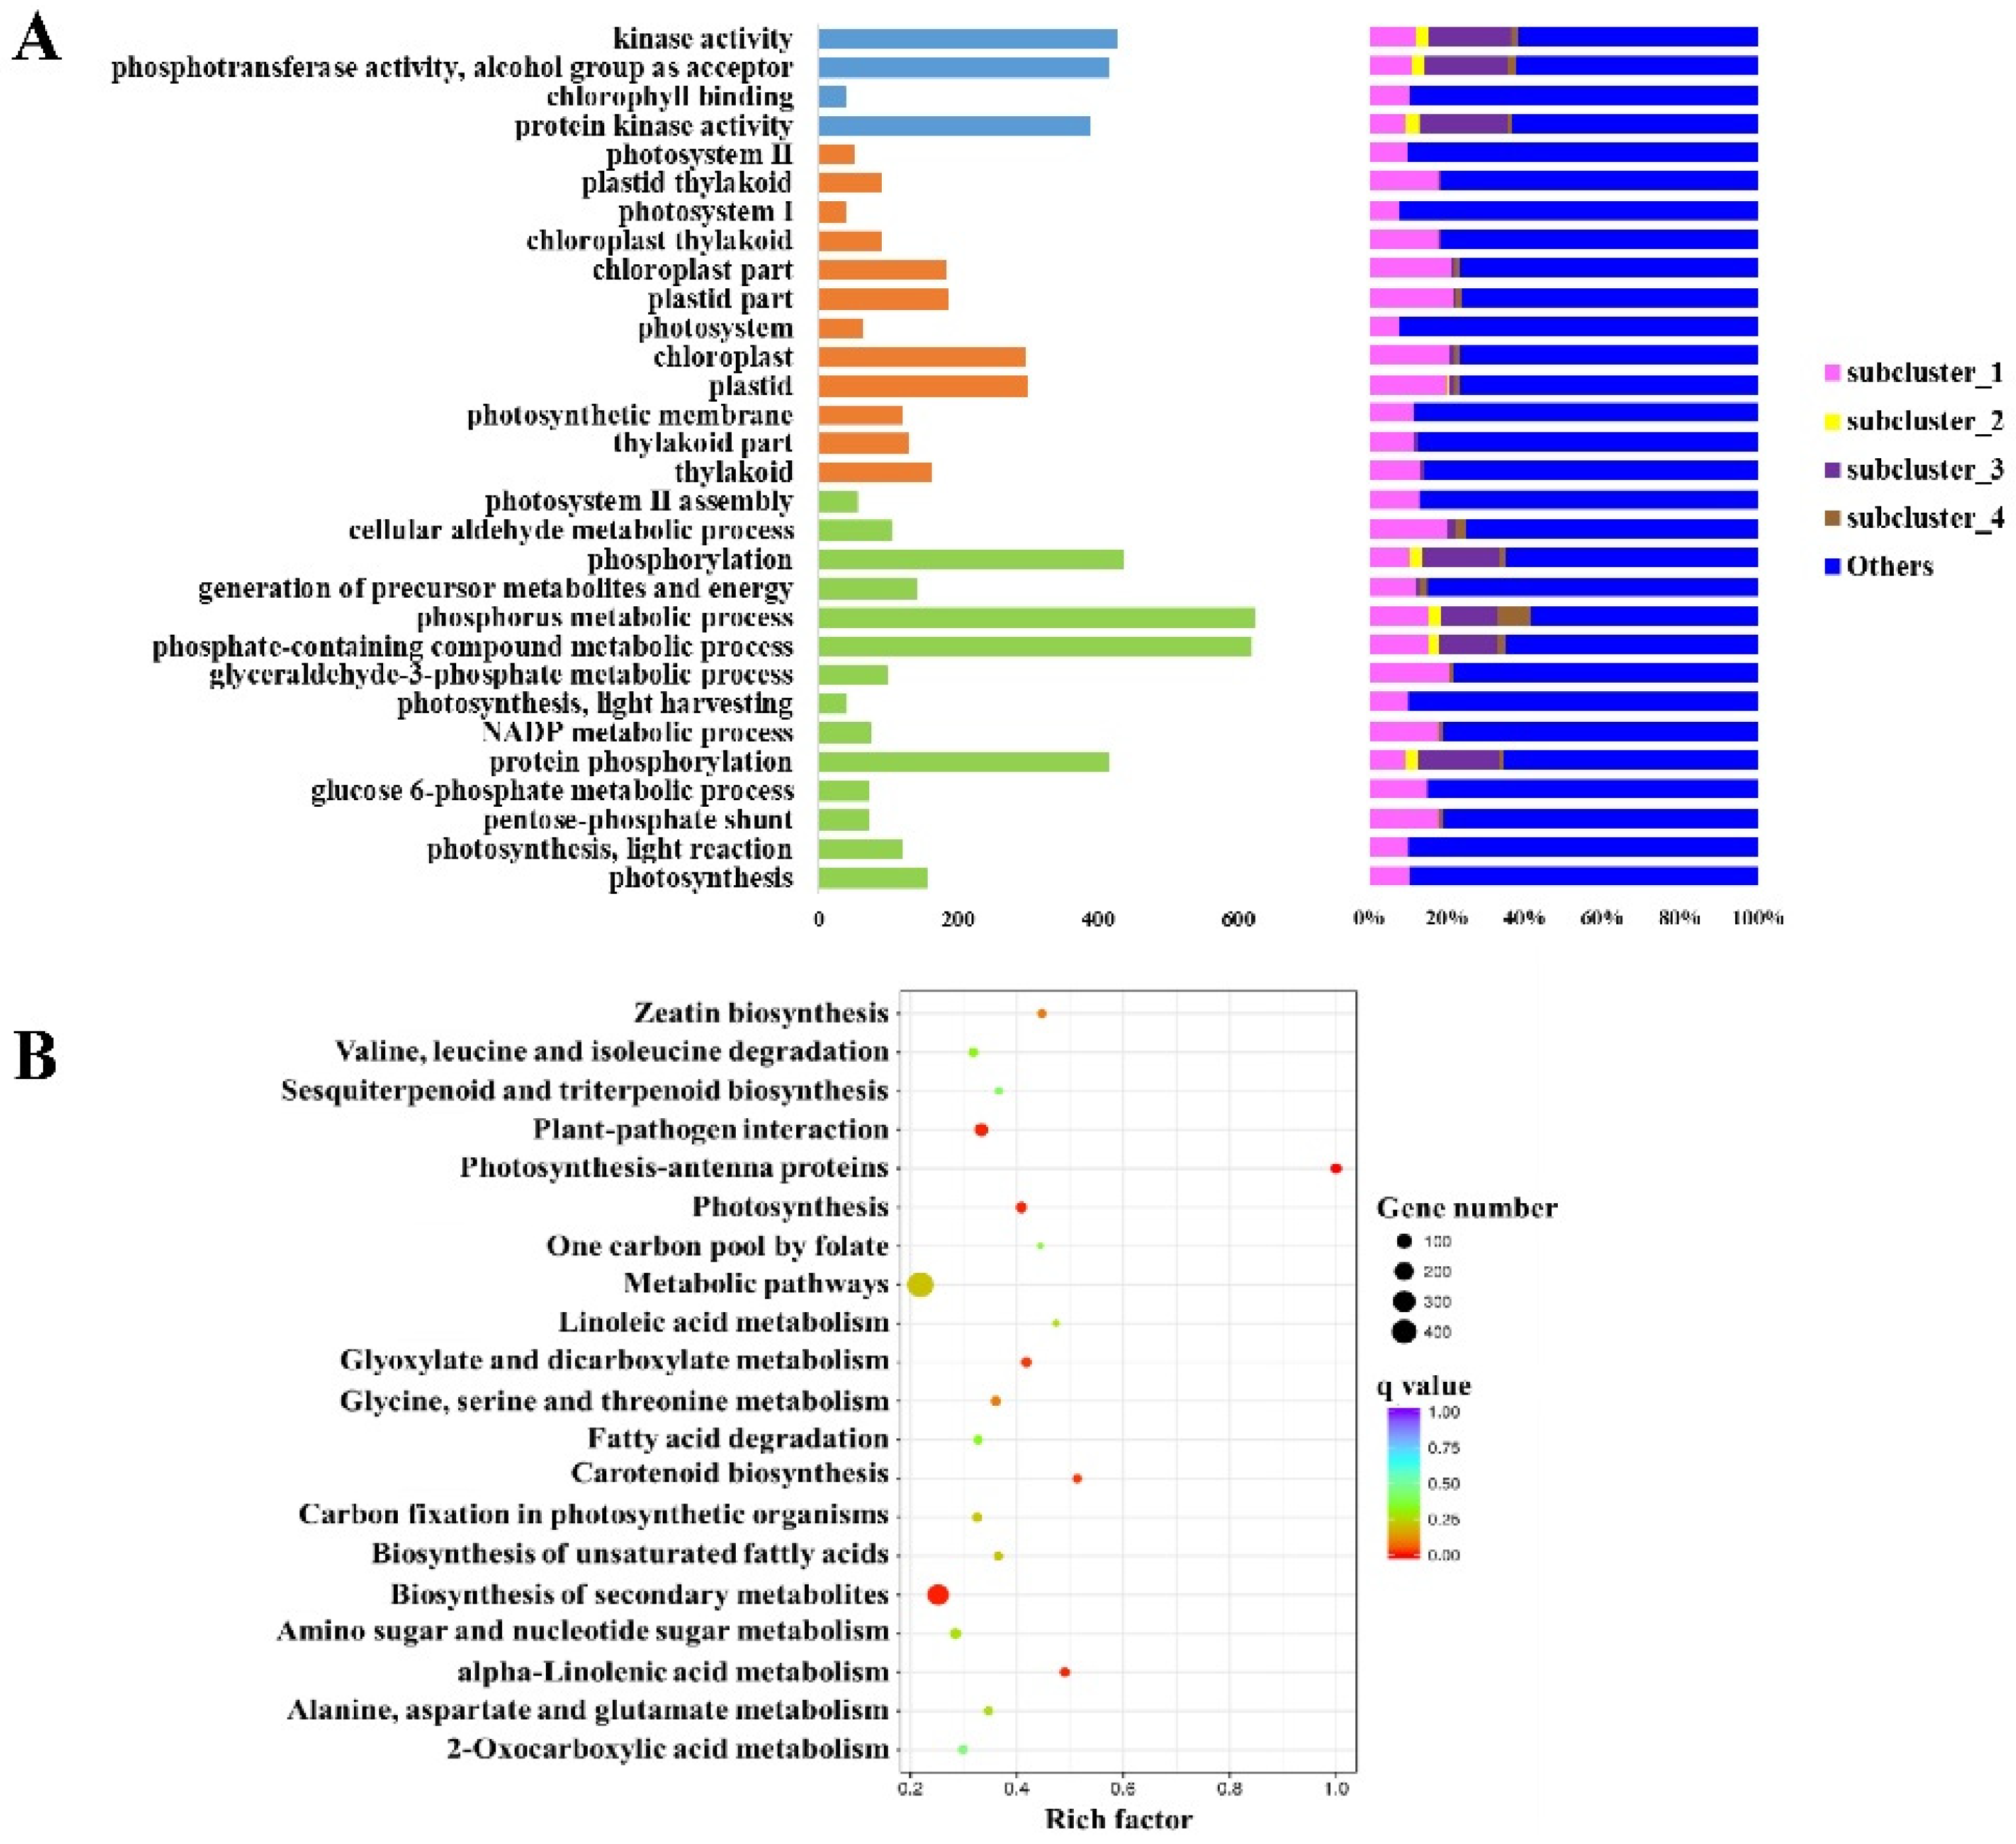
3.4. DEGs among the Groups Are Enriched in Different GO Terms and KEGG Pathways

To better understand the functions of DEGs, GO enrichment analysis was performed. In addition to the phosphorus metabolic process and the phosphate-containing compound metabolic process, which had the largest numbers of enriched genes, kinase activity and protein kinase activity also enrich many DEGs in the group Pi24h vs. Pi0h (Figure 4A). The DEGs in group Pi48h vs. Pi0h were mainly enriched with respect to biological processes and metabolic processes in the biological processes category (Figure S1A). Additionally, cytoplasm and protein kinase activity were also significantly enriched. Similarly, DEGs in group Pi72h vs. Pi0h were mainly enriched in BP category and some DEGs were also enriched with respect to kinase activity and protein kinase activity (Figure S2A). The results indicated that many DEGs could be annotated to kinase activity (GO:0016301; 700DEGs) and protein kinase activity (GO:0004672; 616DEGs). As intermediate molecules in signal transduction pathways, protein kinases (PKs) played an important role in the interaction between Qingshu 9 and P. infestans. Combined with the analysis of expression patterns, it was found that except for group Pi24h vs. Pi0h, the genes enriched in the other two groups were mainly of the subcluster_1 type (Figure 4A, Figures S1A and S2A). GO enrichment results showed that the co-upregulated DEGs were mainly enriched in the biological process category and the cellular component category (Figure 5A). The co-downregulated differential genes were mainly enriched in the molecular function category, which also includes kinase activity and protein kinase activity (Figure 5B).
The KEGG pathway enrichment analysis was further used to identify the metabolic pathways that were involved in Qingshu 9 response to P. infestans. It was found that DEGs of Pi24h vs. Pi0h were enriched in numerous metabolic pathways, including the biosynthesis of secondary metabolites (ID: sot01110, 274 DEGs), plant-pathogen interaction (ID: sot04626, 69 DEGs), photosynthesis, and zeatin biosynthesis (Figure 4B). The enriched pathways of DEGs of Pi48h vs. Pi0h included biosynthesis of secondary metabolites (ID: sot01110, 270 DEGs), plant–pathogen interaction (ID: sot04626, 71 DEGs), ribosome and so on (Figure S1B), while that of Pi72h vs. Pi0h included plant–pathogen interaction (ID: sot04626, 116 DEGs), ribosome, ribosome biogenesis in eukaryotesis (Figure S2B). These results suggested that biosynthesis of secondary metabolites, plant–pathogen interaction pathways were mainly involved in the resistance response of Qingshu 9 to P. infestans. Therefore, the DEGs involved in these pathways were considered to participate in the Qingshu 9-P. infestans interaction.
By comparing the groups of Pi24h vs. Pi0h, Pi48h vs. Pi0h and Pi72h vs. Pi0h, we found that the abundance of genes related to disease resistance, such as PR1, NBS-LRR, WRKY transcription factor and cell wall protein, was gradually increasing. Additionally, the gene cytochrome P450 and ethylene response factors associated with hypersensitive response and many lignin synthesis-related genes were significantly induced by P. infestans infection. These results suggest that Qingshu 9 activates a series of regulated and functional genes to respond to P. infestans infection. The resistance of Qingshu 9 is controlled by multiple genes.

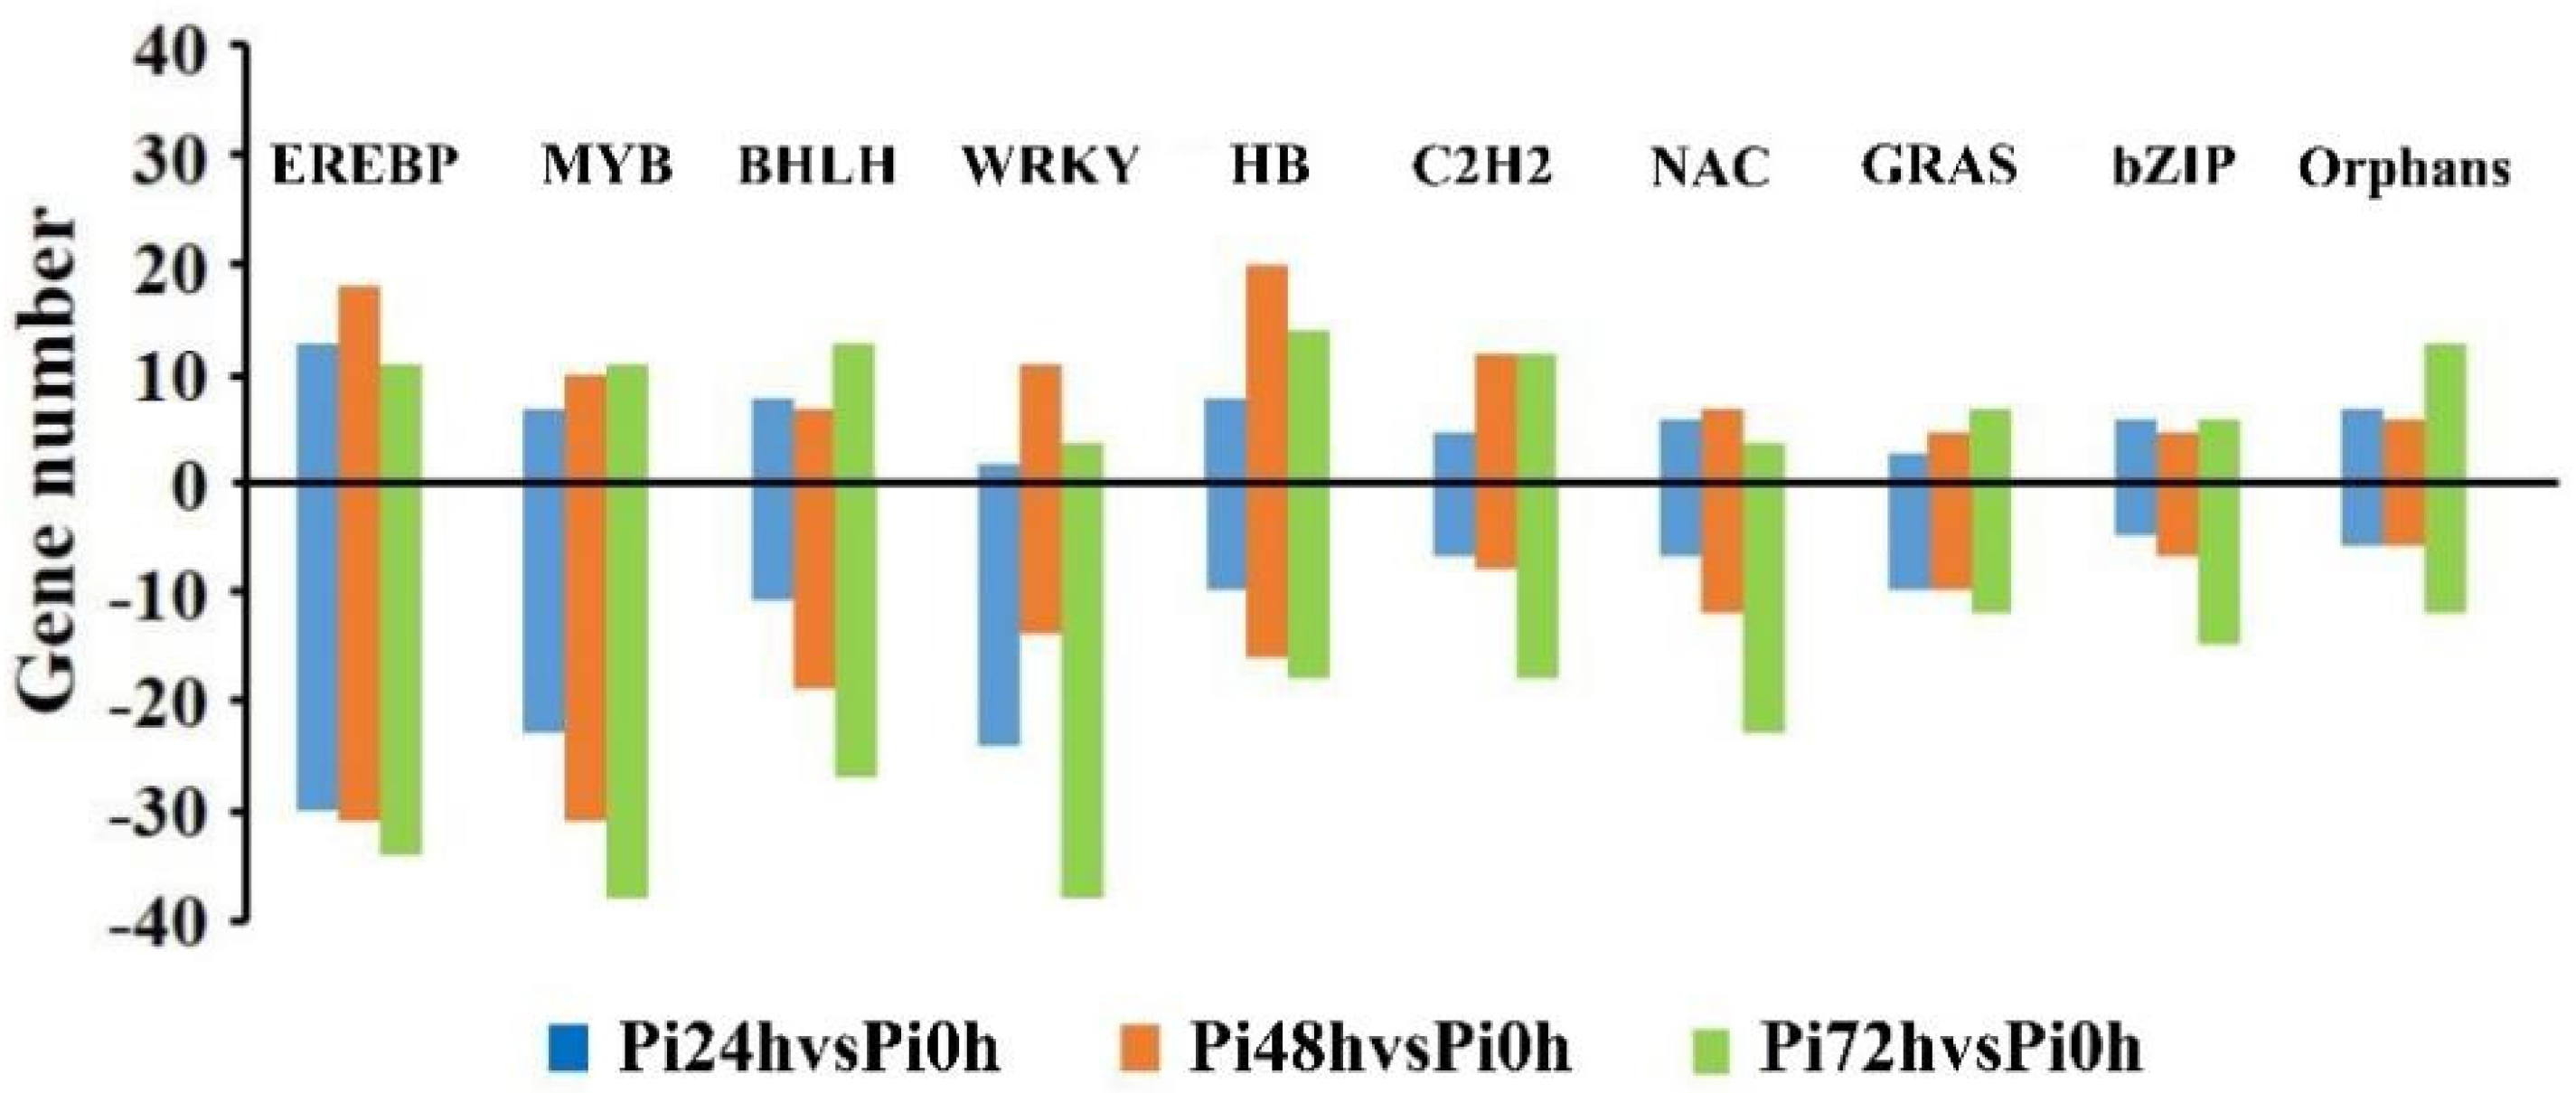
3.5. Transcription Factors Play Crucial Roles in Qingshu 9’s Resistance Response

Previous studies have shown that TFs, as key components of the plant defense system, activate the expression of stress-related genes and participate in biological processes [42,43,44,45]. In this study, a total of 980 differentially expressed TFs belonging to 68 TF families were identified. Among them, the AP2-EREBP and MYB families were the most abundant group, with 86 and 74 members, respectively, accounting for 8.78% and 7.55% of the total TFs. Furthermore, more than 30 members of bHLH (55), WRKY (52), HB (50), C2H2 (44), NAC (43), GRAS (34), bZIP (33), and Orphans (32) families were also identified, suggesting that they played important roles in response to P. infestans (Figure 6). There are 17 AP2 domain class transcription factor, 19 MYB, 5 BHLH, and 21 WRKY genes differentially expressed at 24 h. AP2/ERF-domain protein (PGSC0003DMG400016812), MYB transcription factor (PGSC0003DMG400024572), and WRKY transcription factor 5 (PGSC0003DMG400028469) were significantly upregulated; and MYB RL3 (PGSC0003DMG400028098) and WRKY transcription factor (PGSC0003DMG400000211, PGSC0003DMG400031140) were significantly downregulated after infection. Additionally, other TF families, including C3H, GNAT, HSF, TCP, CCAAT, C2C2-GATA, AUX/IAA, C2C2-Dof, G2-like, MADS, ABI3 VP1, ARF, Trihelix, LOB, SBP, SET, Tify, RWP-RK, and mTERF participated in the stress induction response to P. infestans.

3.6. Comparison of Results between DEGs and Plant R Gene Database

To explore whether the selected DEGs contain plant R genes, we scanned the DEGs into the plant R gene database. The results showed that 2532 DEGs were plant R genes, of which 656 genes were further annotated in detail. These annotated genes can be divided into 12 R gene types, namely CN type (18), CNL type (169), Mlo-like type (21), N type (76), NL type (164), RLK type (29), RLK-GNK2 type (11), RLP type (117), RPW8-NL type (1), T type (11), TNL type (34), and other types (5). Further screening results showed that 311 genes were annotated as potato resistance genes, thus providing candidate genes for the selection and use of potato disease resistance genes.

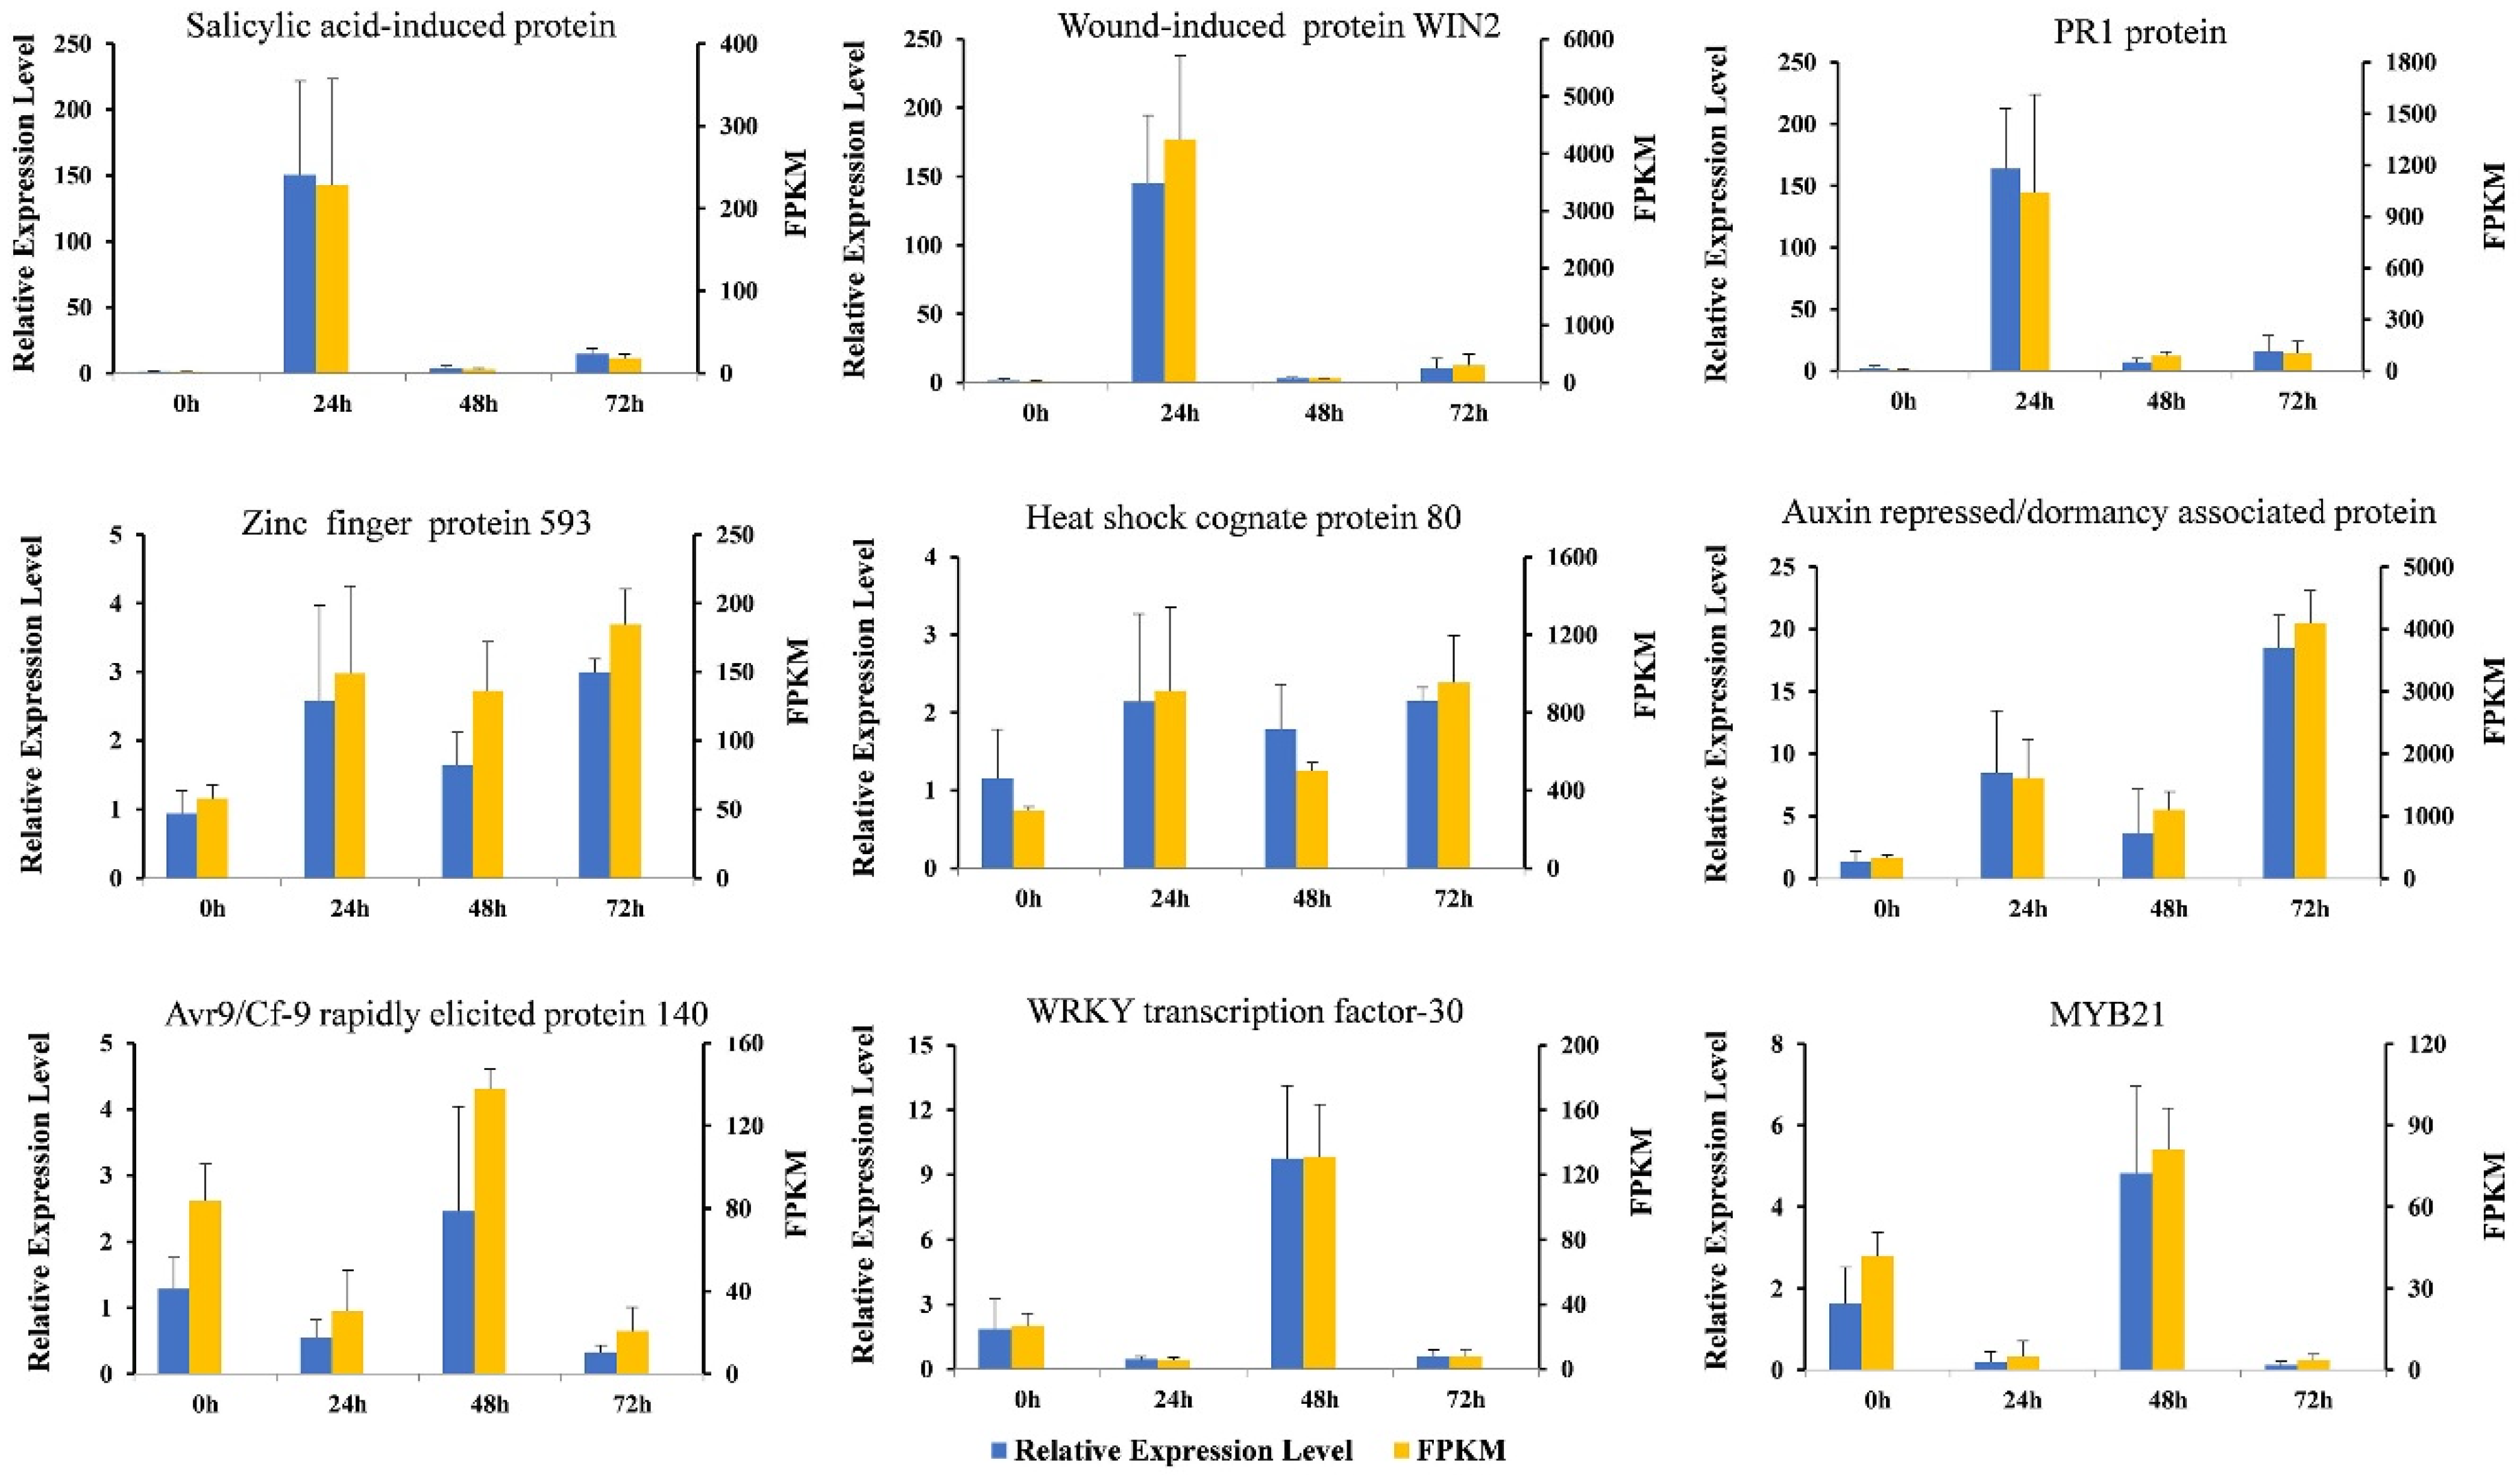
3.7. The Results of qRT-PCR and RNA-Seq Are Consistent

To validate the results of the RNA-Seq, qRT-PCR was performed on nine randomly selected DEGs. The proteins encoded by these genes were usually involved in plant disease resistance, such as zinc finger protein 593, PR1 protein, heat shock cognate protein 80, WRKY transcription factor-30, and salicylic acid-inducing protein 19. As illustrated in Figure 7, the expression patterns of these nine genes were consistent with the results of the RNA-Seq, which validated the reliability of RNA-Seq data.

4. Discussion

4.1. Potato Cultivar Qingshu 9 Contains Special Resistance to P. infestans

Qingshu 9 is an elite cultivar with high adaptation to diverse geographic regions in China. It has shown excellent field performance against late blight in different regions for many years. Its “speed limit” disease resistance model may alleviate the selection pressure on the P. infestans population, which might delay the emergence of new races with virulence. This special resistance is urgently required for the selection of disease-resistant potato varieties. However, the underlying molecular and biochemical mechanisms of Qingshu 9’s resistance remain elusive.

4.2. Transcription Analysis of Qingshu 9 Infected by P. infestans

A comprehensive understanding of the physiological and biochemical processes of potato interaction with P. infestans at the molecular level would help in the further development of control strategies, leading to the effective control of late blight in potato. Host-pathogen interaction studies have been carried out in plants. Many studies have applied RNA-Seq technology to identify genes involved in the response to potato late blight at the genome level [25,28,29,46,47]. However, few studies identifying special resistance genes to potato late blight have been reported. In this study, a comprehensive transcriptome analysis of the interaction process between Qingshu 9 and P. infestans was performed, which could contribute to better understanding the resistance response mechanism in Qingshu 9. In the resistance reaction of Qingshu 9 to P. infestans, 0 h was used as the control group, and the treatment groups were 24 h, 48 h and 72 h after inoculation. This experiment was able to distinguish the treatment groups and the control group at the transcriptome level at different times. Our results indicated that 24 h was the most critical period of interaction between Qingshu 9 and P. infestans.

4.3. Transcription Factors May Play an Important Role in the Resistance Response to P. infestans in Qingshu 9

Transcription factors (TFs) play important roles in the interaction between plants and pathogens. The AP2/ERF family, WRKY family, MYB family and bZIP family are involved in the immune response to external stimuli and biotic stress in plants [48,49,50]. The AP2/ERF is the largest family of TFs in higher plants, and many of its members have been reported to act as activators or suppressors in response to biotic stress in plants [51]. In the interaction between plants and pathogens, ERF1 and ERF2 transcriptionally activated the expression of related disease resistance genes, while ERF3 and ERF4 inhibited gene expression in plants during the disease resistance process [52]. It has been reported that the ERF transcription factor StERF3 negatively regulates resistance to P. infestans and salt tolerance in potato [53]. In addition, the MYB, WRKY, bZIP and NAC TF families are well known for their roles in plant defense responses [54]. Genes of transcriptional regulation play a regulatory role in multiple pathways of potato against P. infestans. For example, StWRKY1 enhances resistance to P. infestans by regulating the expression of genes in the phenylpropionic acid biosynthetic pathway [55]. Similarly, StWRKY8 is involved in the regulation of the biosynthesis and regulation of the benzyl isoquinoline alkaloid, an antibacterial agent precursor, which could inhibit the early infection of P. infestans [56]. Moreover, potato NAC43 and MYB8 are able to regulate the secondary cell wall biosynthesis to prevent P. infestans infection [57]. In this study, there were 980 differentially expressed TFs, belonging to 68 TF families, mainly including the AP2-EREBP, MYB, bHLH, WRKY, HB, C2H2, NAC, GRAS, bZIP, and Orphans families. Among them, the AP2-EREBP family, with 86 members were the most numerous. Different TF genes were found to display differential expression during P. infestans infection in Qingshu 9, and these genes may positively or negatively regulate the response to P. infestans and co-regulate the resistance of Qingshu 9. These results provide a resource for future research into resistance genes, and the cloning of disease-resistant TF genes is of great significance for genetic engineering to improve disease resistance in potato.

4.4. Protein Kinases May Participate in the Interaction between Qingshu 9 and P. infestans

Previous studies have shown that plant receptor protein kinases recognize the pathogen-associated molecular patterns of pathogens as well as activated and transmitted immune signals [58]. In this study, we found that the molecular functional ontology of group Pi24h vs. Pi0h and group Pi72h vs. Pi0h both exhibited enriched kinase activity, phosphotransferase activity, alcohol group as acceptor, and protein kinase activity. Many DEGs could be annotated to kinase activity and protein kinase activity. Calcium-dependent protein kinases (CDPKs or CPKs) have been found to be involved in growth and developmental processes as well as in defense against diverse environmental stresses [59]. Reactive oxygen species (ROS) have been implicated in plant innate immunity and calcium-dependent protein kinases with regulation of the production of ROS by potato NADPH oxidase [60]. The CDPK family members are particularly involved in plant–pathogen interaction, and StCDPK7 has emerged as a relevant player that could be manipulated to deploy disease resistance in potato [61]. StCDPK5 has been shown to phosphorylate the N-terminal region of plasma membrane RBOH proteins, and participate in StRBOHB-mediated ROS burst [62]. Our results suggest that at the 24 hpi and 72 hpi of infection, protein kinase may play an important role in signal recognition and signal transduction, contributing to Qingshu 9’s resistance.

4.5. Disease Resistance-Related Genes May Enhance the Disease Resistance of Qingshu 9

In this study, DEGs were significantly enriched in the categories of biosynthesis of secondary metabolites, plant–pathogen interaction pathways, and transcriptional regulation, etc., which are considered to play important roles in Qingshu 9’s resistance to late blight and is similar to the results found for plant-pathogen interaction in previous reports [63,64,65,66,67]. In addition, a large number of disease resistance-related genes, such as PR1, NBS-LRR, cell wall protein, and many lignin synthesis-related genes were significantly induced by P. infestans infection. Previous studies have demonstrated that in the defense response process of potato against P. infestans, secondary metabolites such as phenylpropanoid and cell wall synthesis-related biosynthesis participated in the plant’s disease resistance defense by synthesizing lignin and strengthening the cell wall [57]. The lignin content of the resistant potato variety Orion increased significantly compared to the susceptible variety Majestic after infection [68]. The increase in the enzyme activity of phenylalanine ammonia lyase, and lignin content were able to enhance the resistance of potato tubers to P. infestans [69]. After inoculation with P. infestans, the Phytophthora-resistant variety Kennebec showed increased lignin content and early expression of defense-related genes PAL-1, HMG-2, PR-1 and PR-5 compare to the susceptible variety Russet Burbank [70]. Similarly, the lignin content in tomato roots after 16 days of Verticillium dahliae infection was 43% higher in resistant varieties than the susceptible varieties [71]. In this study, many lignin synthesis-related genes were induced, we speculated that the high expression of lignin biosynthesis-related genes could strengthen the cell wall of Qingshu 9 and then enhance its resistance against cellular invasion by P. infestans. Additionally, the gene cytochrome P450 and ethylene response factors associated with hypersensitive response were also induced by P. infestans infection. These results suggest that the infection of P. infestans activates a series of resistance-related genes, and that the resistance of Qingshu 9 is controlled by multiple genes and may owed the quantity resistance. In addition, the 311 potato R genes were obtained by comparison with the plant R gene database. Among them are known genes, such as R1 and R3a, but most of them are unnamed new genes, which will provide a large number of candidate genes for researching the disease resistance of Qingshu 9.

5. Conclusions

In summary, through transcriptomic analyses of Qingshu 9 infected by P. infestans at four time points, we systematically identified genes associated with host-pathogen interaction. GO and KEGG analysis of the DEGs provided some insights into molecular mechanisms underlying late blight disease resistance of Qingshu 9. This study not only provides important candidate genes for further functional study, but also has potential to contribute to genetic improvement of the tolerance to late blight in potato and beyond.

Supplementary Materials

The following are available online at https://www.mdpi.com/article/10.3390/agronomy11101919/s1, Figure S1: The enrichment analysis of DEGs in group Pi48h vs. Pi0h, Figure S2: The enrichment analysis of DEGs in group Pi72h vs. Pi0h.

Author Contributions

Conceptualization, W.S. and J.W.; methodology, M.H., Y.Z. and Y.M.; validation, M.H. and G.Y.; formal analysis, M.H. and J.Z.; investigation, G.Y.; resources, Y.Z.; data curation, M.H.; writing—original draft preparation, M.H.; writing—review and editing, W.S. and J.W.; supervision, W.S.; project administration, J.W. All authors have read and agreed to the published version of the manuscript.

Funding

This research was supported by Qinghai Province Science and Technology Cooperation program (2018-HZ-802), China Agriculture Research System of MOF and MARA, and CAS “Light of West China” Program1_8.

Institutional Review Board Statement

Not applicable.

Informed Consent Statement

Not applicable.

Data Availability Statement

The RNA-Seq data generated for the analysis are deposited at the NCBI Sequence Read Archive (BioProject ID: PRJNA728373).

Conflicts of Interest

The authors declare no conflict of interest.

References

  1. Haverkort, A.J.; Hillier, J.G. Cool farm tool-potato: Model description and performance of four production systems. Potato Res. 2011, 54, 355–369. [Google Scholar] [CrossRef] [Green Version]
  2. Wang, X.; Boevink, P.; McLellan, H.; Armstrong, M.; Bukharova, T.; Qin, Z.; Birch, P.R.J. A host KH RNA-binding protein is a susceptibility factor targeted by an RXLR effector to promote late blight disease. Mol. Plant 2015, 8, 1385–1395. [Google Scholar] [CrossRef] [Green Version]
  3. Boevink, P.C.; Wang, X.; McLellan, H.; He, Q.; Naqvi, S.; Armstrong, M.R.; Zhang, W.; Hein, I.; Gilroy, E.M.; Tian, Z.D.; et al. A Phytophthora infestans RXLR effector targets plant PP1c isoforms that promote late blight disease. Nat. Commun. 2016, 7, 10311. [Google Scholar] [CrossRef] [PubMed] [Green Version]
  4. Watanabe, K. Potato genetics, genomics, and applications. Breed. Sci. 2015, 65, 53–68. [Google Scholar] [CrossRef] [Green Version]
  5. Black, W.; Gallegly, M.E. Screening of Solanum species for resistance to physiologic races of Phytophthora infestans. Am. J. Potato Res. 1957, 34, 273–281. [Google Scholar] [CrossRef]
  6. Malcolmson, J.F.; Black, W. New R genes in solanum demissum lindl. and their complementary races of Phytophthora infestans (Mont.) de Bary. Euphytica 1966, 15, 199–203. [Google Scholar] [CrossRef]
  7. Fry, W. Phytophthora infestans: The plant (and R gene) destroyer. Mol. Plant Pathol. 2008, 9, 385–402. [Google Scholar] [CrossRef] [PubMed]
  8. Kwenda, S.; Motlolometsi, T.V.; Birch, P.R.J.; Moleleki, L.N. RNA-seq profiling reveals defense responses in a tolerant potato cultivar to stem infection by Pectobacterium carotovorum ssp. Brasiliense. Front. Plant Sci. 2016, 7, 1905. [Google Scholar] [CrossRef]
  9. Kou, Y.; Wang, S. Broad-spectrum and durability: Understanding of quantitative disease resistance. Curr. Opin. Plant Biol. 2010, 13, 181–185. [Google Scholar] [CrossRef]
  10. Haverkort, A.J.; Boonekamp, P.M.; Hutten, R.; Jacobsen, E.; Lotz, L.A.P.; Kessel, G.J.T.; Vossen, J.H.; Visser, R.G.F. Durable late blight resistance in potato through dynamic varieties obtained by cisgenesis: Scientific and societal advances in the durph project. Potato Res. 2016, 59, 35–66. [Google Scholar] [CrossRef] [Green Version]
  11. Avrova, A.O.; Stewart, H.E.; De Jong, W.; Heilbronn, J.; Lyon, G.D.; Birch, P.R.J. A cysteine protease gene is expressed early in resistant potato interactions with Phytophthora infestans. Mol. Plant-Microbe Interact. 1999, 12, 1114–1119. [Google Scholar] [CrossRef] [PubMed] [Green Version]
  12. Beyer, K.; Binder, A.; Boller, T.; Collinge, M. Identification of potato genes induced during colonization by Phytophthora infestans. Mol. Plant Pathol. 2001, 2, 125–134. [Google Scholar] [CrossRef] [PubMed]
  13. Collinge, M.; Boller, T. Differential induction of two potato genes, Stprx2 and StNAC, in response to infection by Phytophthora infestans and to wounding. Plant Mol. Biol. 2001, 46, 521–529. [Google Scholar] [CrossRef] [PubMed]
  14. Zhu, B.; Chen, T.H.H.; Li, P.H. Expression of three osmotin-like protein genes in response to osmotic and fungal infection in potato. Plant Mol. Biol. 1995, 28, 17–26. [Google Scholar] [CrossRef] [PubMed]
  15. Tyler, B.M.; Rouxel, T. Effectors of Fungi and Oomycetes: Their virulence and avirulence functions and translocation from pathogen to host cells. Mol. Plant Immun. 2012, 123–167. [Google Scholar]
  16. Wirthmueller, L.; Maqbool, A.; Banfield, M.J. On the front line: Structural insights into plant–pathogen interactions. Nat. Rev. Microbiol. 2013, 11, 761–776. [Google Scholar] [CrossRef]
  17. Birch, P.R.J.; Avrova, A.O.; Duncan, J.M.; Lyon, G.D.; Toth, R.L. Isolation of potato genes that are induced during an early stage of the hypersensitive response to Phytophthora infestans. Mol. Plant-Microbe Interact. 1999, 12, 356–361. [Google Scholar] [CrossRef] [Green Version]
  18. Jung, H.W.; Hwang, B.K. Isolation, Partial sequencing, and expression of pathogenesis-related cDNA genes from pepper leaves infected by Xanthomonas campestris pv. vesicatoria. Mol. Plant-Microbe Interact. 2000, 13, 136–142. [Google Scholar] [CrossRef] [Green Version]
  19. Haas, B.J.; Kamoun, S.; Zody, M.C.; Jiang, R.H.Y.; Handsaker, R.E.; Cano, L.M.; Grabherr, M.; Kodira, C.D.; Raffaele, S.; Torto-Alalibo, T.; et al. Genome sequence and analysis of the Irish potato famine pathogen Phytophthora infestans. Nat. 2009, 461, 393–398. [Google Scholar] [CrossRef]
  20. Potato Genome Sequencing Consortium. Genome sequence and analysis of the tuber crop potato. Nature 2011, 475, 189–195. [Google Scholar] [CrossRef] [Green Version]
  21. Restrepo, S.; Myers, K.L.; del Pozo, O.; Martin, G.B.; Hart, A.L.; Buell, C.R.; Smart, C.D. Gene profiling of a compatible interaction between Phytophthora infestans and Solanum tuberosum suggests a role for carbonic anhydrase. Mol. Plant-Microbe Interact. 2005, 18, 913–922. [Google Scholar] [CrossRef] [Green Version]
  22. Gyetvai, G.; Sønderkær, M.; Göbel, U.; Basekow, R.; Ballvora, A.; Imhoff, M.; Kersten, B.; Nielsen, K.; Gebhardt, C. The transcriptome of compatible and incompatible interactions of potato (Solanum tuberosum) with Phytophthora infestans revealed by DeepSAGE analysis. PLoS ONE 2012, 7, e31526. [Google Scholar] [CrossRef] [PubMed] [Green Version]
  23. Draffehn, A.M.; Li, L.; Krezdorn, N.; Ding, J.; Lübeck, J.; Strahwald, J.; Muktar, M.S.; Walkemeier, B.; Rotter, B.; Gebhardt, C. Comparative transcript profiling by SuperSAGE identifies novel candidate genes for controlling potato quantitative resistance to late blight not compromised by late maturity. Front. Plant Sci. 2013, 4, 423. [Google Scholar] [CrossRef] [Green Version]
  24. Barakat, A.; DiLoreto, D.S.; Zhang, Y.; Smith, C.; Baier, K.; Powell, W.A.; Wheeler, N.; Sederoff, R.; Carlson, J.E. Comparison of the transcriptomes of American chestnut (Castanea dentata) and Chinese chestnut (Castanea mollissima) in response to the chestnut blight infection. BMC Plant Biol. 2009, 9, 1–11. [Google Scholar] [CrossRef] [PubMed] [Green Version]
  25. Gao, L.L.; Tu, Z.J.; Millett, B.P.; Bradeen, J.M. Insights into organ-specifific pathogen defense responses in plants: RNA-seq analysis of potato tuber-Phytophthora infestans interactions. BMC Genom. 2013, 14, 340. [Google Scholar] [CrossRef] [PubMed] [Green Version]
  26. Ali, A.; Alexandersson, E.; Sandin, M.; Resjö, S.; Lenman, M.; Hedley, P.; Levander, F.; Andreasson, E. Quantitative proteomics and transcriptomics of potato in response to Phytophthora infestans in compatible and incompatible interactions. BMC Genom. 2014, 15, 497. [Google Scholar] [CrossRef] [Green Version]
  27. Ballester, A.; Norelli, J.; Burchard, E.; Abdelfattah, A.; Levin, E.; González-Candelas, L.; Dorby, S.; Wisniewski, M. Transcriptomic Response of Resistant (PI613981-Malus sieversii) and Susceptible (“Royal Gala”) Genotypes of Apple to Blue Mold (Penicillium expansum) Infection. Front. Plant Sci. 2017, 8, 1981. [Google Scholar] [CrossRef] [PubMed]
  28. Yang, X.; Guo, X.; Yang, Y.; Ye, P.; Xiong, X.; Liu, J.; Dong, D.; Li, G. Gene profiling in late blight resistance in potato genotype SD20. Int. J. Mol. Sci. 2018, 19, 1728. [Google Scholar] [CrossRef] [Green Version]
  29. Frades, I.; Abreha, K.B.; Proux-Wéra, E.; Lankinen, Å.; Andreasson, E.; Alexandersson, E. A novel workflow correlating RNA-seq data to Phythophthora infestans resistance levels in wild Solanum species and potato clones. Front. Plant Sci. 2015, 6, 718. [Google Scholar] [CrossRef] [Green Version]
  30. Yin, J.L. Evaluation of Major Potato Varieties in Northwestern China for Late Blight Resistance and Identification of Candidate Core RXLR Effector Genes from Phytophthora Infestans; Northwest A&F University: Xianyang, China, 2017. [Google Scholar]
  31. Bolser, D.; Staines, D.M.; Pritchard, E.; Kersey, P. Ensembl Plants: Integrating tools for visualizing, mining, and analyzing plant genomics data. Methods Mol. Biol. 2016, 115–140. [Google Scholar]
  32. Kim, D.; Langmead, B.; Salzberg, S.L. Hisat: A fast spliced aligner with low memory requirements. Nat. Methods 2015, 12, 357–360. [Google Scholar] [CrossRef] [Green Version]
  33. Trapnell, C.; Williams, B.A.; Pertea, G.; Mortazavi, A.; Kwan, G.; Van Baren, M.J.; Salzberg, S.L.; Wold, B.J.; Pachter, L. Transcript assembly and quantification by RNA-seq reveals unannotated transcripts and isoform switching during cell differentiation. Nat. Biotechnol. 2010, 28, 511–515. [Google Scholar] [CrossRef] [PubMed] [Green Version]
  34. Anders, S.; Huber, W. Differential expression analysis for sequence count data. Genome Biol. 2010, 11, R106. [Google Scholar] [CrossRef] [PubMed] [Green Version]
  35. Benjamini, Y.; Hochberg, Y. Controlling the false discovery rate: A practical and powerful approach to multiple testing. J. R. Stat. Soc. 1995, 57, 289–300. [Google Scholar] [CrossRef]
  36. Young, M.D.; Wakefield, M.J.; Smyth, G.K.; Oshlack, A. Gene ontology analysis for RNA-seq: Accounting for selection bias. Genome Biol. 2010, 11, R14. [Google Scholar] [CrossRef] [Green Version]
  37. Kanehisa, M.; Araki, M.; Goto, S.; Hattori, M.; Hirakawa, M.; Itoh, M.; Katayama, T.; Kawashima, S.; Okuda, S.; Tokimatsu, T.; et al. KEGG for linking genomes to life and the environment. Nucleic Acids Res. 2007, 36, 480–484. [Google Scholar] [CrossRef] [PubMed]
  38. Xie, C.; Mao, X.; Huang, J.; Ding, Y.; Wu, J.; Dong, S.; Kong, L.; Gao, G.; Li, C.; Wei, L. KOBAS 2.0: A web server for annotation and identification of enriched pathways and diseases. Nucleic Acids Res. 2011, 39, 316–322. [Google Scholar] [CrossRef] [PubMed] [Green Version]
  39. Perez-Rodriguez, P.; Riano-Pachon, D.M.; Correa, L.G.G.; Rensing, S.A.; Kersten, B.; Mueller-Roeber, B. PlnTFDB: Updated content and new features of the plant transcription factor database. Nucleic Acids Res. 2010, 38, 822–827. [Google Scholar] [CrossRef] [Green Version]
  40. Jin, J.; Zhang, H.; Kong, L.; Gao, G.; Luo, J. PlantTFDB 3.0: A portal for the functional and evolutionary study of plant transcription factors. Nucleic Acids Res. 2014, 42, 1182–1187. [Google Scholar] [CrossRef] [Green Version]
  41. Livak, K.J.; Schmittgen, T.D. Analysis of relative gene expression data using real-Time quantitative PCR and the 2−ΔΔCT method. Methods 2001, 25, 402–408. [Google Scholar] [CrossRef]
  42. Chang, C.; Yu, D.; Jiao, J.; Jing, S.; Schulze-Lefert, P.; Shen, Q.H. Barley MLA immune receptors directly interfere with antagonistically acting transcription factors to initiate disease resistance signaling. Plant Cell 2013, 25, 1158–1173. [Google Scholar] [CrossRef] [PubMed] [Green Version]
  43. Pandey, S.P.; Somssich, I.E. The role of WRKY transcription factors in plant immunity. Plant Physiology 2009, 150, 1648–1655. [Google Scholar] [CrossRef] [PubMed] [Green Version]
  44. Wang, Y.; Dang, F.; Liu, Z.; Wang, X.; Eulgem, T.; Lai, Y.; Yu, L.; She, J.; Shi, Y.; Lin, J.; et al. CaWRKY58, encoding a group I WRKY transcription factor of capsicum annuum, negatively regulates resistance to ralstonia solanacearum infection. Mol. Plant Pathol. 2013, 14, 131–144. [Google Scholar] [CrossRef] [PubMed]
  45. Cui, J.; Xu, P.; Meng, J.; Li, J.; Jiang, N.; Luan, Y. Transcriptome signatures of tomato leaf induced by Phytophthora infestans and functional identification of transcription factor SpWRKY3. Theor. Appl. Genet. 2017, 131, 787–800. [Google Scholar] [CrossRef] [PubMed]
  46. Gao, L.; Bradeen, J.M.; Sek-Man, W. Contrasting potato foliage and tuber defense mechanisms against the late blight pathogen Phytophthora infestans. PLoS ONE 2016, 11, e0159969. [Google Scholar] [CrossRef] [PubMed]
  47. Massa, A.N.; Childs, K.L.; Lin, H.; Bryan, G.J.; Giuliano, G.; Buell, C.R. The transcriptome of the reference potato genome Solanum tuberosum group phureja clone DM1-3 516R44. PLoS ONE 2011, 6, e26801. [Google Scholar] [CrossRef] [PubMed] [Green Version]
  48. Eulgem, T.; Rushton, P.; Robatzek, S.; Somssich, I. The WRKY superfamily of plant transcription factors. Trends Plant Sci. 2000, 5, 199–206. [Google Scholar] [CrossRef]
  49. Jakoby, M.; Weisshaar, B.; Dröge-Laser, W.; Vicente-Carbajosa, J.; Tiedemann, J.; Kroj, T.; Parcy, F. bZIP transcription factors in Arabidopsis. Trends Plant Sci. 2002, 7, 106–111. [Google Scholar] [CrossRef]
  50. Singh, K.B.; Foley, R.C.; Oñate-Sánchez, L. Transcription factors in plant defense and stress responses. Curr. Opin. Plant Biol. 2002, 5, 430–436. [Google Scholar] [CrossRef]
  51. Mizoi, J.; Shinozaki, K.; Yamaguchi-Shinozaki, K. AP2/ERF family transcription factors in plant abiotic stress responses. BBA-Gene Regul. Mech. 2012, 1819, 86–96. [Google Scholar] [CrossRef]
  52. Maruyama, Y.; Yamoto, N.; Suzuki, Y.; Chiba, Y.; Yamazaki, K.; Sato, T.; Yamaguchi, J. The Arabidopsis transcriptional repressor ERF9 participates in resistance against necrotrophic fungi. Plant Sci. 2013, 213, 79–87. [Google Scholar] [CrossRef]
  53. Tian, Z.; He, Q.; Wang, H.; Liu, Y.; Zhang, Y.; Shao, F.; Xie, C. The potato ERF transcription factor StERF3 negatively regulates resistance to Phytophthora infestans and salt tolerance in potato. Plant Cell Physiol. 2015, 56, 992–1005. [Google Scholar] [CrossRef] [Green Version]
  54. Alves, M.; Dadalto, S.; Gonçalves, A.; de Souza, G.; Barros, V.; Fietto, L. Transcription factor functional protein-protein interactions in plant defense responses. Proteomes 2014, 2, 85–106. [Google Scholar] [CrossRef] [Green Version]
  55. Yogendra, K.N.; Kumar, A.; Sarkar, K.; Li, Y.; Pushpa, D.; Mosa, K.A.; Duggavathi, R.; Kushalappa, A.C. Transcription factor StWRKY1 regulates phenylpropanoid metabolites conferring late blight resistance in potato. J. Exp. Bot. 2015, 66, 7377–7389. [Google Scholar] [CrossRef] [Green Version]
  56. Yogendra, K.N.; Dhokane, D.; Kushalappa, A.C.; Sarmiento, F.; Rodriguez, E.; Mosquera, T. StWRKY8 transcription factor regulates benzylisoquinoline alkaloid pathway in potato conferring resistance to late blight. Plant Sci. 2017, 256, 208–216. [Google Scholar] [CrossRef]
  57. Kalenahalli, Y.N.; Sarkar, K.; Kage, U.; Kushalappa, A.C. Potato NAC43 and MYB8 mediated transcriptional regulation of secondary cell wall biosynthesis to contain Phytophthora infestans Infection. Plant Mol. Biol. Report. 2017, 35, 519–533. [Google Scholar]
  58. Chinchilla, D.; Zipfel, C.; Robatzek, S.; Kemmerling, B.; Nürnberger, T.; Jones, J.D.G.; Boller, T. A flagellin-induced complex of the receptor FLS2 and BAK1 initiates plant defence. Nature 2007, 448, 497–500. [Google Scholar] [CrossRef] [PubMed]
  59. Gromadka, R.; Cieśla, J.; Olszak, K.; Szczegielniak, J.; Muszyńska, G.; Polkowska-Kowalczyk, L. Genome-wide analysis and expression profiling of calcium-dependent protein kinases in potato (Solanum tuberosum). Plant Growth Regul. 2017, 84, 303–315. [Google Scholar] [CrossRef] [Green Version]
  60. Kobayashi, M.; Ohura, I.; Kawakita, K.; Yokota, N.; Fujiwara, M.; Shimamoto, K.; Yoshioka, H. Calcium-dependent protein kinases regulate the production of reactive oxygen species by potato NADPH oxidase. Plant Cell Online 2007, 19, 1065–1080. [Google Scholar] [CrossRef] [PubMed] [Green Version]
  61. Elisa, F.; María, E.S.; Franco, S.; Federico, G.M.; Rita, M.U. Analysis of the potato calcium-dependent protein kinase family and characterization of StCDPK7, a member induced upon infection with phytophthora infestans. Plant Cell Rep. 2017, 36, 1137–1157. [Google Scholar]
  62. Kobayashi, M.; Yoshioka, M.; Asai, S.; Nomura, H.; Kuchimura, K.; Mori, H.; Doke, N.; Yoshioka, H. StCDPK5 confers resistance to late blight pathogen but increases susceptibility to early blight pathogen in potato via reactive oxygen species burst. New Phytol. 2012, 196, 223–237. [Google Scholar] [CrossRef]
  63. Glazebrook, J. Contrasting mechanisms of defense against biotrophic and necrotrophic pathogens. Annu. Rev. Phytopathol. 2005, 43, 205–227. [Google Scholar] [CrossRef] [PubMed]
  64. Robb, J.; Lee, B.; Nazar, R.N. Gene suppression in a tolerant tomato vascular pathogen interaction. Planta 2007, 226, 299–309. [Google Scholar] [CrossRef] [PubMed]
  65. Spoel, S.H.; Johnson, J.S.; Dong, X. Regulation of tradeoffs between plant defense against pathogens with different lifestyles. Proc. Natl. Acad. Sci. USA 2007, 104, 18842–18847. [Google Scholar] [CrossRef] [PubMed] [Green Version]
  66. Sun, Q.; Jiang, H.; Zhu, X.; Wang, W.; He, X.; Shi, Y.; Yuan, Y.; Du, X.; Cai, Y. Analysis of sea-island cotton and upland cotton in response to Verticillium dahliae infection by RNA sequencing. BMC Genom. 2013, 14, 852. [Google Scholar] [CrossRef] [PubMed] [Green Version]
  67. Tan, G.; Liu, K.; Kang, J.; Xu, K.; Zhang, Y.; Hu, L.; Zhang, J.; Li, C. Transcriptome analysis of the compatible interaction of tomato with verticillium dahliae using RNA-sequencing. Front. Plant Sci. 2015, 6, 428. [Google Scholar] [CrossRef] [Green Version]
  68. Friend, J.; Reynolds, S.B.; Aveyard, M.A. Phenylalanine ammonia lyase, chlorogenic acid and lignin in potato tuber tissue inoculated with Phytophthora infestans. Physiol. Plant Pathol. 1973, 3, 495–507. [Google Scholar] [CrossRef]
  69. Henderson, S.J.; Friend, J. Increases in phenylalanine ammonia-lyase activity and lignin-like compounds as race-specific-resistance responses of potato tubers to Phytophthora infestans. Biochem. Soc. Trans. 1978, 6, 393. [Google Scholar] [CrossRef] [PubMed]
  70. Wang, X.; El Hadrami, A.; Adam, L.R.; Daayf, F. Differential activation and suppression of potato defence responses by Phytophthora infestans isolates representing US-1 and US-8 genotypes. Plant Pathol. 2010, 57, 1026–1037. [Google Scholar] [CrossRef]
  71. Gayoso, C.; Pomar, F.; Novo-Uzal, E.; Merino, F.; Martínez de Ilárduya, Ó. The Ve-mediated resistance response of the tomato to Verticillium dahliae involves H2O2, peroxidase and lignins and drives PAL gene expression. BMC Plant Biol. 2010, 10, 232. [Google Scholar] [CrossRef] [Green Version]
Figure 1. The appropriate time points of Qingshu 9 infected with P. infestans were confirmed by microscopic observation. (A,E) At 0 h post-inoculation (hpi), the stomas can be clearly seen and the infection has not yet started ((E) bar = 20 µm). (B,F) At 24 hpi, sporadic necrotic spots appeared on the leaves, and the necrotic spots were surrounded by hyphae ((F) bar = 10µm). (C,G) At 48 hpi, the number of lesions and hyphae gradually increase (G) bar = 10 µm). (D,H) At 72 hpi, the area and number of lesions have increased significantly ((H) bar = 10 µm).
Agronomy 11 01919 g001
Figure 2. Venn diagram for comparison of DEGs at different infection time points. The red, green and blue circles represent the DEGs at 24 hpi, 48 hpi and 72 hpi, respectively, with respect to 0 hpi. The Venn diagram on the left (A) represents total differential genes, and the one on the right (B) represents differential genes that are upregulated and downregulated.
Agronomy 11 01919 g002
Figure 3. Temporal dynamics of Qingshu 9 differentially expressed genes. The DEGs of Qingshu 9 were clustered by k−mean. The gray lines in each figure represent the line graphs of the relative expression levels of genes in a cluster under different infection times, the blue lines represent the line graphs of the average relative expression levels of all genes in the cluster under different infection times, and the red lines represent the baseline. The x−axis represents the experimental conditions, and the y−axis represents the relative expression. The area above the red line represents upregulated genes, and the bottom area represents downregulated genes.
Agronomy 11 01919 g003
Figure 4. The enrichment analysis of DEGs at different infection time points. (A) GO enrichment of DEGs in group Pi24h vs. Pi0h (left) and the proportion of genes from 4 subclusters in each GO term (right). The histogram intuitively reflects the distribution of the number of DEGs in GO terms enriched in biological processes (BP), cellular components (CC) and molecular functions (MF). We selected the 30 GO terms with the most significant enrichment to show in the figures. Green, orange and blue histogram represent BP, CC and MF, respectively. The histograms of GO enrichment at the other two time points are shown in the supplementary material. In the KEGG enrichment results of DEGs (B), we selected the 20 most significantly enriched pathway entries for display in the graph. The ordinate indicates the name of the pathway, the abscissa indicates the Rich factor, the size of the dot indicates the number of differentially expressed genes in the pathway, and the color of the dot corresponds to different Qvalue ranges. Only the results of Pi24h vs. Pi0h are shown here, while the results at other time points are shown in the Supplementary Materials.
Agronomy 11 01919 g004
Figure 5. The GO enrichment histogram of co-upregulated and downregulated genes. The histogram intuitively reflects the distribution of the number of DEGs in GO terms enriched in BP, CC and MF. We selected the 30 GO terms with the most significant enrichment to show in the figures. The ordinate is the enriched GO term, and the abscissa is the number of differentially expressed genes in the term. Different colors are used to distinguish BP (green), CC (orange) and MF (blue). (A,B) respectively represent the GO enrichment of the upregulated genes and downregulated genes.
Agronomy 11 01919 g005
Figure 6. Histogram of the number of genes in the top 10 differentially expressed transcription factor families with the most members. Blue, red and green represent group Pi24h vs. Pi0h, group Pi48h vs. Pi0h and group Pi72h vs. Pi0h, respectively. The upper part of the x-axis represents the number of upregulated expressed genes, and the lower part is the number of downregulated expressed genes.
Agronomy 11 01919 g006
Figure 7. Validation of expression patterns of selected genes by qRT-PCR. The ordinate on the left represents the relative expression level of the genes, the ordinate on the right represents the FPKM of the genes, and the abscissa represents the infection time point. The blue and yellow columns are the relative expression level and FPKM of the genes, respectively. The bars represent the standard errors of three biological replicates.
Agronomy 11 01919 g007
Table 1. Primers used in qRT-PCR analysis in this study.
Gene IDForward Primer (5′-3′)Reverse Primer (5′-3′)
PGSC0003DMG400003863
(Zinc finger protein 593)
TCAAGACGAAGAAGCACAGGAAGCAGCAGCTAAGTCGGCATCAAGTTG
PGSC0003DMG400005113
(PR1 protein)
GCGGCTGGTGCTGTGAAGATGACCTGACTCTAGCACAACCGAGAC
PGSC0003DMG400022159
(Heat shock cognate protein 80)
AGCTGAGAAGGTTGTTGTGACCACCAGGTCCTTGAGCCTACGTTCTTC
PGSC0003DMG400029732
(Auxin repressed/dormancy associated protein)
TACCAGAGGTCTCTGTCGATGCCGTAGGAGCGTTAGGATGAGAAGGC
PGSC0003DMG400019435
(Wound-induced protein WIN2)
CAACTTGTGTTGCAGCCAATTCGGCAGCGGCTCTGGCAACCTTG
PGSC0003DMG400010173
(Avr9/Cf-9 rapidly elicited protein 140)
GGTCCAATTGCTGGGATTCTCGTCACTGGAATAACCACCTTAT
PGSC0003DMG400005835
(WRKY transcription factor-30)
ACATACCGAGGCTCCCATAATTGCTGCCCTGTTGGATAAA
PGSC0003DMG400008337
(MYB21)
GGCATCTGGAATTGGAAACAGCTAACATCAGGGCGGAGATAAT
PGSC0003DMG400022134
(Salicylic acid-induced protein 19)
GAAATTCCTGAAGTGGCATGTGGATACGGTGGCTCTGTTTGT
GenBank No. X83206AGATGCTTACGCTGGATGGAATGCTTCCGGTGTGGTTGGATTCTGTTC
Table 2. The data quality analysis in the investigated samples.
SampleRaw ReadsClean ReadsUniquely Mapped ReadsAverage
Mapped Rate
Average
Raw Reads
Average
Gene Number
Pi0h_145,925,46245,011,85234,474,92977.58%47,753,44324,251
Pi0h_254,412,46052,408,26842,404,666
Pi0h_342,922,40841,532,39231,252,486
Pi24h_144,129,57442,199,74633,418,53177.82%50,630,98723,579
Pi24h_261,477,95257,247,99846,896,846
Pi24h_346,285,43644,600,98432,263,042
Pi48h_147,926,18845,964,68236,934,98975.99%49,302,73223,412
Pi48h_248,552,12046,549,34033,115,129
Pi48h_351,429,89048,463,46437,059,231
Pi72h_144,484,05242,866,80432,606,65074.79%48,372,64523,736
Pi72h_254,973,32053,716,86242,717,598
Pi72h_345,660,56444,668,07030,717,314
Table 3. Correlation coefficient between biological replicates.
SamplePi0h_1Pi0h_2Pi0h_3Pi24h_1Pi24h_2Pi24h_3Pi48h_1Pi48h_2Pi48h_3Pi72h_1Pi72h_2Pi72h_3
Pi0h_11
Pi0h_20.991
Pi0h_30.990.991
Pi24h_10.490.510.541
Pi24h_20.570.570.600.901
Pi24h_30.440.450.490.840.731
Pi48h_10.880.890.890.540.600.491
Pi48h_20.730.730.760.550.600.580.901
Pi48h_30.890.880.880.420.510.390.950.821
Pi72h_10.830.840.840.660.740.550.870.740.841
Pi72h_20.870.880.860.590.660.490.880.690.880.961
Pi72h_30.840.850.850.690.750.540.870.720.830.980.961
Publisher’s Note: MDPI stays neutral with regard to jurisdictional claims in published maps and institutional affiliations.

