Article

Strategic Identification of New Genetic Diversity to Expand Lentil (Lens culinaris Medik.) Production (Using Nepal as an Example)

1
Department of Plant Sciences, University of Saskatchewan, Saskatoon, SK S7N 5A8, Canada
2
Local Initiatives for Biodiversity, Research and Development, P.O. Box 324, Kaski, Pokhara 33800, Nepal
*
Author to whom correspondence should be addressed.
Agronomy 2021, 11(10), 1933; https://doi.org/10.3390/agronomy11101933
Submission received: 9 September 2021 / Accepted: 24 September 2021 / Published: 27 September 2021
(This article belongs to the Special Issue Plant Responses to Combined and Overlapping Abiotic Stress Conditions)

Abstract

:
Although lentil has a long history of cultivation, cultivars rely on a narrow genetic base, indicating room for broadening the diversity. Two field experiments were conducted at Bardiya, Nepal, during winter 2016 and 2017, with 324 diverse lentil genotypes obtained from genebanks and breeding programs around the world. Phenological traits related to adaptation, particularly days to flower, were assessed. A photothermal model was used to predict days to flower in new environments to identify genotypes that may be suitable for additional growing regions in Nepal, allowing for the expansion of the production area. Many putatively adapted genotypes were identified for terai, mid-hill, and high-hill growing regions. The list includes large-seeded or yellow cotyledon lines, representing new market classes of lentils for Nepal.

1. Introduction

Globally, lentil is cultivated in more than 50 countries [1] typically categorized into three major lentil growing macro-environments: mediterranean, sub-tropical savannah, and temperate, where temperature and daylength differ considerably during the growing season [2,3,4]. There are about 58,000 accessions of the genus Lens (cultivated and wild species) currently housed in different gene banks worldwide [5]. These include landraces, breeding lines, advanced cultivars, and some unknown mixtures. Despite the availability of this large diversity, the majority of lentil-breeding programs use only a fraction of it, primarily due to the adaptation constraints of lentil germplasm from one environment when grown in a different environment [3,4,6]. These problems mostly arise from the temperature and photoperiod differences among environments [4,6]. Therefore, in order to overcome the adaptation constraints, understanding how diverse genotypes perform under field conditions is essential for sustainable lentil breeding. The systematic and judicious use of genetic variability helps maximize genetic gain and, over time, productivity.
Pulses are an integral part of a daily diet for the Nepalese people, and the majority consume pulses in the form of dal (thick soup usually consumed with rice and/or chapati) at least twice a day. Globally, Nepal is the fifth largest producer of lentils, contributing 4.3% of the world’s total lentil production [1]. Within the country, lentil is ranked first in area and production amongst pulse crops, accounting for 62.9% of the total area and 65.8% of total pulse crop production [7]. It has also been prioritized as an agricultural commodity with high export potential in Nepal, already contributing 2.3% of total national exports [8]. Although Nepal exports lentils to other parts of the world, the national production is not adequate to meet in-country demand, and there is a significant supply gap. With a few exceptions, lentil is produced throughout the country; however, commercial production is concentrated primarily on the terai [7], as the top ten lentil-producing districts are in this region [9]. The twelve cultivars of lentil, predominantly small red types, which have been released through the formal system in Nepal [10], have been grown by farmers mainly in the terai region. There is also evidence of farmers growing local landraces in some parts of the country, e.g., small, seed-sized, black seed-coat colored lentil is commonly grown by farmers in Gorkha, Rasuwa, Rukum, and Jumla [11,12,13,14]. Nepalese lentil cultivars tend to yield far less in farmers’ fields than do cultivars in high-production regions, such as Canada, suggesting room for improvement. There are numerous reasons for this gap, including limited availability of quality seeds and technical knowledge, disease incidence (mostly Stemphylium blight and Fusarium wilt [15]), and climatic stresses, especially early and terminal drought and erratic rainfall [16]. In addition, a dependency on limited genetic diversity [3,17], largely due to the genetic bottleneck created as lentils were disseminated through the Khyber Pass into the Indo-Gangetic Plain [18], could be limiting increases in productivity. To overcome this constraint and expand germplasm diversity, identifying additional germplasm sources that will likely be adapted to the region is necessary.
With few exceptions, recent research aimed at introducing new genotypes has focused on material obtained from the International Center for Agriculture Research in the Dry Areas (ICARDA). Most of these have been of South Asia and Mediterranean origin, potentially due to the need for early flowering [9,15,19]. The inclusion of relatively early flowering exotic germplasm with higher yield potential from other regions might help to increase the current production and area. Embracing genotypes with more diverse seed size and cotyledon color may also create greater interest among farmers and consumers. Additionally, due to the broad range of lentil-growing environments present within Nepal, there is room for expanding lentil production into new environments (e.g., high hills).
A photothermal model for lentil (1/f = a + bT + cP, where f = days to flowering, T = mean temperature, and P = mean photoperiod), described in an earlier study [6], has the potential for predicting days from sowing to flower (DTF) and has been used in a wide range of pulse crops. A more recent study [4] applied this photothermal model to a diverse collection of 324 lentil genotypes, enabling the prediction of DTF of a given genotype by providing the temperature and photoperiod information of a chosen location. The model could have been better if there were other environmental parameters included; however, it worked fine with just temperature and photoperiod from the perspective of making it simple in application. In addition, observations of DTF across nine locations were used to cluster genotypes into eight groups based on their phenological response to differing environments and represent different adaptation groups that can aid in the expansion of genetic diversity within Nepal. This study is an application of that broader study [4] to find potential genotypes selected from the pool of 324 lentil genotypes currently available from the International Center for Agricultural Research in the Dry Areas (ICARDA) genebank for any lentil-growing areas using temperature and photoperiod and preferred days to flowering information. The aim of this study was to identify sources of new diversity for lentil research and cultivar development in Nepal. With the limited availability of a narrow range of local and introduced diversity, the identification of promising, new adapted genotypes can be employed with immediate action to aid in cultivar choice among farmers and potentially expand the area for lentil production in Nepal. More importantly, the information generated from this study could be used in breeding programmes with a view to future cultivar development through crosses with novel sources of diversity.

2. Materials and Methods

2.1. Field Experiments and Data Collection

Two field trials were conducted in the winter of 2016 and 2017 at Bardiya, Nepal (28°15′07.6″ N, 81°30′05.4″ E), with a diversity panel of 324 lentil genotypes obtained from genebanks of ICARDA, United States Department of Agriculture (USDA), Plant Gene Resources of Canada (PGRC), as well as cultivars developed at the Crop Development Centre (CDC) of the University of Saskatchewan (U of S), Canada. These genotypes originated from 43 different countries, along with a few breeding lines from ICARDA, representing all three major lentil-growing environments. The panel varied in seed size, cotyledon and seed coat colors, and phenological traits. See https://knowpulse.usask.ca/study/2695319 (accessed on 8 September 2021) for details.
Seeds were sown in small plots with 25 seeds for each genotype in two 1-m rows in the first year and 50 seeds for each genotype in two 1-m rows (50 cm apart) in the second year. For both years, the experimental design was a randomized lattice square (18 × 18), replicated three times. Both field experiments were phenotyped for days to emergence (DTE), days to flowering (DTF), and days to swollen pod (DTS) when 10% of plants had emerged, flowered, had swollen pods, and 10 % of plants had 50% dry pods for days to maturity (DTM), respectively. Vegetative period (VEG) was recorded as the number of days between emergence and flowering, and the reproductive period (REP) was calculated as the difference between DTM and DTF. Environmental data, including temperature and rainfall, were obtained from the nearby meteorological station located at Khajura, Banke (28°6′35″ N, 81°35′42″ E) in both years. Photoperiod data were extracted using the insol package in R [20] after providing latitude, longitude, specific day, and time zone; duration between sunrise to sunset was used as the photoperiod value.

2.2. Data Analysis

All data analyses were performed in R 3.5.0 software [21]. Data wrangling and visualization was done using the following R packages: tidyverse [22], ggbeeswarm [23], and ggpubr [24]. An analysis of variance (ANOVA) was performed with the mixed model procedure using the lmerTest package [25] to compare 324 lentil genotypes for DTE, DTF, DTS, DTM, VEG, and REP. During the analysis, genotype (G), experiment year (E), and their interaction (G × E) were considered as fixed effects, whereas block nested over the replication again nested within the experiment year was considered a random effect. The mixed model used for the analysis was
Yi = Xibi + Zigi + ei
where Yi is a response variable observed for individual i, bi is a vector of fixed effects, gi is a vector of random effect for individuals, and ei represents residuals for the trait or environment i. X and Z are explanatory variables.
For each phenological trait, if the ANOVA indicated significant differences at or above the p < 0.05 level, the means were separated by the least significant difference (LSD) method using the emmeans package [26] in R. Values of measured traits were averaged across the two years if no significant G × E (p > 0.05) was detected. For analysis of traits where G × E was significant, the two years were kept separate, genotypes were considered a fixed effect, and replication was considered a random effect.

3. Results and Discussions

3.1. Variation in Phenological Traits among Genotypes and Experimental Years

Considerable variation was observed for phenological traits among the 324 lentil genotypes as well as some variability between years (Figure 1). The phenological traits, days to: emergence (DTE), flowering (DTF), and swollen pod (DTS) and maturity (DTM) were all significantly different (p < 0.001) for genotype and had a significant genotype by year interaction (Table 1). The vegetative period (VEG) and reproductive period (REP) were also significantly different (p < 0.001) for genotype and had a genotype by year interaction. All traits except DTE and REP were significantly different between years. The significant year variation for DTF, DTS, and DTM are likely the result of environmental factors related to an earlier seeding date in the second year (Figure 2). As both field experiments were conducted during the similar time of year and at the same location, photoperiod did not differ significantly; thus, the phenotypic variation was most likely due to the different temperature profile throughout the growing season as well as other factors, such as light quality, solar radiation, precipitation, etc. Due to elevated temperatures late in the growing season in 2016, 67 genotypes did not flower, and an additional 153 genotypes did not make it to full maturity in at least one replication. At 149 days after sowing, all plots that produced seed were harvested in 2016. The amount of rainfall would not have had a significant effect on flowering as it occurred during later growth stages.
Based on correlations among the phenological traits using the same 324 genotypes grown in the field conditions at nine different locations worldwide, it was clear that DTF was the primary factor driving adaptation at this and other all locations [4]. As the phenotypic data generated from the field trials from this study are already included in that study, we focused on DTF as the main phenological trait for discussion here.

3.2. New Genotypic Options for Nepalese Agricultural Systems

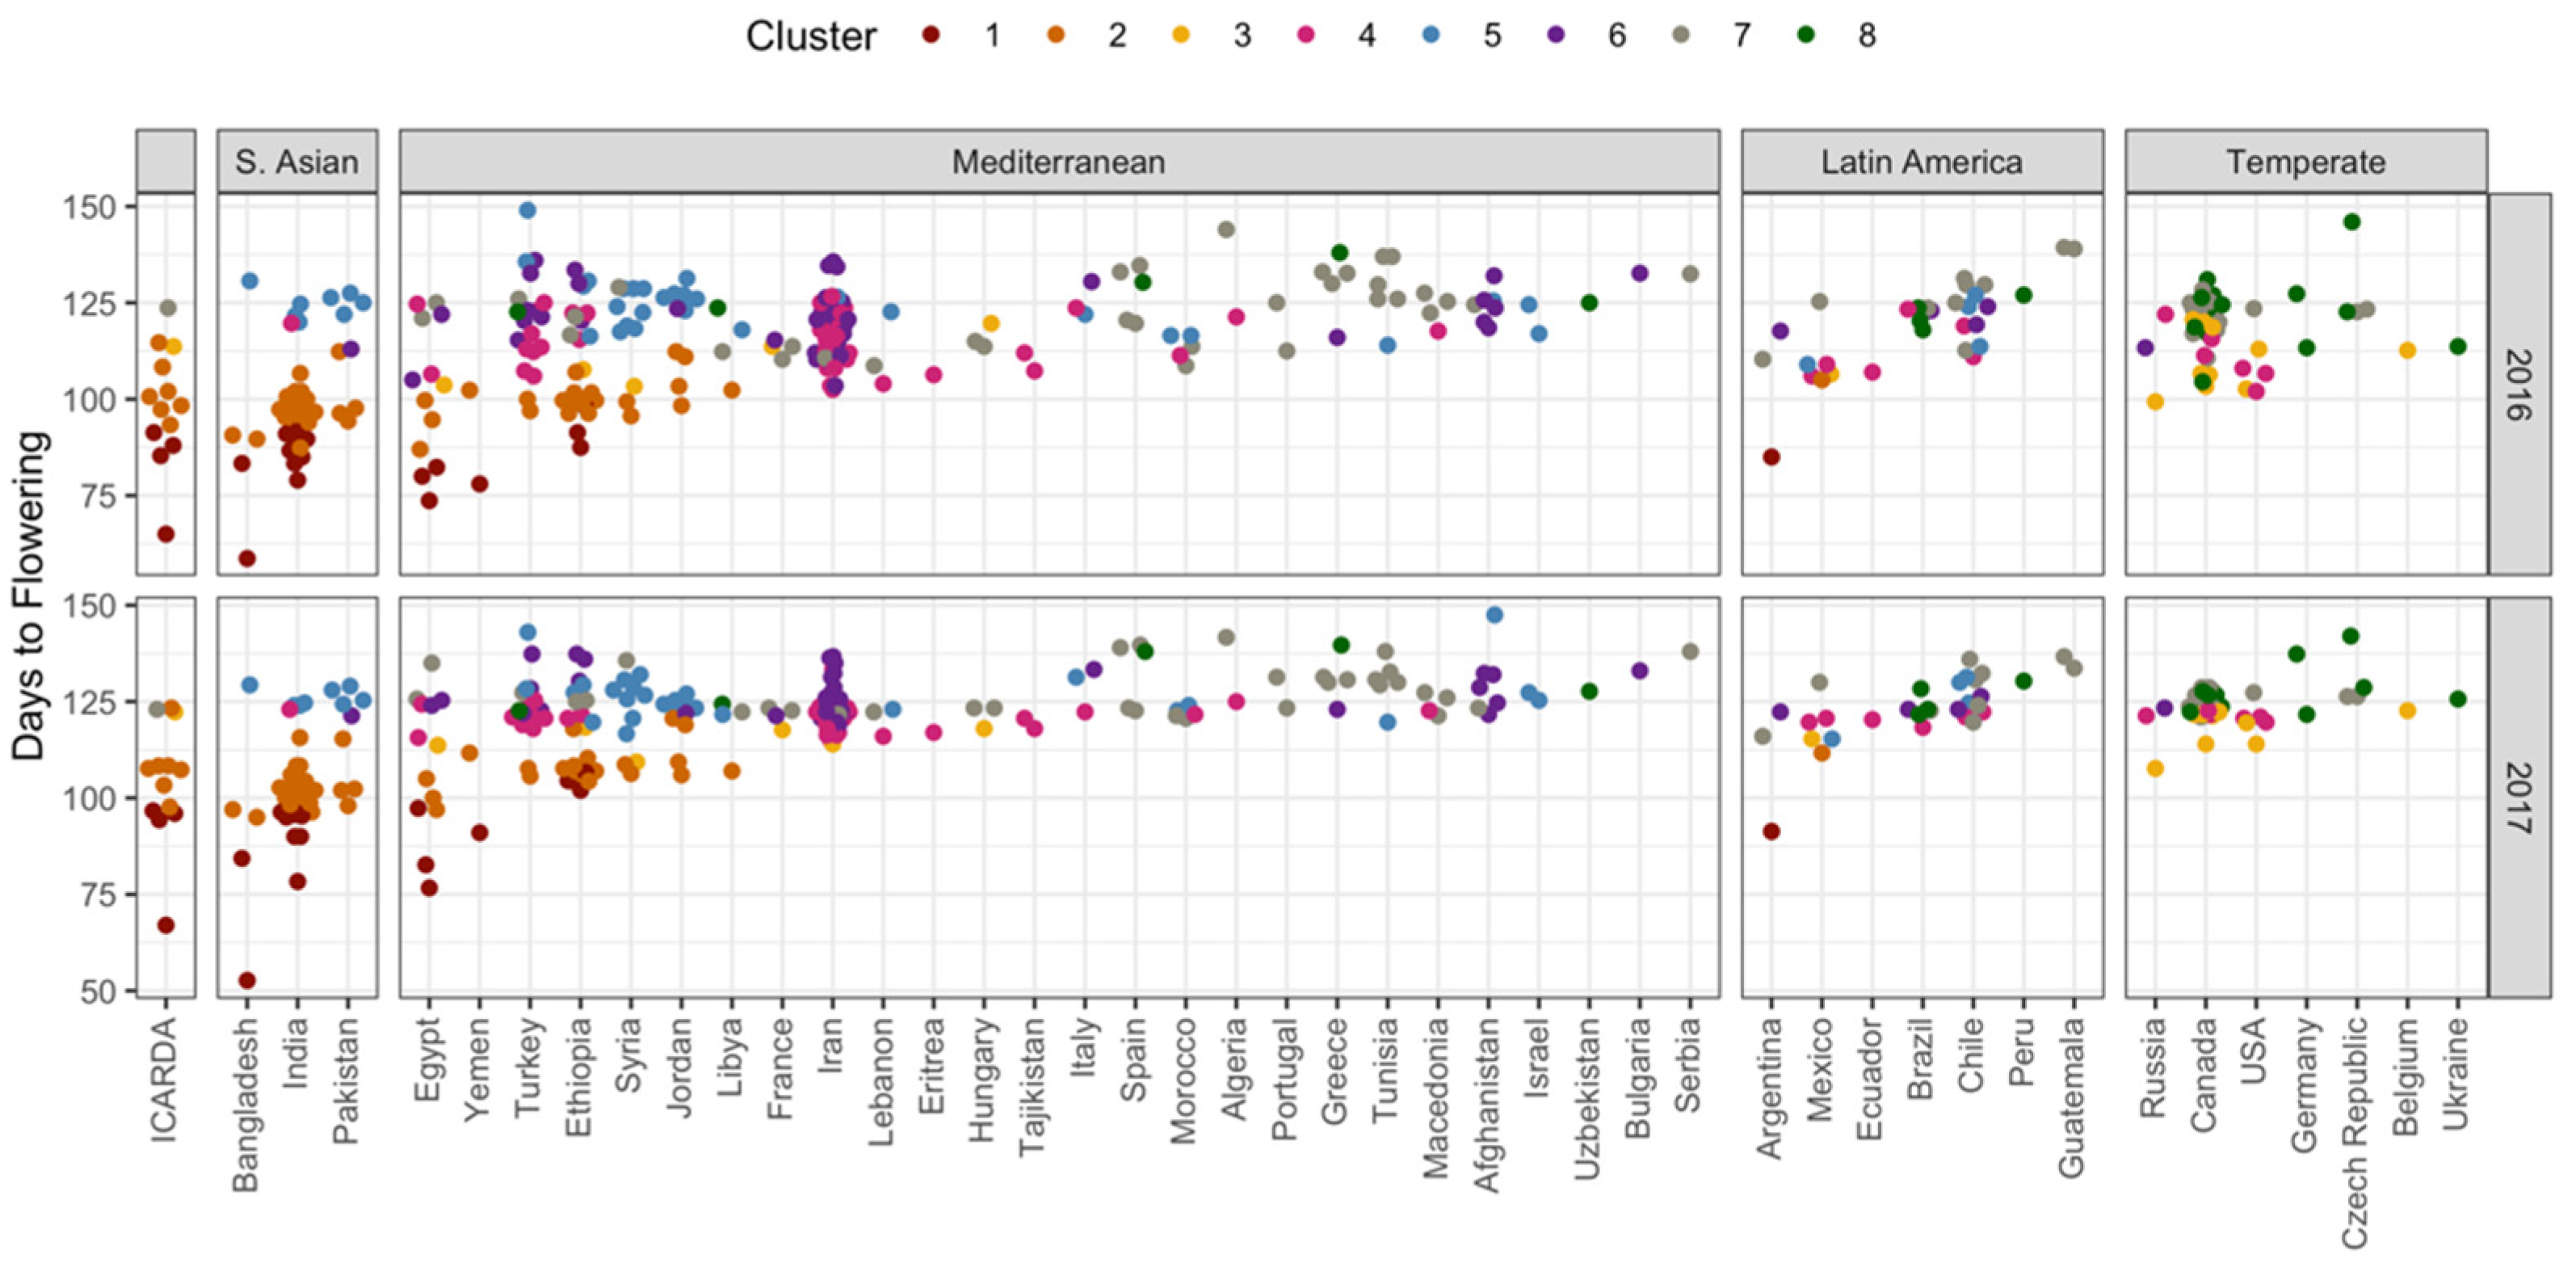
Variations in DTF existed both within and amongst countries of origin, with genotypes from South Asian countries tending to flower earliest, those from Latin American and temperate countries the latest, and both early- and later-flowering genotypes coming from Mediterranean countries (Figure 3). However, caution should be used when considering the country of origin, as this information might not always be correct and could represent diverse growing regions that exist within a country. For example, Ethiopia, Turkey, and Nepal have both highland and lowland production regions with differing temperature and photoperiod regimes during the growing season.
Using principal component analysis (PCA) and hierarchical clustering of DTF data from across 18 site-years, the 324 genotypes were classified into eight groups, reflecting their phenological response to varying temperatures and photoperiods [4]. Genotypes with South Asian origins were predominately found in clusters 1 and 2, with some later-flowering genotypes in cluster 5 (Figure 3). Cluster 5 represents those genotypes with the lowest temperature sensitivity [4], likely adapted to the cooler, intermediate elevations between the Afghanistan highlands and the Indo-Gangetic Plain as lentils were disseminated through the Khyber Pass. The lack of representation of South Asian genotypes in other clusters illustrates the intense selection pressures that have resulted in a bottleneck, limiting genetic diversity within germplasm grown in the region. These clusters can be used as a guide for identifying new genotypes that could be used to increase production and genetic diversity in the region.
Among the eight DTF clusters, cluster 1 was earliest to flower in Nepal, followed by cluster 2, then cluster 3; clusters 4–8 were all similar and late (Figure 3). Due to the need for lentil breeders in South Asia to develop early flowering and maturing varieties to capture residual soil moisture and to avoid spring terminal drought [27], all genotypes from clusters 1 and 2 could be considered for further screening and immediate use in a breeding program. If, on the other hand, the goal is to broaden the genetic diversity, identifying genotypes outside of these cluster groups would be preferred but would need to be crossed to adapted material and subject to intense selection for appropriate maturity. Likewise, since a majority of the lentil cultivars in Nepal originated from either South Asia or the Mediterranean region [9,15,19], genotypes originating from beyond the usual sources but that still flower and mature early would also serve this purpose.

3.3. Identifying Genotypes for Testing in Expanded Growing Regions Using a Photothermal Model

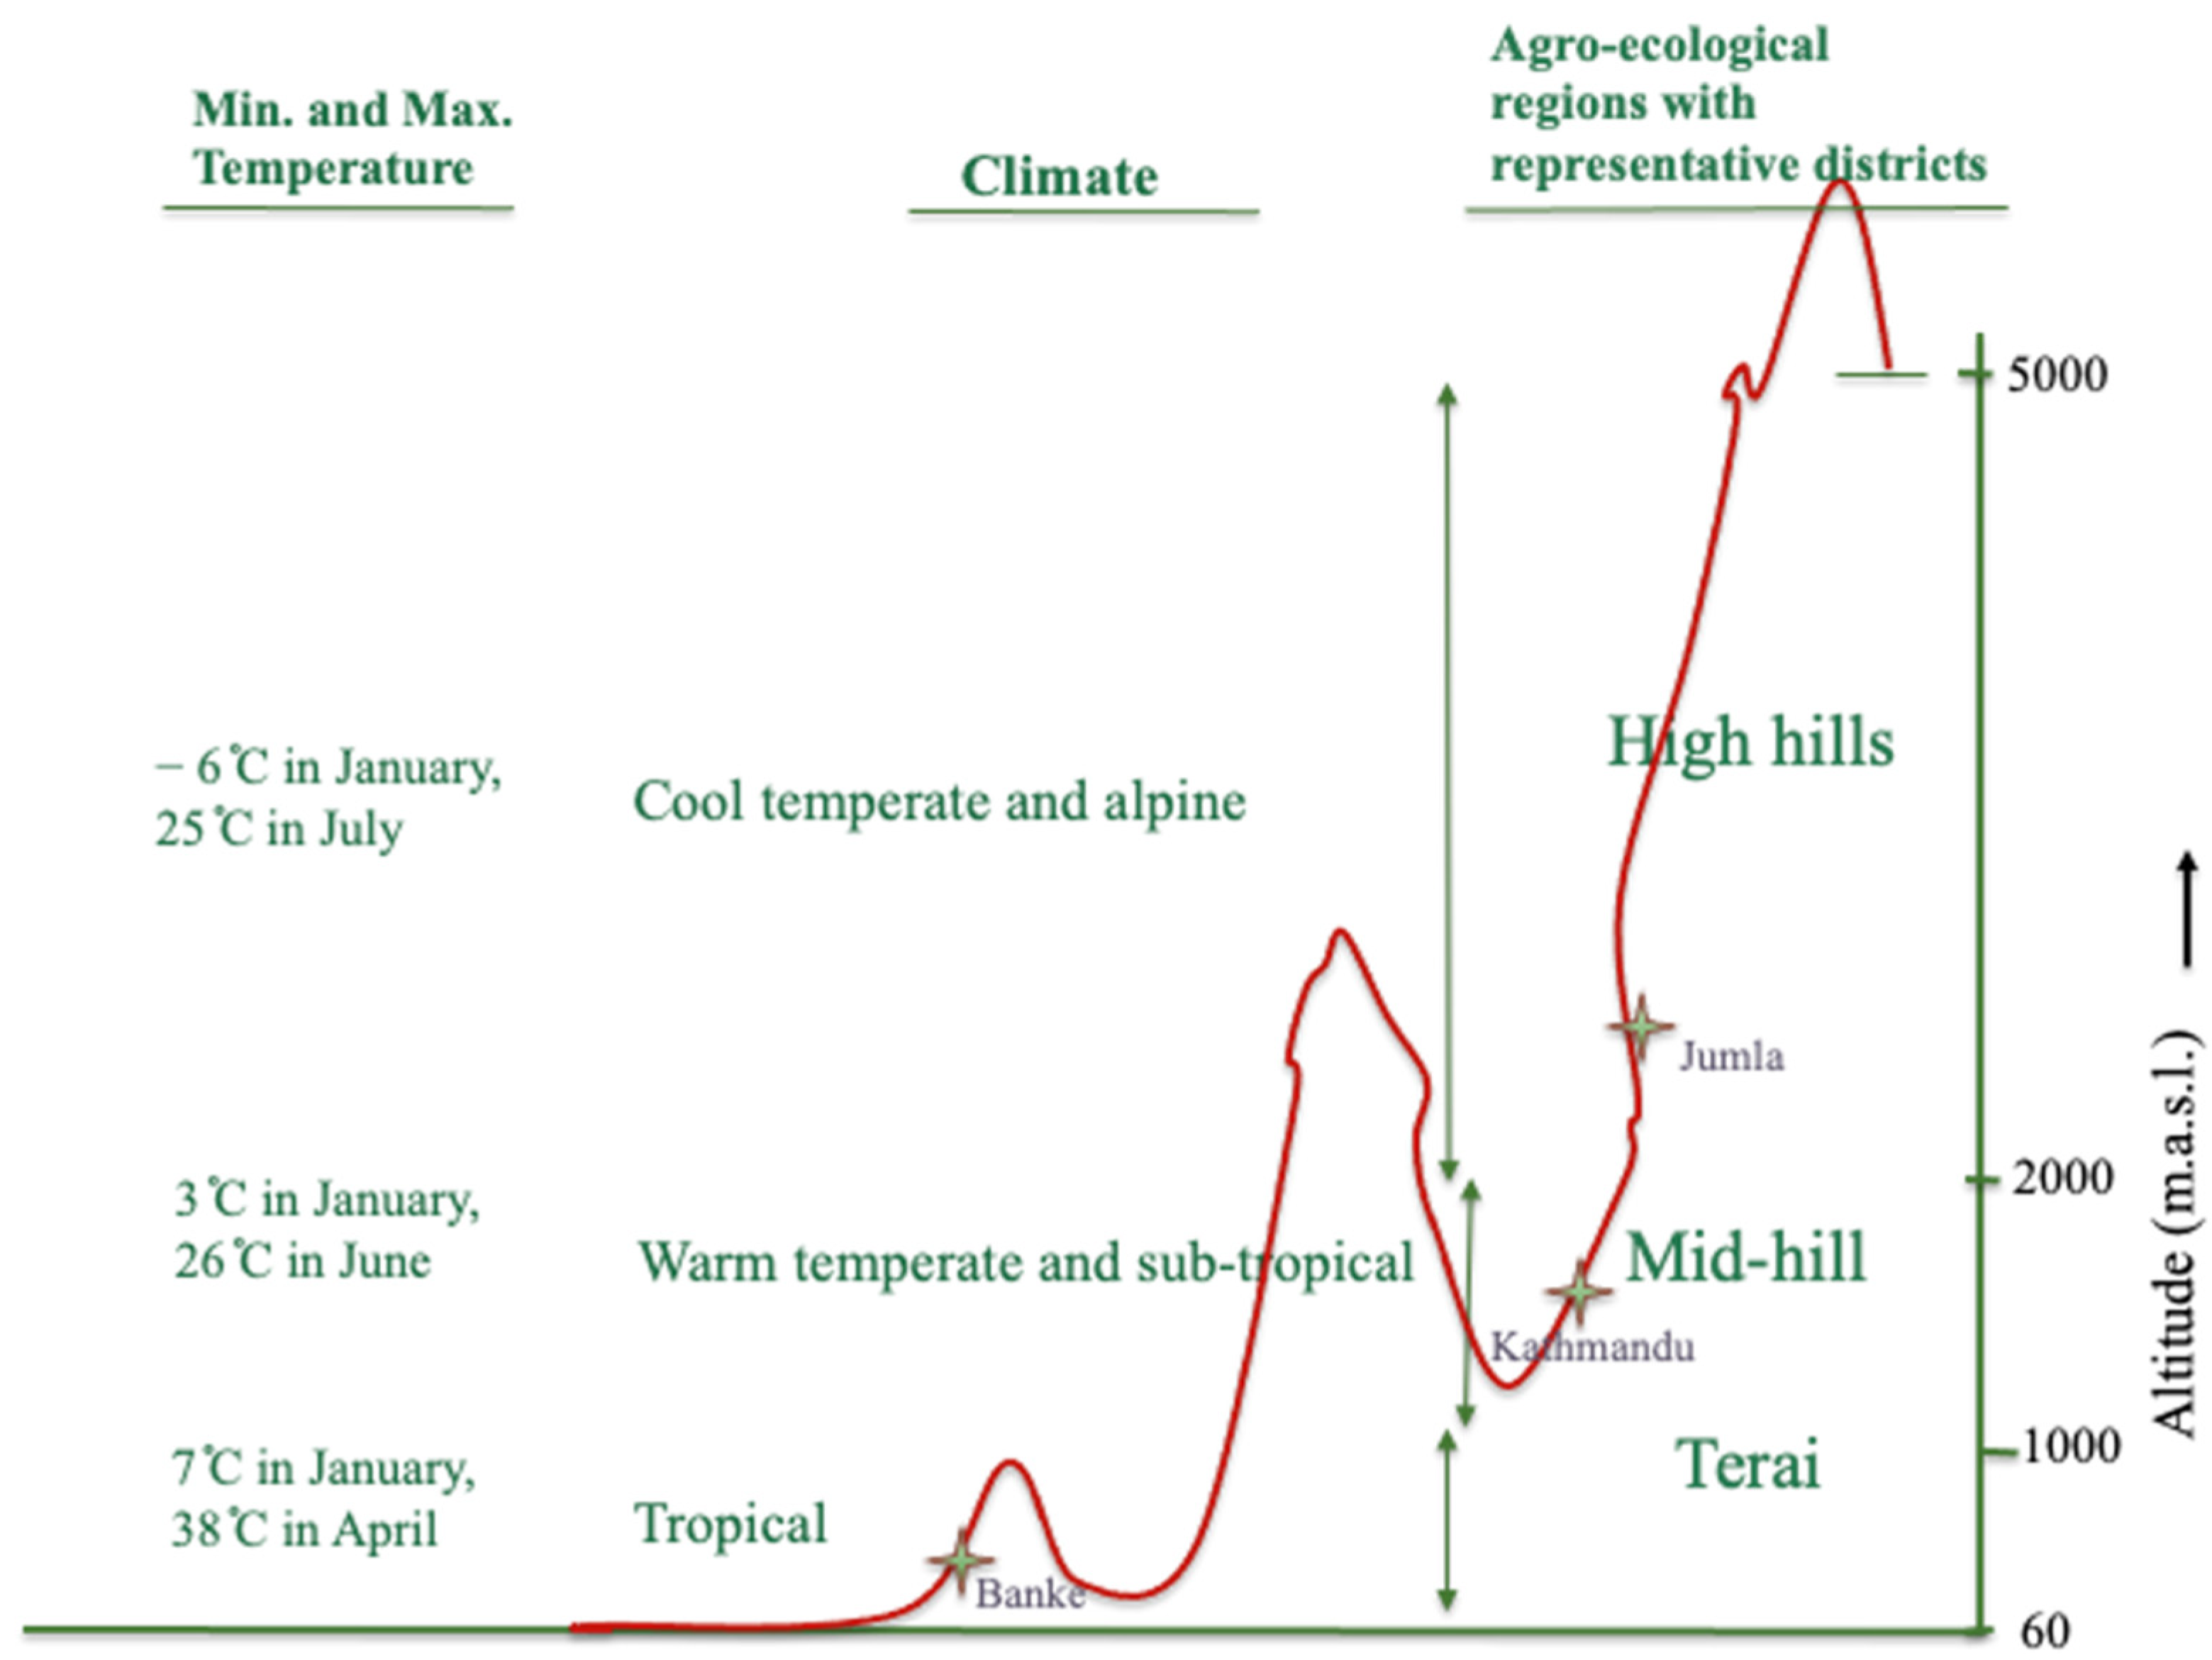
In a previous study [4], a photothermal model was used to predict DTF on the 324 lentil genotypes used in this study based on multiple field experiments in the major lentil growing regions. This knowledge can be leveraged to predict DTF based on the average temperature and photoperiod of a given environment and identify genotypes that likely have the appropriate phenology for that location. Since the Grain Legume Research Program of Nepal is located at Khajura, Banke, and the Nepal Agricultural Research Council has research stations located in Kathmandu and Jumla, where they have been conducting lentil research trials, these three locations were chosen as representative sites of the three major Nepalese agricultural growing regions (Figure 4): the terai, mid-hill, and high hills, respectively. These three agro-ecological regions represent different altitudes with varying climatic conditions characterized mostly by differing temperature profiles.
For all three locations, we used the 10-year (2010–2020) average of the monthly temperature data and monthly average for daylength, acquired from https://www.worldweatheronline.com/ and https://www.timeanddate.com/ (accessed on 10 September 2021), respectively. We then ran the photothermal model following the process described in Wright et al. [4] to identify putative genotypes suitable for testing in these environmentally contrasting growing regions. Due to the tendency for under-prediction of DTF by the model in Nepal [4], the desire for early flowering by breeders, and the dominance of clusters 1, 2, and 5 among South Asian genotypes, we used the maximum DTF from cluster 2 of the South Asian genotypes as a cut-off for our selection criteria when evaluating for potentially adapted genotypes in Banke and Kathmandu. Similarly, we used the maximum DTF of cluster 5 for Jumla since we predict those likely represent the highland adapted genotypes.
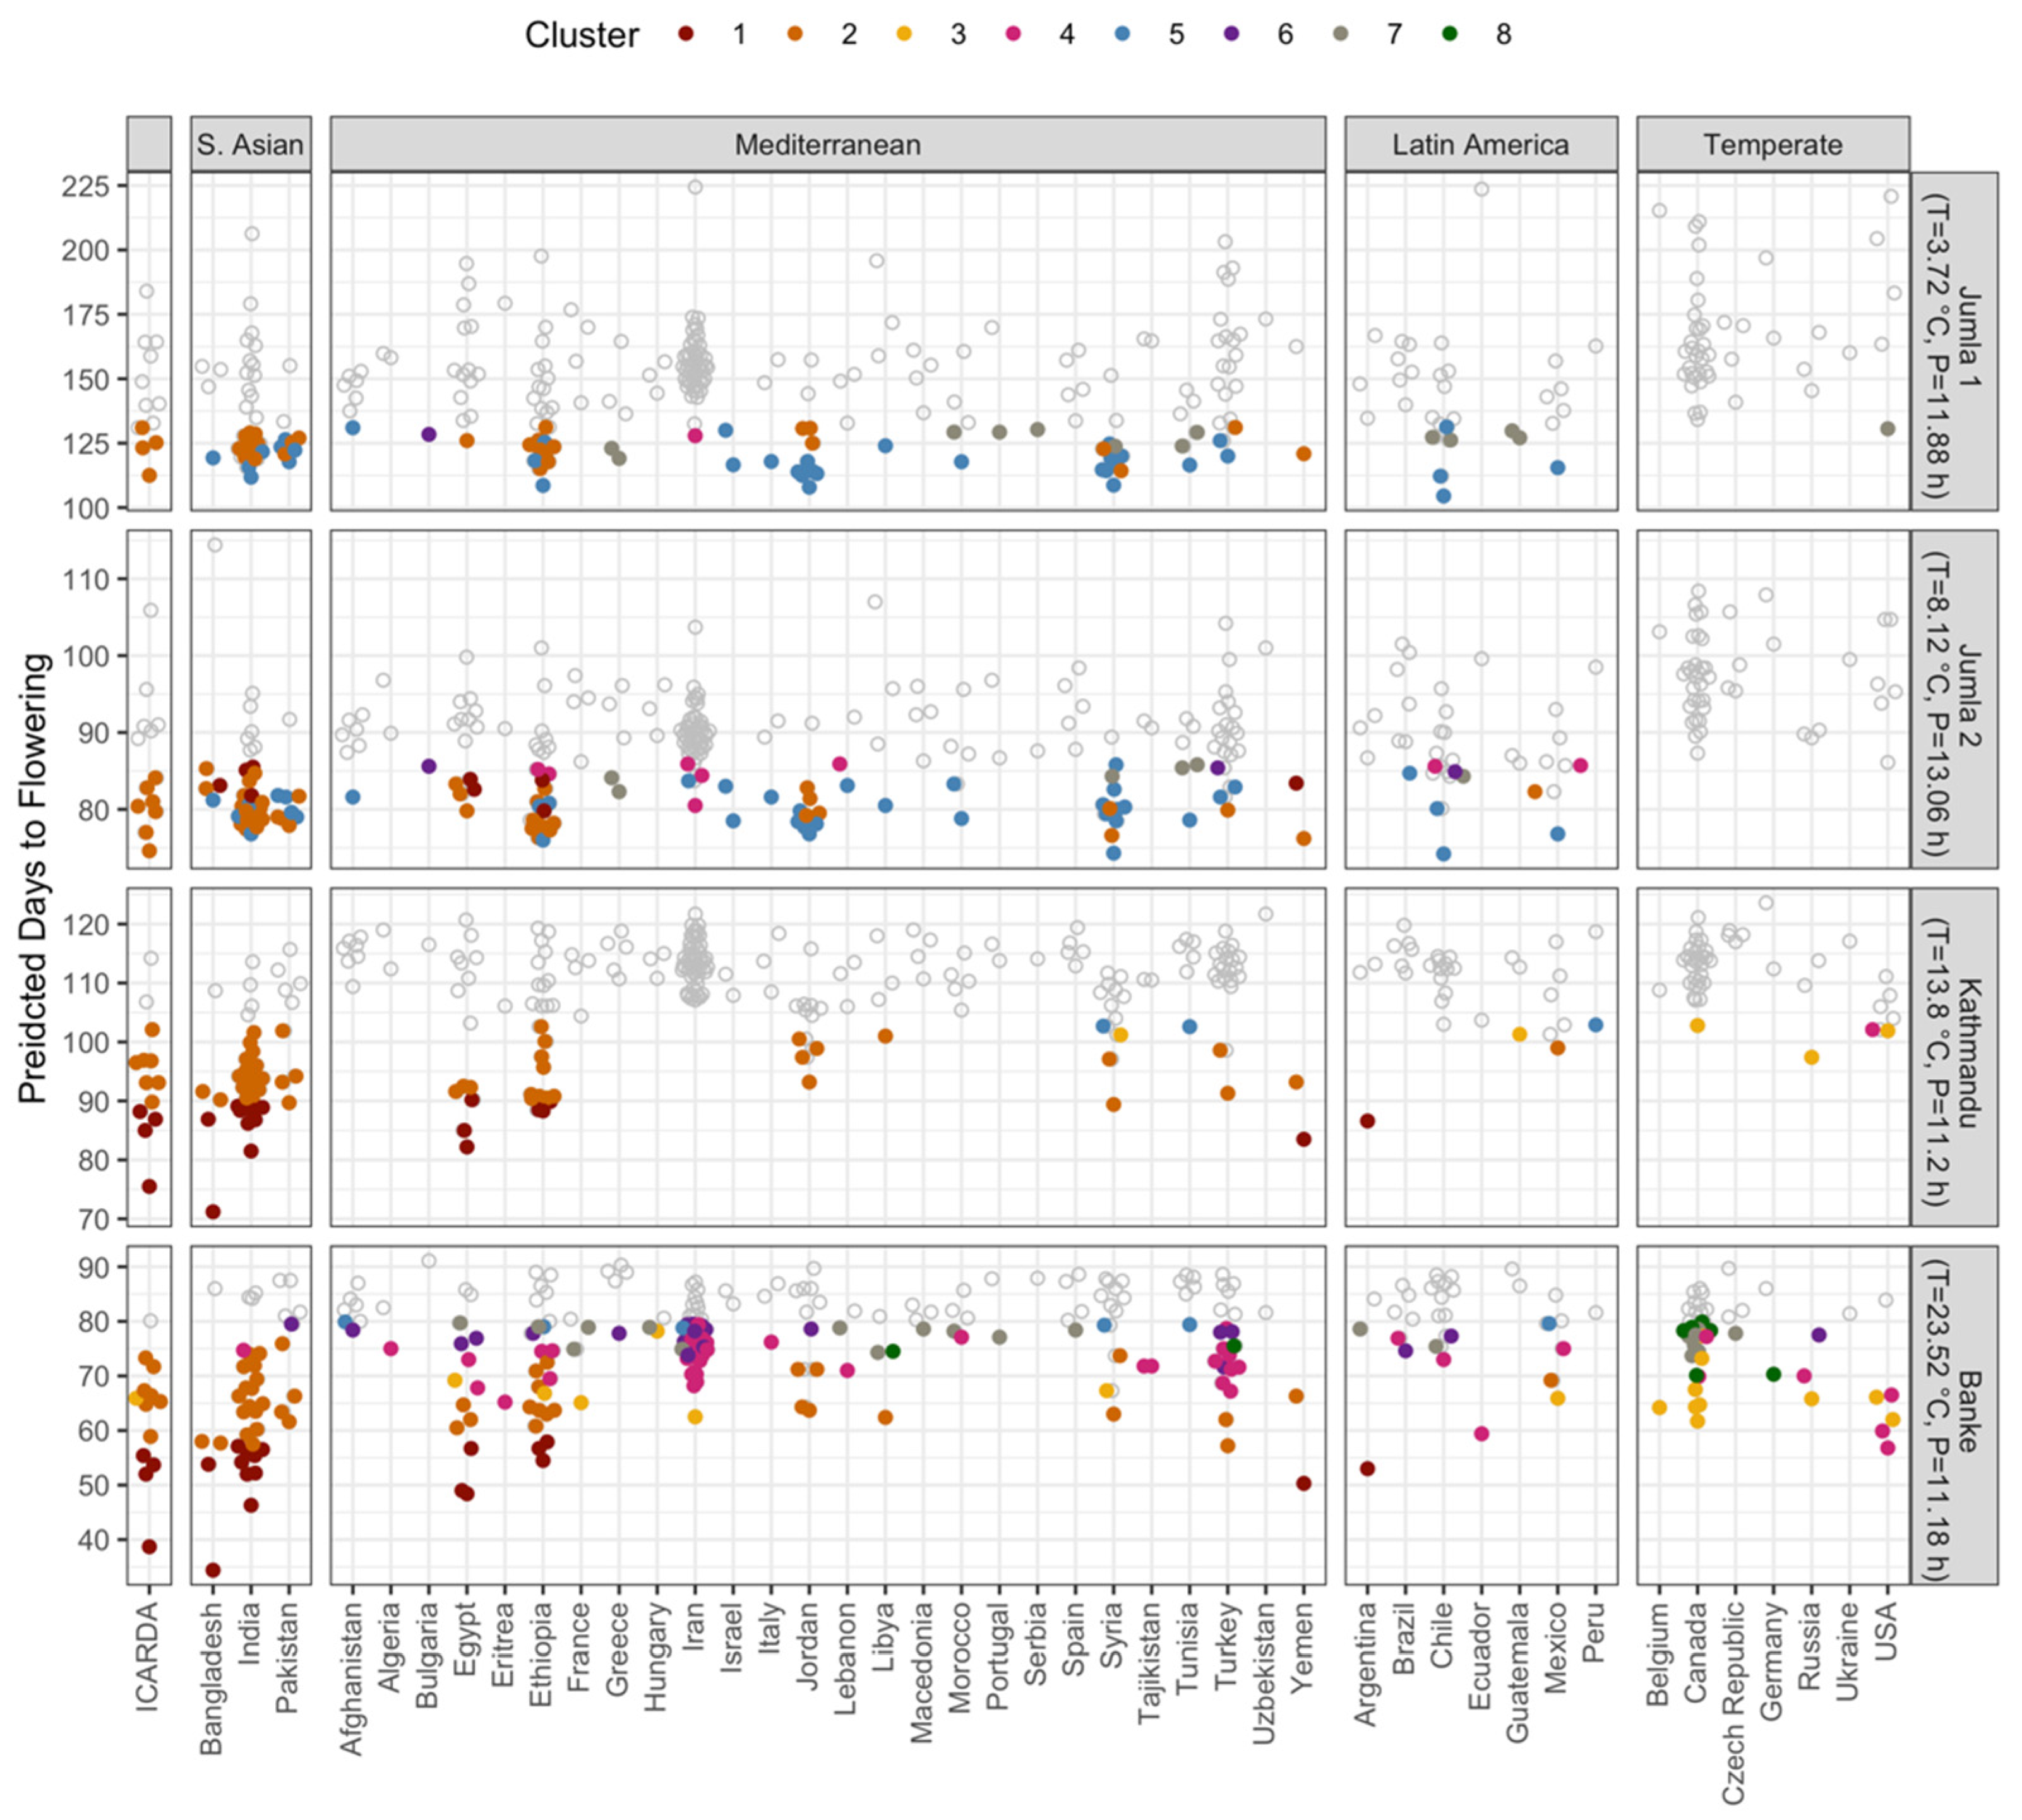
In Banke, lentil is generally seeded in early November and harvested around late March to early April [28]. The average temperature during the lentil-growing season would be around 23.52 °C, and the average day length would be 11.18 h. After fitting this information into the model, we found 204 genotypes (Figure 5), which might be suitable for testing in the terai region. A total of 171 of these are from outside South Asia; 130 are not from clusters 1 or 2, and 69 are large seeded with yellow cotyledons, offering a range of diversity (Supplemental Table S1).
Lentil is generally seeded around late October to early November and harvested around late March to early April in and around the Kathmandu Valley, similar to Banke [29]. The average temperature during this time would be around 13.8 °C, with an average daylength of 11.2 h. Based on the model, we found 82 genotypes that might be suitable for the mid-hills. Fifty-one of these are originating from outside South Asia; 9 are not from clusters 1 or 2, and one is large seeded with yellow cotyledons (Supplemental Table S2).
Unlike Banke and Kathmandu, lentil is a relatively new crop to the Jumla region. A few research studies have been conducted at the NARC station to explore potential genotypes for the high hills that are cold tolerant [30]. Based on their study, they seeded lentils in the field in November and harvested them in June. However, farmers in that region more typically seed lentils right after the snow melts in their fields. They seeded mostly black colored, small seed-sized lentil in late February to early March and harvested in late May to mid-June [31]. Thus, in this study, we identified two sets of genotypes—one for each seeding time. For the first growing season (Jumla 1), the average temperature during this time would be 3.72 °C, with an average daylength of 11.88 h. Based on the model, we found 86 genotypes suitable for this high hills. Sixty-four of these originated from outside South Asia; 44 are not from clusters 1 or 2, and 23 are large-seeded with yellow cotyledons, mostly from cluster 5, a group with reduced sensitivity to low temperatures (Supplemental Table S3). The average temperature during this period is lower than the generally agreed base temperature of 5 °C for lentil growth and development. Moreover, the daily average temperature in some days is negative, causing unrealistic prediction (N = 2) of days to flower (Supplemental Table S3). It is expected that the lentil genotypes in this list will only exhibit normal growth after the temperature passes above this base temperature, which would likely be after the snow melts. For second growing season (Jumla 2), the average temperature would be 8.12 °C, with an average daylength of 13.06 h. Based on the model, we found 83 genotypes which might be suitable for this growing environment, and all those genotypes originated from outside South Asia; 50 of these are not from clusters 1 or 2, and 27 are large-seeded with yellow cotyledons mostly from cluster 5, a group with reduced sensitivity to low temperatures (Supplemental Table S4).
These genotypes should be tested on-farm and could be used to establish rapid expansion of the lentil production in high-hill regions. In regions like Jumla, where lentil would be grown through the summer, it had been expected that genotypes from temperate regions (e.g., Canada) might perform better than the genotypes from winter growing regions (e.g., India); however, this was not what the results from the photothermal model suggest (Figure 5). This emphasizes the strong role of the combination of both temperature and photoperiod in lentil adaptation and demonstrates the potential usefulness of the photothermal model for pre-screening genotypes. In addition, due to the relatively low mean temperatures, which for Jumla 1, was below the accepted base temperature for lentil, the highland areas of Jumla represent a novel environment to test the accuracy and limitations of the photothermal model from study by Wright et al. [4] and/or to improve it.
Among the adapted genotypes from different clusters, genotypes from clusters 1 and 2 were deemed more promising than those from other groups for both highland and lowland locations. Cluster 5 offers additional genotypes that may be suitable in the highland location, supporting the idea that the highlands were an intermediate production region for lentil, as they were disseminated into South Asia and were selected for early flowering [18]. In all three locations, we identified a set of adapted genotypes within which are genotypes with larger seed sizes and different cotyledon colors than the currently available Nepalese cultivars. This would help to establish additional market classes for export or local consumption.
While this analysis focused on DTF and thus does not directly address the yield gap present between Nepal and some of the other major production regions for lentils, the introduction of exotic genetic diversity identified herein should increase the yield gain achieved through breeding in Nepal. We recommend separate trials with these genotypes in larger-sized plots to assess the grain yield. Additionally, we advise caution to avoid frost damage in high-frost prevailing areas, especially in the high and mid-hills. Furthermore, predictions were based on the information from a wide range of environments, but none of the genotypes have been tested in very low temperature areas, and we are unsure how they will perform under marginal temperatures. Thus, it would be important to conduct field experiments with these genotypes in such areas to validate the results.

4. Conclusions

Significant variation for all phenology-related traits was present among the 324 lentil genotypes grown in Bardiya, Nepal. Considering days to flower as the primary factor governing adaptation, the genotypes in this diversity panel were categorized in eight groups, and a photothermal model was demonstrated to predict DTF based on average temperature and photoperiod [4]. Leveraging that knowledge, we were able to predict genotypes suitable for different lentil-production regions within Nepal that could be used to expand the genetic diversity. When considering Banke, Kathmandu, and Jumla as representatives of terai, mid-hill, and high-hill growing regions, we found many potentially adapted genotypes for each region. Several of these are either large seeded or with yellow cotyledons and could contribute to entirely new market classes of lentils in Nepal and help increase production and export options. However, we advise caution in high-frost prevailing areas especially in the high and mid-hills so as not to have flowering coincide with such environmental events.

Supplementary Materials

The following are available online at https://www.mdpi.com/article/10.3390/agronomy11101933/s1, Table S1: List of potential genotypes for Banke, Nepal, representative of terai growing region, obtained after providing in-season average temperature and photoperiod, expected days to flowering, and using the coefficients derived phenological study in lentil by Wright et al. [4] into the photothermal model 1/f = a + bT + cP; Table S2: List of potential genotypes for Kathmandu, Nepal, representative of mid-hill growing region, obtained after providing in-season average temperature and photoperiod, expected days to flowering, and using the coefficients derived phenological study in lentil by Wright et al. [4] into the photothermal model 1/f = a + bT + cP; Table S3: List of potential genotypes for Jumla 1, Nepal, representative of high-hill growing region, obtained after providing in-season average temperature and photoperiod (in first scenario), expected days to flowering, and using the coefficients derived phenological study in lentil by Wright et al. [4] into the photothermal model 1/f = a + bT + cP; Table S4: List of potential genotypes for Jumla 2, Nepal, representative of high-hill growing region, obtained after providing in-season average temperature and photoperiod (in second scenario), expected days to flowering, and using the coefficients derived phenological study in lentil by Wright et al. [4] into the photothermal model 1/f = a + bT + cP.

Author Contributions

Conceptualization, S.N., D.M.W. and K.E.B.; data curation, S.N.; formal analysis, S.N.; funding acquisition, K.E.B.; investigation, S.N., R.D., D.K.S. and B.D.; methodology, S.N., R.D., D.M.W. and K.E.B.; project administration, R.D., D.K.S., B.D. and K.E.B.; resources, K.E.B.; supervision, S.N. and K.E.B.; visualization, S.N. and D.M.W.; writing—original draft, S.N., D.M.W. and K.E.B.; writing—review and editing, S.N., R.D., D.M.W., D.K.S., B.D. and K.E.B. All authors have read and agreed to the published version of the manuscript.

Funding

This research was conducted as part of the “Application of Genomics to Innovation in the Lentil Economy (AGILE)” project funded by Genome Canada and managed by Genome Prairie. The matching financial support from the Saskatchewan Pulse Growers, Western Grains Research Foundation, the Government of Saskatchewan, and the University of Saskatchewan is gratefully acknowledged.

Institutional Review Board Statement

Not applicable.

Informed Consent Statement

All individuals have consented to the be in acknowledgement section.

Data Availability Statement

Any original data related to this publication are available at https://knowpulse.usask.ca/study/2695319 (accessed on 10 September 2021).

Acknowledgments

We are grateful to all funding agencies and collaborative partners of project AGILE. Our special thanks to Crystal Chan for managing the project and supporting us in every step throughout the field experiments and beyond. We acknowledge the support from Local Initiatives for Biodiversity, Research, and Development (LI-BIRD) for conducting the field experiments. Thanks to Drona Kumar Shrestha, Phool Kumari Rai, Samjhana Magar, and Baikuntha Adhikari for their support in managing day-to-day work at the field; Niranjan Pudasaini for collecting information on farmers perception from Jumla; and Bharat Bhandari for coordinating project activities at the national level. We are thankful to Rajendra Darai and Laxman Aryal from the Grain Legumes Research Program (GLRP) under the Nepal Agricultural Research Council (NARC) for technical support during the field experiments.

Conflicts of Interest

The authors declare no conflict of interest.

References

  1. FAO. Available online: http://www.fao.org/faostat/en/?#data/QC (accessed on 27 February 2020).
  2. Tullu, A.; Diederichsen, A.; Suvorova, G.; Vandenberg, A. Genetic and genomic resources of lentil: Status, use and prospects. Plant Genet. Resour. 2011, 9, 19–29. [Google Scholar] [CrossRef]
  3. Khazaei, H.; Caron, C.T.; Fedoruk, M.; Diapari, M.; Vandenberg, A.; Coyne, C.J.; McGee, R.; Bett, K.E. Genetic diversity of cultivated lentil (Lens culinaris Medik.) and its relation to the world’s agro-ecological zones. Front. Plant Sci. 2016, 7, 1093. [Google Scholar] [CrossRef] [PubMed] [Green Version]
  4. Wright, D.M.; Neupane, S.; Heidecker, T.; Haile, T.A.; Chan, C.; Coyne, C.J.; McGee, R.J.; Udupa, S.; Henkrar, F.; Barilli, E.; et al. Understanding photothermal interactions will help expand production range and increase genetic diversity of lentil (Lens culinaris Medik.). Plants People Planet 2020, 3, 171–181. [Google Scholar] [CrossRef]
  5. FAO. The Second Report on the State of the World’s Plant Genetic Resources for Food and Agriculture. Exp. Agric. 2020, 47, 574. [Google Scholar]
  6. Summerfield, R.J.; Roberts, E.H.; Erskine, W.; Ellis, R.H. Effects of Temperature and Photoperiod on Flowering in Lentils (Lens culinaris Medic.). Ann. Bot. 1985, 56, 659–671. [Google Scholar] [CrossRef]
  7. MOALD Statistical Information on Nepalese Agriculture 2075/76 [2018/19]. Available online: https://www.moald.gov.np/publication/AgricultureStatistics (accessed on 16 June 2021).
  8. USAID Value Chain/Market Analysis of the Lentil Sub-Sector in Nepal. 2011. Available online: https://ansab.org.np/storage/product/nepal-neat-subsector-market-analysis-lentil-aug-2011-1579689501.pdf (accessed on 20 April 2020).
  9. Pokhrel, A.; Aryal, L.; Poudel, P. A Review on Research Work of Grain Legumes Research Program, NARC; Nepal Agricultural Research Council, Grain Legume Research Program: Banke, Nepal, 2019.
  10. SQCC Notified and Denotified Varieties till 2076 04 07; Seed Quality Control Centre: Lalitpur, Nepal, 2020.
  11. Ghimire, K.H.; Joshi, B.K.; Karki, A.; Gauchan, D. Existing Collections and Important Germplasm in Genebank from Earthquake Affected Districts. In Rebuilding Local Seed System of Native Crops in Earthquake Affected Areas of Nepal. Proceedings of a National Sharingshop 18 December 2017, Kathmandu; Joshi, B.K., Gauchan, D., Eds.; NAGRC, Bioversity International, Crop Trust: Kathmandu, Nepal, 2017. [Google Scholar]
  12. Joshi, B.K.; Gauchan, D.; Sapkota, S.; Dongol, D.M.; Paudyal, K.; Gautam, S.; Khatiwada, S.; Ghimire, K.H. Red Listing of Crop Landraces in Earthquake Affected Areas. In Rebuilding Local Seed System of Native Crops in Earthquake Affected Areas of Nepal. Proceedings of a National Sharingshop 18 December 2017, Kathmandu; Joshi, B.K., Gauchan, D., Eds.; NAGRC, Bioversity International, Crop Trust: Kathmandu, Nepal, 2017. [Google Scholar]
  13. Shrestha, R.; Adhikari, B.; Darai, D.; Gharti, D.; Agrawal, S.; Sarker, A.; Vandengerg, A. Grain Yield and Seed Mineral Contents of Lentil as Influenced by Environments in Nepal. In Proceedings of 30th National Winter Crops Workshop 15–16 February 2017; Bhandari, D., Gautam, A., Shrestha, R., Upreti, H., Ghimire, Y., Mishra, K., Joshi, B., Ansari, A., Tripati, B., Paneru, P., Eds.; Nepal Agricultural Research Council: Kathmandu, Nepal, 2019. [Google Scholar]
  14. Ghimire, K.H.; Joshi, B.K.; Gurung, R.; Pudasaini, N.; Gauchan, D.; Sthapit, S.; Javris, D. Good Practices for Agrobiodiversity Management A. Introduction 6. Germplasm Rescue and Repatriation. In Good Practices for Agrobiodiversity Management; Joshi, B.K., Javris, D., Eds.; NAGRC, LI-BIRD and Alliance of Bioversity International and CIAT: Kathmandu, Nepal, 2020; pp. 40–47. ISBN 978-92-9255-149-0. [Google Scholar]
  15. Yadav, N.K.; Ghimire, S.K.; Shrestha, S.M.; Sah, B.P.; Sarker, A.; Sah, S.K. Source of resistant against Fusarium wilt and Stemphylium blight in lentil (Lens culinaris Medikus). Int. J. Appl. Sci. Biotechnol. 2017, 5, 102–107. [Google Scholar] [CrossRef]
  16. Thapa Magar, D.B.; Darai, R.; Gauchan, D.; Sarker, A. Varietal adoption and marketing of lentilin the mid and far western terairegion of Nepal. Adv. Plants Agric. Res. 2014, I, 164–170. [Google Scholar] [CrossRef] [Green Version]
  17. Ferguson, M.E.; Ford-Lloyd, B.V.; Robertson, L.D.; Maxted, N.; Newbury, H.J. Mapping the geographical distribution of genetic variation in the genus Lens for the enhanced conservation of plant genetic diversity. Mol. Ecol. 1998, 7, 1743–1755. [Google Scholar] [CrossRef]
  18. Erskine, W.; Sarker, A.; Ashraf, M. Reconstructing an ancient bottleneck of the movement of the lentil (Lens culinaris ssp. culinaris) into South Asia. Genet. Resour. Crop Evol. 2011, 58, 373–381. [Google Scholar] [CrossRef]
  19. Gharti, D.; Darai, R.; Subedi, S.; Sarker, A.; Kumar, S. Grain Legumes in Nepal: Present Scenario and Future Prospects. World J. Agric. Res. 2014, 2, 216–222. [Google Scholar] [CrossRef] [Green Version]
  20. Corripio, J.G. Package “Insol”; Version 1.2.1. 2019. Available online: https://cran.r-project.org/web/packages/insol/insol.pdf (accessed on 15 April 2020).
  21. R Core Team R. The R Project for Statistical Computing. Available online: https://www.r-project.org/ (accessed on 17 June 2021).
  22. Wickham, H.; Averick, M.; Bryan, J.; Chang, W.; McGowan, L.; François, R.; Grolemund, G.; Hayes, A.; Henry, L.; Hester, J.; et al. Welcome to the Tidyverse. J. Open Source Softw. 2019, 4, 1686. [Google Scholar] [CrossRef]
  23. Clarke, E.; Sherrill-Mix, S. Ggbeeswarm Package Usage Example; Version 0.6.0. 2017. Available online: https://cran.r-project.org/web/packages/ggbeeswarm/vignettes/usageExamples.pdf (accessed on 15 April 2020).
  24. Kassambara, A. Package “ggpubr” Type Package Title “ggplot2” Based Publication Ready Plots; 2017. Available online: https://rpkgs.datanovia.com/ggpubr/index.html (accessed on 15 April 2020).
  25. Kuznetsova, A.; Brockhoff, P.B.; Christensen, R.H.B. lmerTest Package: Tests in Linear Mixed Effects Models. J. Stat. Softw. 2017, 82, 1–26. [Google Scholar] [CrossRef] [Green Version]
  26. Lenth, R.; Buerkner, P.; Herve, M.; Love, J.; Riebl, H.; Singmann, H. Package “Emmeans” Aka Least-Squares Means Version 1.5.2-1. 2020. Available online: https://cran.r-project.org/web/packages/emmeans/emmeans.pdf (accessed on 15 April 2020).
  27. Sarker, A.; Erskine, W. Recent progress in the ancient lentil. J. Agric. Sci. 2006, 144, 19–29. [Google Scholar] [CrossRef]
  28. Yadav, S.S.; Rizvi, A.H.; Manohar, M.; Verma, A.K.; Shrestha, R.; Chen, C.; Bejiga, G.; Chen, W.; Yadav, M.; Bahl, P.N. Lentil growers and production systems around the world. In Lentil: An Ancient Crop for Modern Times; Yadav, S.S., Ed.; Springer: Berlin/Heidelberg, Germany, 2007; pp. 415–442. [Google Scholar]
  29. Neupane, R.; Shrestha, R. Report on Lentil Varietal and Agronomical Research; Nepal Agricultural Research Council: Lalitpur, Nepal, 1991.
  30. Ghimire, N.H.; Mandal, H.N. Genetic variability, Genetic Advance, Correlation and Heritability of Cold Tolerance Lentil (Lens culinaris Medic.) Genotypes at High Hill of Nepal. Int. J. Adv. Res. Biol. Sci 2019, 6, 105–119. [Google Scholar] [CrossRef]
  31. Pudasaini, N. Personal communication. 29 April 2021. [Google Scholar]
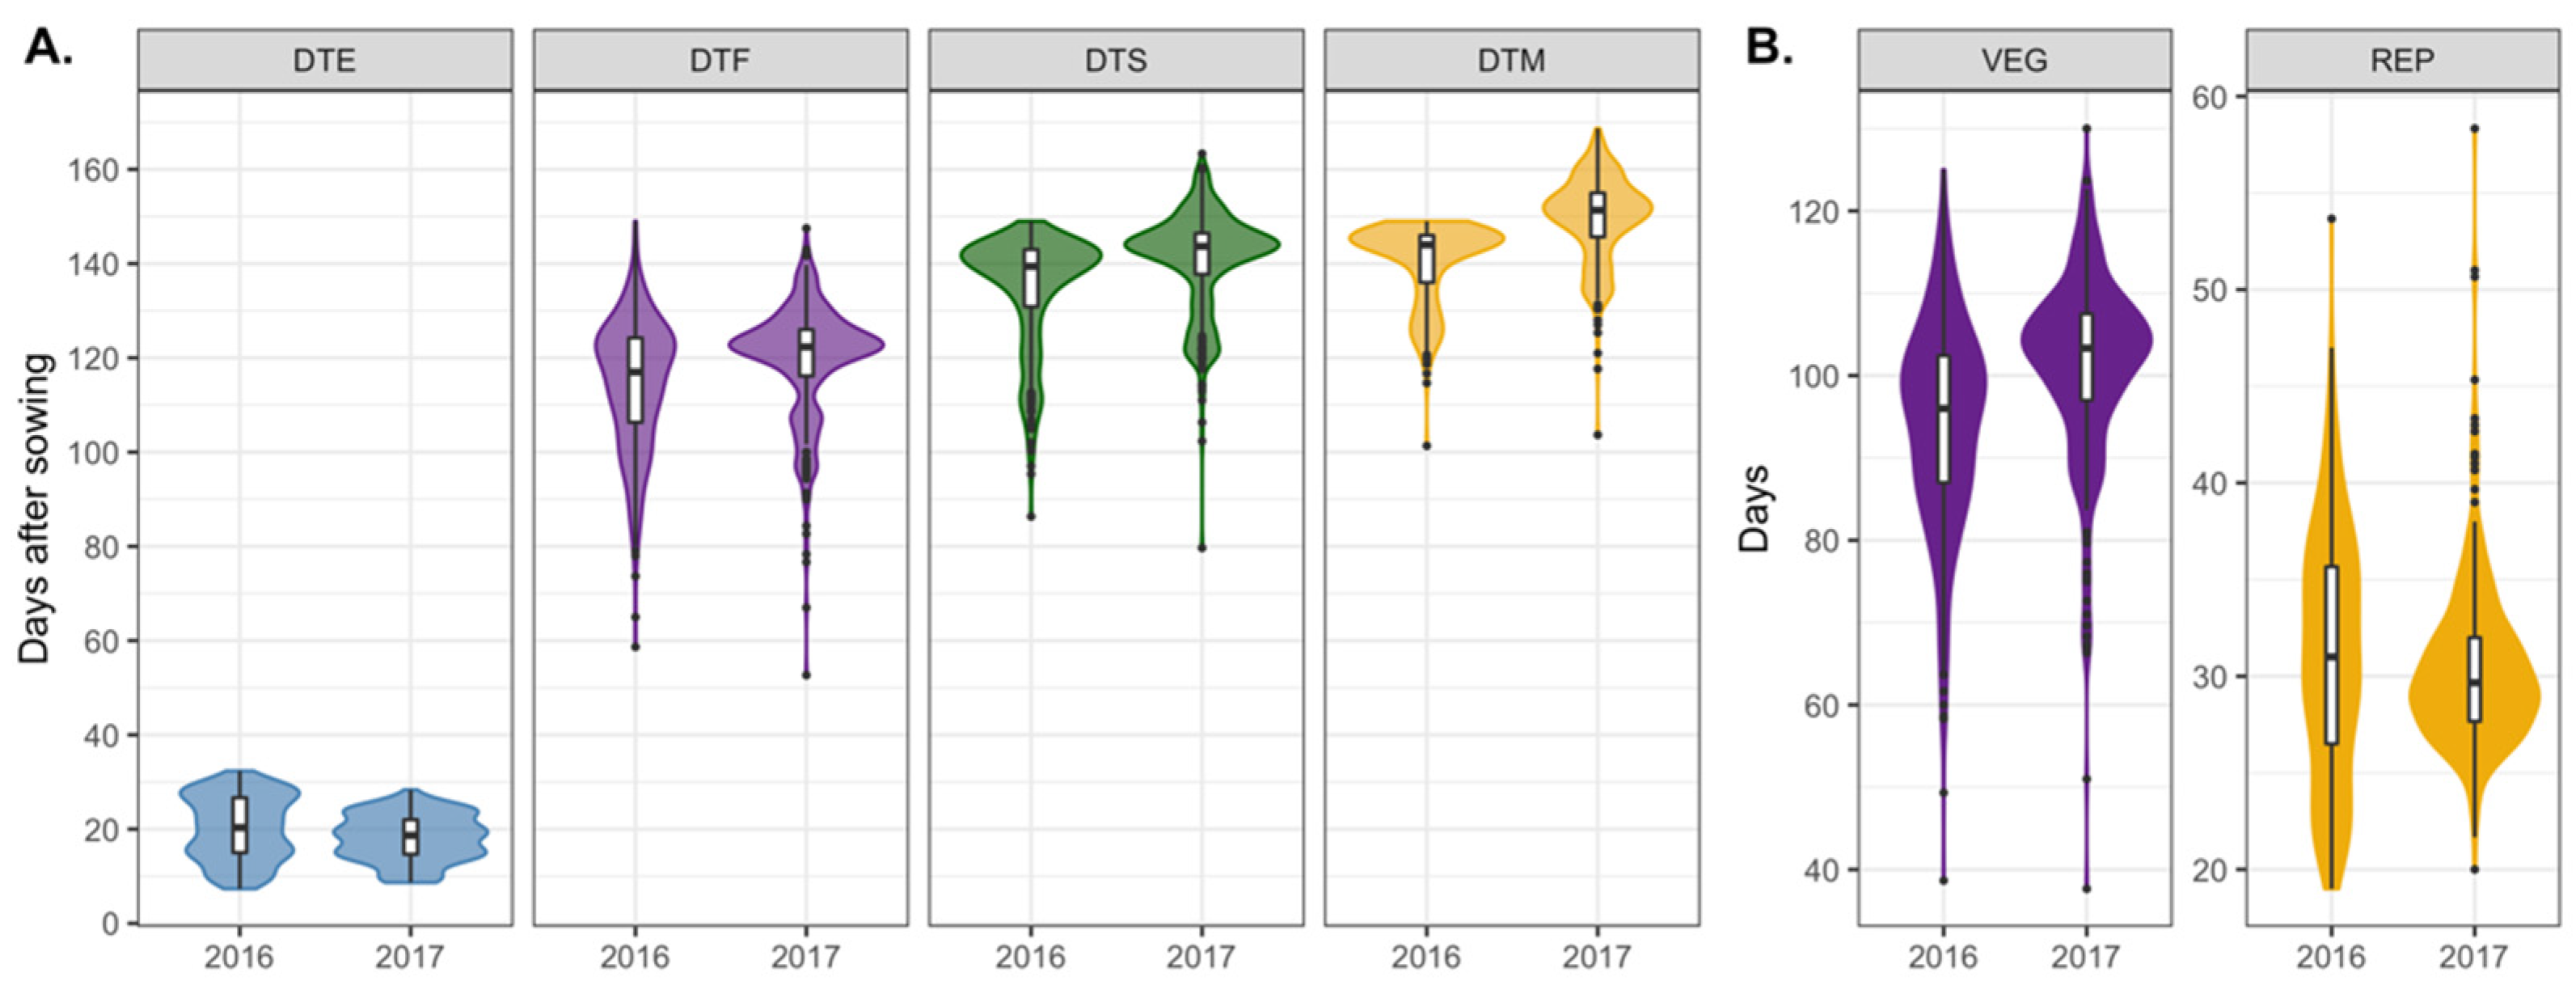
Figure 1. Variation in (A) Days to: emergence (DTE), flowering (DTF), swollen pod (DTS), maturity (DTM) from seeding, and (B) vegetative period (VEG) and reproductive period (REP) of 324 genotypes grown in the winter of 2016 and 2017 at Bardiya, Nepal. The width of a plot indicates the density distribution, and the whiskers on the box plots represent 1.5 times the quartile of the data. Individuals falling outside the range of the whiskers are represented as black dots.
Agronomy 11 01933 g001
Figure 2. Variation in temperature (°C), rainfall (mm), and daylength (h) during field experiments in 2016 (top) and 2017 (bottom). The X-axis represents the months of the field experiments, and Y-axis represents temperature, rainfall (precipitation), and daylength. The red line in both plots is the average temperature, and the grey shadow around it is maximum and minimum temperature. The yellow line is daylength, and blue bars are the amount of rainfall on a particular day.
Agronomy 11 01933 g002
Figure 3. Days to flowering (DTF) of 324 genotypes grown in the winter of 2016 and 2017 at Bardiya, Nepal, based on their country and geographical region of origin. Different colored dots represent genotypes from eight different clusters derived from principal component analysis and hierarchical clustering from Wright et al. [4]. Genotypes from the ICARDA breeding program were kept separate, as they are a mix of germplasm from a large breeding program.
Agronomy 11 01933 g003
Figure 4. Agro-ecological regions of Nepal differentiated mainly by the altitude and characterized by varying climatic situations, mostly temperature.
Agronomy 11 01933 g004
Figure 5. Predicted days to flowering (DTF) of 324 genotypes if grown at Banke, Kathmandu, and Jumla as the representative of the major agricultural growing regions, e.g., the terai, mid-hill, and high hill of Nepal, derived from a photothermal model from the study by Wright et al. [4] using in-season average temperature (T) and photoperiod (P) of each environment. Jumla 1 would represent an early winter sowing date, whereas Jumla 2 would represent an early spring sowing date. The genotypes that should have appropriate phenology based on the photothermal model are represented by colored points based on their membership in different clusters. For prediction, the maximum DTF from cluster 2 of the South Asian genotypes was considered a cut-off for Banke and Kathmandu and the maximum from cluster 5 as the cut-off for Jumla.
Agronomy 11 01933 g005
Table 1. Analysis of Variance (ANOVA) results of 324 lentil genotypes evaluated for DTE, DTF, DTS, and DTM as well as VEG and REP in the winter of 2016 and 2017 at Bardiya, Nepal.
Source of VariationDTEDTFDTSDTMVEGREP
Genotype******************
Yearns********ns
Genotype × Year (G × E)******************
DTE, days to emergence; DTF, days to flowering; DTS, days to swollen pod; DTM, days to maturity; VEG, vegetative period; REP, reproductive period. ***, significant at p < 0.001; **, significant at p < 0.01; *, significant at p < 0.05; ns, not significant.
Publisher’s Note: MDPI stays neutral with regard to jurisdictional claims in published maps and institutional affiliations.