Article

Design and Evaluation of a Crowdsourcing Precision Agriculture Mobile Application for Lambsquarters, Mission LQ

by
Brianna B. Posadas
1,*,†,‡,
Mamatha Hanumappa
2,‡,
Kim Niewolny
1 and
Juan E. Gilbert
3
1
Department of Agricultural, Leadership and Community Education, Virginia Tech, Blacksburg, VA 24061, USA
2
College of Agriculture, Urban Sustainability and Environmental Sciences, University of the District of Columbia, Washington, DC 20008, USA
3
Department of Computer and Information Science and Engineering, University of Florida, Gainesville, FL 32611, USA
*
Author to whom correspondence should be addressed.
Current address: 292 Litton-Reaves Hall, Virginia Tech, Blacksburg, VA 24061, USA.
These authors contributed equally to this work.
Agronomy 2021, 11(10), 1951; https://doi.org/10.3390/agronomy11101951
Submission received: 19 July 2021 / Revised: 6 September 2021 / Accepted: 16 September 2021 / Published: 28 September 2021

Abstract

:
Precision agriculture is highly dependent on the collection of high quality ground truth data to validate the algorithms used in prescription maps. However, the process of collecting ground truth data is labor-intensive and costly. One solution to increasing the collection of ground truth data is by recruiting citizen scientists through a crowdsourcing platform. In this study, a crowdsourcing platform application was built using a human-centered design process. The primary goals were to gauge users’ perceptions of the platform, evaluate how well the system satisfies their needs, and observe whether the classification rate of lambsquarters by the users would match that of an expert. Previous work demonstrated a need for ground truth data on lambsquarters in the D.C., Maryland, Virginia (DMV) area. Previous social interviews revealed users who would want a citizen science platform to expand their skills and give them access to educational resources. Using a human-centered design protocol, design iterations of a mobile application were created in Kinvey Studio. The application, Mission LQ, taught people how to classify certain characteristics of lambsquarters in the DMV and allowed them to submit ground truth data. The final design of Mission LQ received a median system usability scale (SUS) score of 80.13, which indicates a good design. The classification rate of lambsquarters was 72%, which is comparable to expert classification. This demonstrates that a crowdsourcing mobile application can be used to collect high quality ground truth data for use in precision agriculture.

1. Introduction

Farming today has grown increasingly dependent on precision agriculture to increase yields and minimize environmental impact; more than 50% of farms in the United States use precision agriculture (PA) in their fields [1,2,3,4]. In order to develop the PA prescription maps that farmers depend on, large amounts of data on soil types, weather, and planting needs to be collected [5]. To design highly accurate PA algorithms to create these maps, millions of data points from thousands of farms are needed [6,7,8].
The collection of this data can be divided into two types: remote and ground truth. The remote sensed data include imagery, global positioning system (GPS), etc. [9,10]. The ground truth, or geophysical parameter data, are more labor intensive to collect as someone is needed to physically visit the locations to provide the measurements [11]. Due to a lack of resources to gather this information, right now growers and researchers are sitting on an abundance of remote sensing data without corresponding ground truth data [12].
In order to meet this demand, a crowdsourced platform was designed using a human-centered approach to aid laypeople in completing ground truth data collection. The platform was created to assist urban agricultural researchers in the District of Columbia studying lambsquarters (Chenopodium album L.). Researchers at the University of the District of Columbia (UDC) were interested in the growth conditions of lambsquarters in the D.C., Maryland, Virginia area (DMV). By recruiting citizen scientists, DMV residents can assist researchers in reporting where and in what conditions the plant is growing, providing researchers with vast, rich data.
The rest of the paper is structured as follows. The Background section discusses the context of precision agriculture and how the focus of this study aids in improving the data collection techniques for PA. The Background section also discusses the benefits of using crowdsourcing as the data collection process for ground truth data and why human-centered design was used to design the crowdsourcing platform. The importance of studying lambsquarters in the District of Columbia and how it fits with the university mission is also discussed in the Background section. The Materials and Methods section discusses the research questions and the human-centered design protocol which was used to design the crowdsourcing platform. The methods used to design the mobile application and the desktop version are also described in this section. Recruitment methods and user studying methods for each design iteration of the crowdsourcing platform are also described there. The Results section discusses the demographic, usability, and qualitative results from each design iteration. The classification and mapping results of lambsquarters are also discussed there. The Discussion section discusses how the results answer the research questions. The Conclusion discusses the future work of this research.

2. Background

2.1. Precision Agriculture

Precision agriculture (PA) is a “management strategy that uses electronic information and other technologies to gather, process, and analyze spatial and temporal data for the purpose of guiding targeted actions that improve efficiency, productivity, and sustainability of agricultural operations” [13]. In the United States, farmers have been able to reduce their environmental impacts and save resources by adopting these precision agriculture technologies [3]. The USDA reports that corn farmers could lower their hired labor costs by 60 to 70 percent when they adopt PA technologies and farmers in North Dakota could save $1500 a year [14,15,16,17].
PA follows a cyclical process. The first stage is data collection where data such as disease and pest information, soil characteristics or weather conditions are collected using remote sensing or soil sensors. The information is paired with GIS data to aid in the next steps. The second stage, data analysis, involves developing the classifiers to detect the features of interest, whether that be nutrient content, presence of certain diseases or pests or soil components. The third stage, prescription, is to produce a prescription map from the classified data. This map illustrates how much of an input should be applied throughout the field. The last stage, application, is where the maps are loaded into the application devices, such as fungicide applicators or irrigation devices. The devices are able to vary the amount of input applied according to the prescription. After application, the PA cycle can restart. How often the cycle is used depends on the input. For example, PA is usually applied to irrigation on a weekly or daily basis [18].
This process is illustrated in Figure 1 using the example of fungicide application for the management of Marssonina blotch disease in Fuji apple trees:
  • Data Collection: spectrometer data is taken of Fuji apple tree leaves.
  • Data Analysis: spectra analyzed for wavelengths that indicate the presence of Marssonina blotch disease.
  • Prescription: analysis used to create a prescription map in ArcGIS.
  • Application: prescription map used for the application of pesticide in the apple orchard.
In the data analysis stage, it is important to have both the remote sensed data and ground truth data to verify the classifiers. The ground truth data is the “geophysical parameter data, measured or collected by other means than by the instrument itself, used as correlative or calibration data for that instrument data” [10]. It would not be possible to accurately train the precision agriculture classifier without the actually identity of the disease, pest, or vegetation in question. However, the ground truth data is more difficult to obtain because of the person hours needed to cover the large agricultural fields. Farmers and researchers alone are not sufficient enough resources to inspect all the vegetation needed for PA algorithms [6,19]. One way to address this problem is to recruit citizen scientists through crowdsourcing platforms.

2.2. Crowdsourcing Initiatives in Agriculture

In recent years, citizen science has been able to engage non-professionals in scientific research through crowdsourcing [20]. The most prominent use of crowdsourcing in agriculture is having participants make small contributions individually to allow a central management system to conduct analysis on the collected data [21]. Through crowdsourcing, citizen scientists have become more mindful of environmental issues and help with classification of existing datasets [11,12,22]. Current examples of crowdsourcing projects in agriculture include eBird, a collection of georeferenced bird observations from volunteer bird watchers and iNaturalist, a mobile application that allows participants to log their plant, and animal observations [21,23].
While the proliferation of mobile phones has made it easier to recruit citizen scientists to submit their observations for research, one challenge is still ensuring that the quality of the collected data is high enough to be used for agricultural purposes and precision agriculture algorithms. One study did find that farmers were able to make observations on their farm that matched those of an agronomist at least 77% of the time [21]. Another study found that while the observations of individual farmers had low convergence with experts, when the observations were aggregated, the convergence increased to be of an acceptable range compared to observations by an expert [24]. These studies show that farmer-generated data can be used accurately in crowdsourcing agricultural research projects [21]. With this in mind, other researchers have been able to recruit large number of farmers to carry out experiments on their farms and crowdsource the results: Crop Land Extent allows users in the Global South to help determine agricultural field boundaries and Open Foris Collect Earth allows local experts in Tanzania to map forests [21,25,26].
While there are crowdsourcing initiatives for various aspects of agriculture in the literature, there are not currently any initiatives for the ground truth data collection for PA [5,6,11,12]. Even though the projects mentioned above (eBird, iNaturalist) do concern making classifications on the ground of agricultural and biological features, these observations are not tied to remote sensing data that could then be used in a PA algorithm. Additionally, the studies comparing farmer classification with expert classification are also not using remote sensed data that would feed into PA algorithms. The goal of this study was to be the first step into creating a crowdsourced data set of ground truth data with a high enough quality to be fed into a PA algorithm. In this study, a human-centered design process was used to design a ground truthing device.

2.3. Human-Centered Design
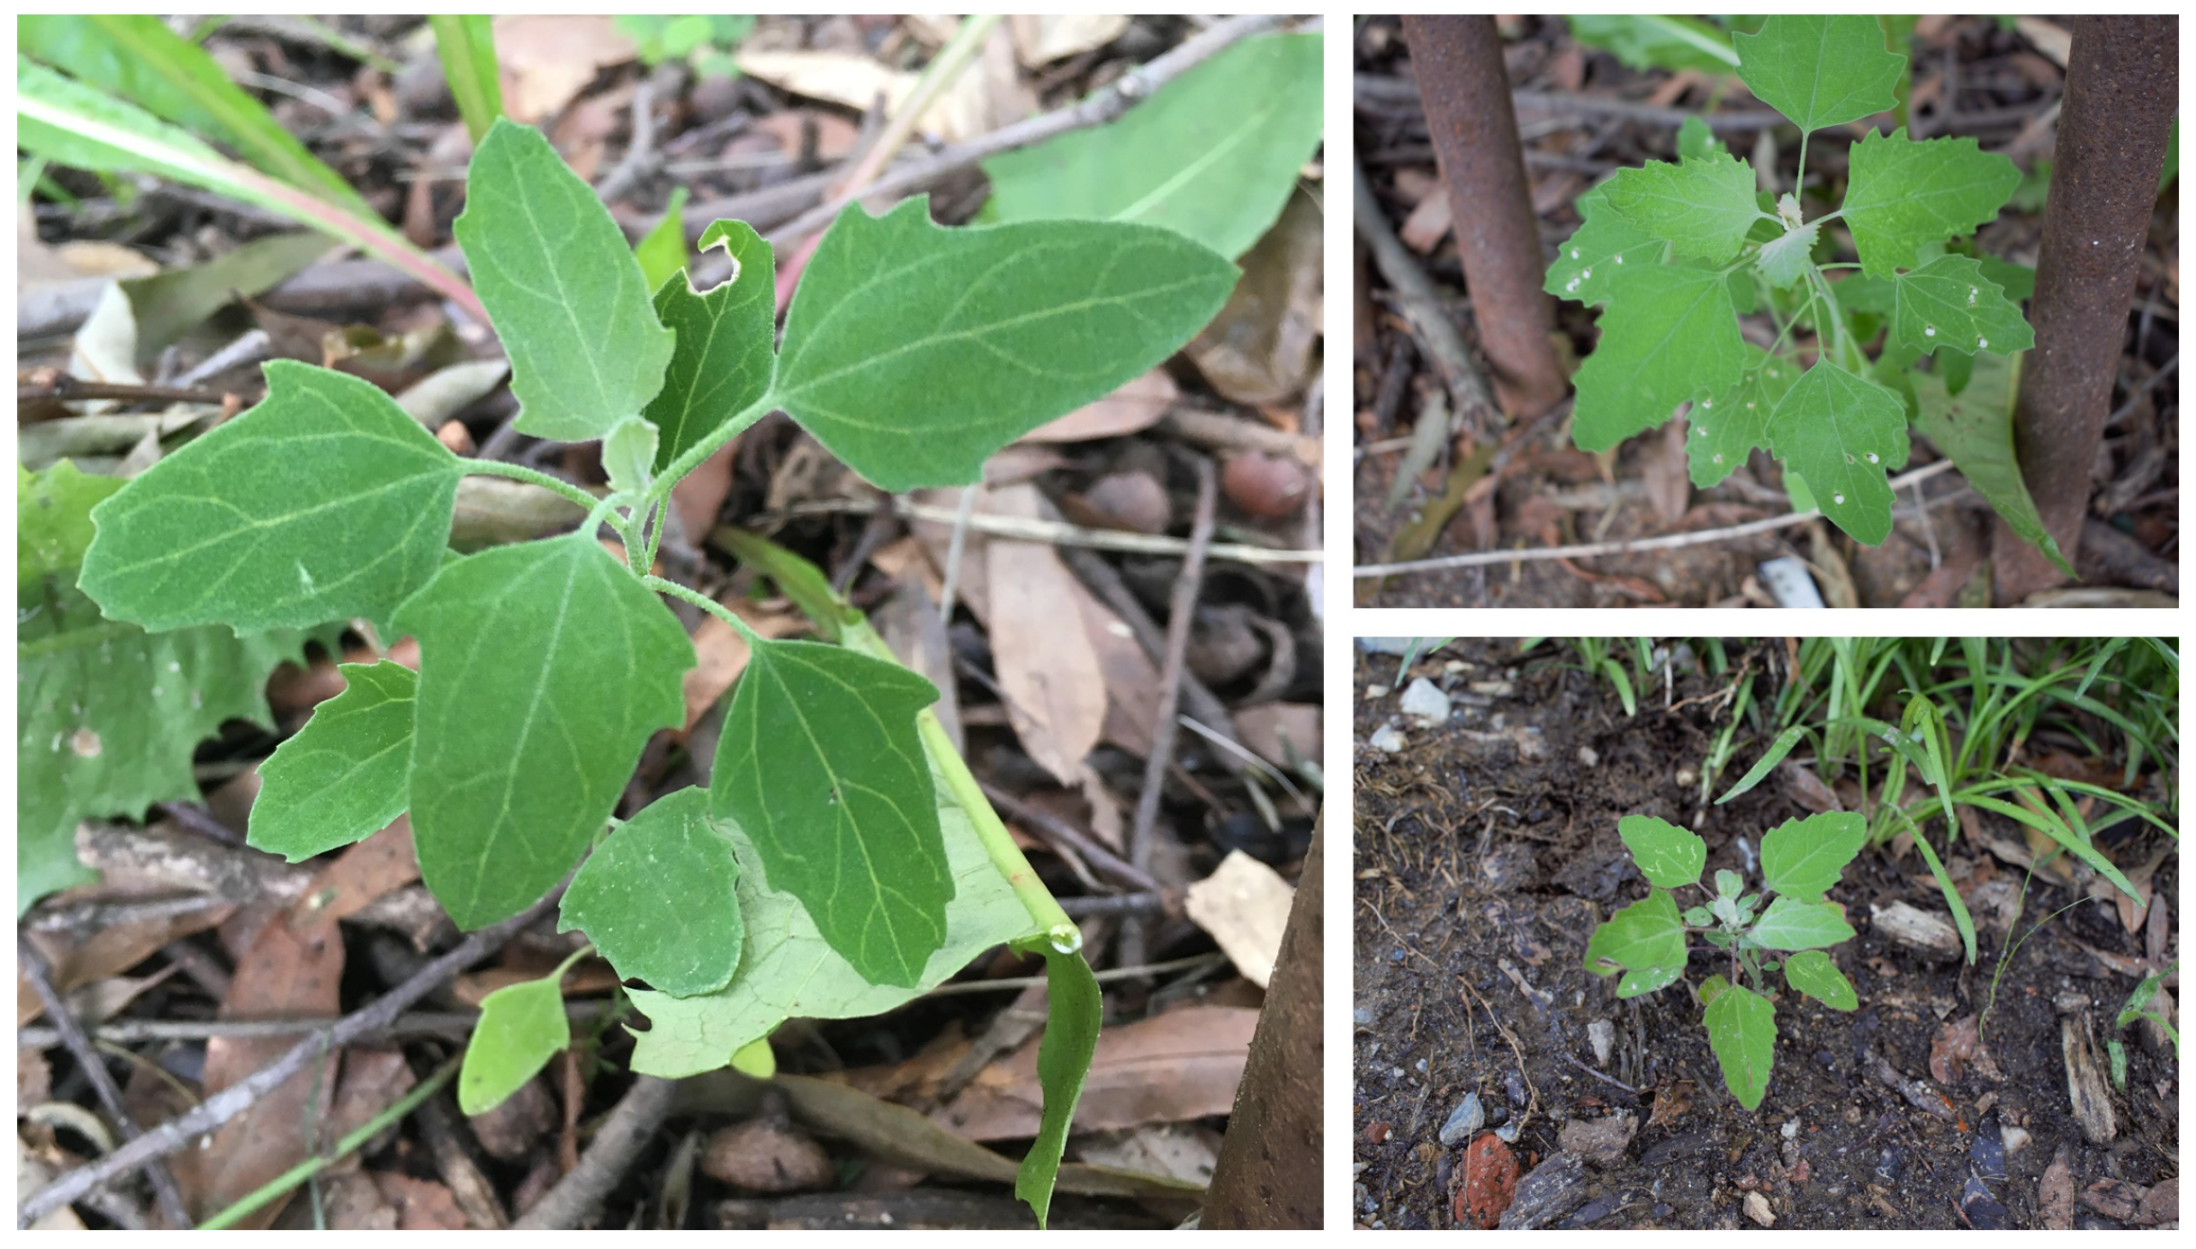
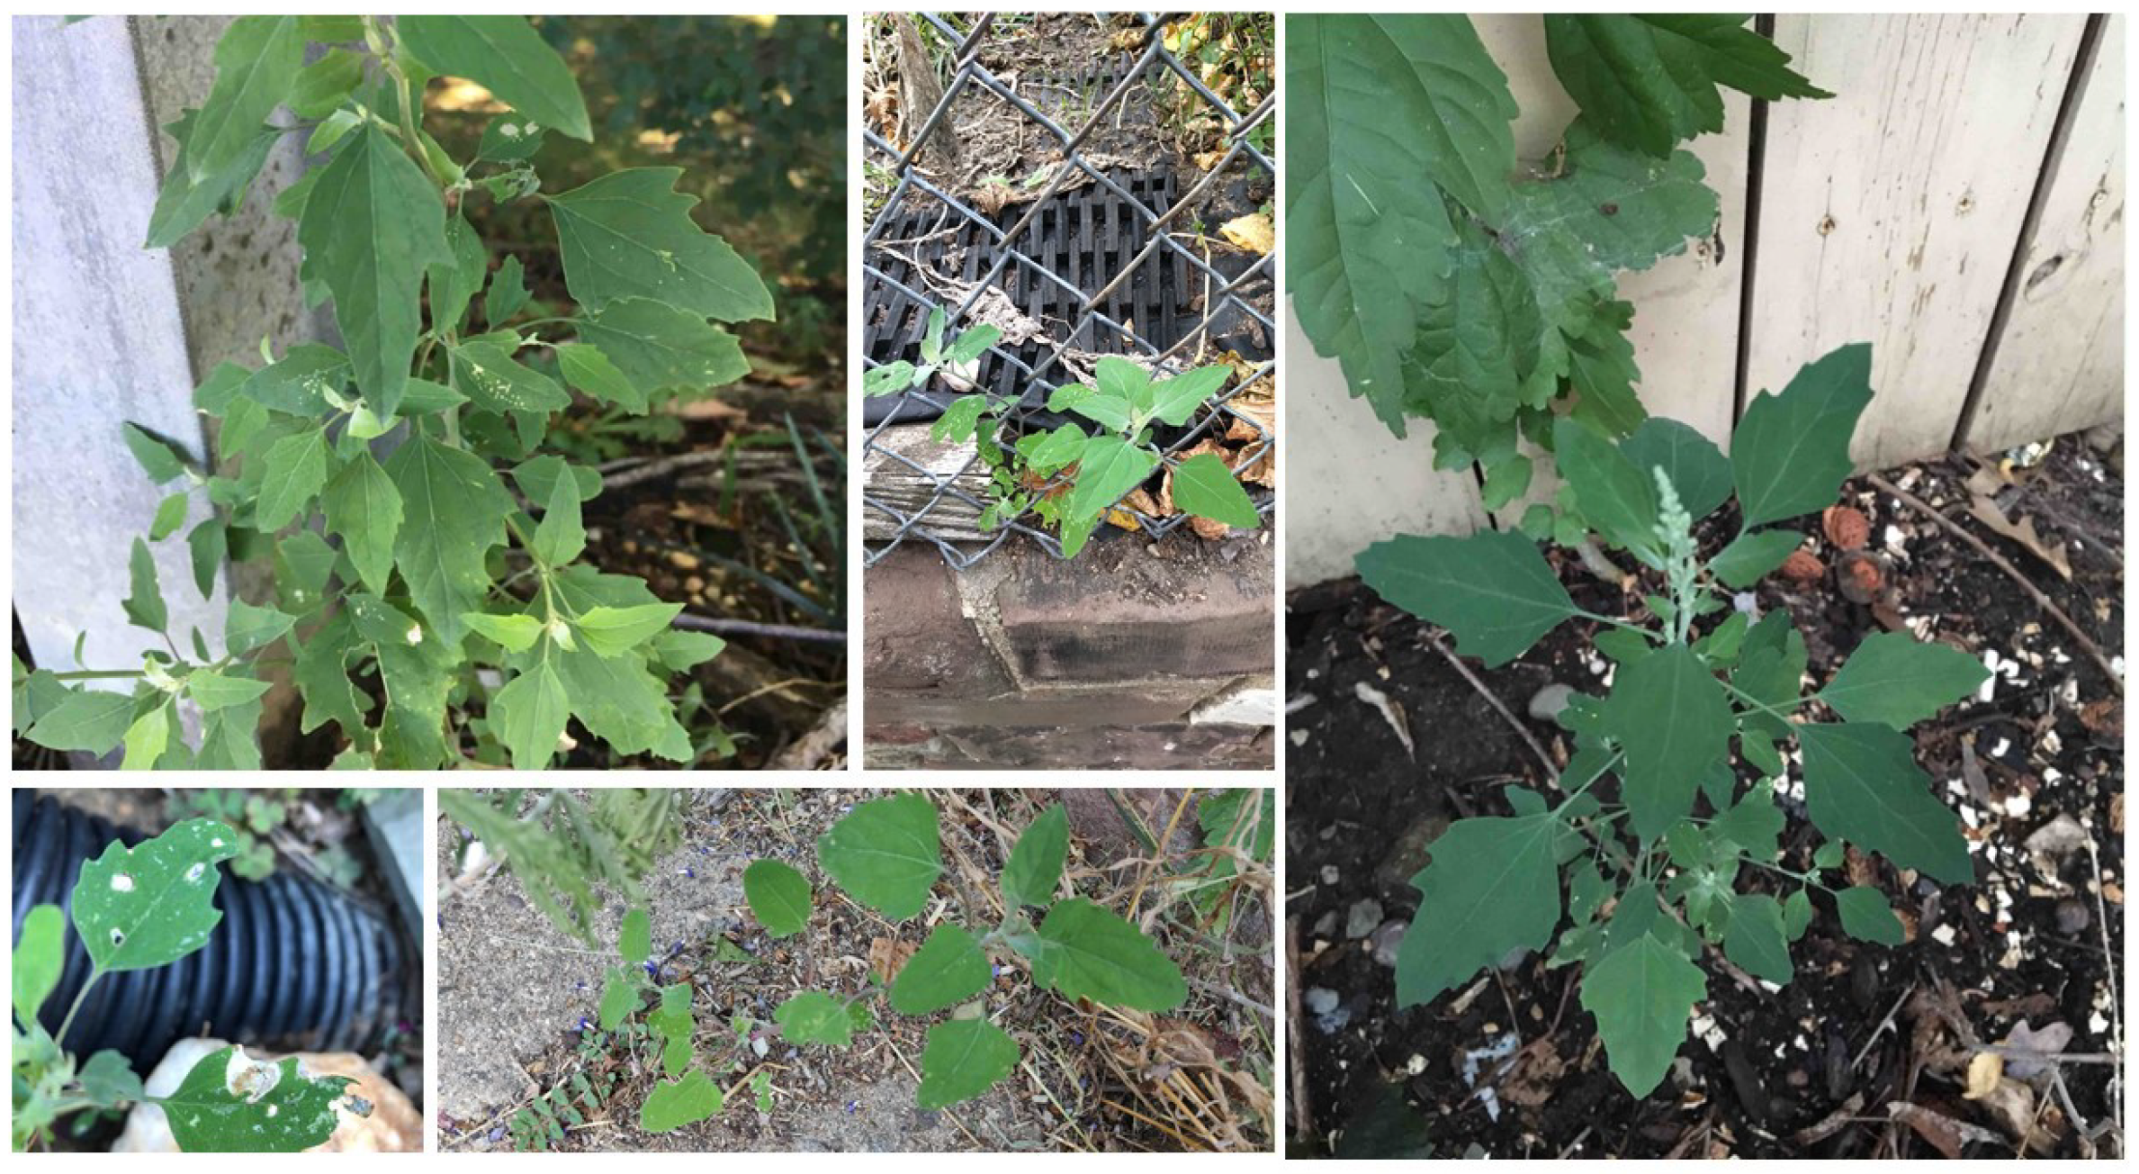
The agricultural domain is an underserved research area for human–computer interaction (HCI); it is difficult to build relevant technologies, or even understand if technological interventions are necessary, without an understanding of the full context of how agricultural work is conducted. In a survey of precision agriculture technologies, it was found that agricultural engineers often design and test their devices themselves to determine whether or not the device is “usable” [27]. In the HCI context, such a device would not be considered “usable” because the end users themselves did not have the opportunity to test the device themselves or provide feedback on the design. When the device is deployed in the field, farmers may struggle to operate the device as they do not have the designers’ knowledge. Ferrández-Pastor et al. discussed this in their study where they proposed a structure to include the expertise of the farmer in the design process [28]. Lindblom et al. echoed their call for the integration of user-centered design in precision agriculture, particularly in the design of decision support systems (DSS) [29]. They found that because farmers were not consulted in the design of these systems, scientists included data they thought was important for the farm, but in actuality the system did not meet the needs of the farmer [29]. Zaks and Kucharik found something similar in their study of agroecological monitoring infrastructure. They noted that poor data interpretation on the part of the user was due to output data not presenting in a familiar format for the farmer, and the systems were not integrated into agricultural management tools that farmers were familiar with [30]. In order to improve on the usability of technologies in agriculture, human-centered design principles were used for this study. The human-centered design protocol is expanded on in the methods section.

2.4. Lambsquarters

The study was conducted in collaboration with a University of D.C. researcher who was interested in identifying the extent of the spread of lambsquarters in the district.
Lambsquarters, or pigweed, or goosefoot, is a popular wild edible plant [31,32,33,34,35]. In previous literature, lambsquarters has been spelled “lamb’s quarters” or “lamb’s-quarters”, though the Integrated Taxonomic Information System (ITIS) and the United States Department of Agriculture (USDA) has determined the current naming convention to be “lambsquarters” [36,37]. Its scientific name Chenopodium album L. is derived from chen is Greek for goose, podos for foot, and album for white. These components reference the visual of the plant, as the shape of the leaves resembles a goose’s foot and the underside of the leaves are white, although older plants can take on a reddish color [33,34]. Examples of lambsquarters are in Figure 2.
Lambsquarters is a fast-growing weed that grows to an average of two feet high, but with the right conditions can grow to be six feet tall [31,32,34,35]. It is generally a summer plant that flowers in late spring into autumn [35,38,39].
It has a low germination rate and needs to spread its seeds wide to increase the chances of germination. To germinate, seeds need sufficient light and low temperatures [38,39]. One plant can produce 100,000 seeds; these seeds can remain dormant in soil for up to 40 years. Lambsquarters is a resilient plant that can be often found in difficult places, such as construction sites, farmland, gardens, roadsides, vacant lots, waste areas, and yards [33].
Lambsquarters is found all over the world and is known for its medicinal properties, along with its nutrition value [38,39]. It has been used to treat liver diseases and abdominal pain in Pakistan, and to improve appetite in India [40,41]. It is edible at all growth stages and is high in calcium, niacin, phosphorus, protein, riboflavin, thiamine, and vitamins A and C [33,34,35]. In Bengal, India and Mexico, lambsquarters is commonly eaten raw, in salads, or cooked as a vegetable; roasted with onions and eggs; and ground to make flour [33,34,35,42,43,44,45,46,47].
Researchers at UDC were interested in learning more about the growth of lambsquarters in the district. Investigating this resilient plant will contribute to their research agenda of climate change mitigation and food security. UDC is a public university in the District of Columbia and is the only urban land grant university in the United States. The land grant mission of the university is promoted by the College of Agriculture, Urban Sustainability and Environmental Sciences (CAUSES). They are focused on advancing the core objectives of the National Institute for Food and Agriculture of the USDA and the sustainability goals of the D.C. government. This is done through research-based academic and community outreach programs that expand the knowledge of sustainable farming techniques that improve food and water security, urban agriculture, and urban sustainability. Additionally, CAUSES provides research and educational programs to improve the health and wellness of local and global communities and to mitigate climate change [48].
The citizen science platform was built with the cooperation of CAUSES to support their research in lambsquarters in the D.C. community.

3. Materials and Methods

3.1. Research Questions and Hypotheses

The primary goals of the study were to gauge users’ perceptions of Mission LQ, evaluate how well the system satisfied their needs, and observe whether the classification rate of lambsquarters by the users matched that of an expert. The study aimed to answer the following research questions:
  • R 1 : To what degree can the barriers faced by individuals be alleviated by the prototype?
  • R 2 : To what extent will the prototype developed be considered “satisfactorily” usable?
  • R 3 : To what extent will the prototype be able to achieve the learning objective of classifying agricultural features?
Based on those research questions, the following hypotheses were developed.
  • H 10 : Users will find the prototype does not address the barriers in participating in agricultural crowdsourcing initiatives.
  • H 1 A : Users will find the prototype does address the barriers in participating in agricultural crowdsourcing initiatives.
  • H 20 : Users will find the prototype developed to be less than “satisfactorily” usable.
  • H 2 A : Users will find the prototype developed to be at least “satisfactorily” usable.
  • H 30 : Users will not be able to classify agriculture features as accurately as an expert.
  • H 3 A : Users will be able to classify agriculture features at least as accurately or more accurately than an expert.
The citizen science platform named “Mission LQ” was created in three versions, based on the feedback from users in the social interviews as published in Posadas B. et al. and wireframe evaluations described in Posadas B.B. et al. [49,50]. Two smartphone applications were built for iOS and Android, and a desktop version for users who do not have a smartphone. The designs for each are described below.

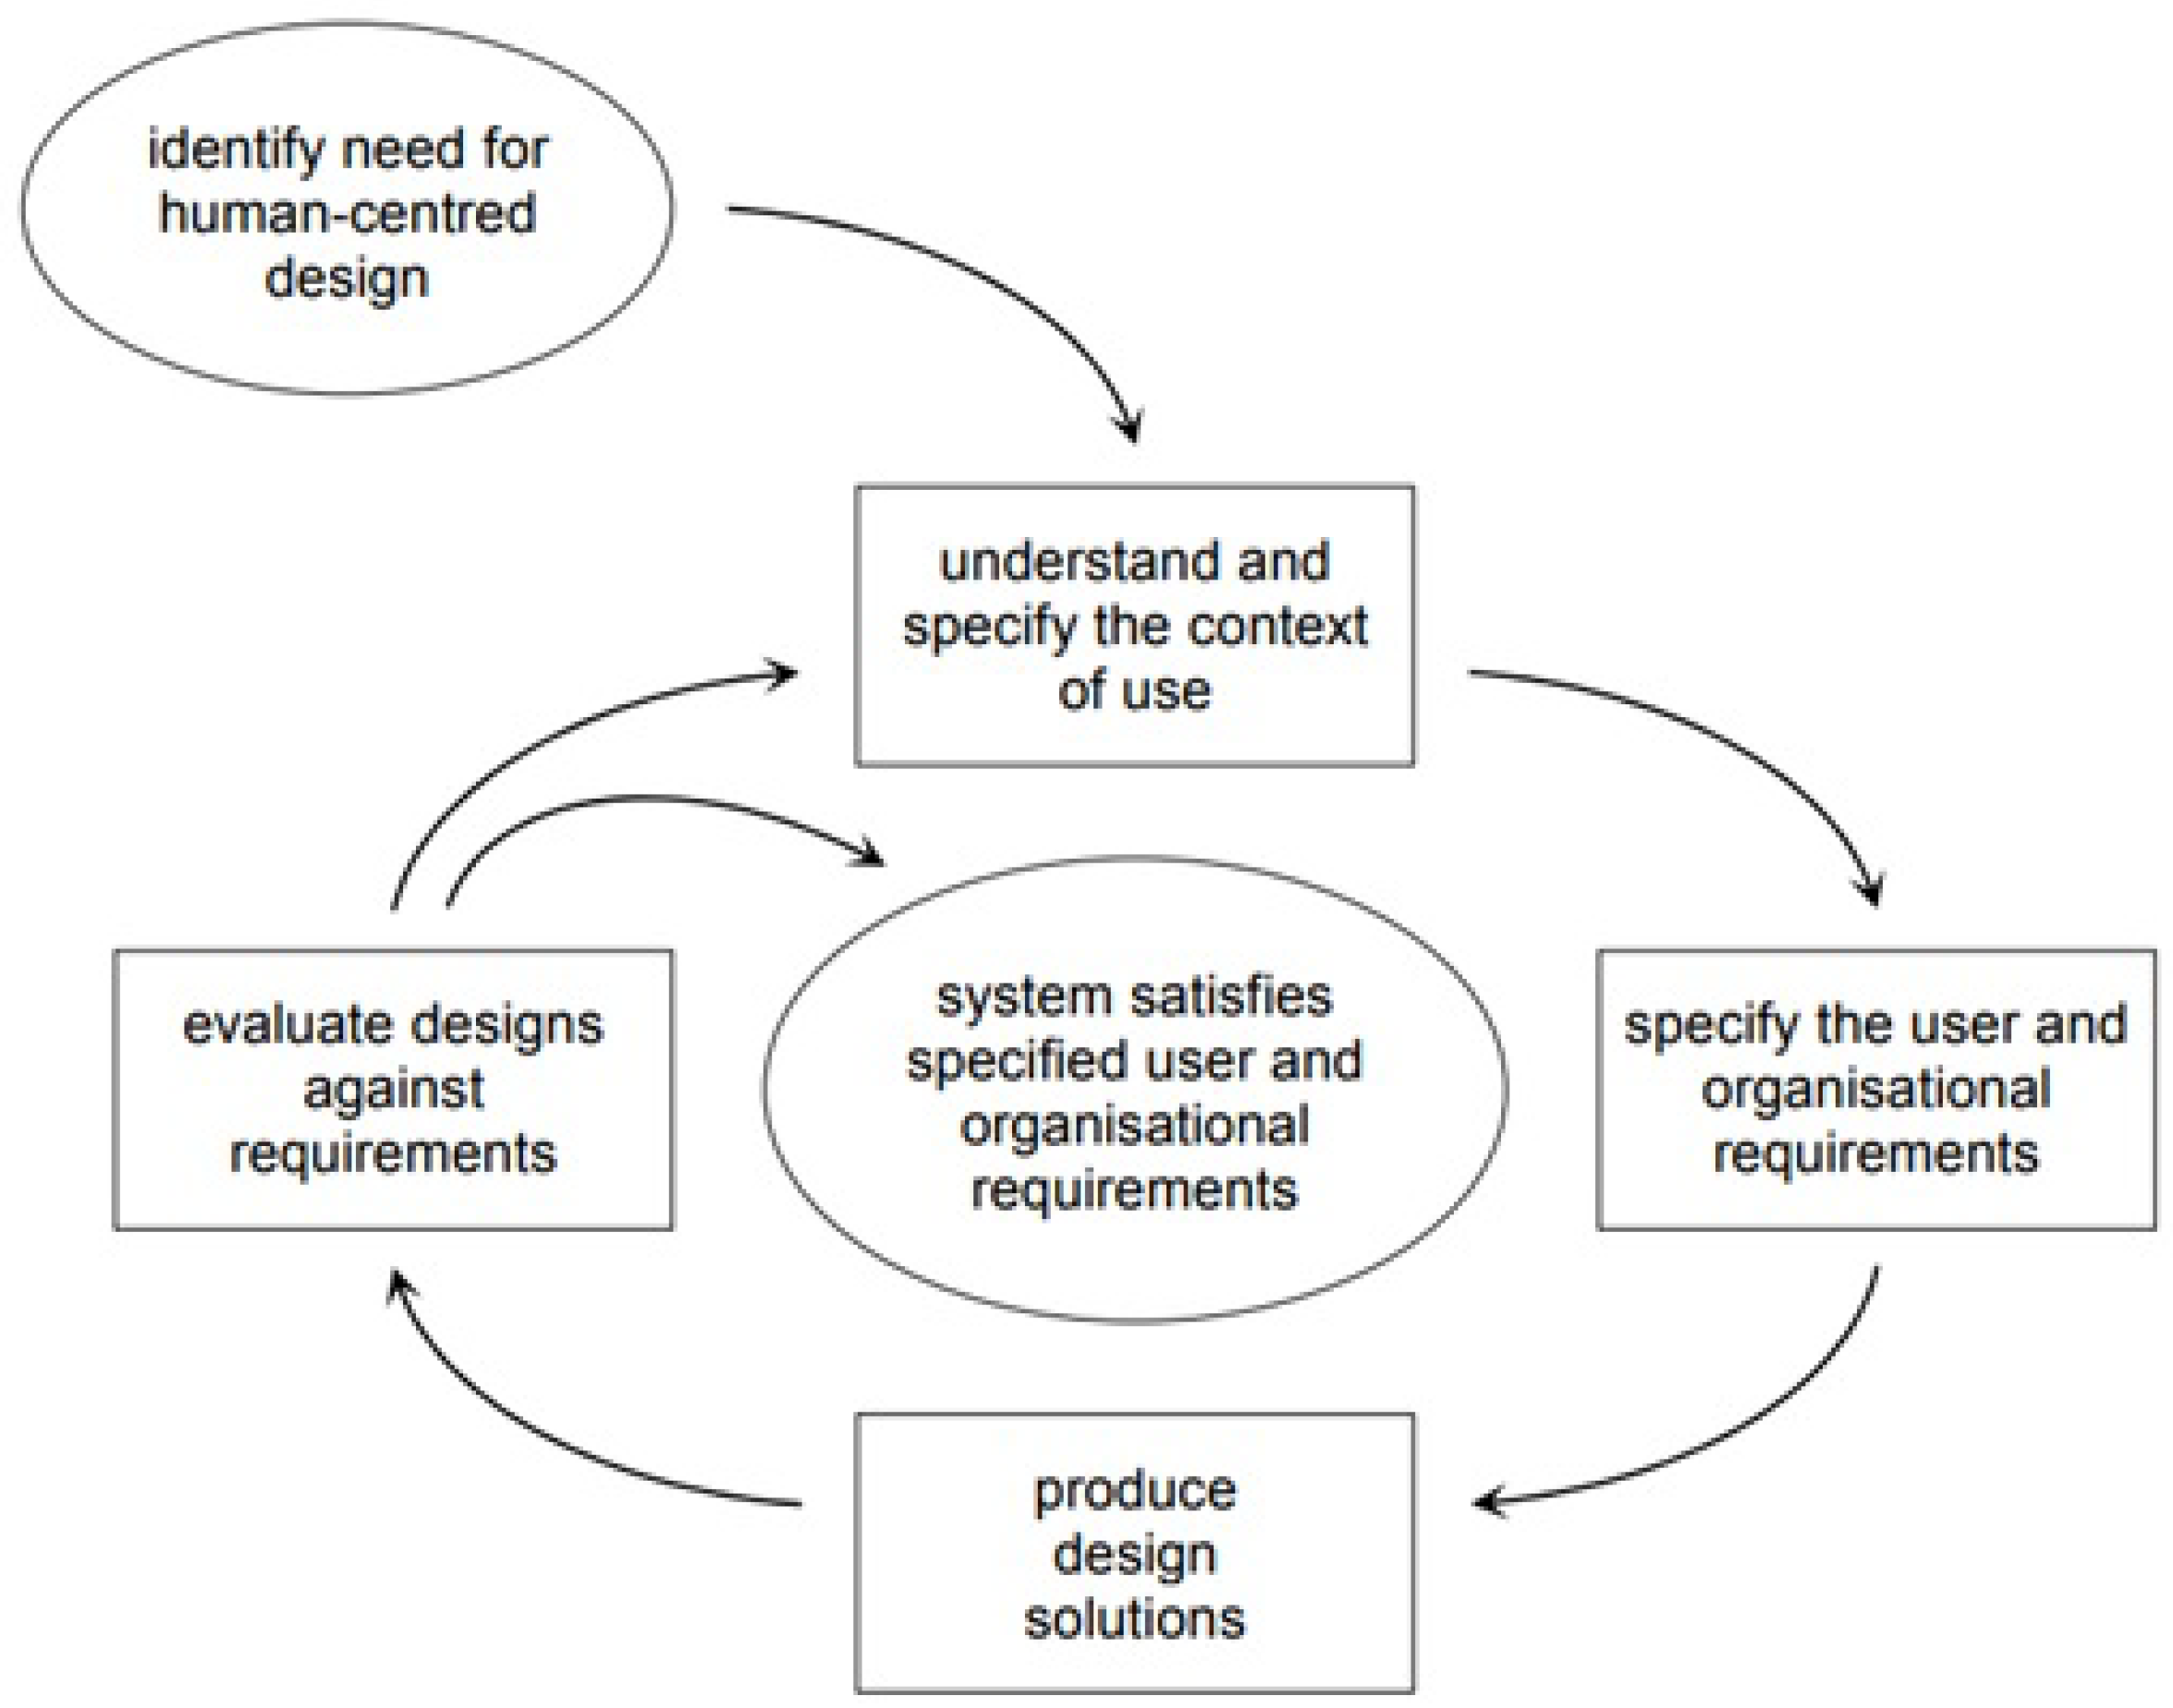
3.2. Human-Centered Design Protocol

The design process followed the human-centered computing methodology (Figure 3) and is discussed in further detail in the sections below. The main ideas behind human-centered design are that the process is iterative and the user is in the forefront of the process from beginning to end. As seen in Figure 3 from [51], once it is established that there is a need for an intervention, the iterative process begins. This allows for further refining of the design if needed after the evaluation process. It also serves as a reminder to designers and engineers that the design process is not simply “finished” right after the evaluation, and the process must continue if necessary. The next sections explain how each of the steps in the process were completed for this study.

3.2.1. Identifying the Need for Human-Centered Design

Based on previous research, we have identified a need for a human-centered crowdsourcing application to aid in ground truthing for the design of classification machine learning algorithms for precision agriculture.

3.2.2. Understanding and Specifying the Context of Use

Discussions with UDC researchers developed a need to map the growth patterns of the edible plant lambsquarters and to pair them with remote sensing data. As a land grant institution, it is part of UDC’s mission to work with the community through several projects, including extension classes, certifications, master gardener classes, and farmer’s markets [52]. As it is also part of UDC’s mission to educate the community in nutrition and gardening, working with citizens of the DMV as citizen science was beneficial.

3.2.3. Specifying the User and Organizational Requirements

This step focused on addressing the opinions and preferences of users in the DMV area as a citizen science platform was created. In order to understand their needs as well in assisting with the data collection on lambsquarters, focus groups were organized. From the focus group results, design personas were created as the focal point of the initial platform design.

3.2.4. Producing Design Solutions

Wireframes of the platform were created and evaluated by potential users. From their feedback, mobile applications and a web-based platform were created for users to upload ground truth data of lambsquarters.

3.2.5. Evaluating the Design against the Requirements

User studies were conducted to evaluate the usability of the platform and evaluated using the System Usability Scale and qualitative feedback from the users.

3.2.6. The System Satisfies the Specified User and Organizational Requirements

At the end of the evaluation stage, if it was not shown that the design meets the requirements, the process would have been repeated as described in Figure 3. However, the requirements were met, so this step was completed.

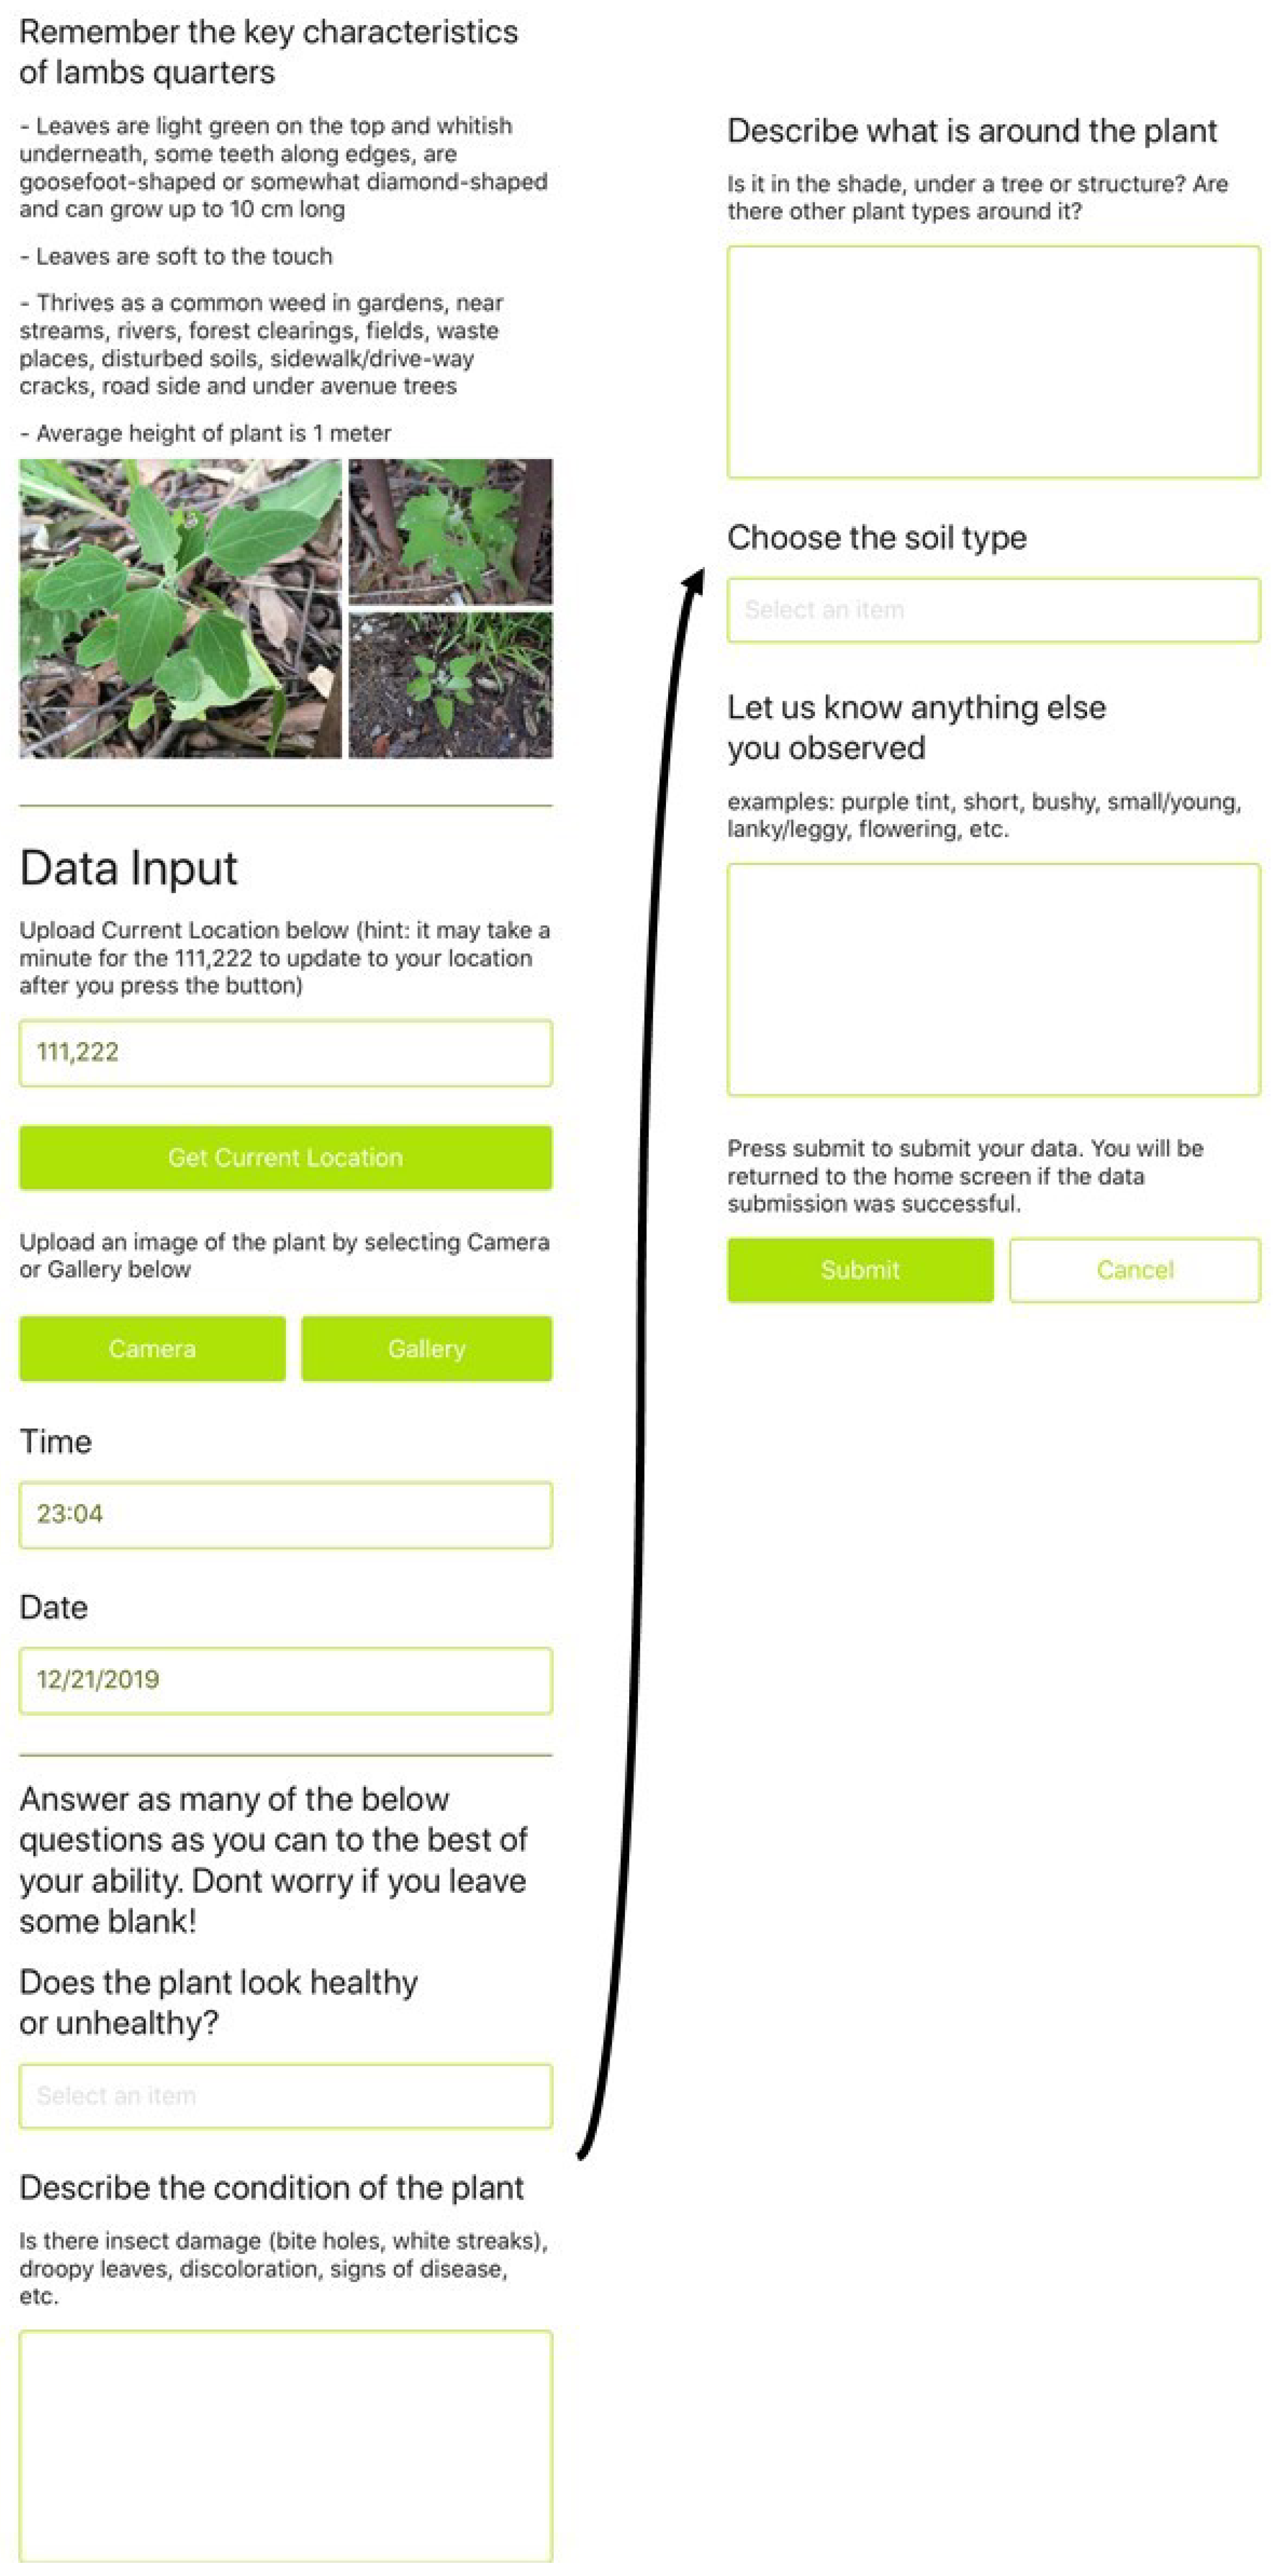
3.3. Smartphone Design

The design of Mission LQ for both iOS and Android was worked on simultaneously using Kinvey Studio. Kinvey Studio is a MBaaS (mobile back end as service) developed by Progress. It includes cloud and file storage, push notifications, authentication, encryption and mobile analytics within the mobile applications. Kinvey also supports native, hybrid, and mobile web applications.
A Kinvey-based application was built using NativeScript in Kinvey Studio. The application was then uploaded to the App Store for iOS and the Play Store for Android. Due to a bug discovered after the initial upload, the image upload aspect of the Android application had to be patched by adding an external web upload option for the image.
Based on the feedback from the first design iteration, changes were made to the smartphone application to improve user experience. As there was no feedback on the desktop version, no changes were made though the version remained available for users who wished to use it.
In the second design iteration of Mission LQ, users had to create an account as seen in Figure 4. In the first screen after logging in (Figure 5), there are more choices for the users. The first button opens their native web browser to an informational site about lambsquarters. The second button opens the data submission screen which is seen in Figure 6. The third button opens the native web browser to the Qualtrics site to submit the evaluation form. The fourth button opens a Google map (Figure 7) which shows the location of correctly identified lambsquarters submitted by users. The last button opens a sign up form to submit the user’s email specifically to receive research updates.
The data form was adjusted to make the data submission more smooth. The reminders of the characteristics of lambsquarters were shortened, as the user has easy access to a wealth of information on lambsquarters from the main screen. The user has only one image submission, as the presence of three image submissions made uploading data cumbersome and overwhelming. After the first section of GPS, image, time, and date, there are instructions stating that the rest of the data input is optional. While the descriptive data would be helpful, it is not necessary to building the data set of lambsquarters in the DMV. Additionally, having to answer so many questions was making the data submission process prohibitively long and frustrated users who do not have the same level of expertise to have the confidence to answer correctly.

3.4. Desktop Design

For the edge cases, users who stated they did not own smartphones, but would still like an option to contribute data to the project, a desktop version of Mission LQ was also created. The same questions that were asked of users in the smartphone application were listed in a Qualtrics survey for desktop users to upload their handwritten notes to. While the desktop option was advertised in all the recruitment material and throughout the user studies, no participants utilized this version. Thus, none of the results will be discussing this design, as no data were collected through this method and no evaluation of this system was made.

3.5. Recruitment

When conducting research for usability of a system, Turner et al. recommends a problem discovery size of at least 18 users in order to be 85% certain that problems that affect at least 10% of users are discovered [53]. For the user studies discussed in this paper, 33 users in total were recruited over a period of 7 months, which means that the study met the requirements of minimum recommended sample size. All users uploaded data and evaluated Mission LQ. The process by which recruitment was conducted is described below. The recruitment process followed the sampling strategy explained by Harding, where the cases were selected based on the likelihood they would be representative of the typical case [54]. By using the resources provided by UDC, the researchers maximized the chance that the typical case of a volunteer citizen scientist would be reached, as UDC is the local land grant university whose mission is to serve the community and produce lifelong learners [55]. Potential participants in the DMV were reached through UDC’s outreach programs, such as their master gardener courses and extensive volunteer network. They were contacted using the UDC’s listservs for these programs [56].

3.5.1. Recruitment: Design Iteration 1

Following the recommendations of researchers and volunteer coordinators at CAUSES at UDC, and advice from the previous social interviews, specific weekend dates were designated data collection days. Dubbed “Mission LQ days”, the first series of data collection weekends in August and September were advertised for the project, in addition to meetups for group data collection. Over the four weekends, meetups were organized at Meridian Hill Park, the National Mall, Montrose Park, and Rock Creek Park. These locations were chosen to concentrate data collection in different corners of the DMV. Table 1 shows the data collection dates and numbers of participants.
Due to poor attendance during the initial data collection run, user studies were extended through the month of September. Further volunteers were recruited through UDC’s listservs. In total, 14 users participated and evaluated the first iteration of Mission LQ.
All volunteers were invited to an exclusive agriculture class, as per the recommendation of the social interview participants. This class was organized on 25 January 2020 at the Arlington library.

3.5.2. Recruitment: Design Iteration 2

Following recommendations from users from the first design iteration user study, specific dates were designated for data collection at the Youth Garden at the United States National Arboretum. Six different days were chosen in October and November of 2019 for varying times and different days of the week to maximize the opportunities for participants. Dates and numbers of participants for the second round of user studies is in Table 2.
Due to poor attendance during the initial data collection run, user studies were extended through the following February. As the lambsquarters growing season had ended in the winter, the users’ protocol was changed slightly. Users who participated after the last meet-up on November 3 were instructed to use Mission LQ to submit data on any plant and evaluate the application to the best of their ability. These volunteers were also recruited through UDC’s listservs. In total, 19 users participated and evaluated the second iteration of Mission LQ.

3.6. User Study

3.6.1. User Study: Design Iteration 1

Participants had two different ways of participating: either online independently or through the meetups. Either way, participants began by following a link to the consent form. After agreeing to the consent form on Qualtrics, users were given instructions on downloading Mission LQ from the App Store or the Play Store. There was also a third non-smartphone option which was not utilized by any participants and will not be discussed more in the results section.
The instruction page also gave a description of lambsquarters and suggestions on where to find the plant. These instructions were vetted by a foraging expert before being included in the application. After reading the instructions and downloading the application, participants were able to go out and search for the plant. Some participants completed this step at the meetups with the research team. Most participants completed this step independently. When participants came across a lambsquarters plant, they were instructed to use the application to upload an image of the plant, their GPS coordinates, and answer some questions about the plant’s condition and surroundings. These questions were included at the request of the agronomy expert. The responses can help the expert to verify if the user submitted classification was correct. The responses can also signal to the expert if an anomaly in plant behavior is detected and can be further investigated. In future work of this research, the responses to these questions will help to train the PA algorithms to identify different features of lambsquarters, including health of the plant. After submitting the data, the participants were asked to evaluate the application using the System Usability Scale (SUS) and their experience in foraging.
The collected images were then vetted by an expert from UDC who decided if each image was correctly classified as lambsquarters.

3.6.2. User Study: Design Iteration 2

User study protocol was the same as in the first design iteration.

3.7. Evaluation

The evaluation of H 1 was conducted through an analysis of the qualitative data collected from users during user testing of the prototype. Evaluation of H 2 was conducted through the System Usability Scale. As per industry standard, the System Usability Scale (SUS) was used to generate a well-accepted quantitative description of the usability of the mobile application [57]. The SUS gives a score from 0 to 100 where any score below 70 indicates concerning usability issues, a score in the 70s is considered an acceptable design, a score in the 80s is considered a good design, and a score in the 90s is considered an exceptional design [58].
The evaluation of H 3 was conducted using Kendall’s W in SPSS [58,59]. Kendall’s W was then interpreted using the standards from Schmidt which ranks the value of W, from 0 to 1, into simple phrases from “very weak” to “unusually strong” [60]. In order to determine the strength of the validity of the aggregated classifications, a Kendall’s tau-b correlation, a measure of similarity between two rankings, was run on SPSS [61]. Tau takes the value from −1 to 1, where −1 indicates the ranks are completely reversed, and one indicates that the rankings are identical [58].

4. Results

4.1. Demographic Results

4.1.1. Demographic Results: Design Iteration 1

Of the 14 participants who evaluated the first design iteration of Mission LQ, two identified as African American, six identified as Caucasian, one identified as Hispanic, four identified as Asian, one identified as two or more races, and one identified as other. six participants identified as female, 7 identified as male and one identified as other. 10 participants reported obtaining a master’s degree or higher. Three participants had a bachelor’s degree and one participant reported having one or more years of college. Participants also self-reported which neighborhood or state they resided in. Washington D.C. is divided into 8 wards for city planning purposes as illustrated in Figure 8 from [62]. One participant was from Ward 1, four participants were from Ward 4, two participants were from Virginia, and seven participants were from Maryland. The most frequent age range of the participants was 50–59 years old, the same as the social interviews [49].

4.1.2. Demographic Results: Design Iteration 2

Of the 19 participants who evaluated the second design iteration of Mission LQ, four identified as African American, eight identified as Caucasian, four identified as Hispanic, three identified as Asian, one identified as two or more races, and three identified as other. Ten participants identified as female; nine identified as male. Eleven participants reported obtaining a master’s degree of higher. Four participants had a bachelor’s degree, three participants reported having one or more years of college, and one participant reported having some college credit, less than one year. One participant was from Ward 1, one was from Ward 2, three participants were from Ward 4, and two were from Ward 6. One participant only indicated that they were from other: “D.C.” Five participants were from Virginia and six participants were from Maryland. The most frequent age range of the participants was 50–59 years old, the same as the social interviews, and from the first design iteration described in Section 4.1.1 [49].

4.2. Usability Evaluation Results

The usability of Mission LQ was evaluated using a mixed method approach. Both the system usability scale and qualitative questions were used in the evaluation. While the SUS provides a quick and easy way to evaluate the usability of a system, it does not provide an opportunity for the users to indicate why they ranked the system a certain way or an opportunity to allow users to direct the developers to specific issues in the system [57]. The results of the usability evaluation for both design iterations are in the sections below.

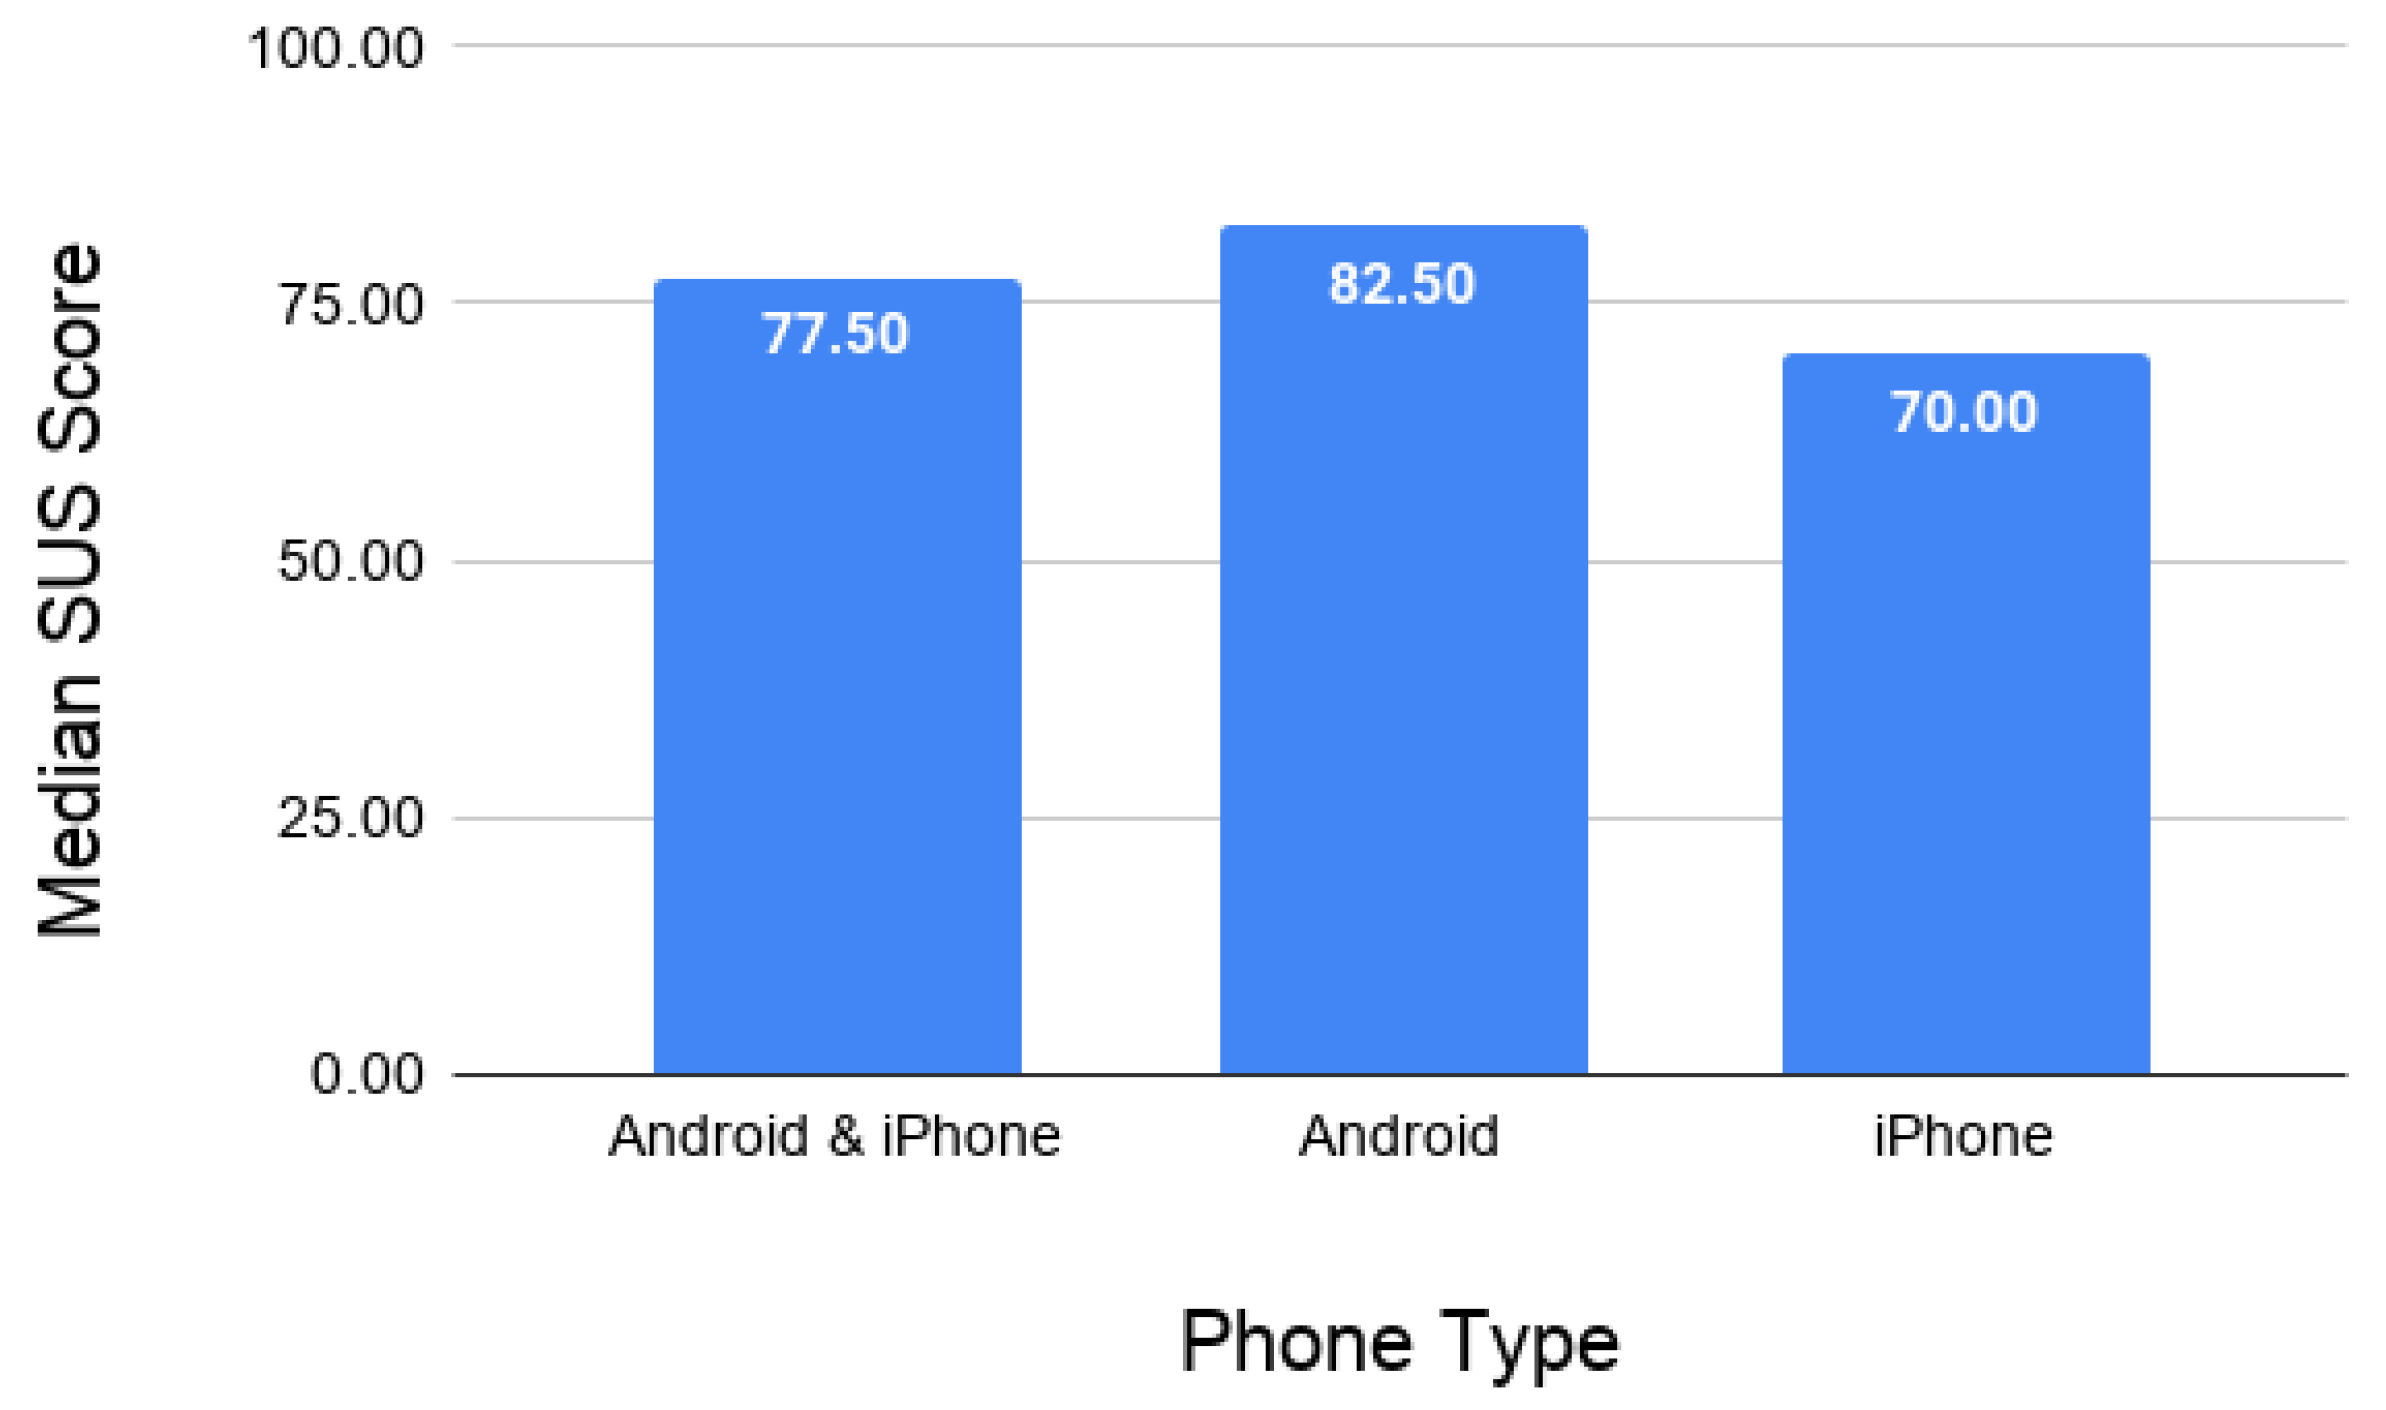
4.2.1. System Usability Scale Results: Design Iteration 1

The average SUS score was 76.07 and the median SUS score was 77.50 from all the users for the first design iteration. The average SUS score of Android users was 81.79 and the average SUS score of iPhone users was 70.36. The medians by phone type are in Figure 9. The distribution of the SUS scores was fairly even, with users being just as likely to give the first iteration of Mission LQ a score on the lower end, 50, as they were to give a score at the higher end, above 90.
Android users appeared to be more satisfied with their experience with Mission LQ than iPhone users. The SUS scores of Android users were slightly more skewed towards the higher scores, and the SUS scores of iPhone users were more evenly distributed from 50 to 100. The average and median SUS scores of Android users indicate that overall, they were satisfied with the usability of Mission LQ. While the average and median scores for iPhone users were above 70, there is still room for improvement.

4.2.2. Qualitative Results: Design Iteration 1

Responses to the open-ended questions after the SUS scale gave insights into what features needed to be changed or improved for the second design iteration. In response to the question, “How confident did you feel identifying lambsquarters after reading the instructions?” half the responses were on the confident side and the other half were on the unsure side. The participant who responded “extremely confident” also reported being a seasoned forager, so the additional instructions on identifying lambsquarters were probably not as needed. Other suggestions to improvements on the classification instructions included requests for more example images, more detailed descriptions, and photos from young to older plants.
The responses to “How long did it take you to submit the form in Mission LQ?” were very short for the first design iteration, ranging from one to a few minutes. One of the goals of the design was to make the process simple and quick, thereby increasing the chance that volunteers would use the application and contribute data. The first design iteration was a step in the right direction for achieving UDC’s goals.
Overall, volunteers reported being somewhat experienced in gardening or foraging. Several participants reported either being in the master gardener program or being seasoned foragers. The group’s high level of expertise may have contributed to the ease with which they were able to use the application and find lambsquarters data to submit.

4.2.3. System Usability Scale Results: Design Iteration 2

The average SUS score was 80.13 and the median SUS score was 82.5 for all users from the second design iteration. The medians by phone type are in Figure 10. The SUS scores were mostly over 70.
Android users appeared to be more satisfied with their experience with Mission LQ than iPhone users. The SUS scores of Android users were slightly more skewed towards the higher scores, whereas the SUS scores of iPhone users were more evenly distributed from a low of 40 to 100. The average and median SUS score of Android users indicates that overall, they were satisfied with the usability of Mission LQ. Using the standards established by Bangor et al., looking at the mean and median SUS scores for iPhones, the design for that platform is well above the acceptable range [57]. The design for the Android platform can be considered exceptional, as the average and median SUS score from Android users was 90 [58]. Overall, the second iteration of Mission LQ was evaluated as a great design and an improvement over the first design.

4.2.4. Qualitative Results: Design Iteration 2

Responses to the open-ended questions after the SUS scale gave insights into how much better the second design was compared to the first design. In response to the question “How confident did you feel identifying lambsquarters after reading the instructions?” 63.1% of the responses were on the confident side; 15.8% were on the unsure side; and 21.1% stated that they felt neither confident or unsure. The increased confidence in the users’ ability to identify lambsquarters can also be attributed to the instructions in classification. In Mission LQ, users had the ability to navigate to an informational website which broke down how to classify lambsquarters in the wild. In addition, as the second design iteration was created after some user data had been submitted, the second design was able to incorporate real user images in the data form to demonstrate actual user data that was correctly classified. The increased opportunities to learn how to identify lambsquarters both from expert foragers, from the website, and from their fellow users, helped to increase participants’ confidence in performing correct classification themselves.
The responses to “How long did it take you to submit the form in Mission LQ?” were longer than they were for the first design iteration, with participants reporting it took up to 15 min to submit data. The increased time for submission can be contributed to the fact that the second design iteration included a login, and some participants forgot their login information, which provided an additional obstacle to submitting data. Despite the increase in submission time, the second design iteration still scored higher on the SUS than the first design, which may indicate users were not bothered by the longer submission time.
Overall, volunteers for the second design iteration were more split in their experience in gardening and/or foraging. Half of the responses to the question “How would you describe your gardening or foraging or experience?” were on the little to no experience side, whereas the other half of the responses were on the experienced or expert side. As one of the goals was for Mission LQ to be used by any user regardless of their experience with gardening and/or agriculture, the higher usability scores given to this design from both experienced and non-experienced users show the effectiveness of the design improvements.

4.3. Lambsquarters Results

The results for lambsquarters are divided into two sections: the classification rate and the mapping of the lambsquarters location as it may pertain to future remote sensing mapping. As disclosed in Section 3.5.2, the last classification data submitted on lambsquarters were given in early November, the end of its growing season. As so few of the users who tested the second design iteration did not have any opportunities to perform classification, the lambsquarters results will be discussed in aggregate in this section.

4.3.1. Classification Rates

In total, 25 classified lambsquarters was submitted through Mission LQ. Out of the 25 classifications, 18 of them were considered correct by an expert. This gives a total classification rate of 72%. Figure 11 and Figure 12 below show examples of the correctly identified lambsquarters and misclassified plants from the users.
To determine the significance of this result and assess the reliability of the classification, Kendall’s W was calculated using SPSS [58,59]. The results of Kendall’s W test are displayed in Table 3. Kendall’s W value of 0.5 places the classification rate at the “moderate agreement” range, which means there was moderate agreement between the non-experts who submitted classifications and the expert who validated the submitted classification.
In order to determine the strength of the validity of the aggregated classifications, a Kendall’s tau-b correlation, a measure of similarity between two rankings, was run on SPSS [61]. In order to run the statistical test, one additional image was added, for which both the expert and nonexpert agreed that the plant was not lambsquarters. Considering that many more data points were submitted where the user acknowledged it was not the correct plant, adding a data point should not significantly alter the results. The results of Kendall’s tau-b correlation are in Table 4.
According to the results of Kendall’s tau-b correlation test, there is a non-significant, weak positive correlation between the classifications made by the expert and nonexpert (tau-b = 0.327, p = 0.109). This means that, although the classification rate of lambsquarters was an acceptable 72%, the sample size contributed greatly to the rate being non-significant. These results are promising, but not scientifically significant.

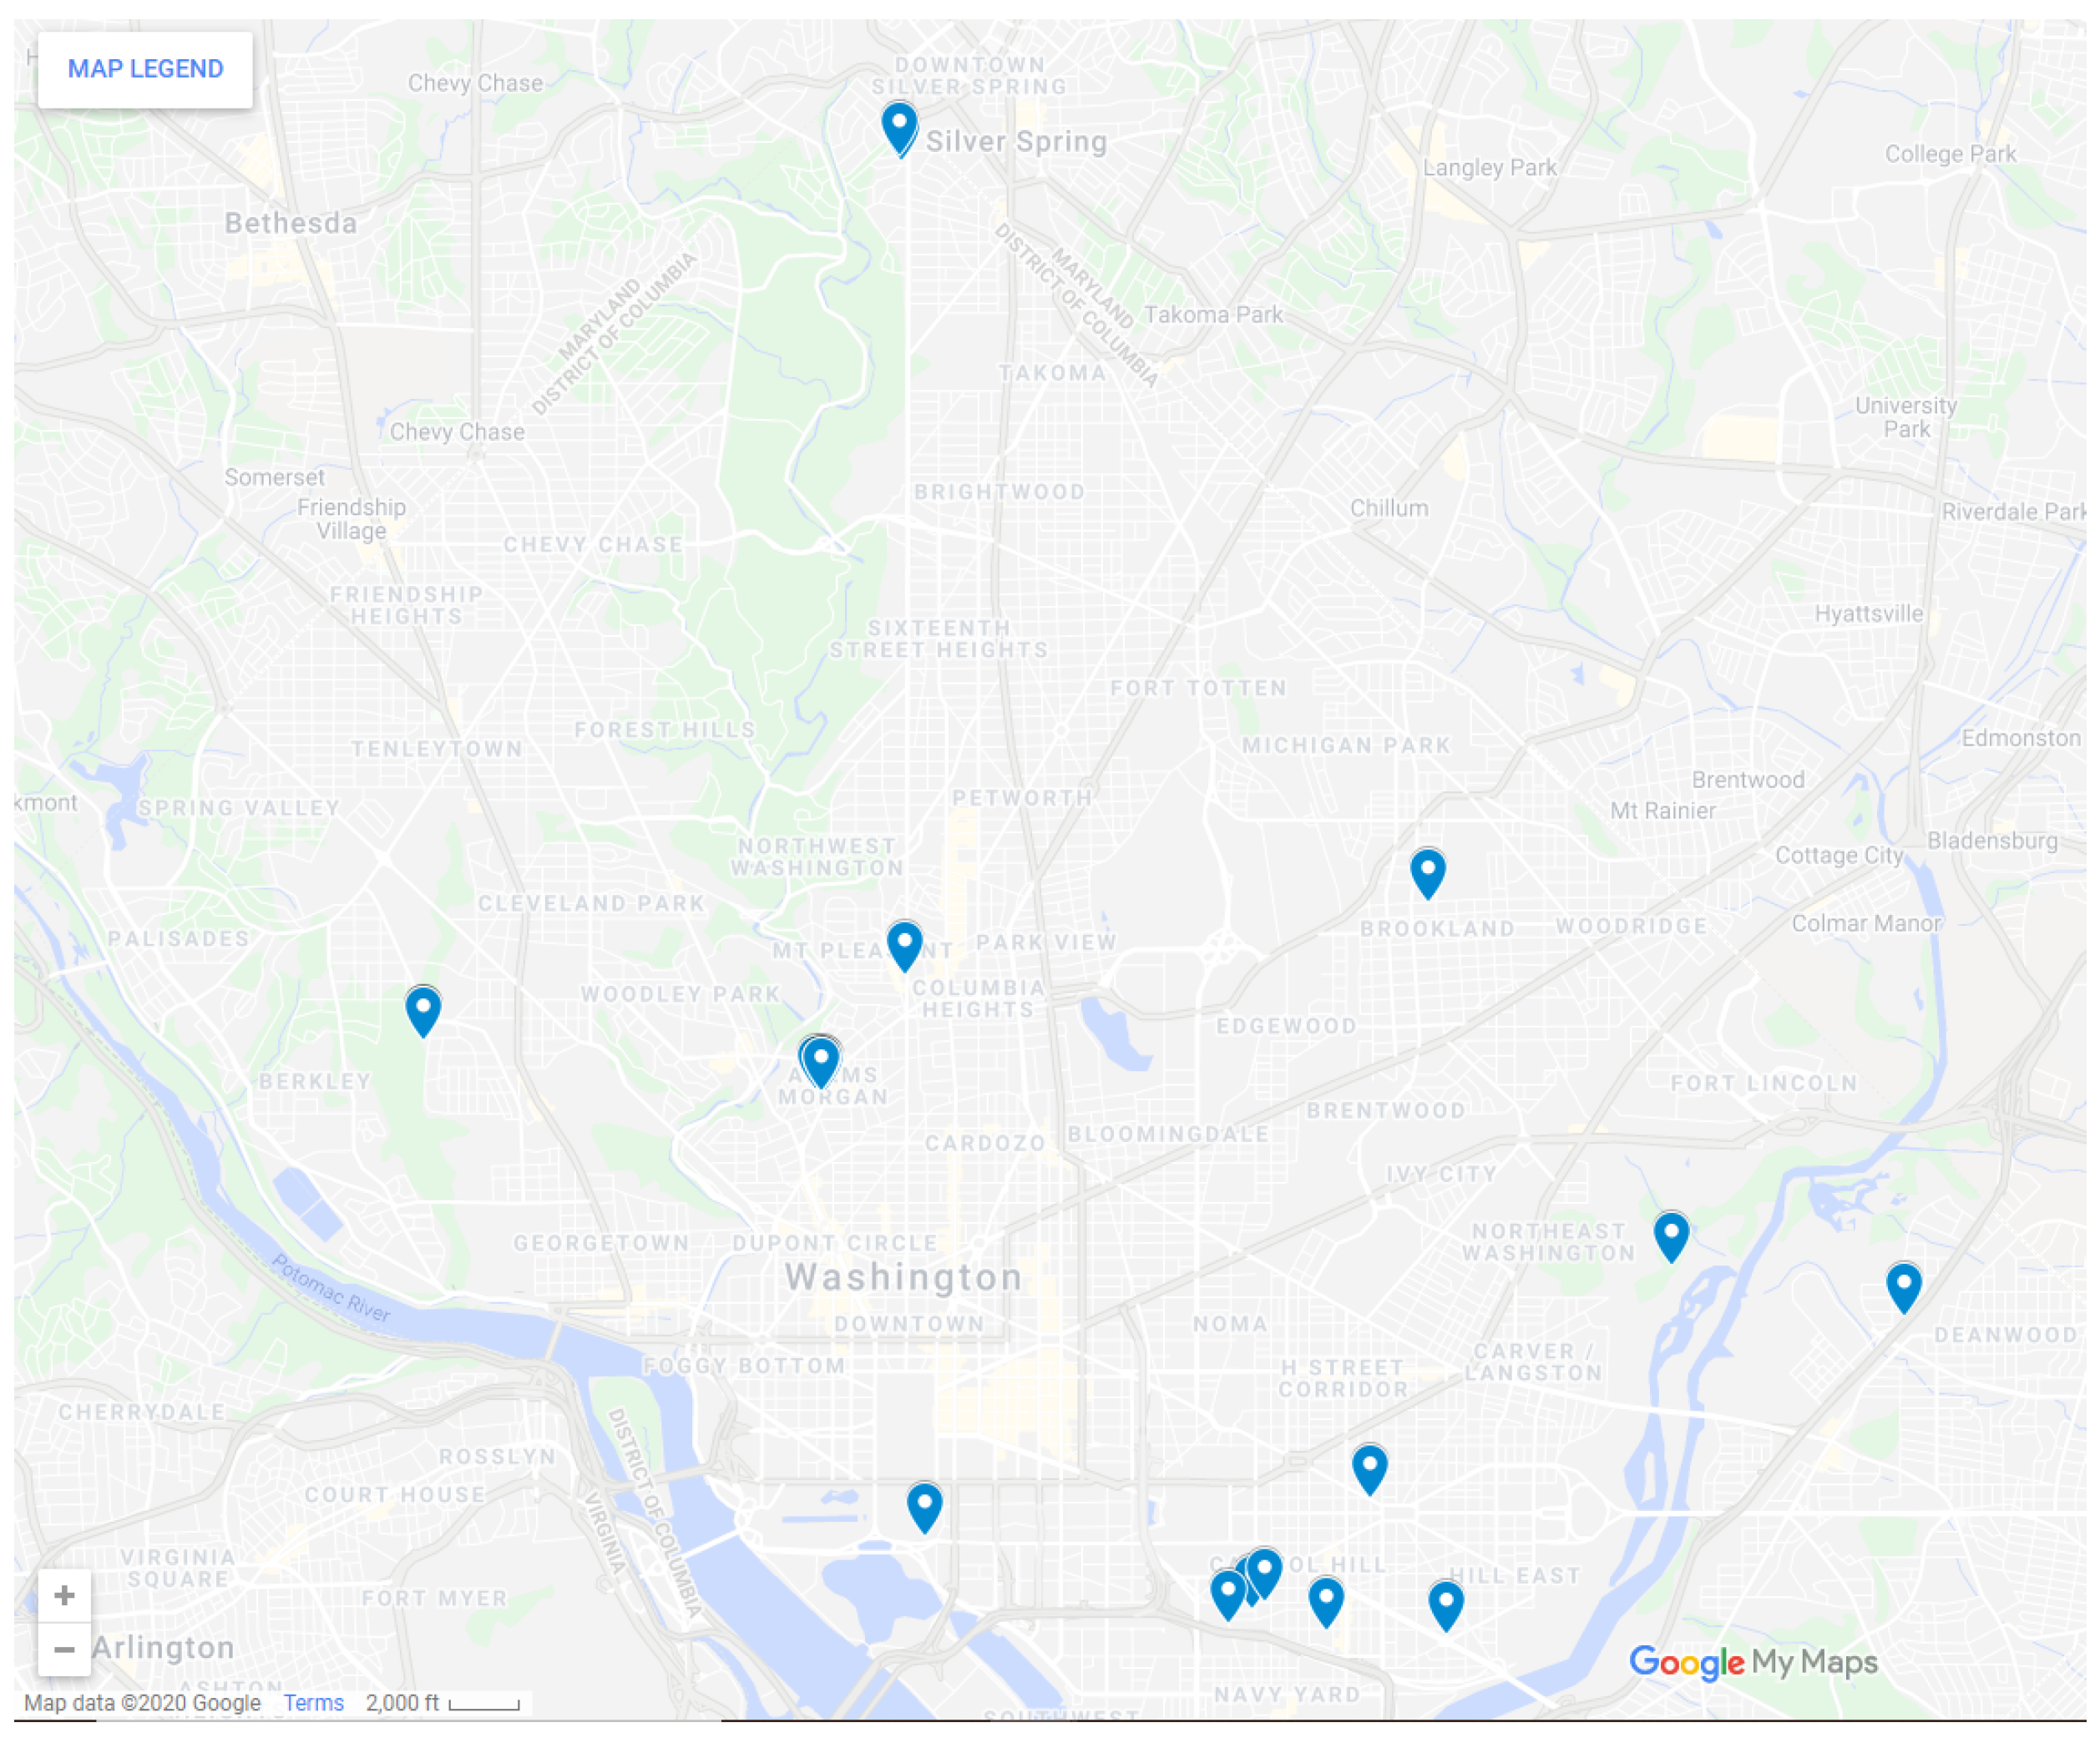
4.3.2. Vegetation Map

In Figure 13 is the compiled map of the lambsquarters correctly identified by the users. About half of the lambsquarters were found in urban areas, such as Adams Morgan and Capitol Hill. The other half were located within parks, such as Glover Archbald Park and the National Arboretum. With only 24 data points to work with, it does not appear that there was a pattern in the locations where lambsquarters were found by Mission LQ users.

5. Discussion

5.1. Research Question 1

R 1 : To what degree can the barriers faced by individuals be alleviated by the prototype?
Based on the results of this study, we can reject the null hypothesis and accept the alternative hypothesis H 1 A : users will find the prototype does address the barriers in participating in agricultural crowdsourcing initiatives. We reject the null hypothesis based on the qualitative feedback provided by the users as described further in this section. Additionally, we can consider these results significant based on the problem discovery sample size requirements as proposed by Turner et al.: in order to be 85% sure that problems that affect 10% of users are discovered, a minimum of 18 users are needed [53]. As the second design iteration was evaluated by 19 users, we have met this threshold to be 85% confident we found problems that could be encountered by 10% of users, and their written feedback provides the context of their experiences.
In the initial contact with the user base through the social interviews, it was indicated that the primary motivators to participate in the data collection included competence development, social affiliation, data quality, and having a finite data collection window [49]. The competence development motivator was addressed through the expanded educational opportunities to learn how to classify lambsquarters through Mission LQ, and as suggested in the social interview, through an exclusive educational opportunity offered to the participants of the initiative. As was found through the feedback of the second design iteration, users reported feeling confident in their classification ability and enjoyed the improved opportunities to learn about lambsquarters. Thus, the competence development requirement was met.
A large part of the study design primarily was to address the social affiliation feedback from the initial social interviews. In the social interviews, one of the primary motivators to participating in crowdsourcing activities was social affiliation, which emerged in the discussions as community building with other users. An exemplar quote from the social interviews:
“You see like minded people with the same passion, the same zeal, you compare and contrast your ideas…You learn something you learn better when somebody with the same mentality explains something to you [50]”.
In the spirit of this feedback, data collection meet-ups were scheduled and advertised through the UDC volunteer listservs. As the meet-ups were first arranged during the summer, the attendance was incredibly low. After communicating with users who did show up, it was revealed that the summer is the worst time to hold volunteer events. It is common for the UDC community to take the summers off, and the pool of potential participants diminishes. Knowing this, more meet-ups were arranged through the fall, the end of lambsquarters growing season. These meet-ups, unfortunately, were also poorly attended. Of the 34 users who evaluated either iteration of Mission LQ, only eight users attended any of the meet-ups, about 24% of total users. While having these meet-ups was initially described as an important aspect of recruiting users, in practice it did not seem to be the case. Through the actions of users, it appears users were more comfortable collecting data on their own and on their own time.
Data quality was another motivator users were concerned about regarding classifying lambsquarters, particularly since it is an edible plant and users may be motivated to consume plants they find, whether or not they are correctly classified. Thankfully, it turns out that the look-a-likes for lambsquarters are non-poisonous, so users who mistakenly consume a look-a-like are not going to make themselves sick [63]. Furthermore, because of the small dataset, it was possible for the single expert researcher to evaluate all the images that were submitted for accuracy. In the first design iteration, some users requested feedback on their submissions, but the submission process at that time was anonymous. Thus, in the second design iteration, a login was created in order to tie the submissions to the users and provide feedback. These efforts contributed to meeting the requirements of data quality.
The last request of the citizen science platform was having a finite data collection window of time. Attempts were made to do this through the “Mission LQ Days” in the summer of 2019. However, it turned out that even though the summer is the height of the lambsquarters growing season, it is prime time for members of the UDC community to take vacations. Thus, there was an extremely low turnout for the initial data collection attempts. In the future, data collection will need to be concentrated in the beginning of the growing season in the spring and at the end in the fall. Finite weekend dates can be chosen and the example images through the application can reflect the growing stage expected of lambsquarters depending on the season.

5.2. Research Question 2

R 2 : To what extent will the prototype developed be considered “satisfactorily” usable?
Based on the results of the SUS evaluations, we can reject the null hypothesis and accept the alternative hypothesis H 2 A : users will find the prototype developed to be at least “satisfactorily” usable. The final design iteration had an average SUS score of 80.13 and a median SUS score of 82.5, which indicate a great system. The significance of this result is supported by the usability test sample size requirements as proposed by [53]. According to Turner et al., in order to be 85% sure that problems that affect 10% of users are discovered, a minimum of 18 users are needed [53]. It should be noted that this significance is only for problem discovery in an interface, and not for other metrics often used to evaluate usability [64]. The qualitative responses also support that the second design iteration was not only an improvement over the first design, but it was also ranked highly with both expert and nonexpert gardeners.

5.3. Research Question 3

R 3 : To what extent will the prototype be able to achieve the learning objective of classifying agricultural features?
Based on the result of the classification rate of lambsquarters from the user studies, we will have to accept the null hypothesis H 30 : users will not be able to classify agriculture features as accurately as an expert. The classification rate achieved by the users, 72%, did fall within the acceptable range demonstrated in other similar studies. A study with farmers in Honduras achieved a 77% classification rate of crop identification and a survey of classifies designed to distinguish between weeds and crops found a range of classification rates of 65% to 95% [21,65]. Even though the classification rate in this study was in an acceptable range, because of the small sample size, the rate cannot be considered statistically significant. However, considering the lower level of expertise by this group, the weak positive agreement between the classifications of the users and those of the expert is still an achievement. Additionally, because the expert in this study was able to individually evaluate each sample without having to go out and collect the images herself, the classification rate was less important than the other research questions, as the expert was easily able to correct misclassified samples. However, if the study were to be scaled up, a better method to ensure a high classification rate will be necessary.
Another way to support scaling up the study is to work with local high schools and middle schools to integrate Mission LQ into their curricula. Throughout the study, high school teachers have expressed interest in using the application in their classrooms. By allowing their students to collect data and contribute to a research project, they can make real-life connections to what they are learning in the classroom and feel a sense of accomplishment by contributing to real research. Furthermore, having students participate in research at the middle and high school stages may encourage students to consider careers in research if they have not considered them before. Future research will include adopting agricultural crowdsourcing initiatives for high school classrooms.

6. Conclusions

The researchers built a citizen science platform to crowdsource the data collection of lambsquarters growth in the DMV. The mobile platform, named Mission LQ, was designed for Android and iOS, and also made a desktop version available. Mission LQ was evaluated by users recruited through the UDC listservs. Users were able to join meetups to test the application with the researchers, or could submit their data and evaluations remotely on their own time. The first design iteration had an average SUS score of 76.07, which indicates a good design, but improvements could still be made. Based on the feedback from the first group of users, a second design iteration was created and deployed. The second design iteration of Mission LQ received an average SUS score of 80.13. The resulting SUS scores demonstrate that the final design of Mission LQ was a great design and a vast improvement on the first iteration.
Mission LQ was also evaluated based on how well users were able to perform correct classification of lambsquarters as compared to an expert. The classification of lambsquarters was 72%, with there being moderate agreement between the classifications made by the expert researcher and our nonexpert users. This demonstrates that with a little bit more training for the users, the classification rate can be improved to a level usable for precision agriculture.

Author Contributions

Conceptualization, B.B.P., M.H. and J.E.G.; methodology, B.B.P. and J.E.G.; software, B.B.P.; validation, B.B.P. and M.H.; formal analysis, B.B.P.; investigation, B.B.P.; resources, B.B.P., J.E.G. and M.H.; data curation, B.B.P.; writing—original draft preparation, B.B.P.; writing—review and editing, B.B.P., J.E.G., M.H. and K.N.; visualization, B.B.P., M.H. and K.N.; supervision, J.E.G. and K.N.; project administration, B.B.P.; funding acquisition, B.B.P. All authors have read and agreed to the published version of the manuscript.

Funding

This research received no external funding.

Institutional Review Board Statement

The study was conducted according to the guidelines of the Declaration of Helsinki, and approved by the Institutional Review Board of the University of Florida (protocol code IRB201802487 and IRB201901458).

Informed Consent Statement

Informed consent was obtained from all subjects involved in the study.

Data Availability Statement

The data presented in this study are available on request from the corresponding author. The data are not publicly available due to IRB restrictions.

Acknowledgments

Thank you to the University of the District of Columbia and the Human-Experience Research Lab at the University of Florida for their support of this collaborative project.

Conflicts of Interest

The authors declare no conflict of interest.

Abbreviations

The following abbreviations are used in this manuscript:
CAUSESCollege of Agriculture, Sustainability and Environmental Sciences
D.C.District of Columbia
DMVD.C., Maryland, and Virginia
DSSdecision support systems
GPSglobal positioning system
ITISIntegrated Taxonomic Information System
MBaaSmobile back end as service
PAprecision agriculture
SPSSStatistical Package for the Social Sciences
SUSSystem Usability Scale
USDAUnited States Department of Agriculture
USGSUnited States Geological Survey

References

  1. Food and Agriculture Organization of the United Nations The State of Food and Agriculture 2014 IN BRIEF. Available online: http://www.fao.org/3/a-i4036e.pdf (accessed on 20 May 2019).
  2. Riquelme, J.A.L.; Soto, F.; Suardiaz, J.; Sanchez, P.; Iborra, A.; Vera, J.A. Wireless Sensor Networks for precision horticulture in Southern Spain. Comput. Electron. Agric. 2009, 68, 25–35. [Google Scholar] [CrossRef]
  3. Santos, I.M.; da Costa, F.G.; Cugnasca, C.E.; Ueyama, J. Computational simulation of wireless sensor networks for pesticide drift control. Precis. Agric. 2014, 15, 290–303. [Google Scholar] [CrossRef]
  4. Thompson, N.M.; Bir, C.; Widmar, D.A.; Mintert, J.R. Farmer Perceptions of Precision Agriculture Technology Benefits. J. Agric. Appl. Econ. 2019, 51, 142–163. [Google Scholar] [CrossRef] [Green Version]
  5. Wolfert, S.; Ge, L.; Verdouw, C.; Bogaardt, M.J. Big data in smart farming—A review. Agric. Syst. 2017, 153, 69–80. [Google Scholar] [CrossRef]
  6. Sykuta, M.E. Big Data in Agriculture: Property Rights, Privacy and Competition in Ag Data Services. Int. Food Agribus. Manag. Rev. 2016, 19, 57–74. [Google Scholar]
  7. Schuster, J. Big Data Ethics and the Digital Age of Agriculture. Resour. Mag. 2017, 24, 20–21. [Google Scholar]
  8. Shipman, M. Interpreting the Growing Field of On-Farm Data. 2019. Available online: https://news.ncsu.edu/2019/10/on-farm-data/ (accessed on 15 February 2020).
  9. Bendre, M.R.; Thool, V.R. Analytics, challenges and applications in big data environment: A survey. J. Manag. Anal. 2016, 3, 206–239. [Google Scholar] [CrossRef]
  10. Physical Oceanography Distributed Active Archive Center (PO.DAAC). 2015. Available online: https://podaac.jpl.nasa.gov/ (accessed on 11 January 2018).
  11. Kamilaris, A.; Kartakoullis, A.; Prenafeta-Boldú, F.X. A review on the practice of big data analysis in agriculture. Comput. Electron. Agric. 2017, 143, 23–37. [Google Scholar] [CrossRef]
  12. Minet, J.; Curnel, Y.; Gobin, A.; Goffart, J.P.; Mélard, F.; Tychon, B.; Wellens, J.; Defourny, P. Crowdsourcing for agricultural applications: A review of uses and opportunities for a farmsourcing approach. Comput. Electron. Agric. 2017, 142, 126–138. [Google Scholar] [CrossRef] [Green Version]
  13. Lowenberg-DeBoer, J.; Erickson, B. Setting the record straight on precision agriculture adoption. Agron. J. 2019, 111, 1552–1569. [Google Scholar] [CrossRef] [Green Version]
  14. Schimmelpfennig, D.; Ebel, R. Sequential adoption and cost savings from precision agriculture. J. Agric. Resour. Econ. 2016, 41, 97–115. [Google Scholar]
  15. Schimmelpfennig, D. Farm Profits and Adoption of Precision Agriculture; Economic Research Service. ERR-217; U.S. Department of Agriculture: Honolulu, HI, USA, 2016.
  16. Schimmelpfennig, D. Cost Savings From Precision Agriculture Technologies on US Corn Farms. Amber Waves 2016. Available online: https://www.ers.usda.gov/amber-waves/2016/may/cost-savings-from-precision-agriculture-technologies-on-us-corn-farms (accessed on 20 June 2021).
  17. Bora, G.C.; Nowatzki, J.F.; Roberts, D.C. Energy savings by adopting precision agriculture in rural USA. Energy Sustain. Soc. 2012, 2, 22. [Google Scholar] [CrossRef] [Green Version]
  18. Deere, J.; Ess, D.; Morgan, M. The Precision Farming Guide for Agriculturists; Cengage Learning: Boston, MA, USA, 2003. [Google Scholar]
  19. Chaterji, S.; DeLay, N.; Evans, J.; Mosier, N.; Engel, B.; Buckmaster, D.; Chandra, R. Artificial Intelligence for Digital Agriculture at Scale: Techniques, Policies, and Challenges. arXiv 2020, arXiv:2001.09786. [Google Scholar]
  20. Dickinson, J.L.; Shirk, J.; Bonter, D.; Bonney, R.; Crain, R.L.; Martin, J.; Phillips, T.; Purcell, K. The current state of citizen science as a tool for ecological research and public engagement. Front. Ecol. Environ. 2012, 10, 291–297. [Google Scholar] [CrossRef] [Green Version]
  21. Steinke, J. New Opportunities for Agricultural Extension Services: Mainstreaming Large-Scale Farmer Participation through Modern ICT. Ph.D. Thesis, Humboldt-Universitat zu Berlin, Berlin, Germany, 2019. [Google Scholar]
  22. Lokers, R.; Knapen, R.; Janssen, S.; van Randen, Y.; Jansen, J. Analysis of Big Data technologies for use in agro-environmental science. Environ. Model. Softw. 2016, 84, 494–504. [Google Scholar] [CrossRef] [Green Version]
  23. Matheson, C.A. iNaturalist. Ref. Rev. 2014, 28, 36–38. [Google Scholar]
  24. Ochieng, H.O.; Ojiem, J.; Otieno, J. Farmer Versus Researcher Data Collection Methodologies: Understanding Variations and Associated Trade-Offs; AfricArxiv ncw8a; Center for Open Science: Charlottesville, VA, USA, 2019. [Google Scholar]
  25. Marshall, M.; Crommelinck, S.; Kohli, D.; Perger, C.; Yang, M.Y.; Ghosh, A.; Fritz, S.; de Bie, K.; Nelson, A. Crowd-Driven and Automated Mapping of Field Boundaries in Highly Fragmented Agricultural Landscapes of Ethiopia with Very High Spatial Resolution Imagery. Remote Sens. 2019, 11, 2082. [Google Scholar] [CrossRef] [Green Version]
  26. Koskinen, J.; Leinonen, U.; Vollrath, A.; Ortmann, A.; Lindquist, E.; d’Annunzio, R.; Pekkarinen, A.; Kayhko, N. Participatory mapping of forest plantations with Open Foris and Google Earth Engine. Isprs J. Photogramm. Remote Sens. 2019, 148, 63–74. [Google Scholar] [CrossRef]
  27. Posadas, B.B. A Survey of Low-Cost Precision Agricultural Technologies; 2017; Unpublished Manuscript. [Google Scholar]
  28. Ferrandez-Pastor, F.J.; Garcia-Chamizo, J.M.; Nieto-Hidalgo, M.; Mora-Martinez, J. Precision Agriculture Design Method Using a Distributed Computing Architecture on Internet of Things Context. Sensors 2018, 18, 1731. [Google Scholar] [CrossRef] [Green Version]
  29. Lindblom, J.; Lundstrom, C.; Ljung, M.; Jonsson, A. Promoting sustainable intensification in precision agriculture: Review of decision support systems development and strategies. Precis. Agric. 2017, 18, 309–331. [Google Scholar] [CrossRef] [Green Version]
  30. Zaks, D.P.M.; Kucharik, C.J. Data and monitoring needs for a more ecological agriculture. Environ. Res. Lett. 2011, 6, 014017. [Google Scholar] [CrossRef]
  31. Mirshekari, B. Marigold (Calendula officinalis) yield as affected by lamb’s-quarters (Chenopodium album) competition. Int. J. Plant Prod. 2013, 7, 659–664. [Google Scholar]
  32. Weaver, S. Impact of lamb’s-quarters, common ragweed and green foxtail on yield of corn and soybean in Ontario. Can. J. Plant Sci. 2001, 81, 821–828. [Google Scholar] [CrossRef]
  33. Medve, R.J.; Medve, M.L. Edible Wild Plants of Pennsylvania and Neighboring States; Penn State Press: University Park, PA, USA, 2010. [Google Scholar]
  34. Benoliel, D. Northwest Foraging: The Classic Guide to Edible Plants of the Pacific Northwest; Skipstone: Griffin, CA, USA, 2011. [Google Scholar]
  35. Elias, T.S.; Dykeman, P.A. Edible Wild Plants: A North American Field Guide to Over 200 Natural Foods; Sterling Publishing Company, Inc.: New York, NY, USA, 2009. [Google Scholar]
  36. Of Agriculture Natural Resources Conservation Service, U.S.D. Chenopodium album L. lambsquarters. Available online: https://plants.usda.gov/core/profile?symbol=chal7 (accessed on 22 January 2020).
  37. On-Line Database, I.T.I.S. Chenopodium album var. album L. Available online: https://www.itis.gov/servlet/SingleRpt/SingleRpt?search_topic=TSN&search_value=531163#null (accessed on 22 January 2020).
  38. Šerá, B.; Šerý, M.; Štrañák, V.; Špatenka, P. Does cold plasma affect breaking dormancy and seed germination? A study on seeds of Lamb’s Quarters (Chenopodium album agg.). Plasma Sci. Technol. 2009, 11, 750. [Google Scholar] [CrossRef]
  39. Šerá, B.; Novák, F. The effect of humic substances on germination and early growth of Lamb’s Quarters (Chenopodium album agg.). Biologia 2011, 66, 470. [Google Scholar] [CrossRef]
  40. Ullah, M.; Khan, M.U.; Mahmood, A.; Malik, R.N.; Hussain, M.; Wazir, S.M.; Daud, M.; Shinwari, Z.K. An ethnobotanical survey of indigenous medicinal plants in Wana district south Waziristan agency, Pakistan. J. Ethnopharmacol. 2013, 150, 918–924. [Google Scholar] [CrossRef] [PubMed]
  41. Yadav, N.; Vasudeva, N.; Singh, S.; Sharma, S.K. Medicinal properties of genus Chenopodium Linn. Indian J. Nat. Prod. Resour. 2007, 6, 131–134. [Google Scholar]
  42. Poonia, A.; Upadhayay, A. Chenopodium album Linn: Review of nutritive value and biological properties. J. Food Sci. Technol. 2015, 52, 3977–3985. [Google Scholar] [CrossRef] [Green Version]
  43. U.S. Department of Agriculture. Lambsquarters, Raw. Available online: https://fdc.nal.usda.gov/fdc-app.html#/food-details/169244/nutrients (accessed on 22 January 2020).
  44. Sree, M.D.; Joshna, A.; Lakshmi, S.M.; Kumar, D.S. A review on South Indian edible leafy vegetables. J. Glob. Trends Pharm. Sci. 2013, 4, 1248–1256. [Google Scholar]
  45. Grivetti, L.E.; Ogle, B.M. Value of traditional foods in meeting macro-and micronutrient needs: The wild plant connection. Nutr. Res. Rev. 2000, 13, 31–46. [Google Scholar] [CrossRef] [PubMed] [Green Version]
  46. Bandyopadhyay, S.; Mukherjee, S.K. Wild Edible Plants of Koch Bihar District, West Bengal; NISCAIR: New Delhi, India, 2009. [Google Scholar]
  47. Koca, I.; Hasbay, I.; Bostanci, S.; Yilmaz, V.A.; Koca, A.F. Some wild edible plants and their dietary fiber contents. Pak. J. Nutr. 2015, 14, 188. [Google Scholar] [CrossRef] [Green Version]
  48. Vision, Mission, Goals. Available online: https://www.udc.edu/causes/causes/vision-mission-goals-causes/ (accessed on 5 February 2021).
  49. Posadas, B.; Hanumappa, M.; Gilbert, J.E. Opinions Concerning Crowdsourcing Applications in Agriculture in D.C. In Proceedings of the VIII Latin American Conference on Human–Computer Interaction, Panama City, Panama, 30 September–4 October 2019. [Google Scholar]
  50. Posadas, B.B.; Hanumappa, M.; Gilbert, J.E. Early Development and Design of Crowdsourcing Agriculture Mobile Application for Lambsquarters. Clei Electron. J. 2020, 23. [Google Scholar] [CrossRef]
  51. Jokela, T.; Iivari, N.; Matero, J.; Karukka, M. The standard of user-centered design and the standard definition of usability: Analyzing ISO 13407 against ISO 9241-11. In Proceedings of the Latin American Conference on Human–Computer Interaction, Rio de Janeiro, Brazil, 17–20 November 2003; pp. 53–60. [Google Scholar]
  52. Center for Urban Agriculture & Gardening Education. 2017. Available online: https://www.udc.edu/causes/land-grant/center-for-urban-agriculture-gardening-education/ (accessed on 24 January 2020).
  53. Turner, C.W.; Lewis, J.R.; Nielsen, J. Determining usability test sample size. Int. Encycl. Ergon. Hum. Factors 2006, 3, 3084–3088. [Google Scholar]
  54. Harding, J. Qualitative Data Analysis from Start to Finish; Sage: Newbury Park, CA, USA, 2013. [Google Scholar]
  55. Welcome to UDC. 2019. Available online: https://www.udc.edu/about/history-mission/ (accessed on 3 January 2020).
  56. Master Gardener Program. 2019. Available online: https://www.udc.edu/causes/land-grant/center-for-urban-agriculture-gardening-education/master-gardener-program/ (accessed on 3 January 2020).
  57. Bangor, A.; Kortum, P.T.; Miller, J.T. An empirical evaluation of the system usability scale. Intl. J. Hum. Comput. Interact. 2008, 24, 574–594. [Google Scholar] [CrossRef]
  58. Bangor, A.; Kortum, P.; Miller, J. Determining what individual SUS scores mean: Adding an adjective rating scale. J. Usability Stud. 2009, 4, 114–123. [Google Scholar]
  59. SPSS—Kendall’s Concordance Coefficient W. Available online: https://www.spss-tutorials.com/spss-kendalls-concordance-coefficient-w/ (accessed on 3 January 2020).
  60. Schmidt, R.C. Managing Delphi surveys using nonparametric statistical techniques. Decis. Sci. 1997, 28, 763–774. [Google Scholar] [CrossRef]
  61. Kendall’s Tau-b Using SPSS Statistics. 2018. Available online: https://statistics.laerd.com/spss-tutorials/kendalls-tau-b-using-spss-statistics.php (accessed on 3 January 2020).
  62. Neighborhood Planning. Available online: https://planning.dc.gov/page/neighborhood-planning-01 (accessed on 3 January 2020).
  63. Identifying Lamb’s Quarters. Available online: https://www.fourseasonforaging.com/blog/2017/7/2/identifying-lambs-quarters (accessed on 5 July 2017).
  64. Sauro, J. Why You Only Need to Test with Five Users (Explained). Available online: https://measuringu.com/five-users/ (accessed on 8 March 2010).
  65. Herrmann, I.; Shapira, U.; Kinast, S.; Karnieli, A.; Bonfil, D. Ground-level hyperspectral imagery for detecting weeds in wheat fields. Precis. Agric. 2013, 14, 637–659. [Google Scholar] [CrossRef]
Figure 1. Flow chart of the precision agricultural process, including researchers implementing the PA process in an apple orchard in Gunwi, Republic of Korea, 16 July 2015. Courtesy of Brianna Posadas.
Agronomy 11 01951 g001
Figure 2. Young lambsquarters found around the UDC campus. Courtesy of Brianna Posadas.
Agronomy 11 01951 g002
Figure 3. The process for human-centered design from Jokela et al. [51].
Agronomy 11 01951 g003
Figure 4. Log in screen for Mission LQ.
Agronomy 11 01951 g004
Figure 5. First screen after login from the second design iteration for the iPhone version of Mission LQ.
Agronomy 11 01951 g005
Figure 6. Data submission form for the second design iteration for the iPhone version of Mission LQ.
Agronomy 11 01951 g006
Figure 7. Google Map of correctly identified lambsquarters as submitted through Mission LQ.
Agronomy 11 01951 g007
Figure 8. Map of the 8 wards of Washington, DC, USA.
Agronomy 11 01951 g008
Figure 9. Median SUS scores by phone type for the first design iteration of Mission LQ.
Agronomy 11 01951 g009
Figure 10. Median SUS scores by phone type for the second design iteration of Mission LQ.
Agronomy 11 01951 g010
Figure 11. Examples of correctly identified lambsquarters as submitted by users from the DMV, 1 September 2019. Courtesy of Brianna Posadas.
Agronomy 11 01951 g011
Figure 12. Examples of plants erroneously identified as lambsquarters by users from the DMV, 1 September 2019. Courtesy of Brianna Posadas.
Agronomy 11 01951 g012
Figure 13. Lambsquarters map resulting from Mission LQ.
Agronomy 11 01951 g013
Table 1. Dates, locations, and numbers of participants for first design iteration user studies.
DateLocationNumber of Participants
10 August 2019Meridian Hill Park0
17 August 2019National Mall1
24 August 2019Montrose Park0
31 August 2019Rock Creek Park4
1–30 September 2019various locations in the DMV9
Table 2. Dates and numbers of participants for second design iteration user studies at the National Arboretum.
DateLocationNumber of Participants
27 October 2019National Arboretum0
29 October 2019National Arboretum0
31 October 2019National Arboretum0
1 November 2019National Arboretum2
2 November 2019National Arboretum1
3 November 2019National Arboretum0
1 December 2019
29 February 2020various locations in the DMV16
Table 3. Kendall’s W result for lambsquarters classification rate.
AttributeValue
N2
Kendall’s W0.500
Chi-Square24.000
df24
Asymp. Sig0.462
Table 4. Kendall’s tau-b result for lambsquarters classification rate.
AttributeValue
N25
tau-b0.327
p0.109
Publisher’s Note: MDPI stays neutral with regard to jurisdictional claims in published maps and institutional affiliations.

