Article

Top Photoselective Netting in Combination with Reduced Fertigation Results in Multi-Annual Yield Increase in Valencia Oranges (Citrus sinensis)

1
Department of Fruit Tree Sciences, Agricultural Research Organization, The Volcani Institute, Rishon LeZion 7528809, Israel
2
Department of Environmental Physics and Irrigation, Agricultural Research Organization, The Volcani Institute, Rishon LeZion 7528809, Israel
3
The Robert H. Smith Faculty of Agriculture, Food and Environment, The Hebrew University of Jerusalem, Rehovot 76100, Israel
4
PepsiCo International Ltd., Agro Discovery, Beaumont Park, 4 Leycroft Road, Leicester LE4 1ET, UK
5
PepsiCo Inc., 1991 Upper Buford Circle, St. Paul, MN 55108, USA
*
Author to whom correspondence should be addressed.
Agronomy 2021, 11(10), 2034; https://doi.org/10.3390/agronomy11102034
Submission received: 14 September 2021 / Accepted: 5 October 2021 / Published: 11 October 2021
(This article belongs to the Section Innovative Cropping Systems)

Abstract

:
Fruit tree production is challenged by climate change, which is characterized by heat waves, warmer winters, increased storms, and recurrent droughts. The technology of top netting may provide a partial solution, as it alleviates climatic effects by microclimate manipulation. The tree physiological performance is improved under the nets, with an increased productivity and quality. The application of photoselective nets, which also alter the light spectrum, may result in additional horticultural improvements. We present the results of a 5-year experimental study on Valencia oranges, examining three nets: red, pearl, and transparent. Each net was tested at three fertigation conditions: a field standard (100%, I100) and two reduced fertigation regimes, which were 80% (I80) and 60% (I60) of the standard. The average multi-annual yield under the red and pearl nets with I100 and I80 and transparent net with I100 was significantly higher than that of the control trees. While the multi-annual yield increase under the red net I80 was due to the increase in the fruit number, in other treatments, the effect was mostly due to induction in the individual fruit weight. The data presented here show that an increased productivity of orange trees grown under photoselective nets, particularly the red net, with its specific spectral properties, was achieved with a considerable water-saving effect.

1. Introduction

Regional weather instability is a defining characteristic of global climate change and is associated, but not limited to, the following: alterations in winter and summer temperatures, heat waves, increased storm strength and frequencies, and both drought or increased severe weather events. This climatic variance places greater importance on the need to identify methods to protect and maximize crop production. Protected cultivation in closed greenhouses with full or partial climate control provides a useful solution for small-size crops, such as vegetables and ornamentals. However, protecting fruit trees from extreme weather conditions and global warming imposes a significant challenge, not least due to their size. For instance, while unfavorable outcomes of hotter summers and heat waves could be partially mitigated by sufficient irrigation, warmer winters threaten fruit tree productivity; flowering induction in many subtropical trees and dormancy depth and release in deciduous trees are dependent on the accumulation of cold hours [1].
Closed net/screen houses or even top netting without side closure may provide a partial solution for mitigating regional weather effects by isolating and improving the microclimate. Environmental modifications by various netting technologies in a few crops, especially fruit trees, have been summarized in a few recent reviews [2,3,4], with apple being a good model crop due to the relatively wide use of nets in its plantations (reviewed in [5,6]). The effects of netting on the microclimate include: a reduced air velocity, reduced solar radiation, hail protection, canopy temperature adjustment, and increased humidity. As a result, the photosynthetic efficiency is improved and evapotranspiration is reduced, improving water use efficiency (WUE).
Photoselective (colored) nets can provide most, if not all, of the above benefits. Photoselective netting promotes light scattering and spectrum modification [7,8,9]. These radiance adjustments result in morphogenetic responses dependent on the crop, cultivar, and timing of the net application [4,8,10,11].
In citruses, the use of reflective aluminized nets and black nets resulted in canopy temperature reduction, induced stomatal conductance, increases in gas exchange, and reduced photoinhibition, along with an improved WUE [12,13,14,15,16]. Nursery-grown Carizo citrange seedlings covered with a red net exhibited a higher vegetative growth and budding success with enhanced leaf mineral contents compared to seedlings grown without nets, suggesting a stronger root and transport system [17]. Young Valencia trees grown under red, pearl, and yellow nets demonstrated increased vegetative growth and photosynthetic rates compared to un-netted trees, with yellow netting encouraging deeper root systems than all other treatments [18]. Photoselective nets tested in mature orchards of “Ori” and “Nadorcott” mandarins improved photosynthesis, WUE, fruit quality, and yield [19,20,21,22]. In the Ori experiment, trees grown under the red, transparent, and white nets exhibited the highest yield [19].
Generally, the improved WUE under top nets in fruit trees, citrus in particular, was estimated based on physiological parameters, such as sap flow [3,19]. However, to the best of our knowledge, various long-term irrigation rates have not been applied to netted citrus trees demonstrating the effects of reduced irrigation on multiple season productivity. We presumed that an improved productivity, resulting from the use of specific color(s), would not be affected by the reduced irrigation rate. Further, in the Ori experiment, trees grown under the transparent and white nets showed the best multi-annual yield [19]. The red net was also beneficial, but it seemed that the tree yield was somewhat reduced due to an increased vegetative growth. The relatively large canopy volume also resulted in a lower WUE as compared to the white and transparent nets. Therefore, we assumed that the reduced shading effect of the red net would enhance its beneficial effects. Here, we present the results of a study carried out in a commercial Valencia orange grove operated from 2014 to 2018. Three nets were included, which were a customized red with lower shading effect, pearl, and non-photoselective transparent, all previously shown to benefit other fruit trees [23]. Each net was tested at three irrigation regimes: 100%, defined as the standard commercial irrigation, and two reduced rates, which were 80% and 60% of the standard. Fertilization, provided by irrigation, was reduced proportionally. The multi-annual yield results revealed that trees under nets performed better than standard irrigated un-netted trees. Among the different netting types, the combination of red nets and a 20% reduced fertigation regime resulted in the highest number of fruits per tree on a multi-annual basis.

2. Materials and Methods

2.1. Study Site and Experimental Design

The study was performed in a 25-year old commercial orchard of Valencia oranges (Citrus sinensis L. Osbeck “Valencia”) grafted on Sour orange (Citrus aurantium, L.) rootstock located in southern Israel (31032′46.7″N34036′59.9″E). Tree spacing was 4 × 6 m both in and between rows, with 19 trees per row for 63 rows oriented east to west, with a total area of approximately 3 hectares. The study was designed as a split plot experiment of different types of nets replicated across years, based on a 4 × 3 factorial type design with three types of nets plus one control (no net) and three fertigation regimes (see Figures S1 and S2 for experimental design and plot photos, respectively). The experimental units were arranged into 3 or 4 netting blocks, as follows: control trees (4 blocks), trees covered with red (3 blocks), transparent (4 blocks), or pearl (3 blocks) nets subdivided into 3 fertigation subplots. The design was constrained by the requirement to place the controls at the edges of the experimental unit to avoid net house effect on un-netted trees. Nets were randomly assigned to the remaining whole plots. The three fertigation regimes were randomly assigned within each subplot. The net house design was as a top net with no side closures at a height of 6 m, and was assembled in December 2013. The nets were maintained over the trees for five growth seasons (2014–2018), with data collected over four seasons (2015–2018).
The nets used in the experiment (Ginegar Plastic Products Ltd., Ginegar, Israel) were: (1) transparent—a commercial Crystal Leno net with 12–15% primary shading, (2) pearl—a commercial pearl Leno net with 18–22% primary shading, and (3) red—a custom-made net utilizing both red and transparent filaments with 15–17% primary shading. Each sub-block contained 9 rows, each with 9 or 10 trees, and 3 fertigation treatments with a sample row and an adjacent border row on each side to minimize fertigation border effects. The irrigation system consisted of one line per row drip irrigation with eight pressure-compensated emitters per tree, spaced every 50 cm, each discharging 2.3 L h−1 (Netafim, Hazerim, Israel). The amount of irrigation applied to each treatment was measured and controlled by a Gal Pro DC4 computerized control system (Galcon, Kfar Blum, Israel), according to manufacturer’s instructions. The irrigation volume of each treatment was also monitored and recorded using ECM water meter with electric output (Arad, Kibuz Dalia, Israel). The irrigation levels were as follows: (1) 100% (I100)—defined as the recommended irrigation in the experimental region or “control irrigation” according to a table of values for each 10-day period during the irrigation season. The table was based on 10-day crop factors recommended by the Ministry of Agriculture’s extension service applied to five years of Penman–Monteith reference evapo-transpiration (2005–2009) from Dorot’s meteorological station, located five km south-east of the orchard. The crop factors appear in pamphlets published by the service and are available upon request; (2) 80% (I80)—irrigation reduced by 20% from the control; (3) 60% (I60)—irrigation reduced by 40% from the control. Total annual irrigation, as well as annual rain, is shown in Table S1.

2.2. Spectral Properties of the Nets

Three-by-three meter pieces of the transparent, pearl, and red nets were mounted three meters above the flat roof of a four-story building at the Volcani Institute, Israel, allowing for unobstructed testing. The spectra of the solar radiation in the range of 300 to 1000 nm both under and outside the nets were measured by a LiCor LI-1800 spectroradiometer employing a light diffuser of 4 cm diameter above the 300 µm fiber optics, as described [24]. In brief, the light diffuser was oriented parallel to the sunbeam and an opaque disc was held 40–50 cm above the sensor to measure the scattered light. Recordings were performed on clear days at noon. The percentage of shading and scattering inflicted by the nets were calculated from spectrum measured in the wavelength between 300 and 850 nm. Five measurements were averaged per treatment.

2.3. Fertilization

Fertilization was provided based on leaf mineral analysis, performed in mid-October of every year Table S1), as the following (for I100): during April and May, a total of 52.5 Kg/Ha of N (as ammonium sulfate) were provided through the irrigation system. During June to August, application of 2230 L/Ha (2720 Kg/Ha) of 9-4-8 Tov Fertilizer (ICL, Haifa, Israel), containing 9% N (as 4.5% NH2, 2.3% NH4 and 2.3% NO3), 8% Kg/Ha K (as K2O), and 4% P (as P2O5) were provided through the irrigation system. In addition, a single foliar spray in 1.5% of Alvamid (ICL, Haifa, Israel) containing 46% N, as CO(NH2)2, was provided in March to all treatments. As no micronutrient deficiencies were visualized in the trees during the entire experimental period, they were not applied. At the reduced irrigation rates, the fertilization was kept proportional.

2.4. Soil Particle Analysis

Soil particle analyses were measured at three depths: 0–30 cm, 30–60 cm, and 60–90 cm, in 14 locations across the experimental area, as described [25]. The general soil type classification was a sandy clay loam (Table S2).

2.5. Sampling

Three trees per experimental combination were sampled in 2015 and increased to five trees for the remaining years of the experiment. The same trees were sampled each year from the middle row of each experimental combination sub-block. Fruit yield was weighed and counted per tree. In addition, a sub-sample of ~200 fruits from each tree was used to measure fruit diameter.

2.6. Leaf Mineral Analysis

Fruit leaves were collected in mid-October, rinsed in deionized water, dried at 65 °C, and ground into fine powder, followed by digestion with sulfuric acid and hydrogen peroxide, as described [26]. N and P levels were determined using chemical analyzer (Gallery Plus, Thermo Scientific, Vaata, Finland), whereas K levels were determined using atomic absorption flame photometer (Corning, New York, NY, USA). For Ca and Mg, 100 mg of ground dry leaves were wet digested with HClO4-HNO3, followed by analysis in an atomic absorption spectrophotometer (AAnalysit 800, Perkin Elmer, Waltham, MA, USA), as described [27].

2.7. Water Use Efficiency (WUE)

WUE was calculated by dividing yield (Kg/tree) by fertigation regime. Since the interaction between fertigation and netting was statistically significant in two factorial ANOVA test, the variance level was compared by Tukey–Kramer test.

2.8. Statistics

Statistical analyses were conducted in R version 4.0.2 [28]. Figures were produced using the packages ggplot2 [29,30] and YaRrr [31]. Pirate plots were constructed to show all data points, mean, density, and 95% highest density intervals (HDI) [31]. The mosaic plot was constructed with hsv residual shading (Zeileis et al., 2007) using the R packages vcd [32,33] and vcdExtra [34]. Marginal means and compact letter displays based on the Tukey–Kramer test (p < 0.05) were estimated using the emmeans package [35]. Significance is reported as p < 0.05 unless otherwise stated. Effect size of the differences between experimental groups and the control group (control 100% fertigation) was analyzed for all years combined and individual years using a pooled standard deviation, as described [36]. A pooled standard deviation was used to account for some of the heterogeneity of variances between treatment groups. Classification of the relative size follows the procedure, as described [37].

3. Results

3.1. Spectral Properties of the Nets

The net house was constructed in December 2013 in a mature Valencia orange orchard. Trees were acclimatized to the nets following installation until flowering in April 2014. Yield data from the 2014 season were not included in order to avoid partial season and confounding effects due to the net house construction. The experiment included three treatments of nets (red, pearl, and transparent) and control, un-netted, trees in randomized blocks. The spectral properties of the nets are presented in Figure 1 and Table 1.
The nets’ shading varied (in increasing order) for the transparent, red, and pearl nets between 13–20% of the photosynthetically active radiation (PAR) (Figure 1A,C). Light scattering, which varied between ~18 to 24%, was highest for the transparent net, followed by the red net, and then the pearl net. The red net exhibited an induced transmittance between 300–350 nm; above 600 nm, its transmittance was similar to that of the transparent net.

3.2. The Effect of Reduced Fertigation on Leaf Mineral Content

In order to assess the water-saving effect of the netting, all treatments were further divided into three irrigation regimes: 100%, defined as the standard irrigation rate for the area of the experiment (I100), and two reduced rates, which were 80% (I80) and 60% (I60) irrigation. Fertilization, applied through the irrigation system, was proportional to the provided water, while foliar sprays were similar in all treatments. Therefore, reduced irrigation is referred to as reduced fertigation. To assess if the leaf mineral content was affected by the netting and/or the reduced fertigation, leaf minerals were analyzed during the fall of the experimental year. Leaf mineral analyses (LMA), performed during fall 2014, showed that macro-elements were usually below the optimum (Table S3); however, following fertilization, values reached optimal values, as evident by the LMA performed during the fall of every experimental year. Across all fertigation and netting treatments, the LMA identified that the macronutrients content did not vary significantly (Figure S3 showing N, P, and K contents in 2017, as an example).

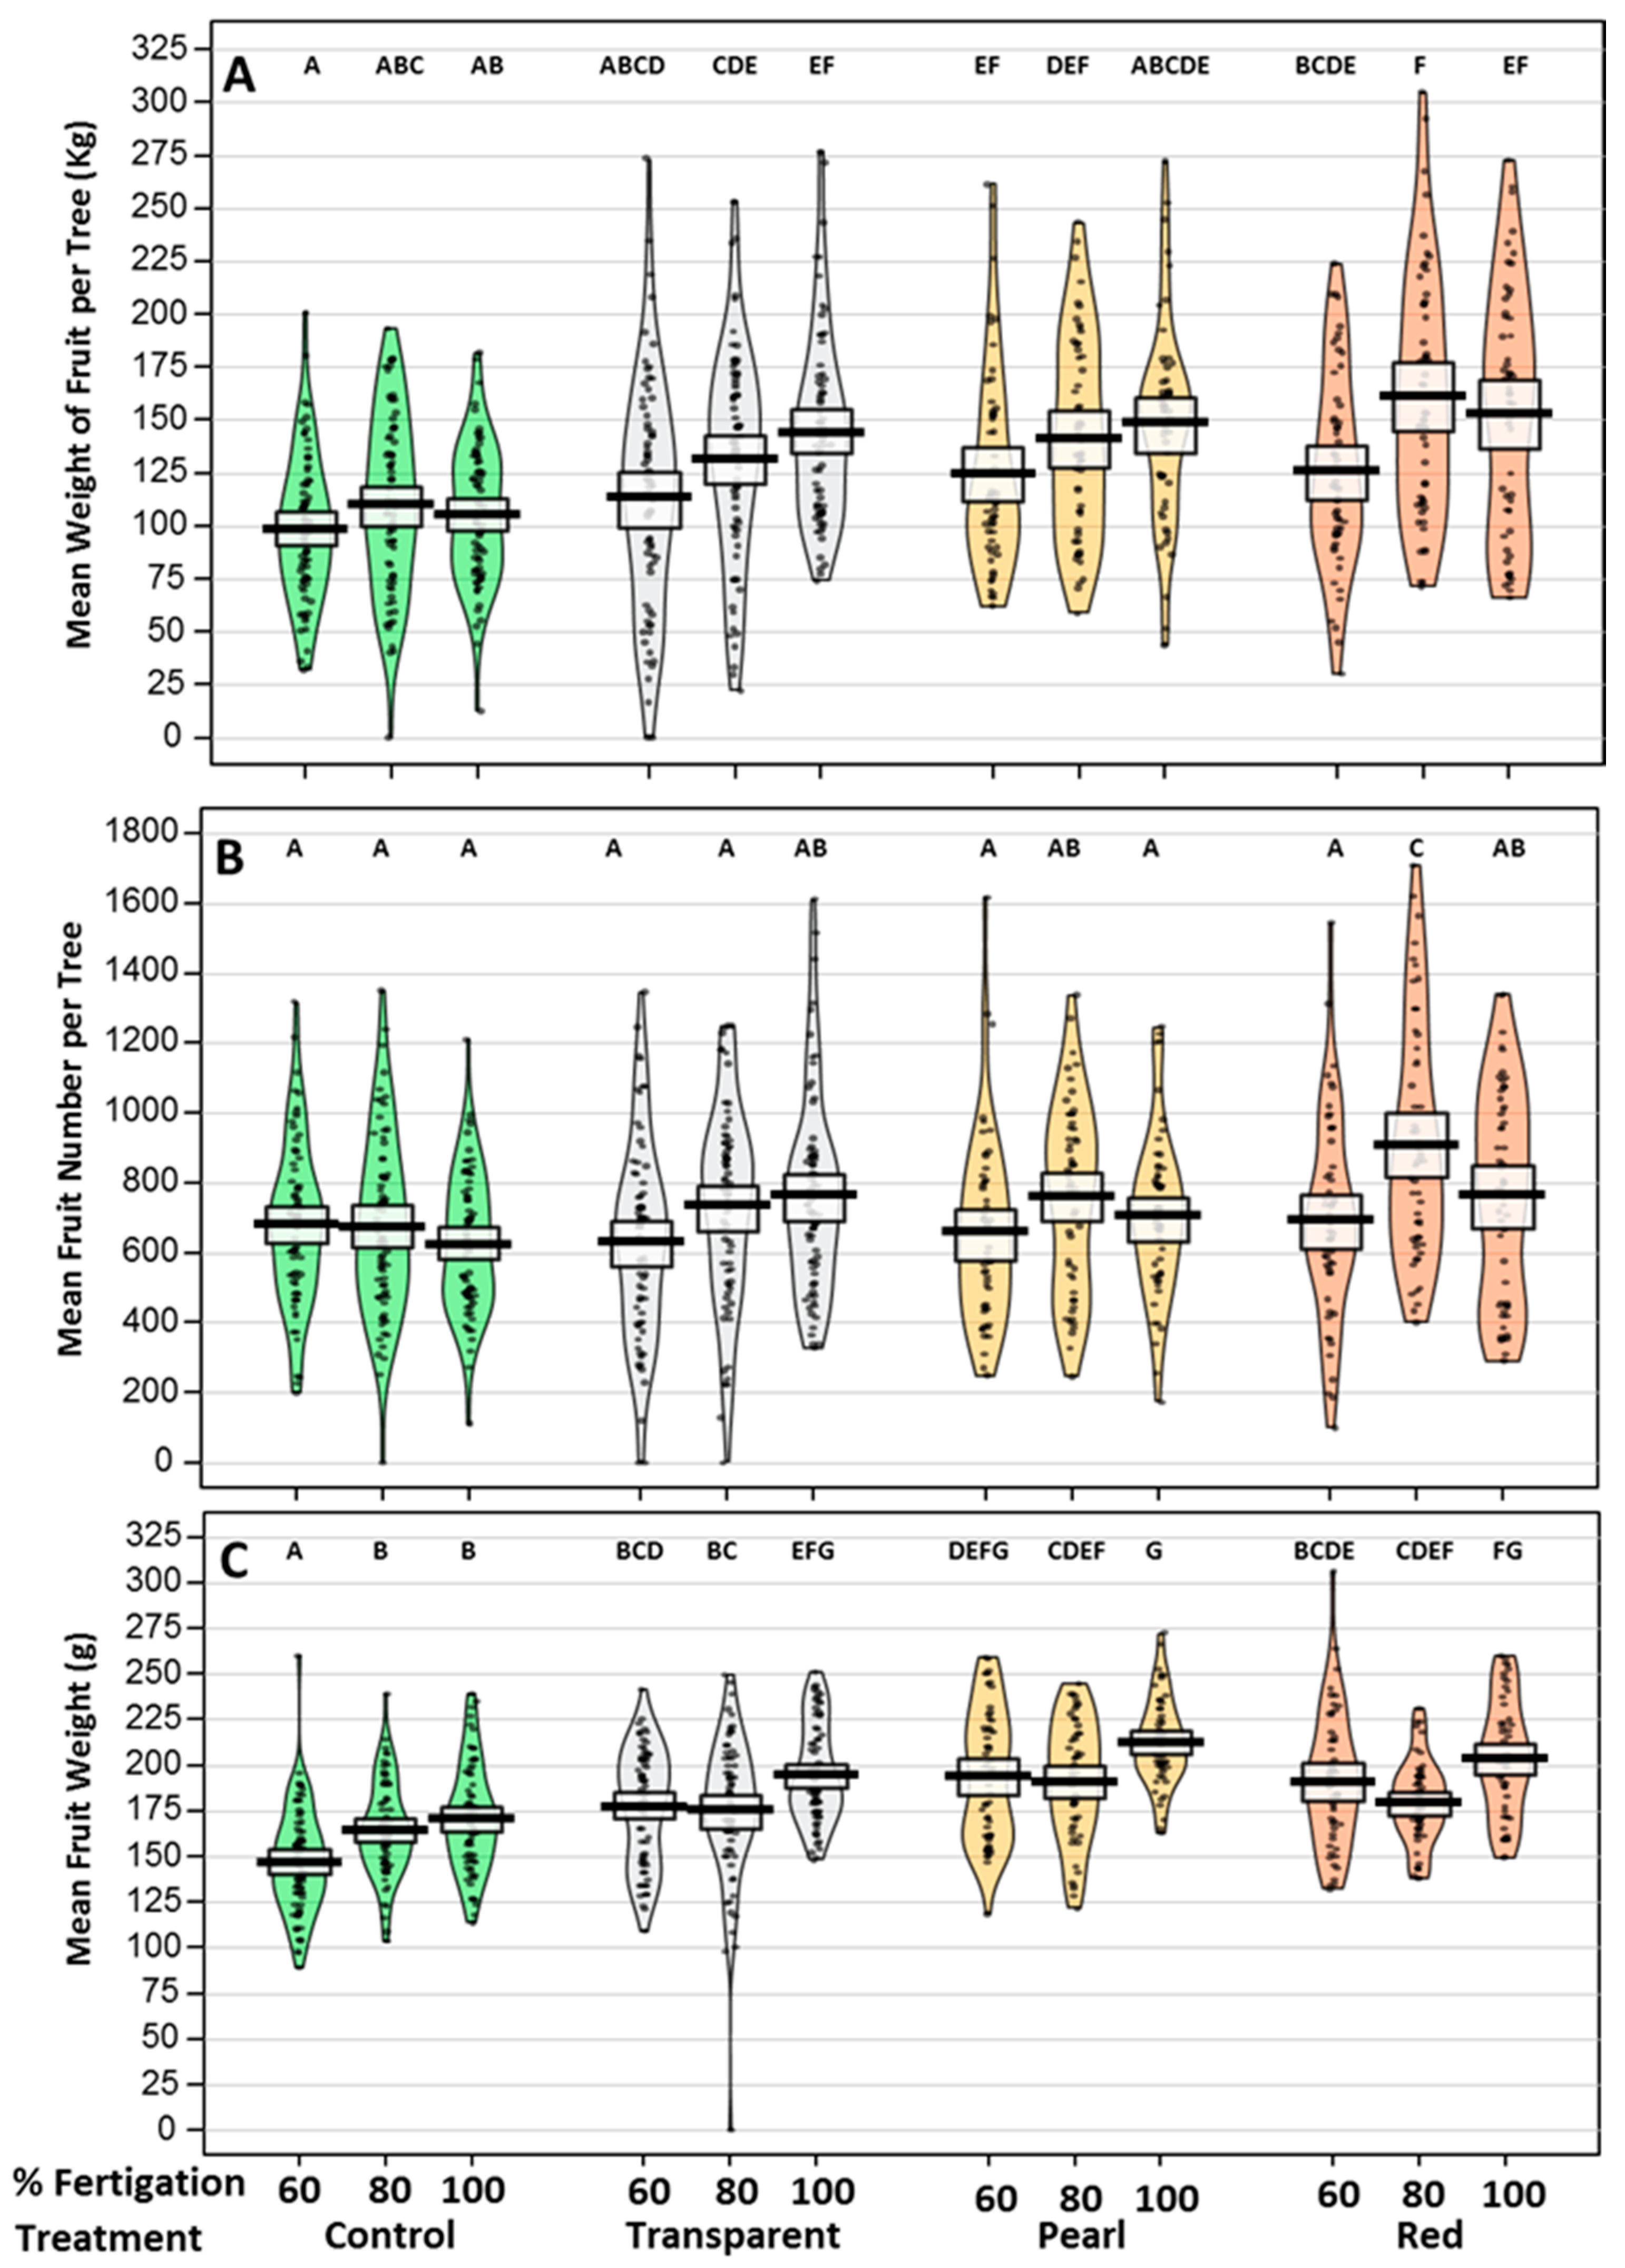
3.3. Yield Components in All Treatments

The average multi-annual (2015–2018) yield components (kg/tree, fruit number per tree, and individual fruit weight), including fertigation treatments, are shown in Figure 2 and Figure 3, respectively. Regardless of the fertigation regime, the red, pearl, and transparent nets resulted in an increased yield (Kg/tree) of 41%, 32%, and 25%, respectively, as compared to the control trees (Figure 2A). On average across all years, trees under the red net had a higher yield than from trees under the transparent net, but not from trees under the pearl net (Figure 2A). Figure 3A shows yield data of all twelve net fertigation combinations, and the averages for individual years is shown in File S1. The yield from the control trees did not differ between the three fertigation regimes (the boundaries of the 95% HDI overlapped). However, under the transparent and pearl net, the I60 resulted in lower yields on average when compared to the I100 treatments, whereas, under the red net, it was significantly lower than I80 and I100. In addition, under all nets, there was no significant difference in the yield between I80 and I100, inferring that fertigation can be reduced by 20% under the nets with no obvious yield loss. The yield distribution around the mean did not show a clear trend among the various treatments.
Irrespective of the fertigation treatment, only the red net resulted in a significant increase, which was of approximately 20%, in the fruit number, as compared to the control trees (Figure 2B). When comparing the twelve treatment combinations (Figure 3B), the control trees did not show any significant differences under any of the three fertigation regimes. The transparent netting with increasing fertigation resulted in a gradual increase in the fruit number, with I100 significantly different than I60. For both red and pearl nets, the fruit number in I80 trended the highest, but was only significant under the red net. Similarly to the yield by weight, fruit number distributions around the mean did not demonstrate a clear trend among the various treatments.
Netting effects on individual fruit weight, regardless of fertigation, showed that, under the pearl, red, and transparent nets, the fruit weight was increased by 24%, 19%, and 14%, respectively, as compared to the control trees (Figure 2C). Figure 3C shows all treatments, with individual year data shown in File S1. Within net types, the fruit weight did not differ between the red and pearl nets, but both nets trended higher than the transparent net. The increase in fruit weight with higher rates of fertigation was evident for the control trees (Figure 3C). In contrast, under all nets, only I100 resulted in an increased fruit weight, but there were no differences between I60 and I80. Under the red net, I80 resulted in a lower fruit weight. Fruit weight distributions around the mean did not show a clear trend among the various treatments.

3.4. Yield Components in Agronomically Relevant Treatments

Estimated yields associated with I60 regimens were frequently lower compared to other fertigation regimes between years (Figure 3 and File S1). These yield losses would be considered unacceptable by growers and, consequently, not implemented. Most interestingly, the I80 resulted in overall similar yields to that of I100 under all nets, and may provide a new fertigation standard with a 20% water-saving effect. Although Tukey–Kramer tests were performed on all treatment combinations (File S1), the I60 fertigation regime and I100 under the nets were omitted from all following comparisons. Therefore, we report the sub-analysis on the main treatments of interest: the control I100, control I80, transparent I80, pearl I80, and red I80 for the yield, fruit number, and fruit weight for individual years and for all years combined. Data are presented in Table 2, while, in Figure 4, percent differences between the control I80, transparent I80, pearl I80, red I80, and control I100 are shown. The average multi-annual yield was highest under the red net I80 and significantly higher than under the transparent net I80 and control trees I100 and I80, but was not significant compared to the pearl net I80 (Table 2). Control trees in both fertigation treatments yielded significantly less than netted ones. The yield under the red net I80 was significantly higher than that of control trees I100 and I80 during 2017 and 2018. During 2015, the pearl I80 displayed the highest yield compared to the control I100. Among all tested treatments, the red net I80 resulted in the highest percent increase in yield during 2017 and 2018, which was 60% and 69%, as compared to the control I100 (Figure 4A). This was also the case for the multi-annual yield, where a 53% increase was recorded for this treatment. The pearl net I80 showed the highest increase, which was 57%, only during 2015.
Comparing the fruit number from the agronomic practices of interest (Table 2) showed that the average multi-annual fruit number under the red net I80 was significantly higher than all other treatments. Among them, the pearl I80 was greater than the control I100, while it was not significant compared to the control I80 and transparent I80. The fruit number under the red net I80 was significantly higher than control trees I100 during 2017 and 2018, but not during 2015 and 2016. In 2015, the pearl net I80 was the only treatment showing a significant increase compared to control trees I100 (Table 2). Among the tested treatments, the red net I80 resulted in the highest percentage increase in fruit number, which was 42% and 51% during 2017 and 2018, respectively, as compared to the control I100 (Figure 4B). The multi-annual percentage increase for this treatment was 45. The pearl net I80 showed the highest increase, which was 53%, only during 2015.
Among the selected treatments, the average multi-annual individual fruit weight of the pearl net I80 was the only one that was significantly higher than control trees I100 and I80 (Table 2). Within individual years, this was also the case in 2017. Throughout the whole experiment (2015–2018), the percentage changes in the average fruit weight under the nets in comparison to the control I100 were relatively moderate (Figure 3C), as compared to the changes in the fruit number and yield (Figure 4A,B). In fact, only the pearl net I80 showed a multi-annual significant increase compared to the control I100 (12%), and this was the case only in 2017 (28%).
The year effect on the yield components, fruit weight per tree, fruit number per tree, and average fruit weight of agronomically relevant treatments is shown in Table S4. For all components, some years showed a significant difference. For instance, in the control I80, the fruit weight and number per tree during 2017 were significantly lower than during 2018. Similar effects were identified while comparing these components between 2017 and 2015. However, no consistent year effect was detected among –all treatments. This was in line with overall stable climatic parameters, maximal and minimal temperatures, and the duration of the rainy season throughout the experimental period (Figure S4). Moreover, growing degree days showed a marginal difference between the years (Table S1). The effect size of the yield data (kg/tree) was analyzed for the agronomically relevant treatments using the control I100 as the standard (Figure S5). Regardless of the relatively small numbers (N) per treatment group in individual years, there seems to be a consistent trend in both the effect size and relative effect size in individual years, which mirrors the trend seen for all years combined.

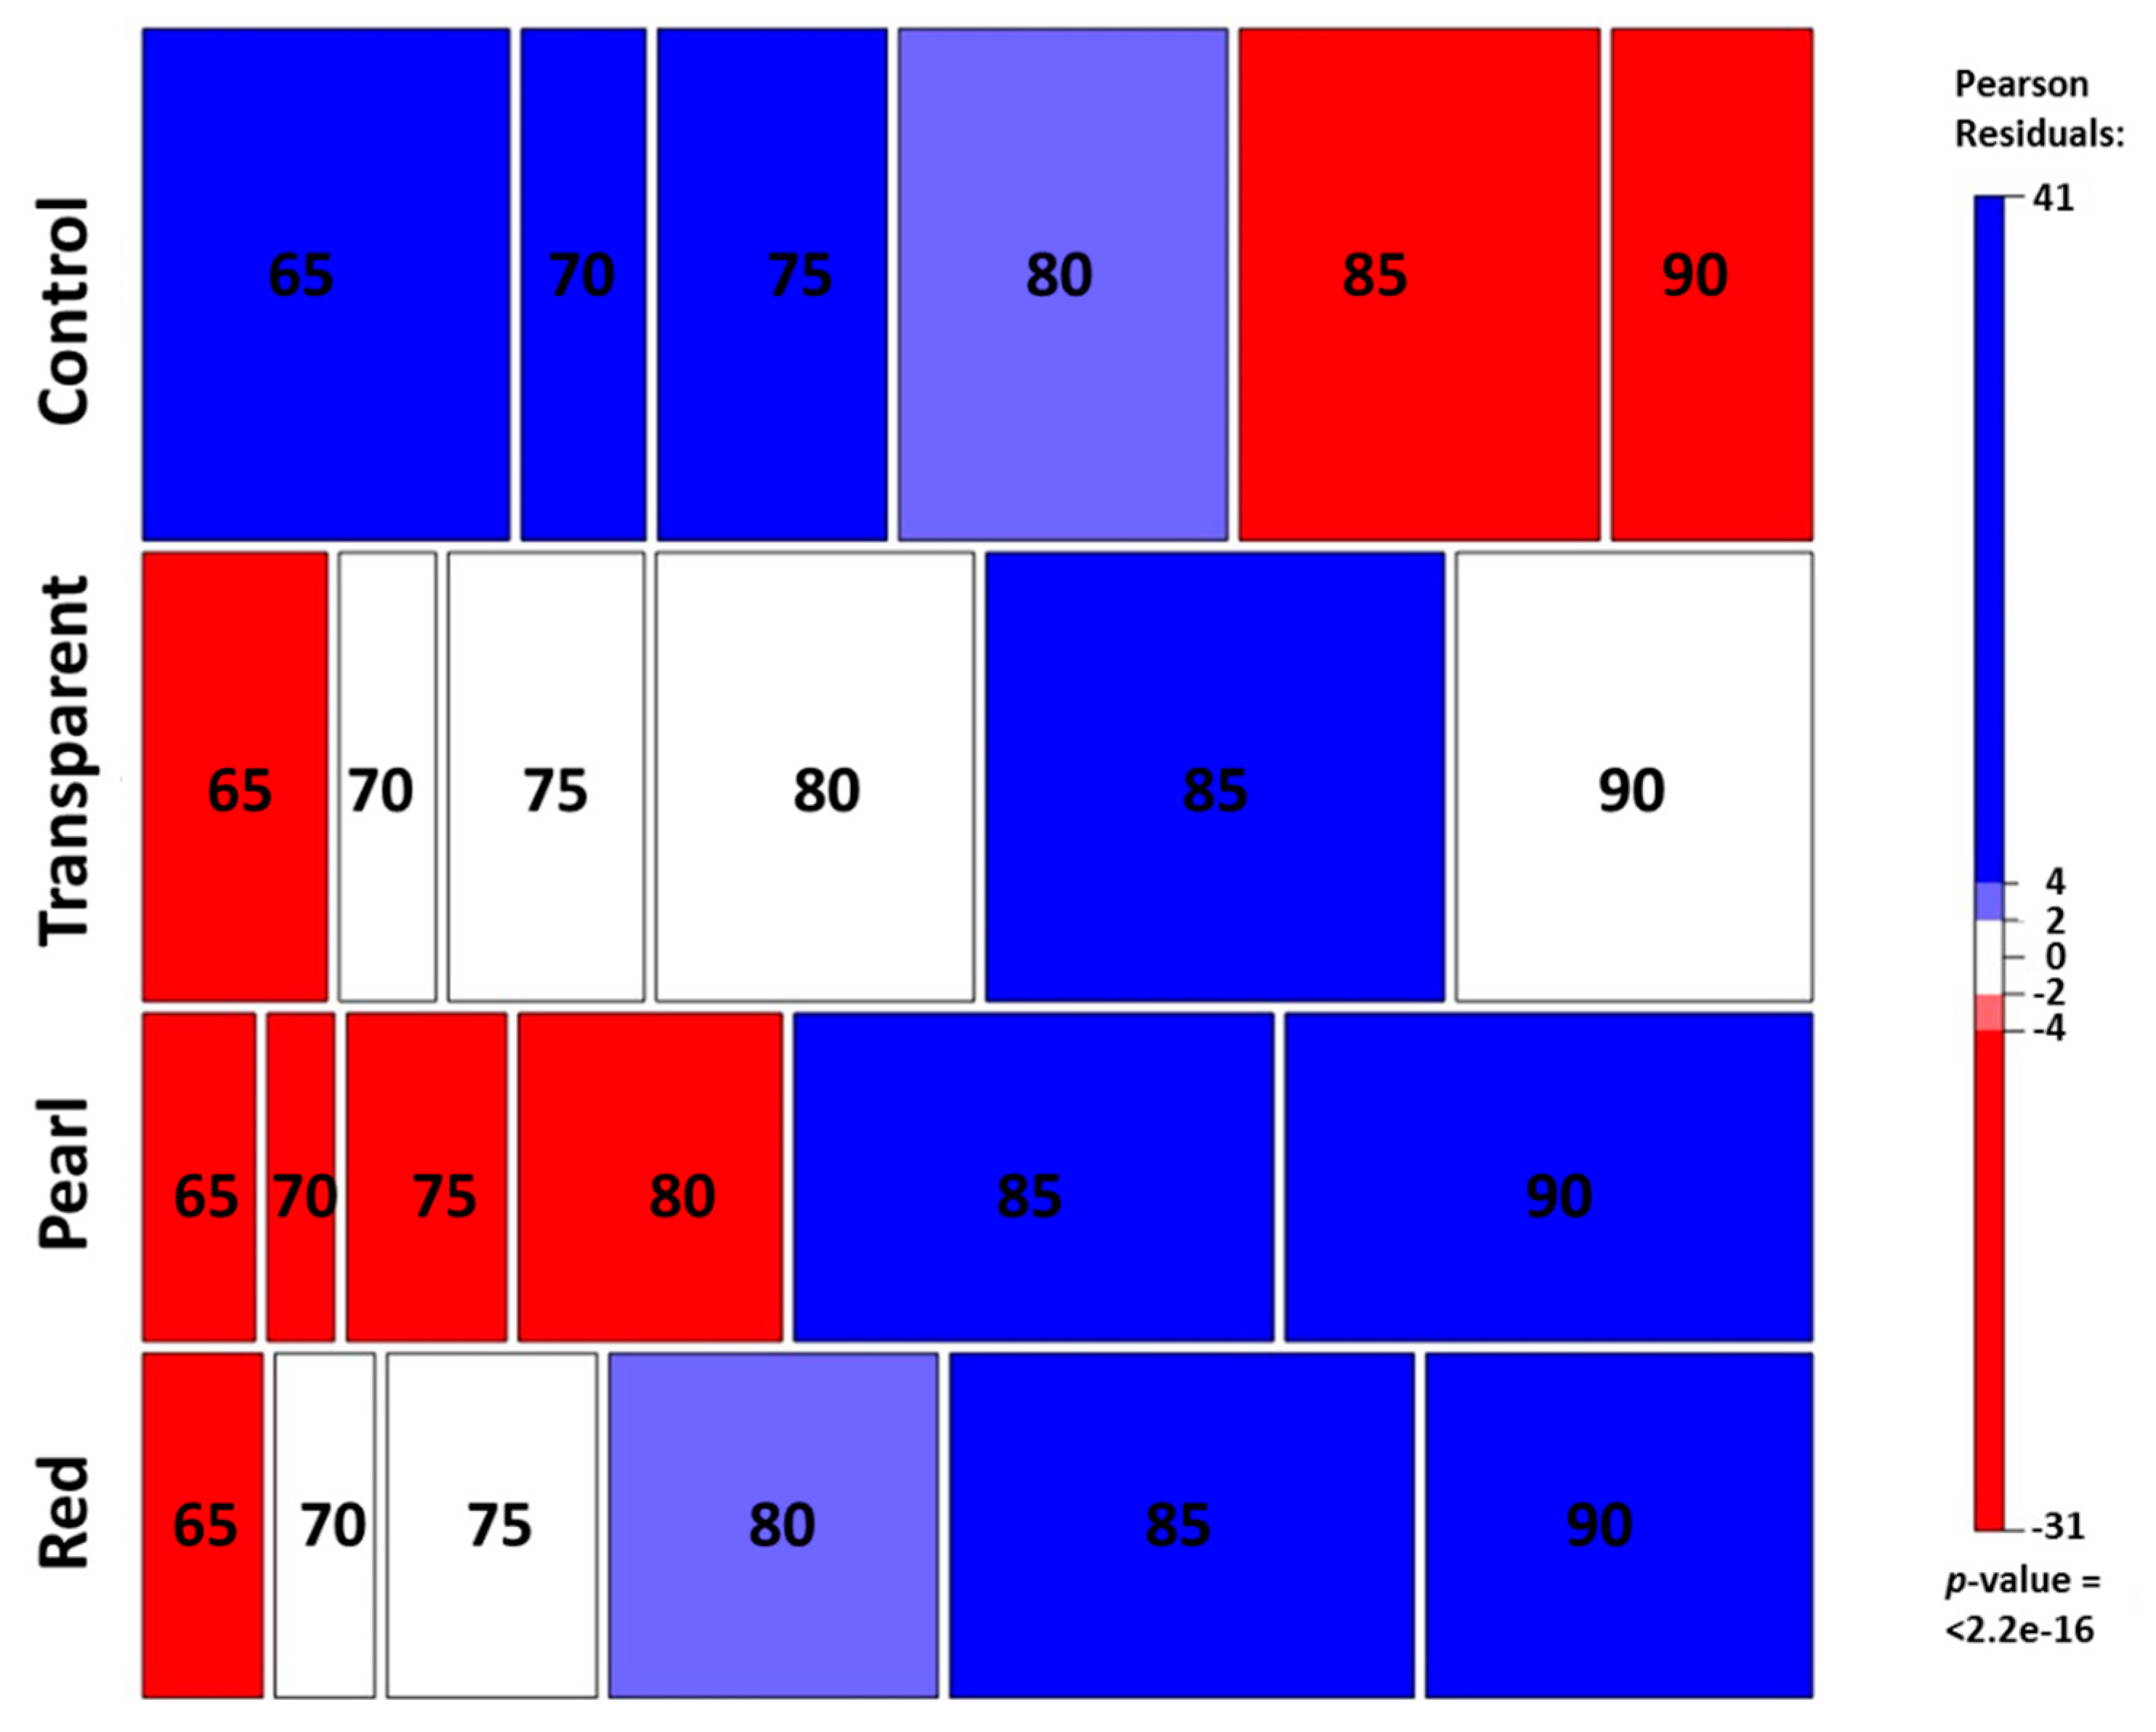
3.5. Netting Effect on Average Fruit Diameter and Fruit Diameter Distribution

Netting effects, regardless of fertigation, showed that under all net types average fruit diameter was higher by 3–8% as compared to control fruits (Figure S6A). Control trees displayed an incremental increase in average fruit diameter with higher fertigation, whereas, under the nets, I100 resulted in larger fruits, although not significantly larger than I80 and I60 (Figure S6B). Fruit diameter distribution around the mean did not show a clear pattern (Figure S6B). For the selected treatments, the pearl net I80 was the only treatment which resulted in multi-annual size increases compared to control trees I80, but not I100 (Table S5). In 2016 and 2017 it resulted in larger fruits than control I80. In 2018, average fruit size under all the nets were significantly larger than that of control trees I100 and I80.
The multi-annual fruit size distribution showing the marginal model of independence for treatment and fruit diameter is shown in Figure 5, in which fertigation, a covariate, is ignored (data of Figure 5 are shown in File S1). The proportion of fruit with a diameter ≥80 mm was 70%, 79%, and 73% for transparent, pearl, and red netted trees, respectively, which is significantly higher than the proportion of fruit from controls trees (55%). The fruit size distribution under the various nettings and fertigation for individual years is shown in Figure S7. The proportion of the smallest fruits (≤65 mm) was the largest in control trees, at 22%, compared to 11, 7, and 7% of transparent, pearl, and red netted fruit trees, respectively.

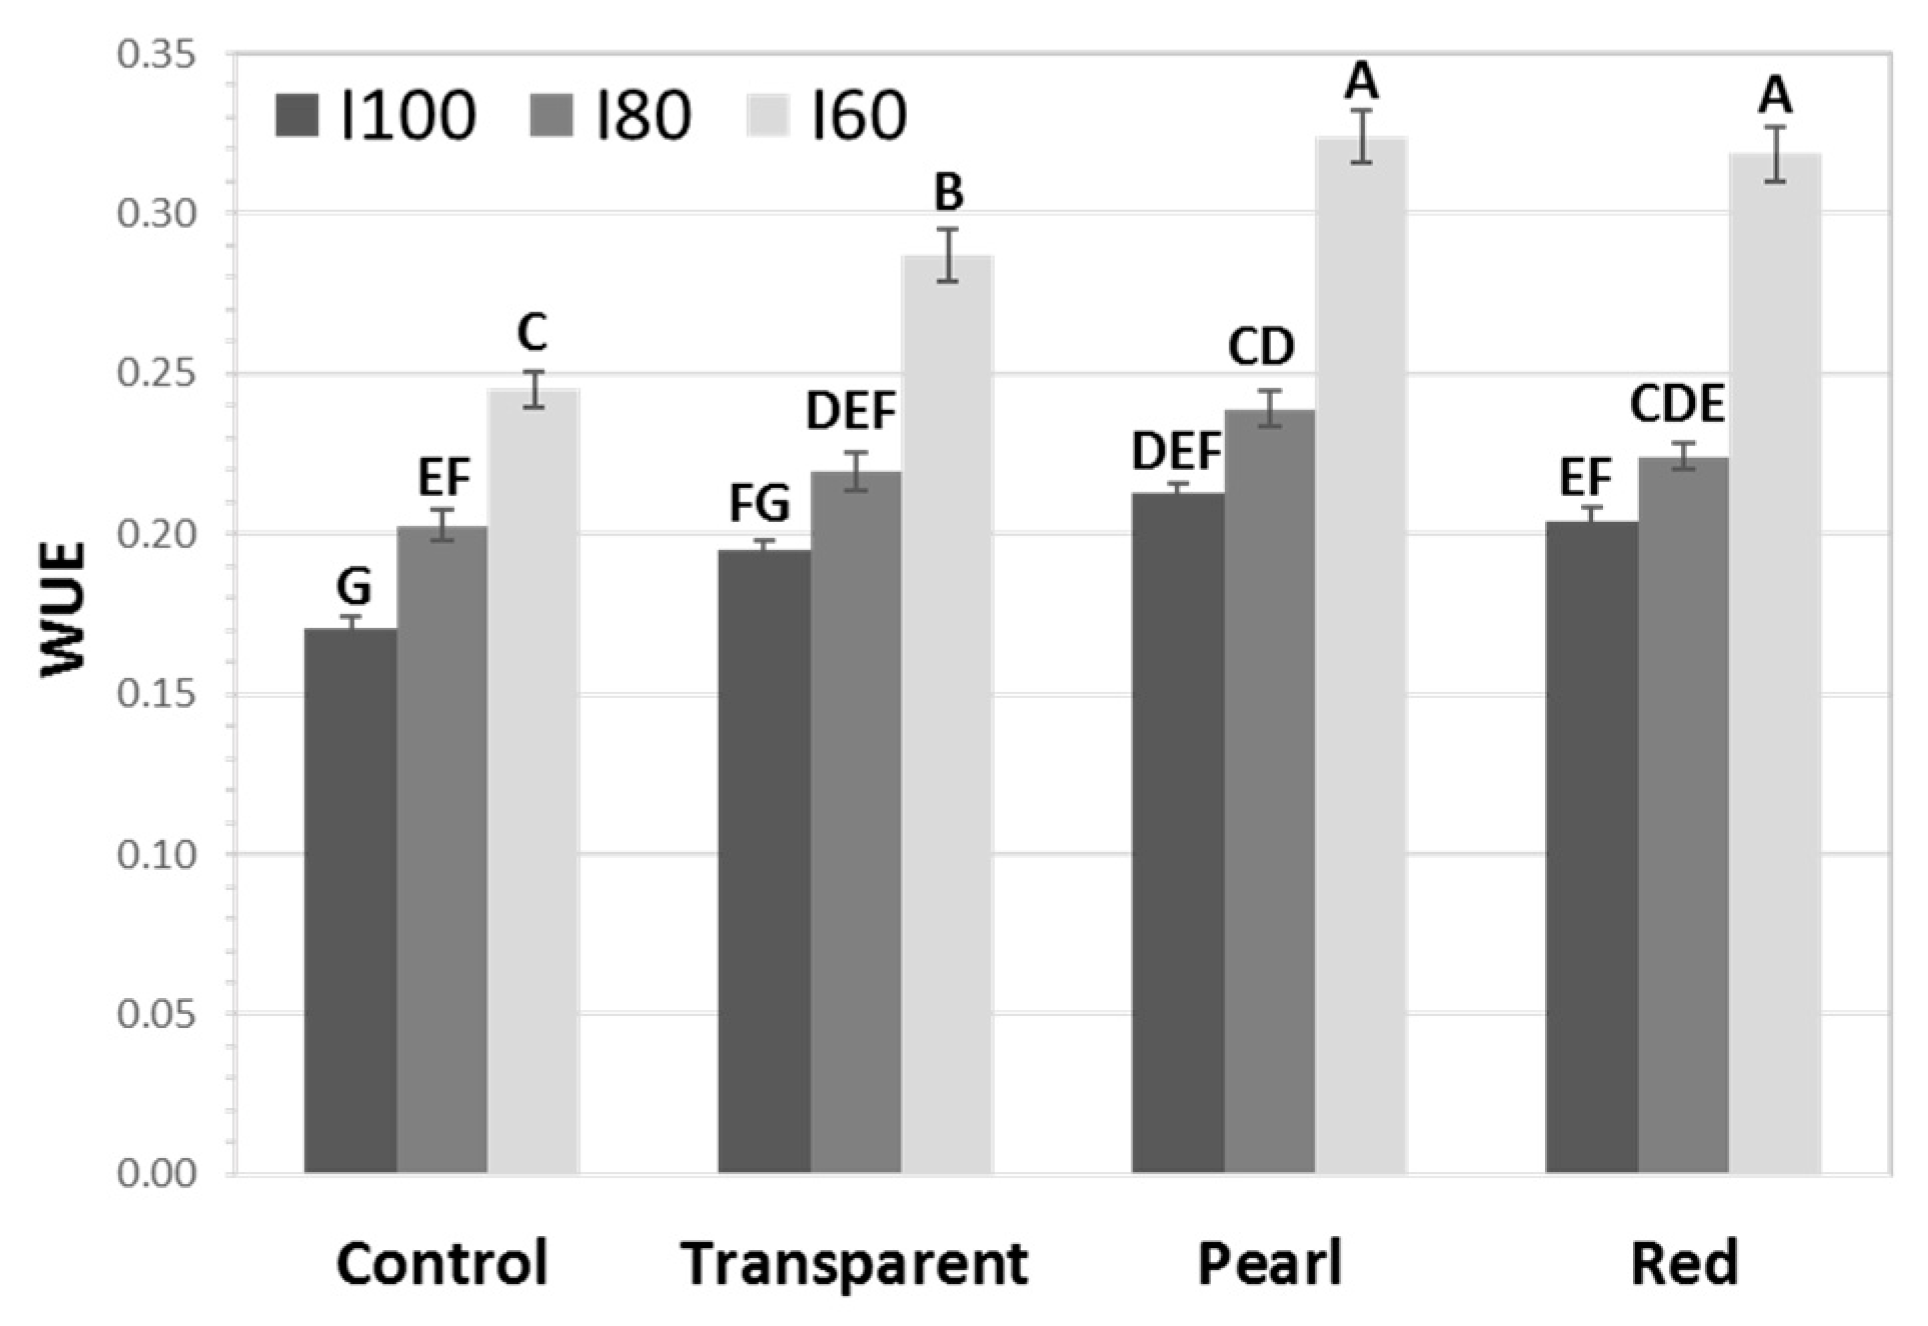
3.6. Netting Effect on Water Use Efficiency (WUE)

For WUE, the interaction between netting and fertigation was significant (p < 0.001). For all netting treatments, I60 displayed the highest WUE values, whereas I100 displayed the lowest values, with I80 showing intermediate WUE values. For all fertigation regimes, the pearl and red nets displayed significantly higher WUE values compared to the control, with an approximately 23%, 15%, and 28% increase for I100, I80, and I60, respectively. The transparent net showed significance to the control only in I100, with a 16% increase in WUE.

4. Discussion

The two major projected effects of global warming in the east Mediterranean area, where this experiment was performed, are induced summer and winter temperatures and a reduced water availability [38]. By microclimate manipulation, the technology of top netting may well alleviate these effects. While the microclimate effects of the technology is described elsewhere [39], here we demonstrate the water-saving effect of the technology, accompanied with an increased multi-annual yield.

4.1. All Nets Resulted in Increased Yield

Previous works reported beneficial effects of top photoselective and other nets in fruit trees and in citruses, including an improved WUE, which was demonstrated by physiological means (reviewed in: [2,3,4]). However, to the best of our knowledge, this work provides the first direct demonstration of the combined effect of both transparent and photoselective top netting with reduced fertigation, in citruses, as recently reported in apples [40]. Moreover, the data presented here allow us to compare compound effects over multiple seasons.
In this study, we found that the tree yield (kg/tree) increased under most netting treatments, as compared to control un-netted trees. This was evident both from the netting effects on the yield, regardless of fertigation (Figure 2A), and by the comparison of all twelve treatments showing that, with the exception of the trees under the transparent net I60, all other netting treatments yielded more than the control trees (Figure 3A). As mentioned earlier, I60 resulted in a reduced yield under all netting treatments, whereas the yield in I80 was not significantly different to I100, demonstrating that 20% water-saving in fertigation is possible by deploying photoselective nets. Considering the reduced yield performance at I60 and the observed benefits of I80 under nets, in order to highlight the commercial relevance, subsequent statistical comparisons were focused on comparing the current industry standard (control I100) to I80 across controls and nets.
The yield increase may arise from an increased individual fruit size/weight and/or higher fruit number. While comparing all twelve treatments, the increase in yield under the nets was primarily due to a higher individual fruit weight/size rather than an increase in fruit number. This is evident from the effect of netting regardless of fertigation on the fruit number versus the fruit weight (Figure 1B,C). Furthermore, comparing the twelve treatments revealed that, for each fertigation regime, each netting treatments resulted in heavier/larger fruit (Figure 1B and Figure S6). However, while comparing the five selected treatments (Table 3), it seemed that the fruit weight contributed to the yield increase under the pearl net I80, whereas the yield increase under the red net I80 was due to an increase in the fruit number and not the fruit weight.
In citruses, as in many plants, there are inverse relationships between the fruit size/weight and fruit number, i.e., the higher the fruit number, the smaller the fruits are [40]. Although these relationships were not analyzed here, the general trend is that, while all nets increased the individual fruit weight/size, they did not reduce the fruit number, when compared to the control trees, providing further support to their beneficial effects. The above data showing that the fruit number was not the major affected factor were supported by previous reports demonstrating that nets’ effects on parameters that alter the fruit number, flowering, fruit set, and fruit survival were not consistent, even for the same species [2,4]. However, in agreement with the results presented here (Figure 3 and Figure 4), it seemed that netting effects on the individual fruit weight/size are more consistent, as shown for apples, where most nets (black, gray, and other colors) increased the fruit weight or size [4].
A significant limitation of the current experiment was related to the experimental design: in order to reduce net house effects on the control trees (such as wind breaking and altered humidity), they were placed outside the construction, at both sides. The use of four-sided control trees was preferable, but it was constrained by the plot size and the desired number of experimental blocks. Bearing in mind these scientific limitations, trees were evaluated prior to experiment installation, and overall, the plot was uniform. The possible water stress of control trees due to an edge effect was resolved by using two border rows at both sides of the plot (Figure S1).

4.2. The Red Net Conferred More Beneficial Effects Than the Pearl and Transparent Nets

Regardless of fertigation, the red net was the only treatment that significantly increased the fruit number, as compared to control trees (Figure 2B). This treatment was also significantly higher compared to other selected treatments (Table 3) and showed greater induction when compared to the control I100 during two experimental years (Figure 4). This suggested that a customized red net, with a transparent filament in one direction, when combined with a 20% water reduction, increased the fruit number without reducing the average fruit weight. Overall, this resulted in a significantly elevated yield vs. control trees and transparent nets. This suggested that this net decouples the inverse relationships between the fruit number and individual fruit weight, in contrast to what has been observed in previous experiments [41,42,43].
What might be the reasons for the beneficial effects of the red net over the other nets? In addition to microclimate mitigation, top netting technology induces shading and light scattering, as well as an alteration of the light spectrum. Shading on its own may have positive effects, especially under high irradiation conditions. It also induces vegetation, which has both positive and negative sides [4,14]. On one hand, in citruses, as in many fruit trees, new vegetation is required for productivity in the following year. However, on the other hand, over-vegetation, induced by relatively high shading, might compete with and suppress fruit production [44]. Indeed, yellow and red nets with 25% shading induced Ori mandarins’ vegetation and reduced the yield when compared to white and transparent nets at 18% and 13% shading, respectively, though all nets increased productivity [19].
In the current study, nets with relatively reduced shading (13–20% shading) were used. Considering the other spectral properties of the nets used here (Figure 1 and Table 1), the nets’ yield benefits could be related to light scattering and/or changes in spectral composition. All nets resulted in light scattering, with the transparent one having the highest scattering effect (Figure 1D). Nevertheless, the beneficial yield effects of the transparent net were less prominent than those of the red one, which resulted in the highest multi-annual yield (both fruit number and kg/tree). This indicates that the spectral alterations imposed by the red net, being highly transmissive between 300–350 nm and above 600 nm, together with its scattering properties, were superior for improving the yield. Whether the increased fruit number under the red net resulted from induced flowering, an improved bud break, change in the proportion between leafless, non-productive inflorescences and leafy, productive ones, flower survival, fruit set, and/or fruit survival, requires further investigation.

4.3. Reduced Fertigation and Induced WUE under the Nets

In all treatments, including the control trees, I80 did not result in a yield loss contrasted against the I100, and only the I60 resulted in a yield reduction compared to I100 and/or I80 under the nets (Figure 2A). Most importantly, a 20% reduction in standard fertigation did not affect the yield. This was demonstrated in the control trees as well, suggesting that the netted trees had no fertigation advantage over the un-netted ones. However, at all fertigation regimes, the nets resulted in a higher yield compared to the control (Figure 2A). Although in most treatments the effects were due to an increased fruit weight/size and not fruit number, the overall fruit mass (yield) on the tree increased by 18%, 27%, and 44% under the transparent, pearl, and red net, respectively. The calculated WUE per yield demonstrated that all nets were significantly different to the control trees under I100, I80, and I60. In all treatments, a I60 fertigation regime resulted in a significant increase in WUE compared to the other regimes (Figure 6). However, WUE cannot be the sole factor in determining fertigation, as I60 fertigation resulted in an overall yield loss.
As mentioned above, while most treatments had a similar fruit number in I80 and I100, only the red net increased the fruit number in I80 compared to I100 (Figure 2B). The finding that, in most treatments, a 20% reduction in applied water did not affect the fruit number was consistent with previous papers demonstrating that reduced fertigation did not necessarily result in a reduced fruit number, unless the stem water potential exceeded a relatively low value [45,46,47,48,49,50].
However, the question of why the combined effect of the red net with I80 was optimal remains open. Answering this question would require an investigation on during which developmental stage(s) the red net exerts its beneficial effect. It might be hypothesized that, in I100, the increase in soil moisture might reduce the oxygen content and redox potential, as compared to I80 [25]. Soil aeration is considered one of the major factors in citriculture, as a constant supply of oxygen to the root system is required, and the tree has a relatively low adaptation capacity to low oxygen content, particularly under waterlogged conditions [51]. Therefore, sandy soils are usually preferable for citrus growing. Soils in the experimental plot of an over 20% clay content (Table S2) might well contribute to a lower oxygen content under I100, as compared to I80, and this might affect tree productivity by inducing fruit abscission [52].
Fertilization was proportional to reduced irrigation, still; the leaf mineral content was not significantly affected (Table S3 and Figure S3) and usually remained at the optimal level, or close to it. In fact, this was similar to other reported cases: Shirgura et al. reported that leaf N, P, and K contents of mandarin trees remained near the optimal range in a wide range of irrigations (−20% to −40%) combined with reduced fertilization [52]. Similar results were reported by other workers, who applied various irrigation regimes [53,54,55]. It might be inferred that reduced irrigation resulted in less leaching and a more efficient minerals uptake [56,57,58].
In summary, data results presented here demonstrate the beneficial effects of top (and photoselective) netting on Valencia orange yield. The water-saving effect of nets has been demonstrated previously by measuring tree water status using various methods [2,3,4]. Here, we provide direct evidence that reducing fertigation by 20% is beneficial under nets, without compromising the increase in yield realized by the netting. Moreover, in trees grown under the red net, a significant increase in the fruit number was evident under I80 without any significant reduction in the individual fruit weight compared to other treatments, culminating in a significantly higher yield compared to control and transparent (non photoselective) netting. These results promote the use of photoselective red nets as a practical use in citriculture.

Supplementary Materials

The following are available online at https://www.mdpi.com/article/10.3390/agronomy11102034/s1, Table S1: Weather and irrigation. Growing degree days (GDD), annual rain, and irrigation values are shown for each season, as indicated. Rain level is shown for the entire fruit development and growth season (from flowering peak around April 10 until harvest day of each year), and for the defined rain season from Sep/Oct until March/Apr. Table S2: Soil particle analysis. Averages of percent particles in various depths, as indicated, across the experimental plot. Table S3: Major minerals content in leaves. Standards are according to the recommendations of the Israeli Extension Service. As the netting x fertigation treatments did not vary in between, actual values are averages of all treatments ± SE. Table S4: Year effect on yield, number of fruits per tree, and average fruit weight. Different letters denote significant difference by Tukey–Kramer test (p < 0.05). Table S5: Average multi-annual and individual years fruit diameter of agronomically relevant treatments. In parenthesis, percent change as compared to control 100% irrigation. Different letters denote significant difference by Tukey–Kramer test (p < 0.05). Figure S1: Plot schematic map. Top arrows indicate sampled rows. Figure S2: Plot photos. Left, satellite view; P, pearl net; R, red net; T, transparent net; Right, ground photo taken from south-east side of the plot. Figure S3: Leaf mineral contents. NPK were analyzed in fruit leaves collected in mid-October. Figure S4: Climate during experimental years. Maximal and minimal temperatures (upper panel) and rain events (lower panel) are shown, starting from flowering peak. Figure S5. Distribution of yield for selected treatments during all years combined and individual years, as indicated (left panels). Effect size of yield for selected treatments, as indicated, calculated using control I100, as standard treatment for all years combined and individual years (right panels). Figure S6: Top netting effect on multi-annual average fruit diameter. 2015–2018 average fruit diameter in control trees and in trees grown under transparent, pearl, and red nets irrigated with 100%, 80%, or 60% fertigation regimes, as indicated: A, netting treatments regardless of fertigation showing mean and 95% HDI intervals; B distribution of average fruit diameter in the twelve netting x fertigation treatments with mean and 95% HDI. Figure S7 Fruit size distribution during individual years. Fruit diameter distribution during harvest at the indicated years and fertigation regimes. File S1: Yield data for individual years.

Author Contributions

Conceptualization, A.S., Y.S. and S.C.; methodology, A.S., Y.S. and S.C.; validation, I.D., D.B.N., Y.S., L.S., I.K. and A.F.; formal analysis, I.D., D.B.N., L.S., I.K., A.F. and K.R.; investigation, I.D., D.B.N., L.S., I.K., A.F., T.R.F. and A.S.; writing—original draft preparation, A.S., D.C. and S.C.M.: writing—review and editing, A.S., S.C.M., I.J.P., D.C. and A.S.; visualization, A.S., D.C. and S.C.M.; supervision, A.S., Y.S. and S.C.; project administration, A.S.; funding acquisition, A.S. All authors have read and agreed to the published version of the manuscript.

Funding

This study was funded by PepsiCo, Inc. (387-13).

Data Availability Statement

The data presented in this study are available on request from the corresponding author.

Acknowledgments

We thank Catherine Turner for help with statistical analyses.

Conflicts of Interest

Author TRF is employed by PepsiCo, Inc. Authors SCM and IJP are employed by PepsiCo International Limited. The views expressed in this manuscript are those of SCM, IJP, and TRF, and do not necessarily reflect the views or policies of PepsiCo, Inc. or any of its affiliates. Other authors declare no conflict of interest.

References

  1. Wilkie, J.D.; Sedgley, M.; Olesen, T. Regulation of floral initiation in horticultural trees. J. Exp. Bot. 2008, 59, 3215–3228. [Google Scholar] [CrossRef] [Green Version]
  2. Mditshwa, A.; Magwaza, L.S.; Tesfay, S.Z. Shade netting on subtropical fruit: Effect on environmental conditions, tree physiology and fruit quality. Sci. Hortic. 2019, 256, 108556. [Google Scholar] [CrossRef]
  3. Mahmood, A.; Hu, Y.; Tanny, J.; Asante, E.A. Effects of shading and insect-proof screens on crop microclimate and production: A review of recent advances. Sci. Hortic. 2018, 241, 241–251. [Google Scholar] [CrossRef]
  4. Manja, K.; Aoun, M. The use of nets for tree fruit crops and their impact on the production: A review. Sci. Hortic. 2019, 246, 110–122. [Google Scholar] [CrossRef]
  5. Mupambi, G.; Anthony, B.; Layne, D.R.; Musacchi, S.; Serra, S.; Schmidt, T.; Kalcsits, L.A. The influence of protective netting on tree physiology and fruit quality of apple: A review. Sci. Hortic. 2018, 236, 60–72. [Google Scholar] [CrossRef]
  6. Bosančić, B.; Mićić, N.; Blanke, M.; Pecina, M. A main effects meta principal components analysis of netting effects on fruit: Using apple as a model crop. Plant Growth Regul. 2018, 86, 455–464. [Google Scholar] [CrossRef]
  7. Rajapakse, N.C.; Shahak, Y. 12 light-quality manipulation by horticulture industry. Annu. Plant Rev. Light Plant Dev. 2007, 30, 290. [Google Scholar]
  8. Stamps, R.H. Use of colored shade netting in horticulture. HortScience 2009, 44, 239–241. [Google Scholar] [CrossRef]
  9. Arthurs, S.P.; Stamps, R.H.; Giglia, F.F. Environmental modification inside photoselective shadehouses. HortScience 2013, 48, 975–979. [Google Scholar] [CrossRef]
  10. Shahak, Y. Photoselective netting: An overview of the concept, research and development and practical implementation in agriculture. Acta Hortic. 2014, 1015, 155–162. [Google Scholar] [CrossRef]
  11. Shahak, Y.; Ratner, K.; Zur, N.; Offir, Y.; Matan, E.; Yehezkel, H.; Messika, Y.; Posalski, I.; Ben-Yakir, D. Photoselective netting: An emerging approach in protected agriculture. Acta Hortic. 2009, 807, 79–84. [Google Scholar] [CrossRef]
  12. Alarcon, J.J.; Ortuño, M.F.; Nicolás, E.; Navarro, A.; Torrecillas, A. Improving water-use efficiency of young lemon trees by shading with aluminised-plastic nets. Agric. Water Manag. 2006, 82, 387–398. [Google Scholar] [CrossRef]
  13. Cohen, S.; Raveh, E.; Li, Y.; Grava, A.; Goldschmidt, E. Physiological responses of leaves, tree growth and fruit yield of grapefruit trees under reflective shade screens. Sci. Hortic. 2005, 107, 25–35. [Google Scholar] [CrossRef]
  14. Raveh, E.; Cohen, S.; Raz, T.; Yakir, D.; Grava, A.; Goldschmidt, E.E. Increased growth of young citrus trees under reduced radiation load in a semi-arid climate. J. Exp. Bot. 2003, 54, 365–373. [Google Scholar] [CrossRef]
  15. Tanny, J.; Cohen, S. The effect of a small shade net on the properties of wind and selected boundary layer parameters above and within a citrus orchard. Biosyst. Eng. 2003, 84, 57–67. [Google Scholar] [CrossRef]
  16. Jifon, J.; Syvertsen, J.P. Moderate shade can increase net gas exchange and reduce photoinhibition in citrus leaves. Tree Physiol. 2003, 23, 119–127. [Google Scholar] [CrossRef] [Green Version]
  17. Brar, H.S.; Thakur, A.; Singh, H.; Kaur, N. Photoselective coverings influence plant growth, root development, and buddability of citrus plants in protected nursery. Acta Physiol. Plant. 2020, 42, 1–15. [Google Scholar] [CrossRef]
  18. Zhou, K.; Jerszurki, D.; Sadka, A.; Shlizerman, L.; Rachmilevitch, S.; Ephrath, J. Effects of photoselective netting on root growth and development of young grafted orange trees under semi-arid climate. Sci. Hortic. 2018, 238, 272–280. [Google Scholar] [CrossRef]
  19. Wachsmann, Y.; Zur, N.; Shahak, Y.; Ratner, K.; Giler, Y.; Schlizerman, L.; Sadka, A.; Cohen, S.; Garbinshikof, V.; Giladi, B.; et al. Photoselective anti-hail netting for improved citrus productivity and quality. Acta Hortic. 2014, 1015, 169–176. [Google Scholar] [CrossRef]
  20. Cronjé, P.; Botes, J.; Prins, D.; Brown, R.; North, J.; Stander, O.; Hoffman, E.; Zacarias, L.; Barry, G. The influence of 20% white shade nets on fruit quality of ‘Nadorcott’ mandarin. Acta Hortic. 2020, 1268, 279–284. [Google Scholar] [CrossRef]
  21. Barry, G.; Prins, D.; Stander, O.; Cronjé, P. Microclimate and tree physiology of ‘Nadorcott’ mandarin are affected by shade netting. Acta Hortic. 2020, 1268, 271–278. [Google Scholar] [CrossRef]
  22. Dovjek, I.; Nemera, D.; Wachsmann, Y.; Shlizerman, L.; Ratner, K.; Kamara, I.; Morozov, M.; Charuvi, D.; Shahak, Y.; Cohen, S.; et al. Top netting as a practical tool to mitigate the effect of climate change and induce productivity in citrus: Summary of experiments using photo-selective nets. Acta Hortic. 2020, 1268, 265–270. [Google Scholar] [CrossRef]
  23. Shahak, Y.; Ratner, K.; Giller, Y.; Zur, N.; Or, E.; Gussakovsky, E.; Stern, R.; Sarig, P.; Raban, E.; Harcavi, E.; et al. Improving solar energy utilization, productivity and fruit quality in orchards and vineyards by photoselective netting. Acta Hortic. 2008, 772, 65–72. [Google Scholar] [CrossRef]
  24. Shahak, Y.; Gussakovsky, E.E.; Cohen, Y. Colour nets: A new approach for light manipulation in fruit trees. Acta Hortic. 2004, 636, 609–616. [Google Scholar] [CrossRef]
  25. Pepper, I.L.; Brusseau, M.L. Physical–chemical characteristics of soils and the subsurface. In Environmental and Pollution Science, 3rd ed.; Brusseau, M.L., Pepper, I.L., Gerba, C.P., Eds.; Academic Press: Cambridge, MA, USA, 2019; pp. 9–22. [Google Scholar] [CrossRef]
  26. Halpern, M.; Bar-Tal, A.; Lugassi, N.; Egbaria, A.; Granot, D.; Yermiyahu, U. The role of nitrogen in photosynthetic acclimation to elevated [CO2] in tomatoes. Plant Soil 2019, 434, 397–411. [Google Scholar] [CrossRef]
  27. Bar-Tal, A.; Yermiyahu, U.; Ben-Gal, A.; Schwartz, A.; Faingold, I.; Seligmann, R. Optimization of calcium and magnesium concentrations for fertigation of tomato with desalinated water. Isr. J. Plant Sci. 2017, 64, 80–91. [Google Scholar] [CrossRef]
  28. R Core Team. R: A Language and Environment for Statistical Computing; R Foundation for Statistical Computing: Vienna, Austria, 2020. [Google Scholar]
  29. Wickham, H. Ggplot2: Elegant Graphics for Data Analysis; Springer: New York, NY, USA, 2016. [Google Scholar]
  30. Wickham, H.; Chang, W.; Henry, L.; Pedersen, T.L.; Takahashi, K.; Wilke, C.; Woo, K.; Yutani, H.; Dunnington, D. Ggplot2: Create Elegant Data Visualisations Using the Grammar of Graphics. 2020. Available online: https://ggplot2.tidyverse.org/ (accessed on 8 October 2021).
  31. Phillips, N. Yarrr: A Companion to the E-Book “YaRrr!: The Pirate’s Guide to R”. 2017. Available online: https://bookdown.org/ndphillips/YaRrr/YaRrr.pdf (accessed on 8 October 2021).
  32. Meyer, D.; Zeileis, A.; Hornik, K. The strucplot framework: Visualizing multi-way contingency tables with vcd. J. Stat. Softw. 2006, 17, 1–48. [Google Scholar] [CrossRef]
  33. Meyer, D.; Zeileis, A.; Hornik, K. Vcd: Visualizing Categorical Data. 2020. Available online: https://cran.r-project.org/web/packages/vcd/citation.html (accessed on 8 October 2021).
  34. Friendly, M. VcdExtra: ‘Vcd’ Extensions and Additions. 2017. Available online: https://cran.r-project.org/web/packages/vcdExtra/index.html (accessed on 8 October 2021).
  35. Lenth, R. Emmeans: Estimated Marginal Means, Aka Least- Squares Means. 2020. Available online: https://cran.r-project.org/web/packages/emmeans/index.html (accessed on 8 October 2021).
  36. Sullivan, G.M.; Feinn, R. Using effect size—Or why the p value is not enough. J. Grad. Med. Educ. 2012, 4, 279–282. [Google Scholar] [CrossRef] [Green Version]
  37. Coe, R. It’s the Effect Size, Stupid: What Effect Size Is and Why It Is Important. Annual Conference of the British Educational Research Association. 2002. Available online: http://www.leeds.ac.uk/educol/documents/00002182.htm (accessed on 8 October 2021).
  38. Lionello, P. The Climate of the Mediterranean Region: From the Past to the Future; Elsevier: Amsterdam, The Netherlands, 2012. [Google Scholar]
  39. Nemera, D.B.; Shahak, Y.; Ratner, K.; Dovjik, I.; Cohen, S.; Charuvi, D.; Sadka, A. Climate mitigation effect of top-netting in Valencia orange (Citrus sinensis) orchard (In preparation).
  40. Boini, A.; Manfrini, L.; Morandi, B.; Grappadelli, L.C.; Predieri, S.; Daniele, G.; López, G. High levels of shading as a sustainable application for mitigating drought, in modern apple production. Agronomy 2021, 11, 422. [Google Scholar] [CrossRef]
  41. Morgan, M. Fruit to flower ratios and trade-offs in size and number. Evol. Ecol. 1993, 7, 219–232. [Google Scholar] [CrossRef]
  42. Guardiola, J.; García-Luis, A. Increasing fruit size in citrus. Thinning and stimulation of fruit growth. Plant Growth Regul. 2000, 31, 121–132. [Google Scholar] [CrossRef]
  43. Goldshmidt, E.E.; Sadka, A. Yield alternation: Horticulture, physiology, molecular biology and evolution. Hort. Rev. 2021, 48, 363–418. [Google Scholar]
  44. Génard, M.; Dauzat, J.; Franck, N.; Lescourret, F.; Moitrier, N.; Vaast, P.; Vercambre, G. Carbon allocation in fruit trees: From theory to modelling. Trees 2008, 22, 269–282. [Google Scholar] [CrossRef]
  45. Pérez-Pérez, J.G.; Robles, J.; Botía, P. Effects of deficit irrigation in different fruit growth stages on ‘Star Ruby’ grapefruit trees in semi-arid conditions. Agric. Water Manag. 2014, 133, 44–54. [Google Scholar] [CrossRef]
  46. Shirgure, P. Research review on irrigation scheduling and water requirement in citrus. Sci. J. Rev. 2013, 2, 113–121. [Google Scholar]
  47. García-Tejero, I.F.; Durán-Zuazo, V.H.; Muriel-Fernández, J.L.; Garcia, G.M.; Jiménez-Bocanegra, J.A. Benefits of low-frequency irrigation in citrus orchards. Agron. Sustain. Dev. 2011, 31, 779–791. [Google Scholar] [CrossRef]
  48. García-Tejero, I.F.; Vicente, R.R.; Jiménez-Bocanegra, J.; Garcia, G.M.; Zuazo, V.H.D.; Muriel-Fernández, J. Response of citrus trees to deficit irrigation during different phenological periods in relation to yield, fruit quality, and water productivity. Agric. Water Manag. 2010, 97, 689–699. [Google Scholar] [CrossRef]
  49. García-Tejero, I.F.; Jiménez-Bocanegra, J.; Martínez, G.; Romero, R.; Zuazo, V.H.D.; Muriel-Fernández, J. Positive impact of regulated deficit irrigation on yield and fruit quality in a commercial citrus orchard [Citrus sinensis (L.) Osbeck, cv. salustiano]. Agric. Water Manag. 2010, 97, 614–622. [Google Scholar] [CrossRef]
  50. Gasque, M.; Marti, P.; Granero, B.; Gonzalez-Altozano, P. Effects of long-term summer deficit irrigation on ‘Navelina’ citrus trees. Agr Water Manag. 2016, 169, 140–147. [Google Scholar] [CrossRef] [Green Version]
  51. Syvertsen, J.P.; Zablotowicz, R.M.; Smith, M.L. Soil temperature and flooding effects on two species of citrus. Plant Soil 1983, 72, 3–12. [Google Scholar] [CrossRef]
  52. Goñi, C.; Otero, A.; Syvertsen, J.P. Flooding affects fruitlet abscission in satsuma mandarin. Acta Hortic. 2015, 1065, 1407–1416. [Google Scholar] [CrossRef]
  53. Shirgure, P.S.; Srivastava, A.K.; Singh, S. Growth, yield and quality of Nagpur mandarin (Citrus reticulata Blanco) in relation to irrigation and fertigation. Indian J. Agric. Sci. 2001, 71, 547–550. [Google Scholar]
  54. Quinones, A.; Martínez-Alcántara, B.; Legaz, F. Influence of irrigation system and fertilization management on seasonal distribution of N in the soil profile and on N-uptake by citrus trees. Agric. Ecosyst. Environ. 2007, 122, 399–409. [Google Scholar] [CrossRef]
  55. Porro, D.; Pantezzi, T.; Pedò, S.; Bertoldi, D. Interaction of fertigation and water management on apple tree productivity, orchard nutrient status, and fruit quality. Acta Hortic. 2013, 984, 203–210. [Google Scholar] [CrossRef]
  56. Rufat, J.; Arbones, A.; Villar, P.; Domingo, X.; Pascual, M.; Villar, J. Effects of irrigation and nitrogen fertilization on growth, yield and fruit quality parameters of peaches for processing. Acta Hortic. 2010, 868, 87–94. [Google Scholar] [CrossRef]
  57. Phogat, V.; Skewes, M.; Cox, J.; Sanderson, G.; Alam, J.; Šimůnek, J. Seasonal simulation of water, salinity and nitrate dynamics under drip irrigated mandarin (Citrus reticulata) and assessing management options for drainage and nitrate leaching. J. Hydrol. 2014, 513, 504–516. [Google Scholar] [CrossRef] [Green Version]
  58. Qin, W.; Heinen, M.; Assinck, F.B.; Oenema, O. Exploring optimal fertigation strategies for orange production, using soil–crop modelling. Agric. Ecosyst. Environ. 2016, 223, 31–40. [Google Scholar] [CrossRef]
Figure 1. Spectral irradiance, as affected by the nets: (A) total (direct and scattered) radiation flux density for control (no net), and under the transparent, pearl, and red nets; (B) diffuse (scattered) radiation flux density; (C) transmittance of total irradiance relative to the control; (D) relative fraction of scattered radiation (B/A ratio). Data shown are averages of five measurements.
Agronomy 11 02034 g001
Figure 2. Top netting effects regardless of fertigation on multi-annual yield components. 2015–2018 average yield (Kg per tree) (A), fruit number per tree (B), and fruit weight (g) (C) in control trees and in trees grown under transparent, pearl, and red nets. Mean values and 95% HDI intervals.
Agronomy 11 02034 g002
Figure 3. Top netting effects, including fertigation, on multi-annual yield components. 2015–2018 average yield (Kg per tree) (A), fruit number per tree (B), and fruit weight (g) (C) in control trees and in trees grown under transparent, pearl, and red net irrigated with 100%, 80%, or 60% fertigation regimes, as indicated. Distribution of average yield, fruit number, and fruit weight in the twelve netting x fertigation treatments with mean and 95% HDI. Different letters denote significant difference by Tukey–Kramer test (p ≤ 0.05).
Agronomy 11 02034 g003
Figure 4. Percentage difference in yield components compared to control I100. Percentage difference between the indicated treatments and control 100% irrigation, as calculated from the data in Table 2, is shown for each experimental year and 2015–2018 average yield (Kg per tree) (A), fruit number per tree (B), and fruit weight (g) (C). Stars denote significant difference between the indicated treatment and control 100% irrigation when a different letter is shown in Table 2.
Agronomy 11 02034 g004
Figure 5. Top netting effects on multi-annual fruit diameter distribution. Mosaic plot showing multi-annual relative distribution of fruit diameter in control trees and under the nets, as indicated. The numbers in the boxes are the cut off diameters (mm) for sizing the fruit. The mosaic plot was constructed assuming a mutual independence model and proportions were marginalized over irrigation.
Agronomy 11 02034 g005
Figure 6. Top netting effects on multi-annual WUE. 2015–2018 WUE in control trees and in trees grown under transparent, pearl, and red nets irrigated with 100% (I100), 80% (I80), or 60% (I60) irrigation regimes, as indicated. Mean values ± SE. Different letters denote significant difference by Tukey–Kramer test (p ≤ 0.05).
Agronomy 11 02034 g006
Table 1. Spectral properties of the nets. Percent shading and scattering are shown for photosynthetically active radiation (PAR; 400–700 nm). Measurements were carried out on a clear day in July between 11:00–12:00, with five measurements averaged per treatment ± SD.
TreatmentShading (%)Scattering (%)
Control11.70 ± 0.51
Transparent13.37 ± 0.3124.28 ± 0.18
Pearl19.66 ± 0.6417.78 ± 0.33
Red15.41 ± 0.8019.73 ± 0.15
TreatmentShading (%)Scattering (%)
Control11.70 ± 0.51
Transparent13.37 ± 0.3124.28 ± 0.18
Pearl19.66 ± 0.6417.78 ± 0.33
Red15.41 ± 0.8019.73 ± 0.15
Table 2. Yield, fruit number, and individual fruit weight in selected treatments. Average data of individual years and all years combined, as indicated ± SE. Different letters denote significant difference by Tukey–Kramer test (p ≤ 0.05).
Treatment20152016201720182015–2018
Average Fruit Weight per Tree (Kg)
Control, 100%108.70 ± 11.22 a108.66 ± 6.14 a95.72 ± 6.77 ab110.02 ± 8.10 a105.45 ± 3.88 a
Control, 80%123.56 ± 11.79 ab110.92 ± 8.07 a93.27 ± 8.19 a128.65 ± 9.92 a110.05 ± 4.94 a
Transparent, 80%154.20 ± 15.95 ab125.44 ± 13.27 a124.78 ± 9.78 bc131.37 ± 9.72 a131.70 ± 6.00 b
Pearl 80%171.17 ± 15.37 b150.60 ± 14.60 a115.17 ± 8.16 ac140.32 ± 10.76 bc141.33 ± 6.53 bc
Red, 80%153.56 ± 16.57 ab149.59 ± 14.05 a153.10 ± 12.90 c185.85 ± 17.67 c161.30 ± 7.88 c
Average fruit number per tree
Control, 100%638 ± 52 a546 ± 33 a630 ± 41 a692 ± 55 a625 ± 24 a
Control, 80%735 ± 61 ab640 ± 48 a566 ± 45 a841 ± 71 ab675 ± 31 ab
Transparent, 80%873 ± 79 ab629 ± 63 a746 ± 56 ab746 ± 67 a735 ± 34 ab
Pearl 80%977 ± 82 b706 ± 66 a631 ± 58 a812 ± 67 ab760 ± 37 b
Red, 80%925 ± 104 ab778 ± 83 a892 ± 74 b1048 ± 100 b909 ± 46 c
Average individual fruit weight (g)
Control, 100%167.27 ± 5.84 a201.37 ± 5.31 b150.91 ± 4.95 a161.30 ± 4.24 a 170.54 ± 3.45 a
Control, 80%169.82 ± 12.50 a174.32 ± 4.03 a164.29 ± 6.46 a155.32 ± 2.71 a164.27 ± 3.07 a
Transparent, 80%177.66 ± 11.19 a194.34 ± 6.64 b172.27 ± 9.63 ab158.59 ± 8.81 a175.50 ± 4.69 a
Pearl 80%180.42 ± 15.18 a212.71 ± 4.04 b192.53 ± 10.53 b174.66 ± 3.54 a191.15 ± 4.51 b
Red, 80%166.37 ± 7.39 a195.55 ± 4.39 b172.68 ± 6.46 ab177.89 ± 4.84 a179.43 ± 3.15 ab
Table 3. Yield, fruit number and fruit weight in the five selected treatments. Data was extracted from Figure 1, Figure 2 and Figure 3.
Yield (kg/Tree)Number of Fruit per TreeAverage Fruit Weight
TreatmentMeanTreatmentMeanTreatmentMean
Red, 80% Fertig.161 cRed, 80% Fertig.909 cPearl, 80% Fertig. 191 b
Pearl, 80% Fertig.141 bcPearl. 80% Fertig.760 bRed, 80% Fertig. 179 ab
Transp., 80% Fertig.131 bTransp., 80% Fertig.735 abTransp., 80% Fertig. 175 a
Control, 80% Fertig. 110 aControl, 80% Fertig.675 abControl, 100% Fertig. 170 a
Control, 100% Fertig. 105 aControl, 100% Fertig.625 aControl, 80% Fertig. 164 a
Publisher’s Note: MDPI stays neutral with regard to jurisdictional claims in published maps and institutional affiliations.

