Abstract
Nitrate leaching is of great environmental concern, particularly with potatoes grown on sandy soils. This 3-year study evaluated the effect of three N rates (100, 150, and 200 kg ha−1) of single applications of polymer-coated urea (PCU) and a 75% PCU + 25% urea mixture, plus a conventional split application of 200 kg N ha−1 of a 50% ammonium sulfate + 50% calcium ammonium nitrate mixture (CONV) on NO3−-N leaching, potato yield, and N uptake under irrigated and non-irrigated conditions on a sandy soil in Quebec (Canada). Fertilizer N application increased growing season NO3−-N leaching only under irrigation. On average, irrigation increased seasonal NO3−-N leaching by 52%. Under irrigated conditions, PCU reduced NO3−-N leaching compared to PCU + urea. However, both PCU and PCU + urea significantly increased NO3−-N leaching compared to the CONV at the equivalent N rate of 200 kg N ha−1. This was attributed to the timing of soil N availability and deep-water percolation. Total (TY) and marketable (MY) yields in the CONV were similar to those in the PCU applied at the equivalent N rate of 200 kg N ha−1. Despite lower plant N uptake, PCU resulted in greater TY and MY compared to PCU + urea. Residual soil inorganic N was greater for PCU and PCU + urea compared to the CONV, providing evidence that PCU products have the potential to increase NO3−-N leaching after the growing season. In this study, PCU was an agronomically and environmentally better choice than PCU + urea. The results also showed that the efficiency of PCU to reduce seasonal NO3−-N leaching may vary according to the timing of precipitation and irrigation.
1. Introduction
Nitrogen (N) and water are two major inputs for improving potato (Solanum tuberosum L.) growth and yield. Potatoes are highly responsive to N fertilization, and it is a common practice in Quebec (Canada) to apply fertilizer N at rates greater than the local recommendations (125 to 200 kg N ha−1) to ensure maximum yield [1]. Potato production in this region is primarily rain fed. However, there is a trend towards increased irrigation due to significant crop losses when drought occurs in some years [2]. The high input of N, coupled with irrigation, has the potential to cause high NO3−-N leaching, especially on sandy soils [3]. To minimize leaching on these soils, the N fertilizers are commonly split applied, with granular fertilizer applied at planting and 30–40 days after planting (DAP) at hilling [2].
The split application of fertilizer N reduces the soil N availability early in the season when the potato root system is not sufficiently developed to absorb and efficiently use all the available N [4,5]. Although split application of N fertilizer can reduce the potential for NO3−-N leaching compared to a single application at planting [4,6], NO3−-N leaching beyond the potato root zone generally remained high for split-applied conventional soluble N fertilizers in humid regions, with values ranging from 21 to 98 kg NO3−-N ha−1 [7,8,9]. Consequently, the introduction of new fertilizer technologies into potato production systems may help to reduce NO3−-N leaching, while sustaining productivity.
Polymer-coated urea (PCU), which provides a gradual N supply over time to better match crop N requirement over the growing season, offers an alternative to mitigate environmental N losses under potato production by improving N use efficiency in comparison to soluble N fertilizer [10,11]. Studies on potatoes in Minnesota reported that a single application of PCU, whether polyolefin-coated urea or the new type of PCU called Environmentally Smart Nitrogen (ESN; Agrium, Inc., Calgary, AB, Canada), significantly reduced NO3−-N leaching under potato production compared to a split application of soluble N (at planting, emergence, and hilling), with no loss of crop yield [7,12]. However, other studies in Minnesota and Quebec found no clear difference in terms of NO3−-N leaching between a single application of ESN, and two applications of soluble N at planting and hilling [8,9] or six applications of soluble N (one at planting, one at emergence, and four at postemergence) at equivalent rates [13], suggesting that the effects of PCU on NO3−-N leaching may vary according to soil and environmental conditions. While some studies in Quebec investigated the efficiency of PCU for non-irrigated [14] or irrigated potato production systems [9,15,16], there has been no comparison of the use of PCU in irrigated potato production systems relative to that in non-irrigated systems with respect to its agronomic or environmental impacts.
The objective of this study was to determine the effects of supplemental irrigation and N fertilization strategies, including PCU and conventional soluble N, on NO3−-N leaching, residual soil NO3−-N, and total and marketable tuber yields in potato production on sandy soils in Quebec.
2. Materials and Methods
2.1. Experimental Sites
The field trials were conducted in commercial potato fields from 2013 to 2015 at Sainte-Catherine-de-la-Jacques-Cartier, near Quebec City, QC, Canada (46°50′ N; 71°38′ W). Each year, two identical experiments (irrigated and non-irrigated) were established in separate but adjacent fields. The soil was classified in the US soil taxonomy as Harplorthod [17]. Soil pH (1:1 water) averaged 5.0, 5.2, and 4.8 in 2013–2015, respectively. The average total soil carbon (C) concentrations were 30.1, 31.7, and 28.5 g C kg−1 and total N concentrations were 2.5, 2.3, and 2.3 g N kg−1 in 2013–2015, respectively. Soil textural class was sandy loam with 733 g kg−1 of sand, 191 g kg−1 of silt, and 76 g kg−1 of clay. The preceding crop for each trial was spring oats (Avena sativa L.) in 2013 and maize grain (Zea mays L.) in 2014 and 2015. Climatic conditions at the site during the growing season were recorded by an on-site weather station.
2.2. Crop and Soil Management
The experimental design at each site (i.e., irrigated and non-irrigated) was a randomized complete block design with four blocks and eight N fertilization treatments (six in 2013). The N treatments included: two N sources (100% PCU and a mixture of 75% PCU + 25% urea) banded at planting at two N rates in 2013 (150 and 200 kg N ha−1) and three N rates in 2014 and 2015 (100, 150, and 200 kg N ha−1); a conventional (CONV) management typically used by farmers in Quebec, which consisted of a split application of 200 kg N ha−1 as a mixture of 50% ammonium sulfate (AS, 22-0-0) at planting and 50% calcium ammonium nitrate (CAN, 27-0-0) at hilling; and a control, which received no N fertilizer (N0). The PCU product was Environmentally Smart Nitrogen (44-0-0) developed by Agrium Inc. (Agrium Advanced Technologies, Calgary, AB, Canada, www.Agriumat.com). Plots consisted of six rows, measuring 8 m in length.
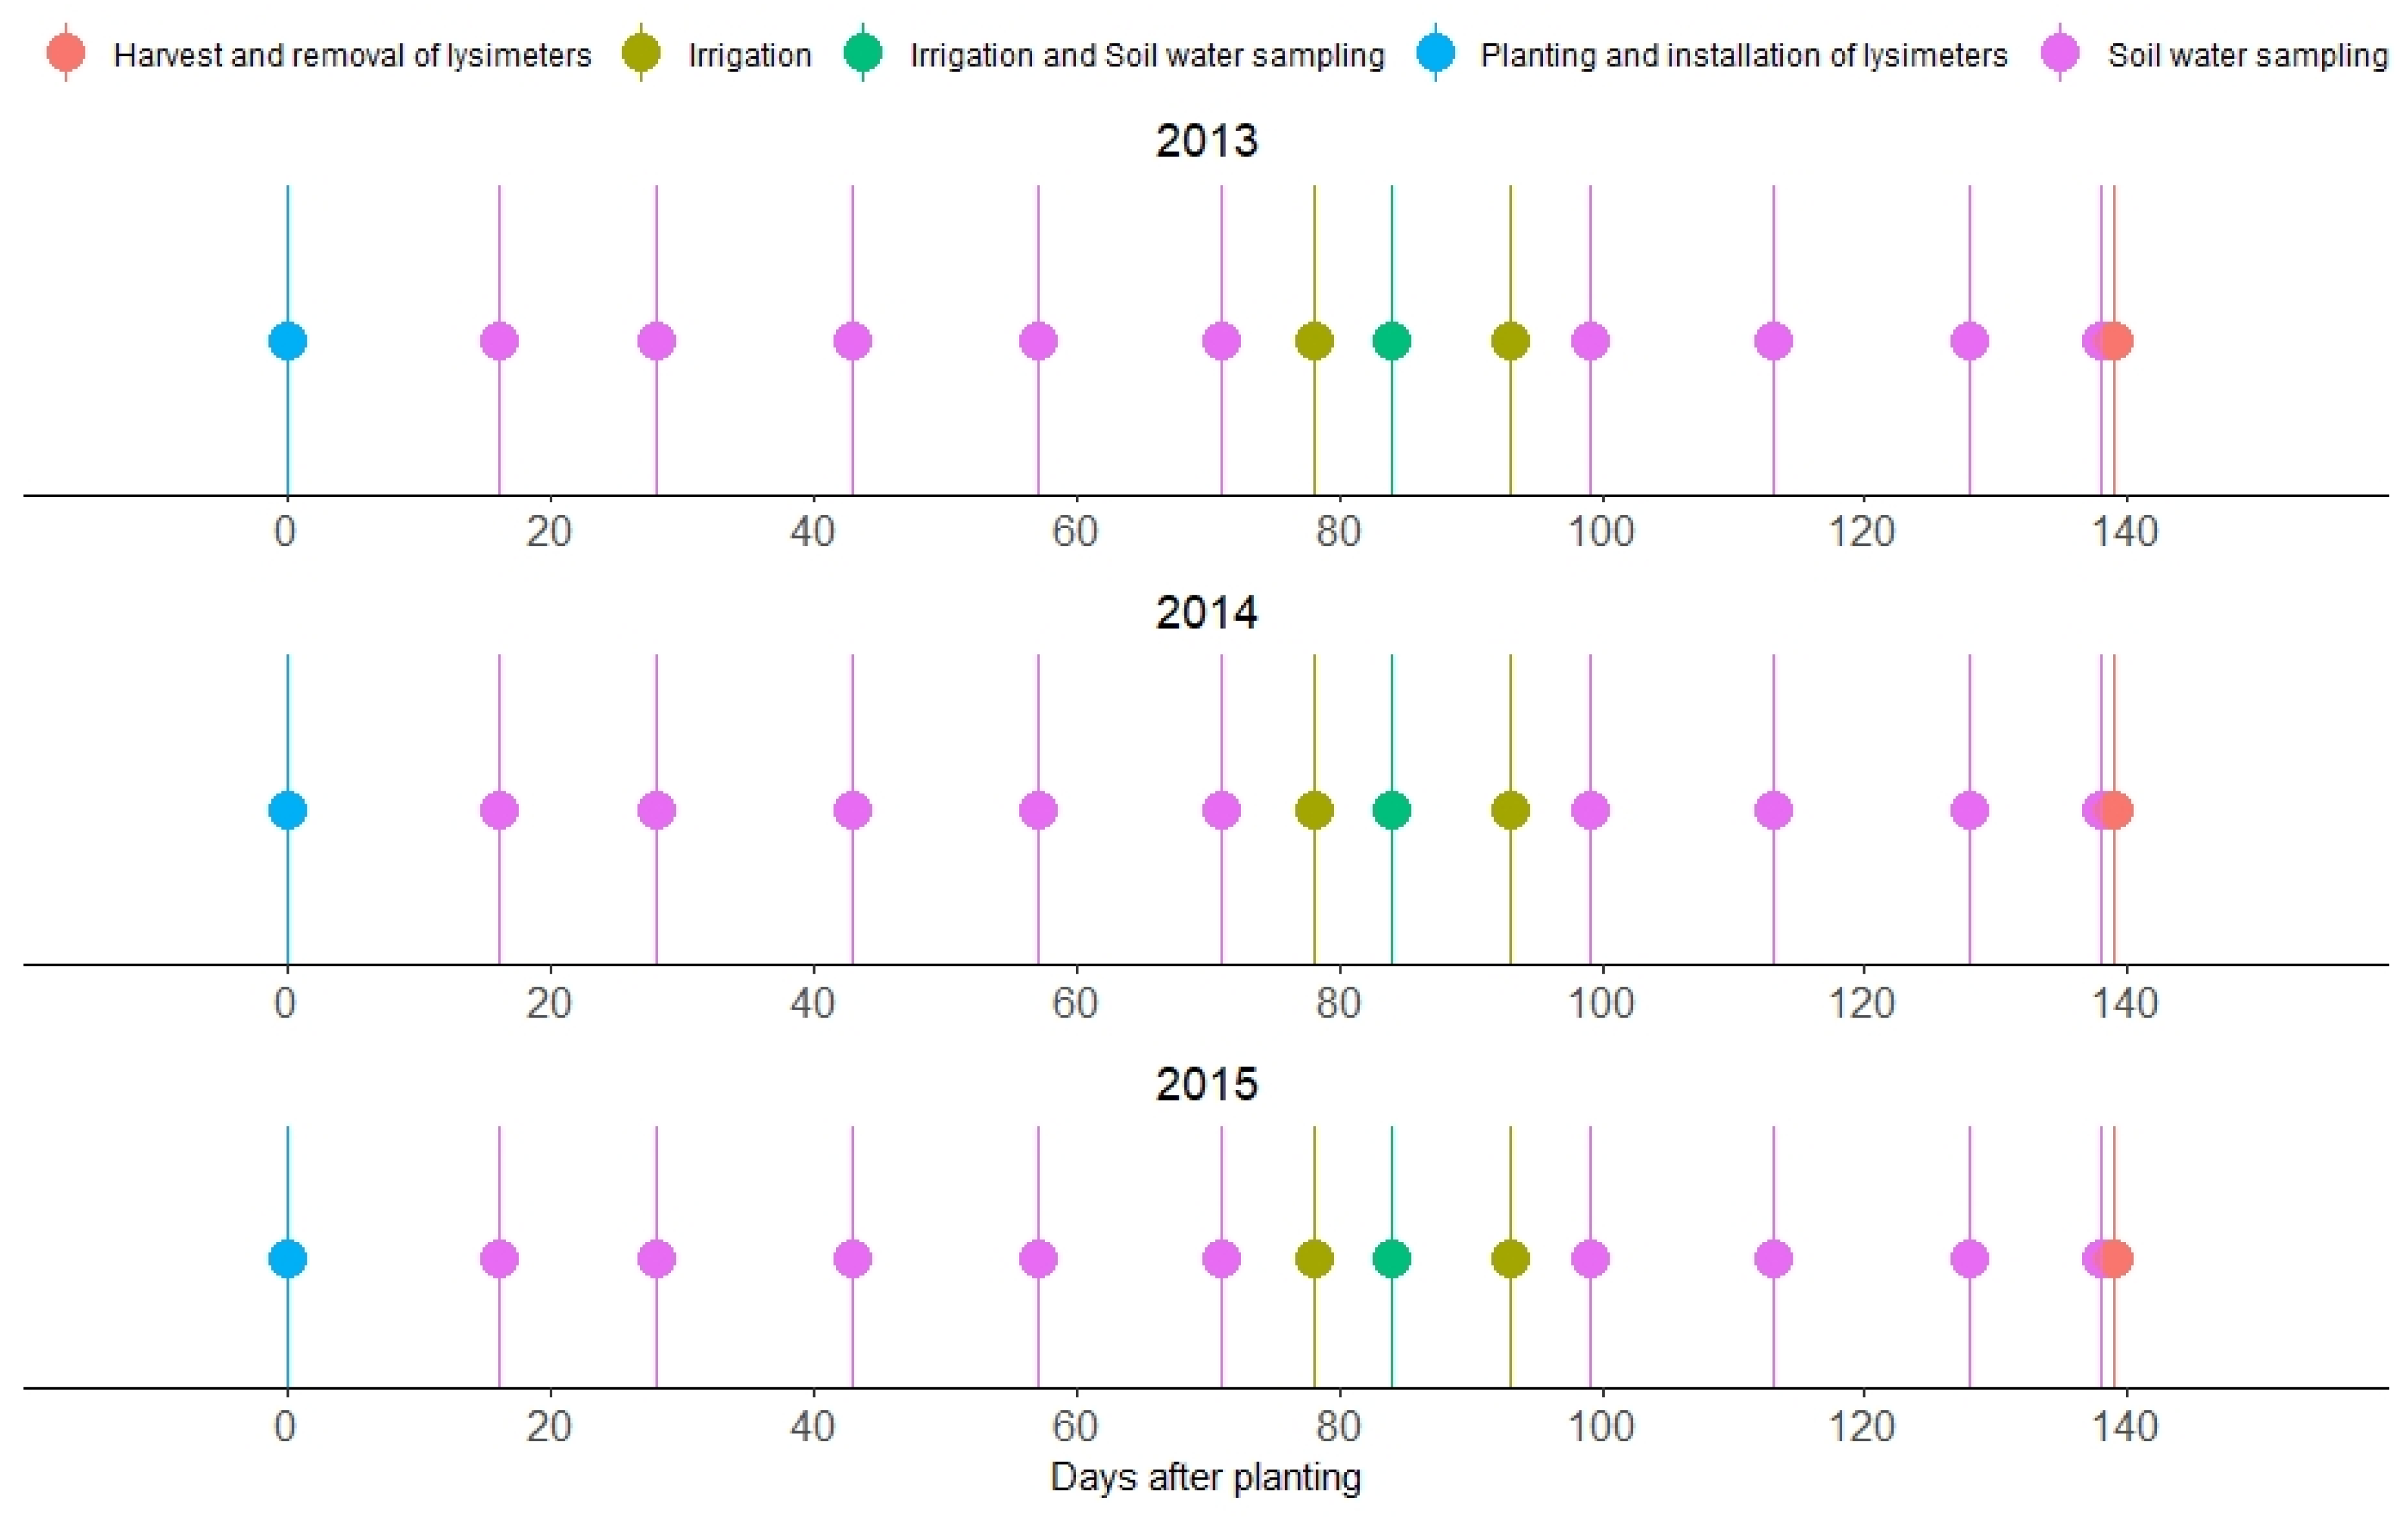
Irrigation was carried out with a center pivot sprinkler system. The volume and the scheduling were not based on any measurement of soil moisture levels or any climatic data but according to the recommendations of the agronomist in charge of the farm (personal communication). The field was irrigated on July 25 (22 mm), July 31 (22 mm), and August 09 (22 mm) in 2013, on July 20 (22 mm), July 23 (22 mm), and August 06 (22 mm) in 2014, and on July 17 (22 mm), July 23 (22 mm), August 05 (22 mm), August 18 (22 mm), August 25 (22 mm), and August 28 (22 mm) in 2015 (Figure 1). The irrigation water came from the Jacques-Cartier River. The quantity of NO3−-N added by the irrigation water was negligible [9].
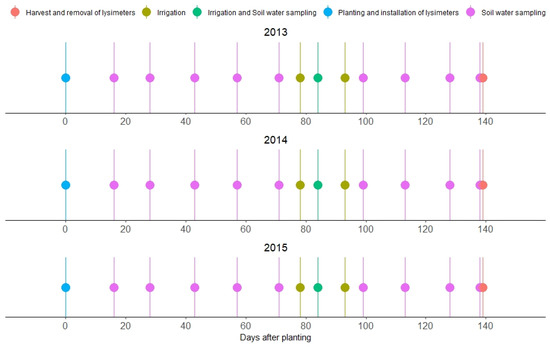
Figure 1.
The schedule of irrigation and soil water sampling in the irrigated site in 2013–2015. Soil water samples were collected at the same time in the non-irrigated site.
Just prior to planting, the N fertilizers were banded 0.05 m below the seed and, at hilling, the CAN was applied on 20 June 2012, 2 July 2014, and 8 July 2015. The pre-weighed fertilizer was manually banded 0.05 m from the center of the row in a 0.075 m deep furrow dug on one side of each potato row. Phosphorus (P) and potassium (K) were applied following local guidelines for fertilizer recommendations [1]. Triple superphosphate (0-46-0) was banded at planting, while K was broadcast in a pre-plant application as potassium chloride (0-0-60) and banded at planting as a 50–50% mixture of potassium chloride and Sulpomag (22% K2O, 11% Mg, and 22% S). Potatoes (cv. Russet Burbank) were planted using fungicide-treated seed (16% mancozeb) on 8 May 2013, 14 May 2014, and 29 May 2015, with a 0.91-m row spacing and 0.43-m within-row spacing with a two-row potato planter.
2.3. Soil and Plant Sample Collection and Analysis
Each year, prior to planting, composite soil samples were collected from the surface layer (0–20 cm) of each block at each site to determine initial soil chemical and physical properties. Soil texture analysis was performed following the hydrometer method [18]. Soil pH was measured in a 1:1 soil:distilled water suspension [19]. Total N and C were measured with an Elementar varioMAX CN analyzer (Elementar analyzer system GmbH, Hanau, Germany).
One composite soil sample, consisting of four random cores of 2.5 cm diameter, was collected from each plot after harvest in each growing season from 0–15, 15–30, 30–60, and 60–90 cm depth. Soil mineral N was extracted by 1M KCl with a ratio of 1:10 using subsamples of 25 g field moist soil [20]. Soil NH4+-N was determined colorimetrically by reaction with nitroprusside [21], while soil NO3−-N concentration was determined at 210 nm by liquid chromatography on a Dionex 4000i equipped with a VDM-II UV-V detector (Dionex Corporation, Sunnyvale, CA, USA). Soil extract concentrations (mg N L−1) were converted to kg N ha−1 using soil bulk density determined from total dry mass and volume of the soil core samples, as described by Hao et al. [22]. The soil N contents in kg N ha−1 in the four layers were summed for each plot to obtain residual soil mineral N over the entire profile (0–90 cm). Soil samples were also collected in each plot in the subsequent spring, shortly after spring thaw, to measure soil mineral N that remained in the soil profile after the fall and winter period and to determine over-winter N losses. The collection and analysis of soil samples in the following spring were conducted in a similar way to those in the fall (after harvest).
Whole plant samples were collected and partitioned into two components (vines and tubers) for the determination of dry matter and total plant N uptake. Vines were harvested from one 6-m length of row in each plot just before potatoes were topkilled using diquat as desiccant. The vine desiccation was carried out on 04 September 2013, 15 September 2014, and 17 September 2015. Potato tubers were mechanically harvested on one 6-m length of row in each plot on 139, 127, and 125 DAP in 2013–2015, respectively, to determine the total (TY) and marketable yield (MY). The MY was calculated as TY minus culls, where culls included tubers which had diameter < 47 mm or length < 76 mm or had external defects, such as greening, malformation, and soft rot. A representative 4.5-kg subsample of the MY from each plot was sliced into strips of 1 by 1 cm in size, weighed, and dried in a forced-air dryer at 55 °C for determination of dry matter content of the tubers.
The dry matter and N accumulation of each component was determined as described by Cambouris et al. [15]. A 500-g subsample of each component was ground to pass a 2-mm sieve and then analyzed separately to determine total N and C contents, as described previously for total soil N and C. Plant N accumulation in vines and tubers was calculated by multiplying the yield with their respective tissue N concentrations. Total plant N accumulation was then determined by adding together the N accumulation in vines and tubers. Apparent fertilizer N recovery (ANR) was calculated as total plant N accumulation in the fertilized plot minus that in the N0 treatment, divided by the rate of N fertilizer applied and expressed as a percentage [15].
2.4. Soil Water Nitrate Concentrations
Soil water samples were collected as described by Clément et al. [9] using suction cup lysimeters (model 1900L36-B02M2; Soil Moisture Equipment Corp., Santa Barbara, CA, USA). One lysimeter was installed in the center of the hill of the second row of each plot using a 0.05-m diameter Dutch auger. The installation depth of 0.90 m was assumed to be below the root zone and, therefore, nitrate in soil water at this depth was considered to be leachable. A hand-operated vacuum pump connected to a 1 L neoprene bottle was used to apply a suction of 70 kPa to collect soil water draining through the soil at the depth of installation. Sampling began 1 or 2 weeks after planting and continued until harvest (late September or early October). Water samples were collected approximately every two weeks for a total of 10 water samplings in 2013 and 9 water samplings in 2014 and 2015 (Figure 1). Samples were refrigerated at 4 °C during transport and kept frozen at −12 °C until analysis. Nitrate-N concentration was determined using 210 nm liquid chromatography on a Dionex 4000i equipped with a VDM-II UV-V detector (Dionex Corporation, Sunnyvale, CA, USA).
Soil water NO3−-N concentrations were reported as flow-weighted means. Flow-weighted mean NO3−-N concentrations (FWNC) were calculated using the sample time window and the corresponding water percolation as follows:
where is the concentration in the ith sample, is the time window for the ith sample, and is the water percolation volume in the ith sample.
2.5. Drainage and Nitrate Leaching
Daily deep-water percolation was estimated using the one-dimensional Hydrus-1D computer program, which is based on the Richards equation [23]. Since water movement between the soil surface and groundwater is predominantly vertical, and horizontal flow in the surface layer, such as surface runoff, can be accounted for using boundary conditions, Hydrus-1D can be successfully used to study the soil water dynamics instead of models, such as Hydrus (2D/3D), that would consider multiple dimensions [24]. The role of the air phase in the liquid flow and water flow due to thermal gradients were assumed to be negligible.
2.5.1. Water Flow Parameters
Water percolation was estimated in the soil profile with a thickness of 90 cm. The soil material was distributed based on the soil properties of each horizon. Four soil layers were considered in each field. The hydraulic parameters (Table 1) were obtained in Hydrus-1D from the soil texture, bulk density, and soil water contents at 33 kPa and at 1500 kPa suction of each soil layer using the Rosetta pedotransfer function [25]. The hydraulic parameters included the residual volumetric soil water content, saturated volumetric soil water content, saturated hydraulic conductivity, and the fitting parameters of soil water characteristic curve (α, n). No hysteresis was considered in water retention.

Table 1.
Soil particle size and hydraulic parameters of the soil profile in this study.
2.5.2. Initial and Boundary Conditions
The daily mean soil water contents measured at four depths (7.5, 22.5, 45.0, and 75.0 cm) in spring at the start of each monitoring period were set as initial conditions. Soil water contents in the soil profile were monitored and recorded at 5-min intervals using 5-TM sensors and EM-50 dataloggers (Decagon Devices Inc., Pullman WA, USA). Water contents at depths between 7.5 and 75.0 cm were linearly interpolated, while water contents at depths less than 7.5 cm and greater than 75.0 cm were set equal to the value at 7.5-cm and 75.0-cm depths, respectively. Atmospheric boundary was set as upper boundary condition, while free drainage was the lower boundary condition. The atmospheric boundary condition was precipitation, irrigation, and evapotranspiration. Irrigation was treated as precipitation in the irrigated site regardless of spatial heterogeneity. Daily meteorological data, including minimum and maximum air temperature, relative humidity, wind speed, and solar radiation, that are required to calculate potential evapotranspiration by the Penman–Monteith method [26] were given to the Hydrus model, as well as the latitude and altitude. Daily records of precipitation were given as time variable boundary conditions.
The root water uptake was simulated using Feddes root water uptake reduction model with no solute stress [27]. The root uptake parameters for potatoes were taken from Wesseling et al. [28]. The flux at 90-cm depth was the component of interest from the Hydrus model results. Negative values indicate loss from the soil column as deep percolation, whereas positive flux indicates capillary rise (gain to the system).
Daily NO3−-N leaching during the growing season was determined as the product of daily deep percolation and NO3−-N concentrations, which were estimated by linear interpolation of biweekly soil water NO3−-N concentrations. The daily values of NO3−-N leaching during the growing season were summed to estimate the seasonal NO3−-N leaching.
2.6. Data Analysis and Statistics
Statistical analyses of seasonal NO3−-N leaching, FWNC, residual soil mineral N, TY, and MY were performed across years with PROC MIX in SAS [29]. Because irrigation treatments were not replicated, we could not statistically analyze the effect of irrigation for each year. Therefore, year was considered as random effect, as well as irrigation × year and block intra irrigation × year. Given that PCU and PCU + urea were applied at two N rates in 2013 versus three in 2014 and 2015, the missing N rate was considered as missing values to accomplish the combined analysis.
The Shapiro–Wilk’s statistic was used on the residuals of each model to test the normality assumption. The homogeneity of variance was also verified by residual plots. When the normality assumption was not met, the data were transformed using BoxCox transformation. A priori contrasts were used to compare the fertilizer N source and its interactions with the N rate and the site. Linear and quadratic responses to N rate and their interaction with N source and site were also evaluated. All effects were considered significant at p ≤ 0.05, unless otherwise mentioned.
3. Results
3.1. Water Input and Drainage
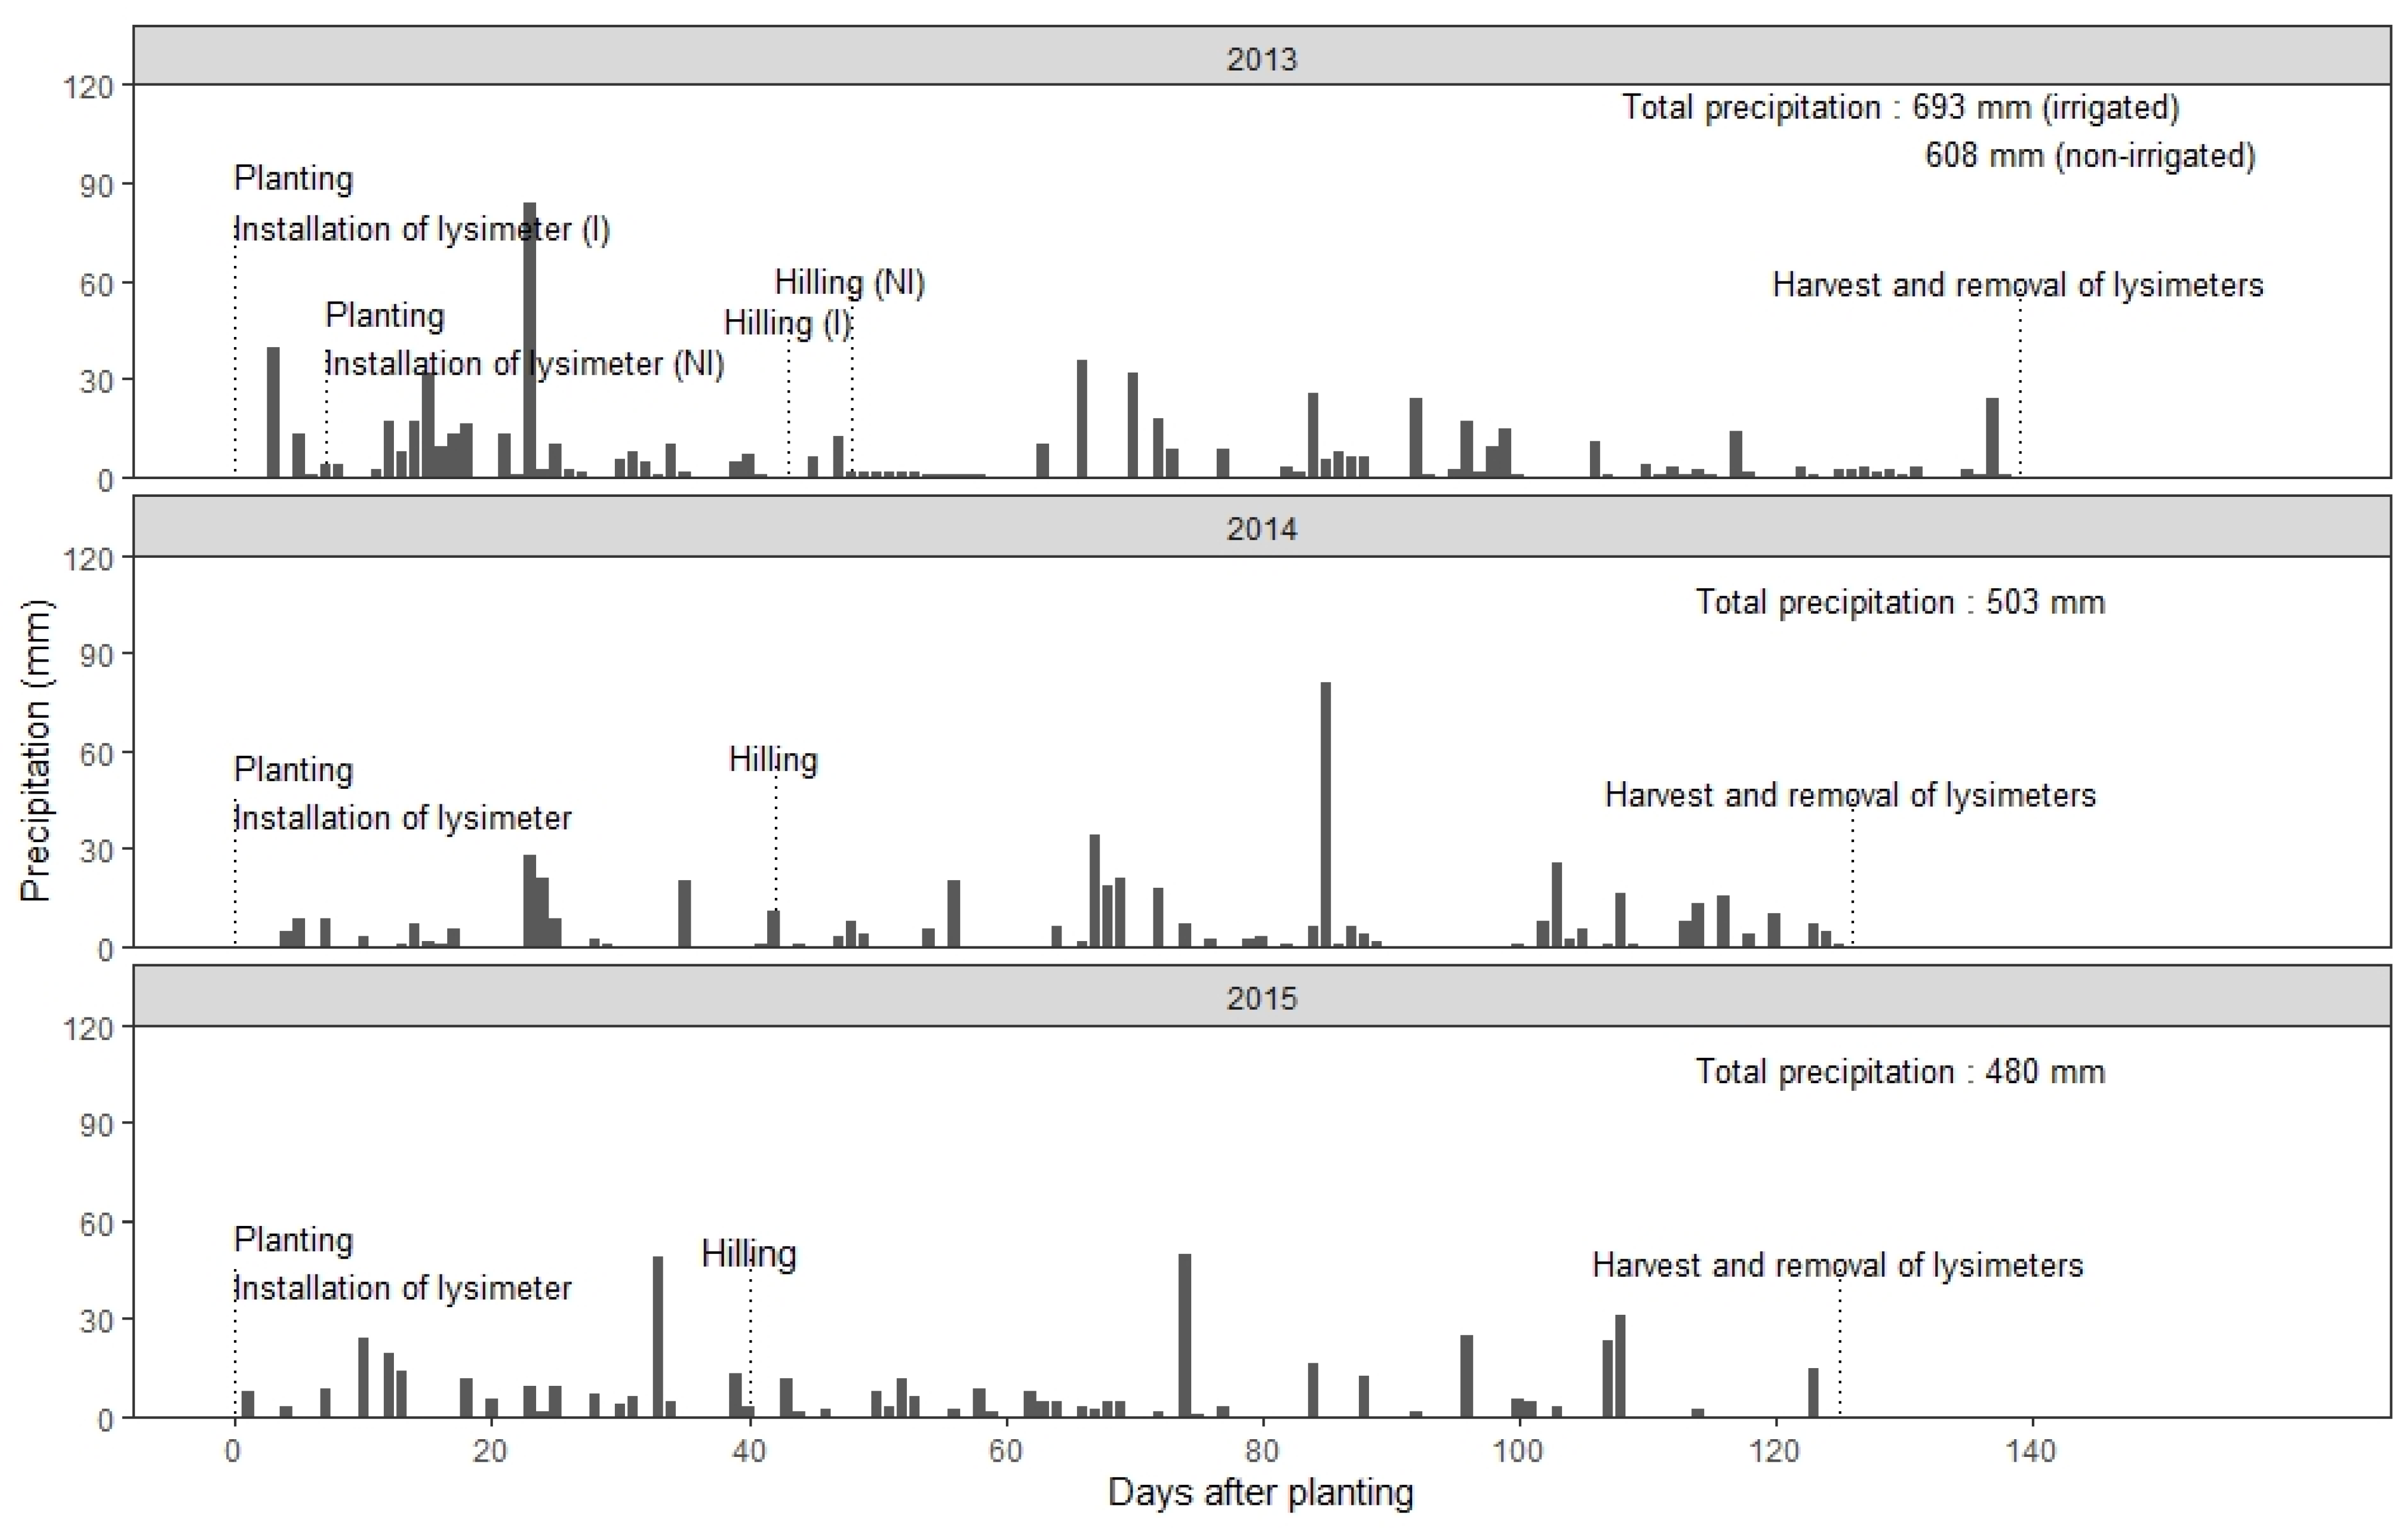
Growing season precipitation (May–September) was greater in 2013, and lower in 2014 and 2015, in comparison to the long-term (1981–2010) average precipitation of 564 mm [30]. In 2013, there was more precipitation between planting and harvest in the irrigated site (693 mm) than in the non-irrigated site (608 mm) due to different planting dates (Figure 2). In contrast, both sites received the same amount of precipitation during this period in 2014 (503 mm) and 2015 (480 mm).
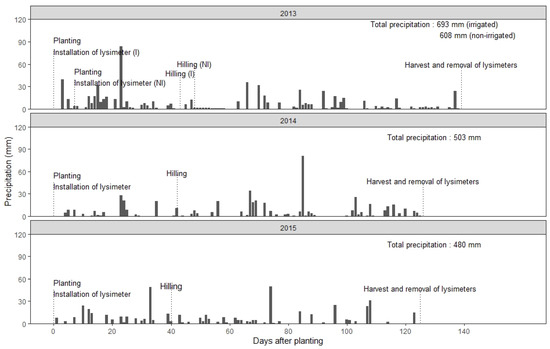
Figure 2.
Daily precipitation and main field operations in 2013, 2014, and 2015 at irrigated (I) and non-irrigated (NI) sites.
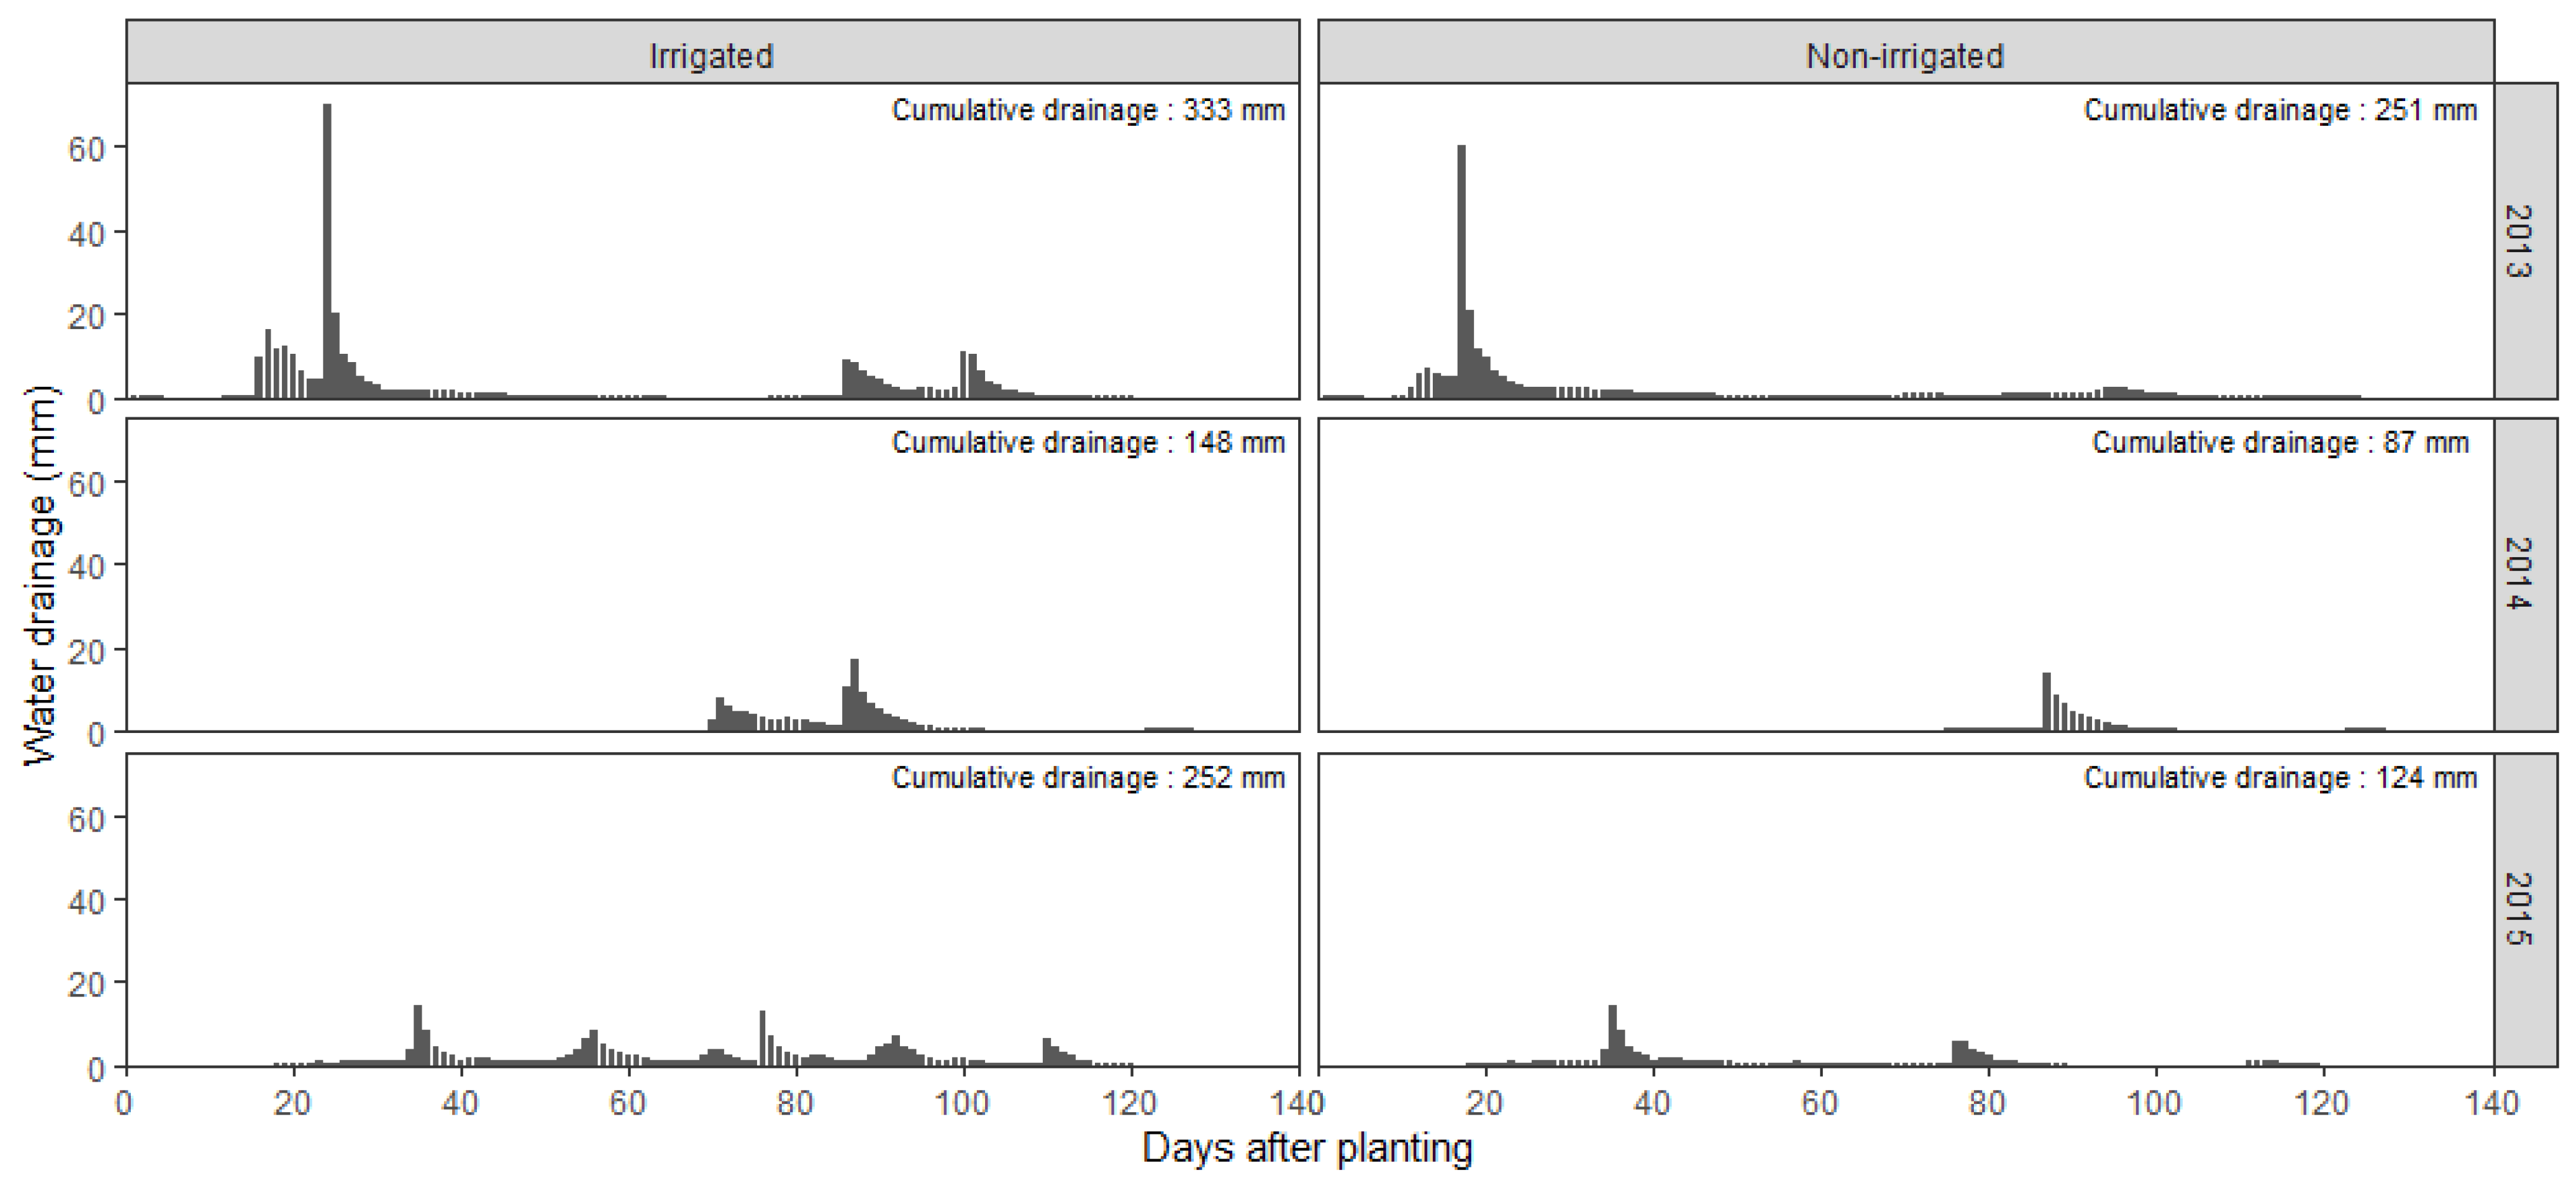
In addition, water added by irrigation in the irrigated sites totaled 66 mm in 2013 and 2014, and 132 mm in 2015. Water drainage during the growing season averaged 292 mm in 2013, 118 mm in 2014, and 188 mm in 2015. Growing season evapotranspiration was greater in 2014 (360 mm) than in 2015 (340 mm; data not shown). As a result, there was a greater amount of water drained beyond the 90-cm soil depth in the non-irrigated site in 2015 than in 2014, although precipitation was greater in 2014 than in 2015. Unsurprisingly, cumulative water drainage was greater in the irrigated than in the non-irrigated sites (Figure 3).
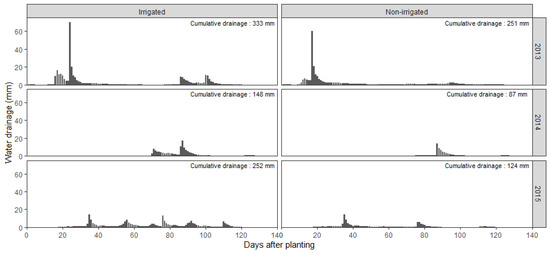
Figure 3.
Water drainage during the growing season at the irrigated and non-irrigated sites in 2013, 2014, and 2015. Higher FWNC was measured for PCU + urea compared to PCU without irrigation, whereas no statistical difference was found between PCU and PCU + urea under irrigation. A priori contrasts showed no significant difference in FWNC between the CONV treatment and PCU or PCU + urea applied at the equivalent N rate (200 kg N ha−1).
3.2. Nitrate Concentrations in Soil Solution
The mean FWNC ranged from 14 to 63 mg L−1 during the 3-year experiment. Application of N fertilizer resulted in a significant increase in FWNC compared to the N0 treatment (Table 2). The FWNC increased linearly with increasing N rate in the irrigated site but not in the non-irrigated site. There was also a significant fertilizer source × site interaction on FWNC.
Table 2.
Flow-weighted mean NO3−-N concentrations as affected by nitrogen fertilization and irrigation.
3.3. Seasonal Nitrate Leaching
Fertilizer N application strongly (p < 0.0001) increased the seasonal NO3−-N leaching in comparison to the N0 treatment (Table 3). There was a significant interaction of fertilizer N rate by site (or irrigation) on seasonal NO3−-N leaching, where increasing the N rate significantly increased seasonal NO3−-N leaching in the irrigated site, but not in the non-irrigated site. There was also a significant fertilizer N source × site (or irrigation) interaction on the seasonal NO3−-N leaching (p < 0.05).
Table 3.
Irrigation and nitrogen rate effect on seasonal NO3−-N leaching.
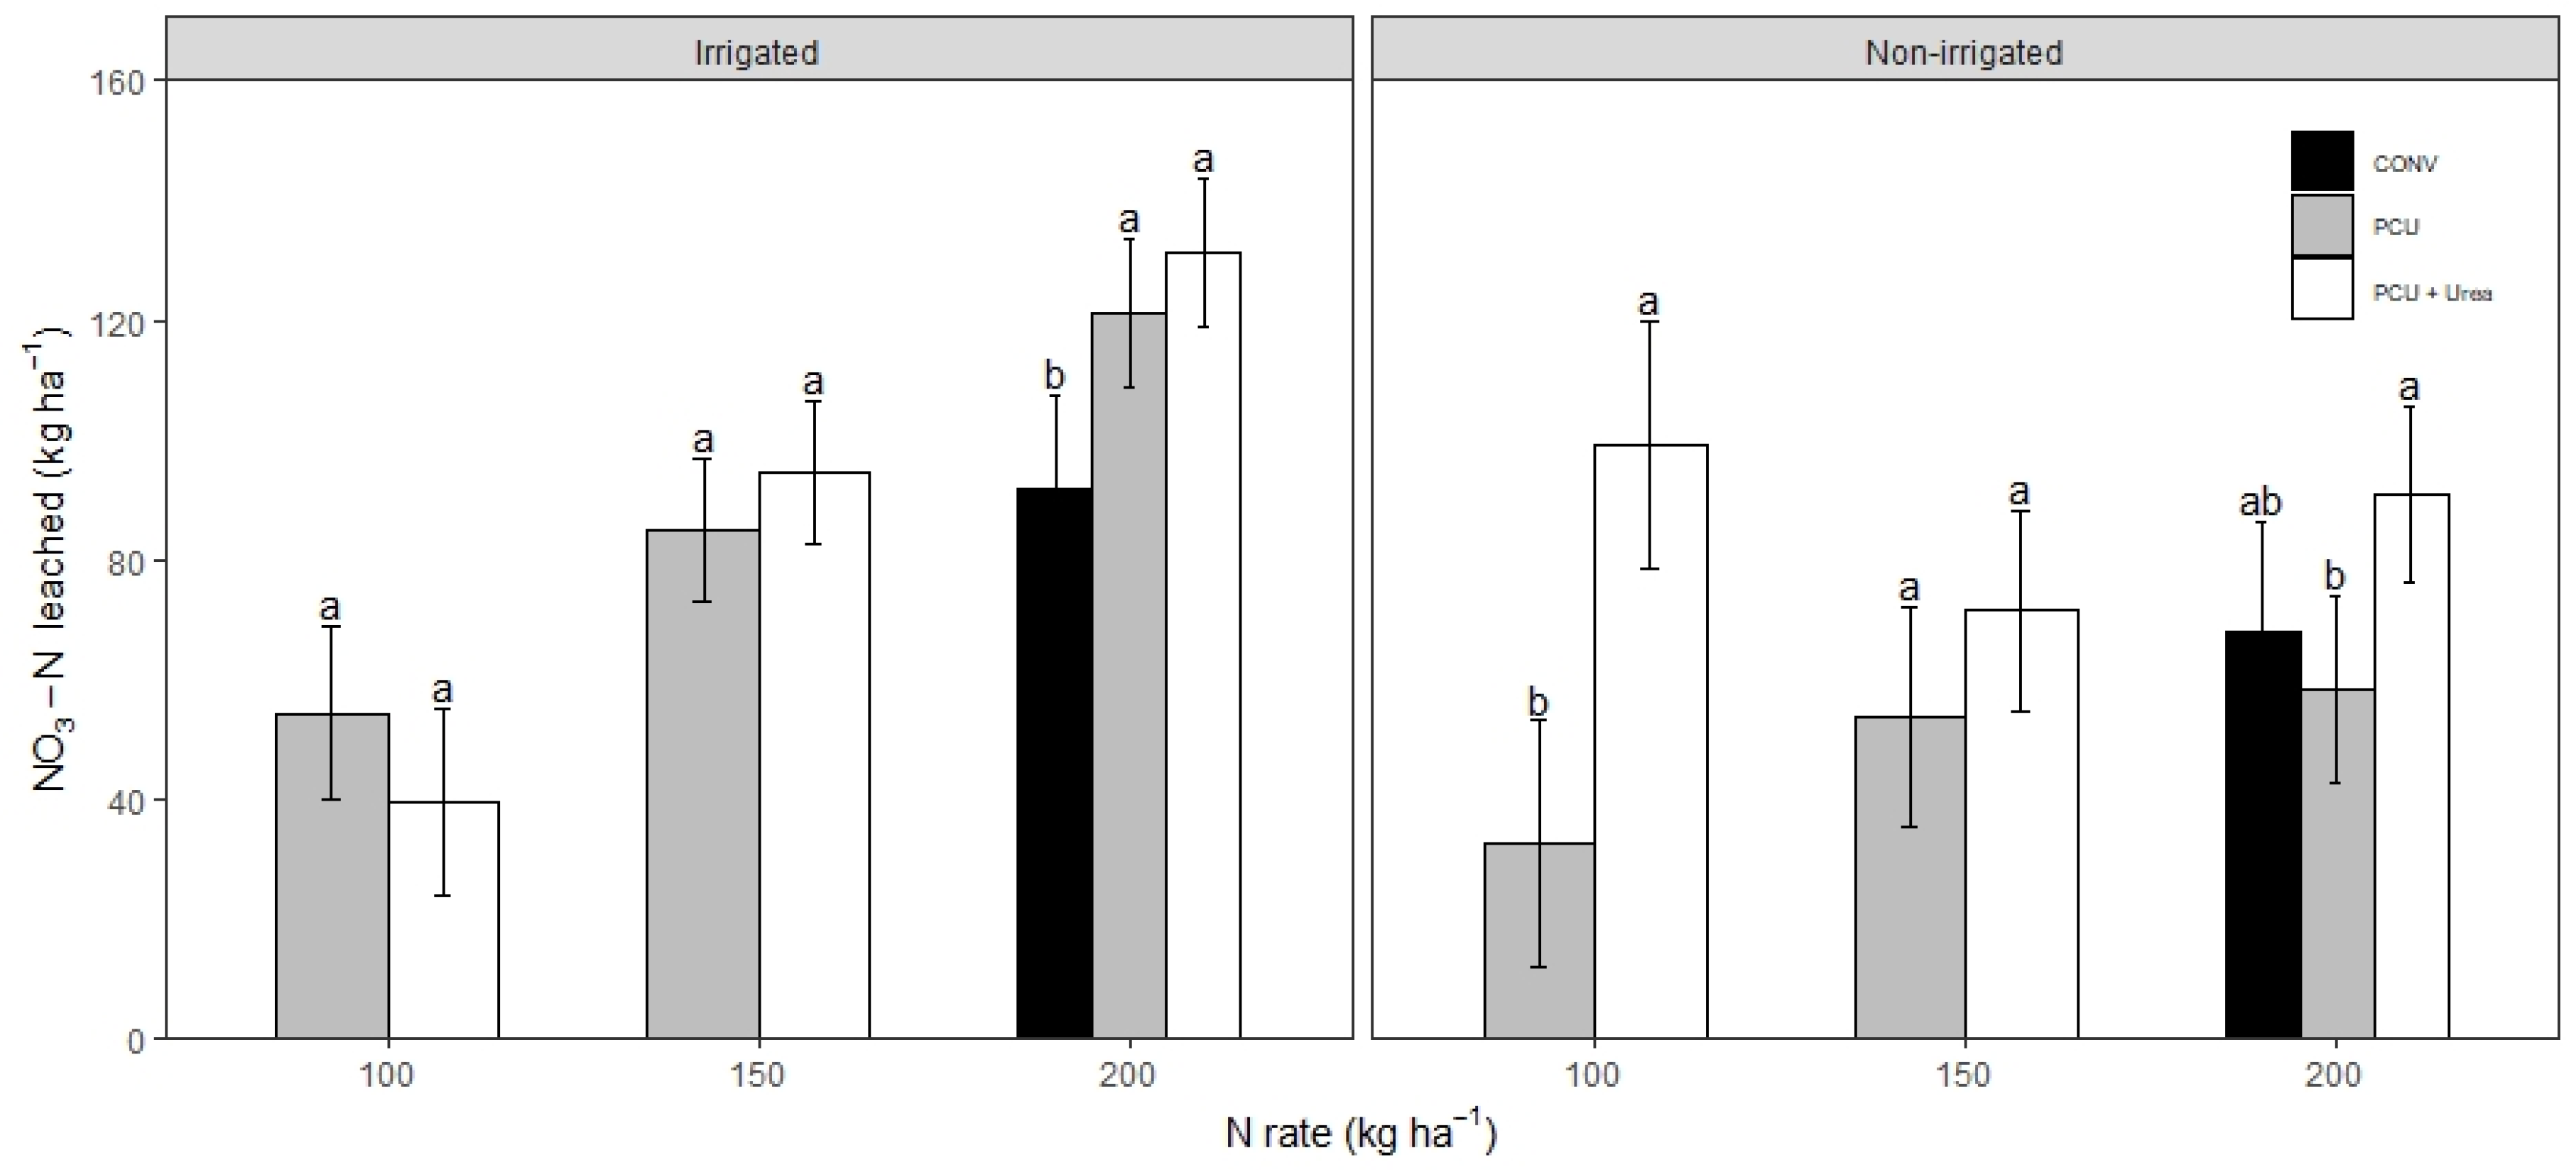
In the non-irrigated site, the use of PCU alone reduced the seasonal NO3−-N leaching by 25 to 67% in comparison to the PCU + urea mixture, whereas, in the irrigated site, there was no significant effect of fertilizer N source on seasonal NO3−-N leaching (Figure 4).
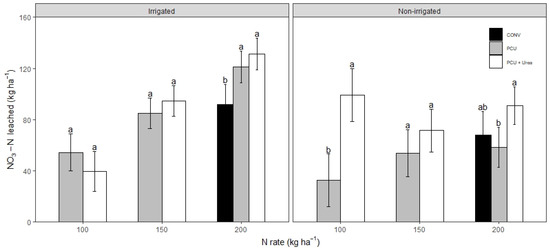
Figure 4.
Average seasonal NO3−-N leaching in the irrigated and the non-irrigated sites as affected by the fertilizer N source and rate during the 3-year experiment. For a same N rate, the bars topped with same letters are not significantly different at p = 0.05 probability level. CONV, conventional nitrogen management in Quebec consisting of a split application of 200 kg N ha−1 as a mixture of 50% ammonium sulfate at planting and 50% calcium ammonium nitrate at hilling; PCU, polymer-coated urea applied at planting at three different N rates (100, 150, and 200 kg N ha−1); PCU + urea, a mixture of 75% PCU + 25% urea banded at planting at three different N rates (100, 150, and 200 kg N ha−1).
In comparison to the CONV treatment, application of PCU and PCU + urea at the equivalent N rate significantly increased seasonal NO3−-N leaching in the irrigated site by 32% and 43%, respectively. In the non-irrigated site, there was no significant difference between the CONV treatment, and PCU and PCU + urea applied at a rate of 200 kg N ha−1. On average, across all fertilizer N treatments, seasonal NO3−-N leaching was 52% greater in the irrigated than in the non-irrigated site.
3.4. Total and Marketable Tuber Yield
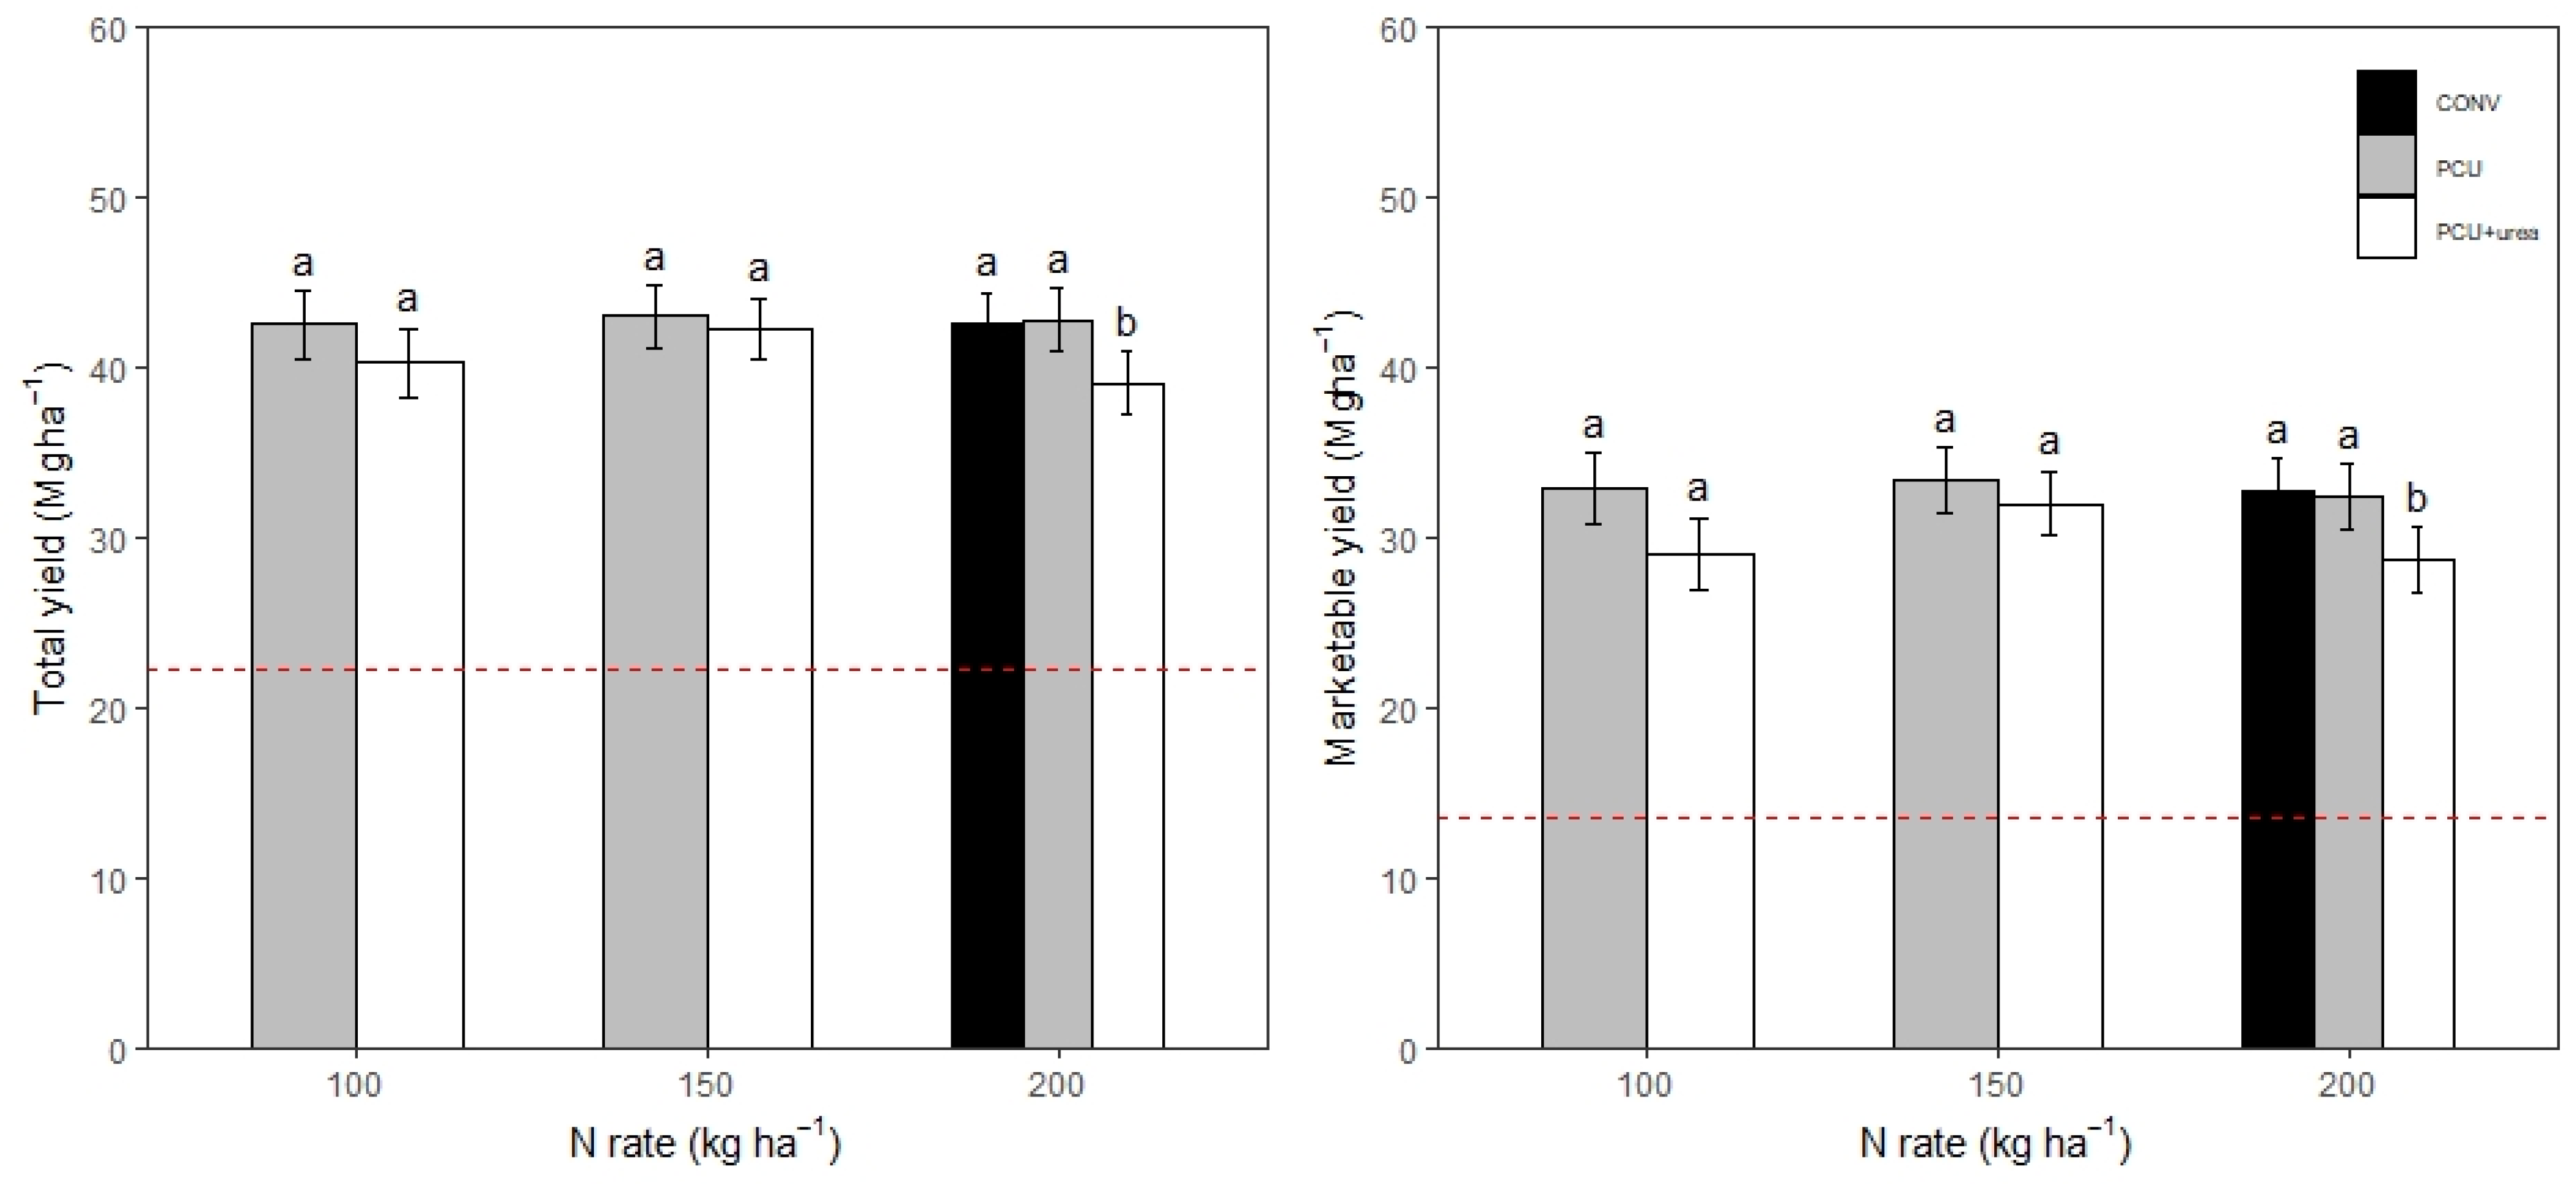
Application of N fertilizer resulted in a significant increase in TY and MY compared to the N0 treatment (Table 4). The fertilizer N source had a significant effect on TY and MY (Table 4). When averaged over fertilizer N rate, TY and MY were significantly greater for PCU than for PCU + urea (Table 5). There was no significant difference in both TY and MY between the CONV treatment and PCU applied at the same N rate (200 kg N ha−1). In contrast, TY and MY were greater for the CONV treatment than for PCU + urea applied at the equivalent rate of 200 kg N ha−1 (Figure 5). While irrigation did result in numerically greater TY and MY (Table 5), there was no significant difference between the irrigated and non-irrigated sites (Table 4).
Table 4.
Analysis of variance of the effect of fertilizer N rate and source, and irrigation on total yield, marketable yield, total N uptake, apparent N recovery, and aboveground dry matter.
Table 5.
Effect of nitrogen fertilization on total and marketable tuber yield, and apparent N recovery.
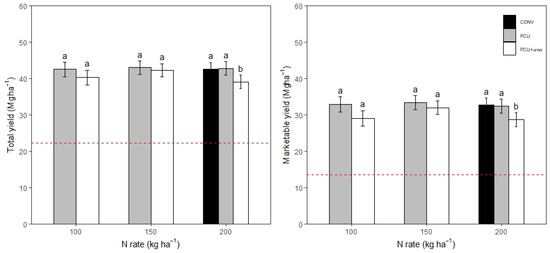
Figure 5.
Effect of nitrogen treatments on total (TY) and marketable (MY) tuber yield averaged over irrigation regime. For a same N rate, the bars topped with same letters are not significantly different at p = 0.05 probability level. The dashed lines represent tuber yield without fertilizer N application. CONV, conventional nitrogen management in Quebec consisting of a split application of 200 kg N ha−1 as a mixture of 50% ammonium sulfate at planting and 50% calcium ammonium nitrate at hilling; PCU, polymer-coated urea applied at planting at three different N rates (100, 150, and 200 kg N ha−1); PCU + urea, a mixture of 75% PCU + 25% urea banded at planting at three different N rates (100, 150, and 200 kg N ha−1).
3.5. Nitrogen Uptake, Apparent N Recovery, and Aboveground Dry Matter
Nitrogen fertilizer significantly increased total N uptake compared to the N0 treatment (Table 6). Unsurprisingly, there was a linear increase in the total N uptake with the increasing N rate. In contrast, the N rate had no significant effect on ANR.
Table 6.
Effect of N treatment on total N uptake, aboveground dry matter and apparent N recovery averaged over irrigation regime.
The total N uptake was significantly influenced by the N source. The use of the PCU + urea mixture resulted in greater total N uptake compared to the PCU. In addition, there was an improvement in the total N uptake with the PCU + urea mixture applied at 200 kg N ha−1 as compared to the CONV treatment (Table 6).
The ANR was also significantly influenced by the N source and was 12% higher with the PCU + urea mixture than with the PCU alone. The CONV treatment resulted in an ANR that was similar to the PCU, and 14% lower than the PCU + urea mixture, when applied at the equivalent N rate of 200 kg ha−1 (Table 6). There was no effect of irrigation on the total N uptake and on the ANR (data not shown).
The aboveground dry matter accumulation response was significant to fertilizer N application, but not to irrigation (Table 4). The PCU + urea mixture had greater aboveground dry matter accumulation compared to the PCU (Table 6). In addition, the PCU + urea resulted in greater aboveground dry matter accumulation compared to the CONV when applied at the equivalent N rate. There was a linear increase in aboveground dry matter accumulation with increasing N rates.
3.6. Residual Soil Inorganic Nitrogen
Both residual soil NO3−-N and NH4+-N content to 90-cm depth were significantly greater in fertilized treatments than in the N0 treatment (Table 7). In the fertilized treatments, residual soil NO3−-N and NH4+-N content increased linearly with increasing fertilizer N rate. The CONV treatment resulted in lower quantities of residual soil inorganic N in comparison to the PCU alone and the PCU + urea mixture when applied at the equivalent N rate of 200 kg N ha−1. There was no significant difference in residual soil inorganic N between the PCU and PCU + urea N sources. Irrigation also had no significant effect on residual soil inorganic N.
Table 7.
Effect of N fertilization (rate and source) on residual soil NO3−-N and NH4+-N content (0–90 cm) in fall and in the following spring.
Soil NO3−-N and soil NH4+-N contents measured to 90-cm depth in spring decreased considerably compared to those measured in the previous fall. Soil NO3−-N and soil NH4+-N ranged from 4.7 to 7.6 kg NO3−-N ha−1 and from 9.7 and 15 kg NH4+-N ha−1 in comparison to 24 to 89 kg NO3−-N ha−1 and 23 to 75 kg NH4+-N ha−1 in the preceding fall (Table 7). The N fertilization strategy (rate and source) and the irrigation had no significant effect on the soil inorganic N content (NO3−-N, NH4+-N) in the following spring and, consequently, the largest decreases in soil inorganic N over winter were associated with the treatments with the greatest fall residual soil inorganic N content.
4. Discussion
4.1. Effect of Irrigation
Irrigation of potatoes is essential to reach maximum yield in areas of inadequate or infrequent precipitation, particularly on soils with low water-holding capacity [31]. In the current study, the lack of significant differences in TY and MY between irrigated and non-irrigated conditions may be explained by low moisture deficits during the growing seasons. The cumulative crop evapotranspiration during the growing season was 393 mm in 2013, 359 mm in 2014, and 348 mm in 2015 (data not shown). In comparison, growing season precipitation during the 3-year study totaled 608, 503, and 480 mm in 2013–2015, respectively. Since precipitation greatly exceeded crop evapotranspiration, the need for supplemental irrigation was minimal. Bélanger et al. [32] found a positive response of TY and MY to irrigation in years of inadequate precipitation and neutral to negative response in years of low moisture deficits. Similarly, Alva et al. [33] reported no significant effect of irrigation on potato tuber yield under low growing season crop evapotranspiration. These results indicated that irrigation should always be based on climatic data to estimate crop water requirements.
Deep water percolation is one of the determining factors for NO3−-N losses as leaching occurs when elevated soil NO3−-N contents coexist with the downward movement of soil water from the root zone. Consequently, N losses by leaching usually increase in seasons with high amounts of water percolation [34]. It is also well-known that deep water percolation increases with the magnitude of water inputs (precipitation or irrigation) [35,36,37]. In the current study, there were no significant differences in FWNC between the two sites (Table 2), indicating that the increased percolation under irrigation is the primary cause of the significantly enhanced NO3−-N leaching in the irrigated site versus the non-irrigated site. For a total applied irrigation of 66 mm in 2013 and 2014, and 132 mm in 2015, deep-water percolation in the irrigated site was increased by 82, 61, and 128 mm compared to the non-irrigated site, respectively. In 2013, however, the greater deep-water percolation in the irrigated site may also be due to growing season precipitation, which was 14% greater than in the non-irrigated site due to a difference in planting date between the two sites. Previous studies also found that irrigation increased the amount of NO3−-N leached [38,39].
Since growing season NO3−-N leaching was greater in the irrigated site than in the non-irrigated site, irrigation was expected to reduce residual soil inorganic N. However, the difference between the two sites was not significant, although residual soil NO3−-N content (0–90 cm) was numerically lower with irrigation than without irrigation (Table 7). This was attributed to the effects of irrigation on some parts of the soil N cycle that may impact both the growing season NO3−-N leaching and the residual soil inorganic N content. For example, the more favorable soil moisture content under irrigation may have increased net soil N mineralization late in the season [40,41], which compensated for the enhanced N losses. Similar to the current study, Bélanger et al. [42] also reported no effect of irrigation on residual soil NO3−-N content (0–90 cm) for three of the nine sites in a field experiment in New-Brunswick, Canada.
4.2. Effect of Fertilizer N Management
4.2.1. Effect of Fertilizer N Rate
There was a lack of response of TY and MY to N rate above 100 kg N ha−1, attributed to a high soil N supply from soil N mineralization [43]. Nitrogen uptake increased with increasing N rate (Figure 5) and was within the range reported in previous studies [12,15,44]. In the N0 treatment, N uptake was lower than that obtained by Zebarth et al. [44]. This was attributed to medium-textured soils used in Zebarth et al. [44], which may have resulted in more soil N mineralization and less NO3−-N leaching in the N0 treatment in comparison to the coarse-textured soil used in this study.
Apparent N recovery tended to decrease with increasing N rate, although this was not significant. This was in agreement with previous studies [15,45]. The ANR varied between 62 and 83%, which was similar to the values reported by Cambouris et al. [15] and greater than those reported by Zvomuya et al. [12].
Seasonal NO3−-N leaching for the N0 treatment averaged 40 kg NO3−-N ha−1 in the irrigated site and 17 kg NO3−-N ha−1 in the non-irrigated one. This indicates, together with the crop N uptake from the N0 treatment, that there was a fairly large N input from soil through N mineralization. This agreed with previous studies [7,8,12], which reported values ranging from 4 to 68 kg NO3−-N ha−1.
Increasing water percolation generally increases NO3−-N leaching [46]. Results of this study showed that fertilizer N application increased growing season NO3−-N leaching in the irrigated site, but not in the non-irrigated one. This was due to the greater water percolation in the irrigated site compared to the non-irrigated one. The results obtained under irrigation are consistent with previous studies in irrigated potato production systems, where NO3−-N leaching increased with fertilizer N application [9,12,39].
Residual soil inorganic N increased with increasing fertilizer N rate. Similar results were reported in potato production by previous studies [4,16,42,47]. In the N0 treatment, residual soil NO3−-N and NH4+-N content averaged 33 and 25 kg ha−1, respectively (Table 7). The high soil inorganic N content at harvest from the N0 treatment likely reflected a flush of soil N mineralization occurring because of soil rewetting late in the growing season, after plant senescence had begun [45].
4.2.2. Effect of Fertilizer N Source
Polymer-coated urea are N fertilizers that progressively release their urea in response to soil temperature and moisture before its conversion to NO3−-N by soil microbial transformations [48]. The application of PCU aims to improve the profitability of potato production by supplying the right amount of N at the right time. Sufficient N is needed in the initial stages of potatoes to stimulate canopy growth, but too much N early can cause excessive vegetative growth and delay tuber initiation [49], which may result in reduced tuber yield. Nitrogen supply at the first (sprouting) and second (vegetative) growth stages was likely greater from one-time application of PCU + urea at planting compared to that of PCU due to the presence of urea, which is a more soluble N fertilizer. As a result, the potato crop may have taken more N from the PCU + urea than from the PCU during early growth stages (from planting to early in the vegetative growth phase), which may explain the greater total N uptake and ANR for PCU + urea compared to PCU. However, PCU + urea resulted in greater aboveground dry matter accumulation and lower TY and MY relative to PCU, suggesting excessive vegetative growth and delayed tuber initiation.
The application of PCU alone resulted in similar TY and MY to that of CONV, even when applied at lower N rates. This was not surprising, since TY and MY did not respond to N rate above 100 kg N ha−1. Cambouris et al. [15] found no differences in TY and MY between single application of PCU and split applications of ammonium nitrate and ammonium sulfate on irrigated sandy soils. Zebarth et al. [44] also found similar TY with PCU applied at planting and diammonium phosphate plus ammonium nitrate applied at the same rate (193 kg N ha−1) at planting or through split application on a medium-textured soil. Other studies, however, reported greater TY and MY when PCU was used in comparison to conventional soluble N fertilizers applied through split application [17] or at planting [14].
These results, together, indicate that single application of PCU in potato production can maintain tuber yields without the need for multiple N applications, thereby reducing the cost and the time associated with split N fertilizer applications. However, due to the greater cost of the PCU relative to conventional N fertilizers, evidence of the overall economic advantages of using the PCU in potato production will be needed to influence the adoption of PCU by producers [15].
The use of PCU products in potato production systems aims to mitigate environmental impacts of N fertilization by reducing NO3−-N leaching in comparison to conventional soluble N fertilizers [7,12]. Application of PCU significantly reduced FWNC and growing season NO3-N leaching relative to PCU + urea in the non-irrigated site, but not in the irrigated one. This was likely due to the timing of soil N availability and deep-water percolation. The PCU products may release less than 60% of their N by 50 DAP [3]. Consequently, PCU + urea likely increased soil NO3−-N availability in the root zone early in the growing season relative to PCU due to the presence of urea. During this period, deep-water percolation in the non-irrigated site was high in 2013 (213 mm), but low in 2014 and 2015 (Figure 2). This suggests that greater growing season NO3−-N leaching occurred in the non-irrigated site in 2013 for PCU + urea relative to PCU, which made the overall difference between the two fertilizer N sources significant.
In the irrigated site, irrigation water induced an average of 271 mm of deep-water percolation during the tuber bulking stage (between 49 and 93 DAP), when soil NO3−-N concentration in the root zone was high for both fertilizer N sources. As the release of nearly a half of the N from the PCU product was expected during this time [7], there was likely high soil NO3−-N concentration in the root zone for both PCU and PCU + urea. Consequently, NO3−-N leached from both N sources, which resulted in little difference between the two fertilizer N sources.
The PCU and PCU + urea increased growing season NO3−-N leaching relative to the CONV treatment at the equivalent N rate of 200 kg N ha−1 in the irrigated site, but not in the non-irrigated one. This was also attributed to the timing of soil N availability and deep-water percolation. The CONV treatment was split-applied at planting and hilling, and as a conventional soluble N fertilizer, its N was immediately available in the root zone before the irrigation period, when deep-water percolation was relatively low. In contrast, PCU products likely released their N later in the growing season, which coincided with the irrigation period at the tuber bulking stage. Clément et al. [16] also reported greater NO3−-N leaching during the growing season by PCU compared to conventional soluble fertilizers when NO3−-N leaching during the stage of tuber bulking was increased.
The use of PCU products (PCU and PCU + urea) increased the potential for N losses after the growing season relative to the CONV treatment at the equivalent N rate (200 kg N ha−1) by increasing the residual soil inorganic N. This was consistent with Zvomuya et al. [12], Venterea et al. [13], and Clément et al. [16], who obtained greater residual soil inorganic N from plots treated with PCU compared with soluble N fertilizers. Although not significant, residual soil inorganic N was numerically greater with PCU compared to PCU + urea, reflecting the greater total N uptake and NO3−-N leaching during the growing season with PCU + urea treatments.
5. Conclusions
This study evaluated the use of PCU alone and a PCU + urea mixture, banded all at planting, compared with split applied CONV treatment in irrigated and non-irrigated potato production. Irrigation significantly increased growing season NO3−-N leaching, but not TY and MY. These findings were attributed to the low moisture deficits during the 3-year experiment. The results demonstrate that PCU can produce similar potato yields than split application of soluble N fertilizers at equivalent N rates. Despite lower plant N uptake and ANR, PCU resulted in greater tuber yields compared to PCU + urea. This was attributed to an excessive vegetative crop growth and a delayed tuber initiation for PCU + urea caused by an excess of available N early in the growing season due to the presence of urea. The effect of the fertilizer N source on growing season NO3−-N leaching was controlled by the timing of soil N availability and deep-water percolation. Whether used alone or mixed with urea, PCU products tended to increase residual soil inorganic N relative to conventional soluble N fertilizers, suggesting an increased potential for NO3−-N leaching after harvest.
The overall results indicate that the application of PCU + urea at planting may not be profitable in terms of tuber yield in sandy soils in comparison to PCU alone or split-applied conventional soluble N fertilizers. Furthermore, the use of PCU alone is environmentally a better choice than the PCU + urea mixture. However, the results also suggest that the potential of PCU to reduce growing season NO3−-N leaching may vary according to the timing of precipitation and irrigation.
Author Contributions
Conceptualization, C.-C.C. and A.N.C.; methodology, C.-C.C. and A.N.C.; statistical analysis, C.-C.C.; writing—original draft preparation, C.-C.C.; writing—review and editing, A.N.C., N.Z., B.J.Z. and A.K.; supervision, A.N.C. and A.K. project administration, A.N.C.; funding acquisition, A.N.C. and N.Z. All authors have read and agreed to the published version of the manuscript.
Funding
This research was supported by Agriculture and Agri-food Canada, grant number J-000991.
Acknowledgments
The authors would like to acknowledge the technical assistance provided by Mario Deschênes, Sylvie Michaud, and Sarah-Maude Parent.
Conflicts of Interest
The authors declare no conflict of interest.
References
- CRAAQ. Guide de Référence en Fertilisation, 2nd ed.; Parent, L.É., Gagné, G., Eds.; Centre de Référence en Agriculture et Agroalimentaire du Québec (CRAAQ): Ste-Foy, QC, Canada, 2010; p. 473. [Google Scholar]
- Zebarth, B.J.; Bélanger, G.; Cambouris, A.N.; Ziadi, N. Nitrogen fertilization strategies in relation to potato tuber yield, quality, and crop N recovery. In Sustainable Potato Production: Global Case Studies; He, Z., Larkin, R., Honeycutt, W., Eds.; Springer: Dordrecht, The Netherlands, 2012; pp. 165–186. [Google Scholar]
- Wilson, M.L.; Rosen, C.J.; Moncrief, J.F. Potato response to a polymer-coated urea on an irrigated coarse-textured soil. Agron. J. 2009, 101, 897–905. [Google Scholar] [CrossRef]
- Errebhi, M.; Rosen, C.J.; Gupta, S.C.; Birong, D.E. Potato yield response and nitrate leaching as influenced by nitrogen management. Agron. J. 1998, 90, 10–15. [Google Scholar] [CrossRef]
- Zebarth, B.J.; Rosen, C.J. Research perspective on nitrogen bmp development for potato. Am. J. Potato Res. 2007, 84, 3–18. [Google Scholar] [CrossRef]
- Cambouris, A.N.; Zebarth, B.J.; Nolin, M.C.; Laverdière, M.R. Apparent fertilizer nitrogen recovery and residual soil nitrate under continuous potato cropping: Effect of N fertilization rate and timing. Can. J. Soil Sci. 2008, 88, 813–825. [Google Scholar] [CrossRef] [Green Version]
- Wilson, M.L.; Rosen, C.J.; Moncrief, J.F. Effects of polymer-coated urea on nitrate leaching and nitrogen uptake by potato. J. Environ. Qual. 2010, 39, 492–499. [Google Scholar] [CrossRef]
- Maharjan, B.; Venterea, R.T.; Rosen, C. Fertilizer and irrigation management effects on nitrous oxide emissions and nitrate leaching. Agron. J. 2014, 106, 703–714. [Google Scholar] [CrossRef] [Green Version]
- Clément, C.-C.; Cambouris, A.N.; Ziadi, N.; Zebarth, B.J.; Karam, A. Growing season nitrate leaching as affected by nitrogen source and rate in irrigated potato production on sandy soils. Agron. J. 2020, 112, 3773–3787. [Google Scholar] [CrossRef]
- Hutchinson, C.; Simonne, E.; Solano, P.; Meldrum, J.; Livingston-Way, P. Testing of Controlled Release Fertilizer Programs for Seep Irrigated Irish Potato Production. J. Plant Nutr. 2002, 26, 1709–1723. [Google Scholar] [CrossRef]
- Gao, X.; Li, C.; Zhang, M.; Wang, R.; Chen, B. Controlled release urea improved the nitrogen use efficiency, yield and quality of potato (Solanum tuberosum L.) on silt loamy soil. Field Crop. Res. 2015, 181, 60–68. [Google Scholar] [CrossRef]
- Zvomuya, F.; Rosen, C.J.; Russelle, M.P.; Gupta, S.C. Nitrate leaching and nitrogen recovery following application of polyolefin-coated urea to potato. J. Environ. Qual. 2003, 32, 480–489. [Google Scholar] [CrossRef]
- Venterea, R.T.; Hyatt, C.R.; Rosen, C.J. fertilizer management effects on nitrate leaching and indirect nitrous oxide emissions in irrigated potato production. J. Environ. Qual. 2011, 40, 1103–1112. [Google Scholar] [CrossRef] [Green Version]
- Ziadi, N.; Grant, C.; Samson, N.; Nyiraneza, J.; Bélanger, G.; Parent, L.-É. Efficiency of controlled-release urea for a potato production system in Quebec, Canada. Agron. J. 2011, 103, 60–66. [Google Scholar] [CrossRef]
- Cambouris, A.N.; St. Luce, M.; Zebarth, B.J.; Ziadi, N.; Grant, C.A.; Perron, I. Potato response to nitrogen sources and rates in an irrigated sandy soil. Agron. J. 2016, 108, 391–401. [Google Scholar] [CrossRef]
- Clément, C.-C.; Cambouris, A.N.; Ziadi, N.; Zebarth, B.J.; Karam, A. Nitrogen source and rate effects on residual soil nitrate and overwinter NO3-N losses for irrigated potatoes on sandy soils. Can. J. Soil Sci. 2019, 100, 44–57. [Google Scholar] [CrossRef]
- Soil Survey Staff. Keys to Soil Taxonomy, 12th ed.; USDA-Natural Resources Conservation Service: Washington, DC, USA, 2014. [Google Scholar]
- Kroetsch, D.; Wang, C. Particle size distribution. In Soil Sampling and Methods of Analysis, 2nd ed.; Carter, M.R., Gregorich, E.G., Eds.; CRC Press: Boca Raton, FL, USA, 2007; pp. 713–725. [Google Scholar]
- Hendershot, W.H.; Lalande, H.; Duquette, M. Ion exchange and exchangeable cations. In Soil Sampling and Methods of Analysis, 2nd ed.; CRC Press: Boca Raton, FL, USA, 2007. [Google Scholar]
- Maynard, D.G.; Kalra, Y.P.; Crumbaugh, J.A. Nitrate and exchangeable ammonium nitrogen. In Soil Sampling and Methods of Analysis, 2nd ed.; Carter, M.R., Gregorich, E.G., Eds.; CRC Press: Boca Raton, FL, USA, 2007; pp. 71–80. [Google Scholar]
- Nkonge, C.; Ballance, G.M. A sensitive colorimetric procedure for nitrogen determination in micro-Kjeldahl digests. J. Agric. Food Chem. 1982, 30, 416–420. [Google Scholar] [CrossRef]
- Hao, X.; Ball, B.C.; Culley, J.L.B.; Carter, M.R.; Parkin, G.W. Soil density and porosity. In Soil Sampling and Methods of Analysis, 2nd ed.; Carter, M.R., Gregorich, E.G., Eds.; CRC Press: Boca Raton, FL, USA, 2007; pp. 743–759. [Google Scholar]
- Šimůnek, J.; van Genuchten, M.T.; Šejna, M. Development and Applications of the HYDRUS and STANMOD Software Packages and Related Codes. Vadose Zone J. 2008, 7, 587–600. [Google Scholar] [CrossRef] [Green Version]
- Li, Y.; Šimůnek, J.; Jing, L.; Zhang, Z.; Ni, L. Evaluation of water movement and water losses in a direct-seeded-rice field experiment using Hydrus-1D. Agric. Water Manag. 2014, 142, 38–46. [Google Scholar] [CrossRef] [Green Version]
- Schaap, M.G.; Leij, F.J.; van Genuchten, M.T. Neural Network Analysis for Hierarchical Prediction of Soil Hydraulic Properties. Soil Sci. Soc. Am. J. 1998, 62, 847–855. [Google Scholar] [CrossRef]
- Allen, R.G.; Pereira, L.S.; Raes, D.; Smith, M. Crop Evapotranspiration: Guidelines for Computing Crop Water Requirements; Food and Agriculture Organization of the United Nations: Rome, Italy, 1998. [Google Scholar]
- Feddes, R.; Kowalik, P.; Zaradny, H. Simulation of Field Water Use and Crop Yield; Centre for Agricultural Publishing and Documentation: Wageningen, The Netherlands, 1978. [Google Scholar]
- Wesseling, J.; Elbers, J.; Kabat, P.; Van Den Broek, B. SWATRE: Instructions for Input; Internal Note; Winand Staring Centre: Wageningen, The Netherlands; International Waterlogging and Salinity Research Institute: Lahore, Pakistan, 1991; p. 29. [Google Scholar]
- SAS Institute. SAS/STAT 9.3 User’s Guide; SAS Inst.: Cary, NC, USA, 2010. [Google Scholar]
- Environnement Canada. Canadian Climate Normals 1981–2010 Station Data. Available online: https://climate.weather.gc.ca/climate_normals/results_1981_2010_e.html?searchType=stnName&txtStationName=JEAN+ESAGE&searchMethod=contains&txtCentralLatMin=0&txtCentralLatSec=0&txtCentralLongMin=0&txtCentralLongSec=0&stnID=5251&dispBack=1 (accessed on 15 March 2021).
- Ojala, J.C.; Stark, J.C.; Kleinkopf, G.E. Influence of irrigation and nitrogen management on potato yield and quality. Am. Potato J. 1990, 67, 29–43. [Google Scholar] [CrossRef]
- Bélanger, G.; Walsh, J.R.; Richards, J.E.; Milburn, P.H.; Ziadi, N. Yield response of two potato culivars to supplemental irrigation and N fertilization in New Brunswick. Am. J. Potato Res. 2000, 77, 11–21. [Google Scholar] [CrossRef]
- Alva, A.K.; Collins, H.P.; Boydston, R.A. Corn, wheat, and potato crop residue decomposition and nitrogen mineralization in sandy soil under and irrigated potato rotation. Commun. Soil Sci. Plant Anal. 2002, 33, 2643–2651. [Google Scholar] [CrossRef]
- Di, H.J.; Cameron, K.C. Nitrate leaching in temperate agroecosystems: Sources, factors and mitigating strategies. Nutr. Cycl. Agroecosyst. 2002, 64, 237–256. [Google Scholar] [CrossRef]
- Ochoa, C.G.; Fernald, A.G.; Guldan, S.J.; Shukla, M.K. Deep Percolation and its Effects on Shallow Groundwater Level Rise Following Flood Irrigation. Trans. ASABE 2007, 50, 73–81. [Google Scholar] [CrossRef]
- Min, L.; Shen, Y.; Pei, H. Estimating groundwater recharge using deep vadose zone data under typical irrigated cropland in the piedmont region of the North China Plain. J. Hydrol. 2015, 527, 305–315. [Google Scholar] [CrossRef]
- Xu, B.; Shao, D.; Tan, X.; Yang, X.; Gu, W.; Li, H. Evaluation of soil water percolation under different irrigation practices, antecedent moisture and groundwater depths in paddy fields. Agric. Water Manag. 2017, 192, 149–158. [Google Scholar] [CrossRef]
- Poch-Massegú, R.; Jiménez-Martínez, J.; Wallis, K.J.; Ramírez de Cartagena, F.; Candela, L. Irrigation return flow and nitrate leaching under different crops and irrigation methods in Western Mediterranean weather conditions. Agric. Water Manag. 2014, 134, 1–13. [Google Scholar] [CrossRef]
- Woli, P.; Hoogenboom, G.; Alva, A. Simulation of potato yield, nitrate leaching, and profit margins as influenced by irrigation and nitrogen management in different soils and production regions. Agric. Water Manag. 2016, 171, 120–130. [Google Scholar] [CrossRef] [Green Version]
- Cabrera, M.L. Modeling the flush of nitrogen mineralization caused by drying and rewetting soils. Soil Sci. Soc. Am. J. 1993, 57, 63–66. [Google Scholar] [CrossRef]
- Fierer, N.; Schimel, J.P. Effects of drying–rewetting frequency on soil carbon and nitrogen transformations. Soil Biol. Biochem. 2002, 34, 777–787. [Google Scholar] [CrossRef]
- Bélanger, G.; Ziadi, N.; Walsh, J.R.; Richards, J.E.; Milburn, P.H. Residual soil nitrate after potato harvest. J. Environ. Qual. 2003, 32, 607–612. [Google Scholar] [CrossRef]
- Zebarth, B.J.; Drury, C.F.; Tremblay, N.; Cambouris, A.N. Opportunities for improved fertilizer nitrogen management in production of arable crops in eastern Canada: A review. Can. J. Soil Sci. 2009, 89, 113–132. [Google Scholar] [CrossRef]
- Zebarth, B.J.; Snowdon, E.; Burton, D.L.; Goyer, C.; Dowbenko, R. Controlled release fertilizer product effects on potato crop response and nitrous oxide emissions under rain-fed production on a medium-textured soil. Can. J. Soil Sci. 2012, 92, 759–769. [Google Scholar] [CrossRef]
- Zebarth, B.J.; Leclerc, Y.; Moreau, G. Rate and timing of nitrogen fertilization of Russet Burbank potato: Nitrogen use efficiency. Can. J. Plant Sci. 2004, 84, 845–854. [Google Scholar] [CrossRef]
- Bowles, T.M.; Atallah, S.S.; Campbell, E.E.; Gaudin, A.C.; Wieder, W.R.; Grandy, A.S. Addressing agricultural nitrogen losses in a changing climate. Nat. Sustain. 2018, 1, 399–408. [Google Scholar] [CrossRef]
- Zebarth, B.J.; Leclerc, Y.; Moreau, G.; Gareau, R.; Milburn, P.H. Soil inorganic nitrogen content in commercial potato fields in New Brunswick. Can. J. Soil Sci. 2003, 83, 425–429. [Google Scholar] [CrossRef]
- Golden, B.; Slaton, N.; Norman, R.; Gbur, E.; Wilson, C. Nitrogen Release from Environmentally Smart Nitrogen Fertilizer as Influenced by Soil Series, Temperature, Moisture, and Incubation Method. Commun. Soil Sci. Plant Anal. 2011, 42, 1809–1824. [Google Scholar] [CrossRef]
- Vos, J.; Biemond, H. Effects of nitrogen on the development and growth of the potato plant. 1. Leaf Appearance, Expansion Growth, Life Spans of Leaves and Stem Branching. Ann. Bot. 1992, 70, 27–35. [Google Scholar] [CrossRef]
Publisher’s Note: MDPI stays neutral with regard to jurisdictional claims in published maps and institutional affiliations. |
© 2021 by the authors. Licensee MDPI, Basel, Switzerland. This article is an open access article distributed under the terms and conditions of the Creative Commons Attribution (CC BY) license (https://creativecommons.org/licenses/by/4.0/).