1. Introduction
Spider plant (
Cleome gynandra L.) is an important indigenous leafy vegetable in Sub-Saharan Africa. It is an excellent source of minerals, proteins, vitamins, flavonoids, antioxidants and many other compounds [
1,
2,
3]. This vegetable is increasingly becoming a popular vegetable and a cash crop in some parts of Africa, such as Kenya [
4,
5,
6]. In South Africa, the spider plant is collected from the wild [
7]. This vegetable contributes to food security and mitigation of micronutrient deficiencies [
1]. Despite its importance, there is limited information on the extent and structure of genetic variation and the potential for crop improvement by domestication, selection and breeding of spider plant [
8,
9].
Genetic diversity is the source for crop improvement and germplasm conservation [
10,
11]. Therefore, it offers plant breeders an opportunity to develop new and improved cultivars with desirable characteristics [
11]. Genetic diversity between and within species can be assessed by morphological characterization, biochemical evaluation, and molecular marker analysis [
11,
12,
13]. Studies on the morphological characterization of spider plant have been conducted in Kenya and Zimbabwe [
1,
14,
15,
16].
Morphological characters can be influenced by environmental factors while molecular markers are not. Furthermore, molecular makers have been extensively used in many crops to explain the structure of genetic diversity [
17]. Therefore, measuring genetic diversity by molecular analysis is one of the best options for distinguishing more accurately between genotypes [
10,
12]. There are limited studies conducted on the genetic variation of different indigenous leafy vegetables using molecular markers. Previous studies used molecular markers such as simple sequence repeat (SSR) and amplified fragment length polymorphisms (AFLPs) on indigenous leafy vegetables [
10]. The extent of genetic diversity and the relationship between 32 cowpea (
Vigna ungiiculata L.) genotypes from the Iranian germplasm using SSR markers was investigated [
18]. Random amplified polymorphic DNA (RAPD) markers were used in a study involving the diversity of
Solanum species [
19] and several other species [
20,
21,
22,
23,
24].
However, limited work was carried out on the genetic diversity of spider plant using molecular markers. Genetic variation in four spider plant morphotypes from Kenya were assessed using random amplified polymorphic DNA polymerase chain reaction (RAPD-PCR) technology and the morphotypes were grouped into three clusters according to the colour of the stem and petiole [
25]. Ten polymorphic inter simple sequence repeat (ISSR) markers were used to determine the level and organization of spider plant germplasm in Burkina Faso [
26]. Furthermore, genetic variations of spider plant from different countries were investigated using 11 AFLP primer combinations and nine SSR makers [
27]. The main objective of this study was to determine the genetic diversity among local and exotic germplasm of spider plant using SSR markers.
2. Materials and Methods
2.1. Plant Material
Eighteen accessions of spider plant were used (
Table 1). The accessions were obtained from Limpopo, Mpumalanga and Arusha, Tanzania. The accessions possessed some distinct morphological features (
Table 2)—particularly stem colour (
Figure 1). The leaves were harvested from 4-week-old plants that were raised in 5 L plastic bags in a shadehouse at the University of Venda experimental farm and placed in separate Ziploc polybags in a cooler box, and transferred to the Agricultural Research Council (ARC) Infrutec-Niietvoorbij Stellenbosch for molecular analysis.
2.2. DNA Extraction
Genomic DNA was extracted using the cetyl trimethylammonium bromide (CTAB) method according to [
25,
28]. Extraction reagents of 2 mL pre-warmed (65 °C) CTAB buffer [3% (
m/
v) CTAB (Merck (Pty) Ltd., Modderfontein, South Africa), 1% (
m/
v) PVP 40 (Sigma- Aldrich (Merck), St. Louis, MO, USA), 2.0M NaCl (Merck (Pty) Ltd., Modderfontein, South Africa), 20 mM EDTA pH 8 (Merck (Pty) Ltd., Modderfontein, South Africa), 100 mM Tris pH 8 (Melford Laboratories, Chelsworth, Ipswich, UK)] and 0.01 mL β-mercaptoethanol (Merck (Pty) Ltd., Modderfontein, South Africa) were added. A fresh extraction buffer of CTAB and 1% (0.5 g in 50 mL) PVP-40 (polyvinylpyrrolidone) was prepared before extraction. Polyvinylpyrrolidone was added to the extraction buffer to prevent browning due to high polyphenols and other secondary metabolites like flavonoids [
29]. Leaf samples (each weighing 0.5 g) were ground to a fine powder using liquid nitrogen and a mortar and pestle. Immediately after thawing the samples, 2 mL of pre-heated extraction buffer was added to leaf material and further ground into a slurry. The homogenate was transferred to 2 mL Eppendorf tubes while working in a fume hood and 10 μL β-mercaptoethanol was added and mixed by gentle inversion. The tubes were incubated for 1 h at 60 °C. An equal volume of 1 mL chloroform–isoamyl alcohol (Merck (Pty) Ltd., Modderfontein, South Africa) at a ratio of 24:1 was added to the homogenate and mixed by gentle inversion. The tubes were centrifuged at 13,000 rpm for 15 min prior to transferring the upper aqueous phase into a fresh 2 mL Eppendorf tube and five microliters RNase A (10 mg/mL) was added to each tube followed by incubation for 30 min at 37 °C. An equal volume of 1 mL chloroform–isoamyl alcohol (24:1) was added to each tube and mixed by gentle inversion. The tubes were centrifuged again at 13,000 rpm for 15 min. The top aqueous phase was then recovered and precipitated with 0.8 mL isopropanol (Merck (Pty) Ltd., Modderfontein, South Africa) and centrifuged at 13,000 rpm for 15 min. The solution was discarded, and the pellets were washed with 70% ethanol (cold) and centrifuged at 4 °C for 10 min at 13,000 rpm. The pellets were dried for an hour and re-suspended in 200 mL sterile 1× TE buffer (10 Mm Tris-Cl pH 8.0; 0.1 mM EDTA) and stored at 4 °C until further use.
The quality and quantity of the DNA was determined with a BioDrop DUO (Biochrom Ltd., Cambridge, UK), for measurement of micro-volume samples following the manufacturer’s instructions. If a sample showed poor quality and quantity of DNA, the extraction was repeated. The extracted DNA samples from the different accessions were diluted and adjusted to a final concentration of 100 ng/μL prior to storage at −20 °C to avoid deterioration.
2.3. Simple Sequence Repeat Analysis and PCR Optimization
Nine SSR primers (
Table 3) designed through next-generation sequencing of the genomic DNA from spider plant were selected as these primers were polymorphic and gave products of the expected size [
27]. The forward primers were fluorescently labelled with dyes (Applied Biosystems, Foster City, CA, USA) [
27]. The reverse primers (Applied Biosystem, Foster City, CA, USA) were unlabeled. Each forward primer was tailed with the universal M13 primer at the 5′ end and a FAM-labelled M13 primer included for a two-step PCR [
30]. All primers, including the unlabeled reverse primer, were purchased from IDT (Whitehead Scientific (Pty) Ltd., Cape Town, South Africa). All primers were dissolved in sterile TE buffer (10 mM Tris-Cl, pH 8.0; 1 mM EDTA) to obtain a stock concentration of 100 μM. Each primer was then prepared as a 10 μM working stock. The fluorescent-labelled primer (M13-FAM) was kept in the dark all the time.
2.4. Microsatellite Genotyping
After some PCR optimization, all PCR reactions were performed in 20 μL volumes containing 2.0 mM MgCl2, 0.2 mM dNTPs, 0.25 μM of the forward primer, 1.0 μM of the reverse primer, 1.0 μM of the FAM-labelled M13 primer, 1.0 U GoTaq Flexi (Anatech Instruments (Pty) Ltd., Cape Town, South Africa) and 30 ng genomic DNA. Reactions were carried out on a GeneAmp PCR system 9700 (Applied Biosystems, Foster City, CA, USA) using the following PCR conditions: an initial denaturation step of 5 min at 94 °C, 25 cycles of 45 s at 94 °C, 1 min at the appropriate annealing temperature for the particular primer pair and 1 min at 72 °C, followed by 8 cycles of 30 s at 94 °C, 45 s at 52 °C, 1 min at 72 °C, and a final extension of 10 min at 72 °C. Fragment analyses were performed on an Applied Biosystems ABI3730 DNA analyser using a LIZ-500 (−250) size standard at the Central Analytical Facility, University of Stellenbosch. Allele sizes were subsequently assessed and scored using GeneMapper version 5.0 (Applied Biosystems, Foster City, CA, USA).
2.5. Statistical Analysis
Genetic diversity parameters were calculated, firstly for the 18 accessions. The number of alleles per locus (Na), observed heterozygosity (Ho), expected heterozygosity (He) and Shannon’s information index (I) were calculated using GenAlEx version 6.51b2 [
31]. The number of alleles per locus (Na) is a direct count of alleles amplified by a given marker for all the samples. The observed heterozygosity (Ho) is the proportion of samples that are heterozygous and is obtained by dividing the number of heterozygous samples by the total number of samples evaluated. The expected heterozygosity (He) for each marker was calculated on the basis of the formula by [
32], He = 1 − Σ(pi)
2, and pi is the probability that two alleles from the same locus are different when chosen at random from a given population. The polymorphic information content (PIC) of markers, PIC = 1 − Σ(pij)
2, was calculated using Gen-CALC software [
33] to determine how informative the markers were. The analysis of molecular variance was calculated using GenAlEx version 6.51b2 [
31].
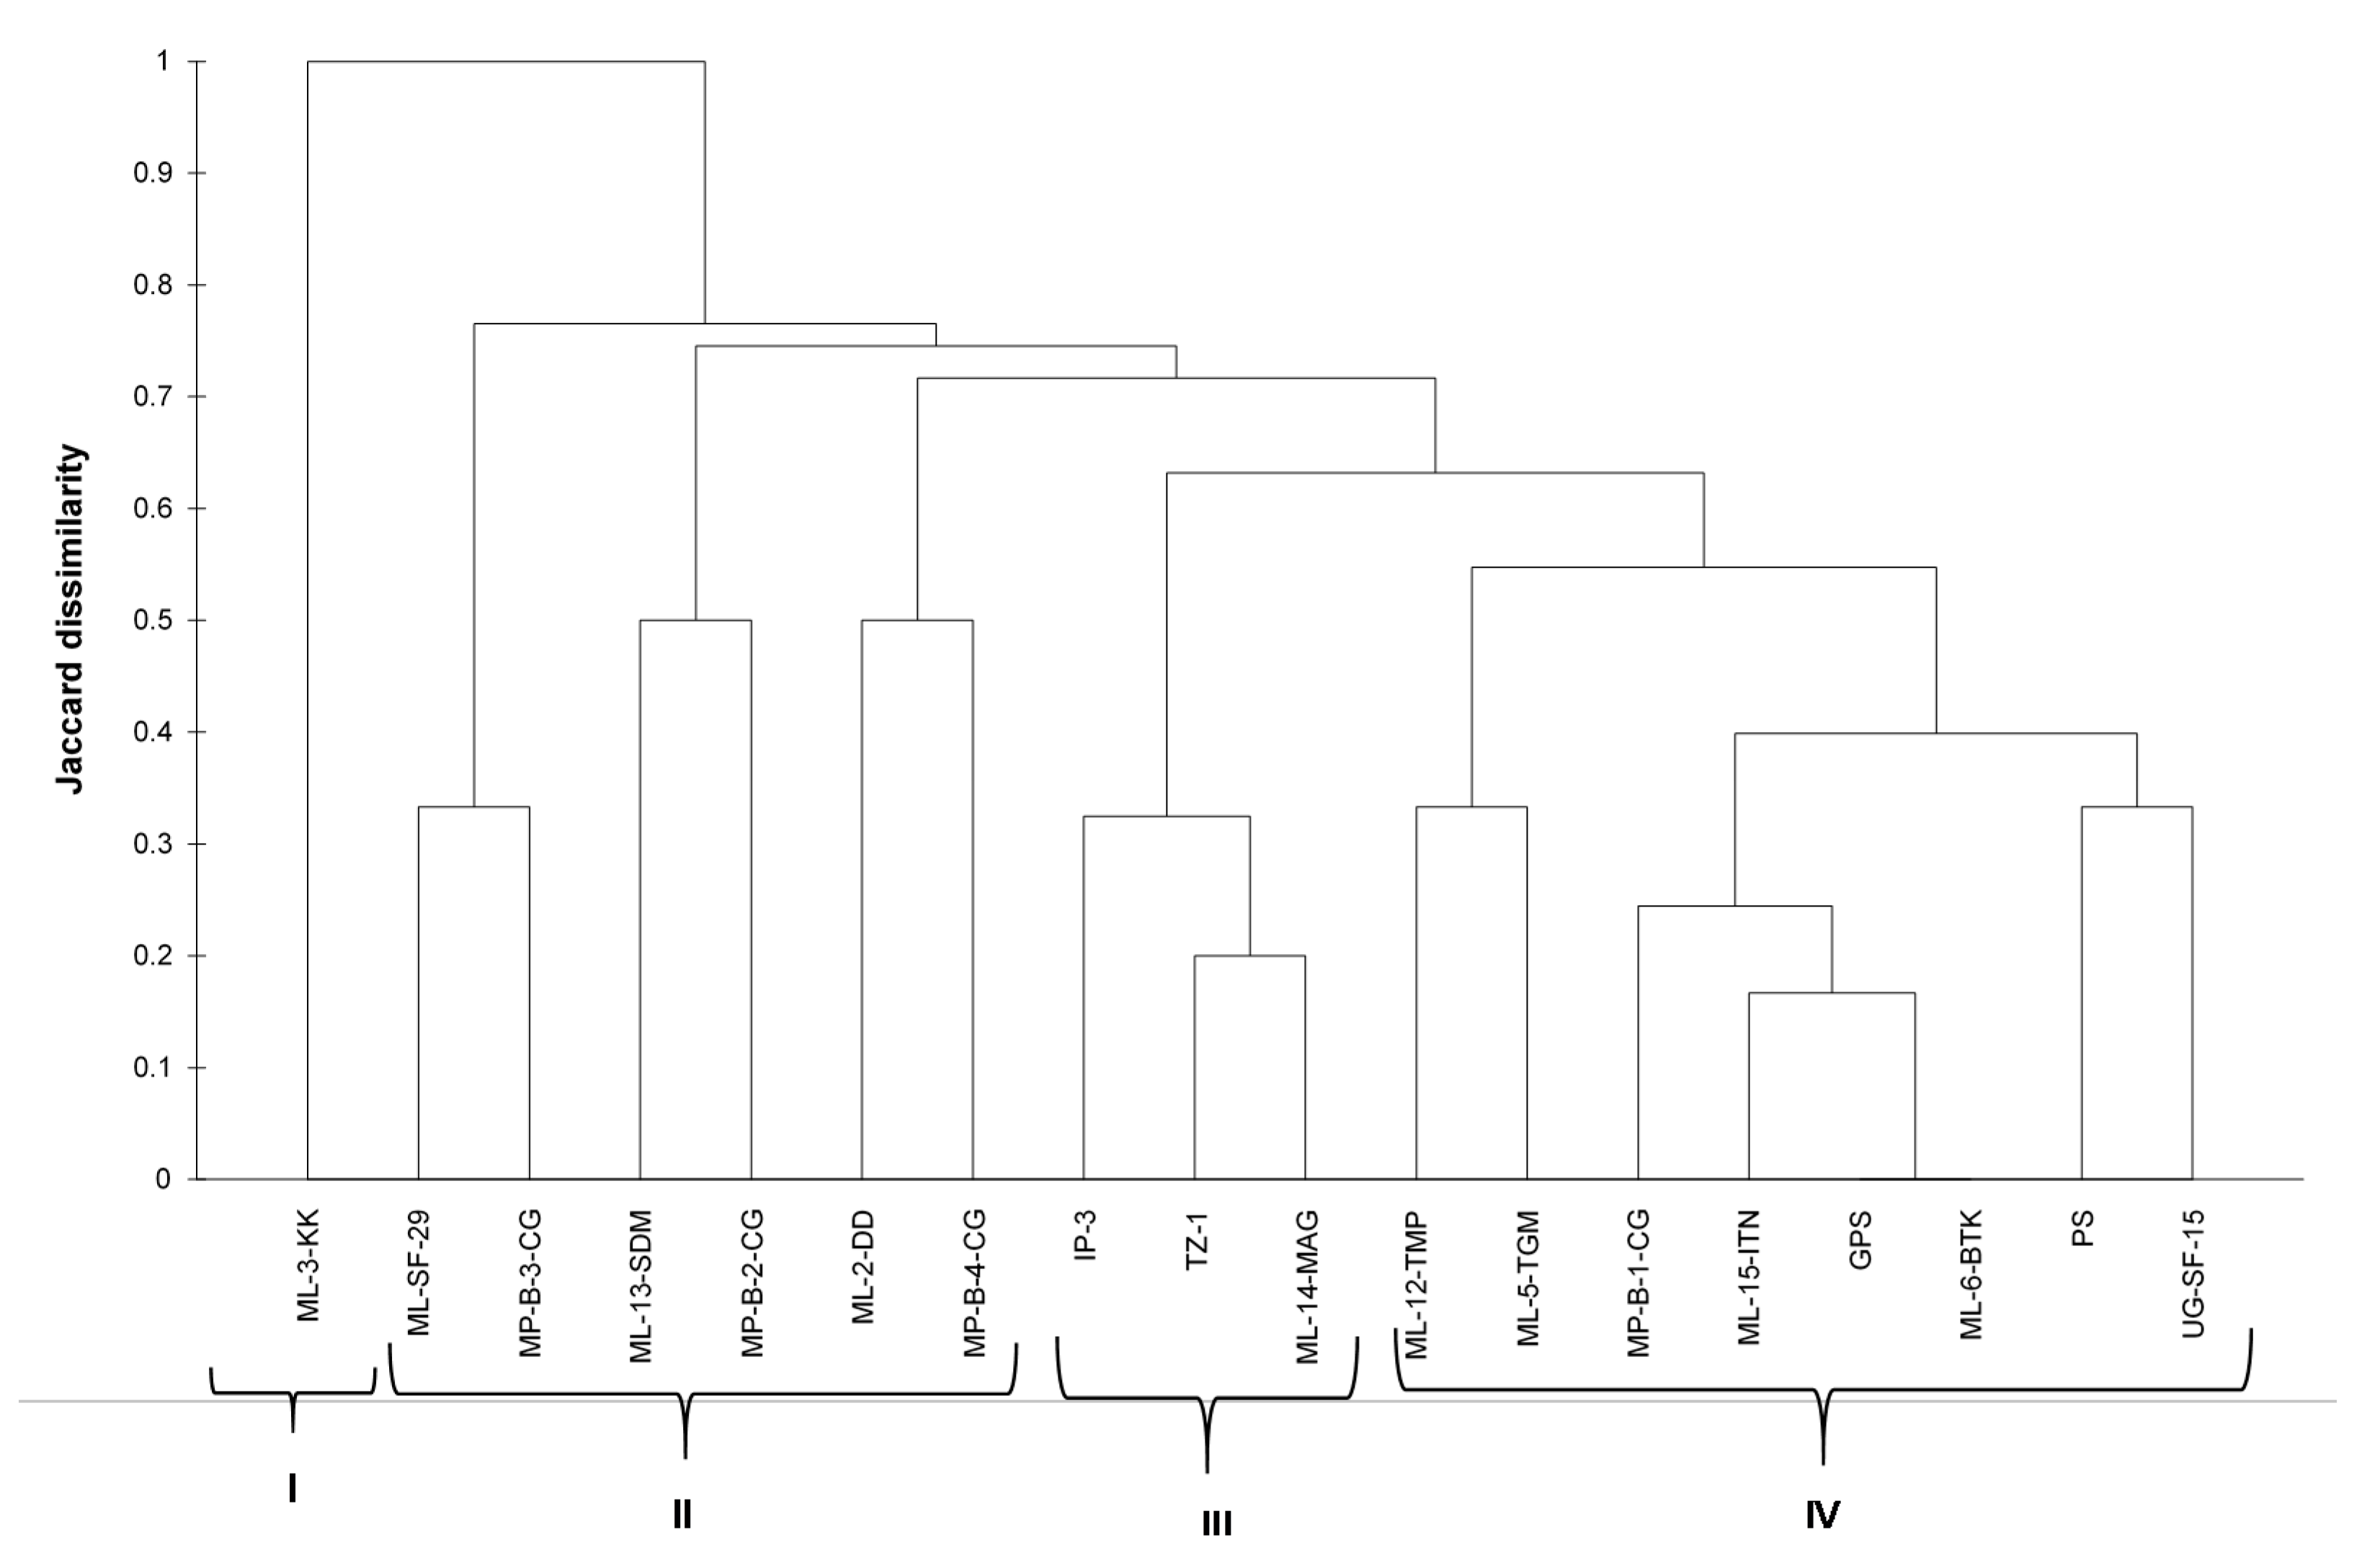
Polymorphism was treated as binary data (presence or absence). Analysis of molecular variance and population differentiation (FST) were conducted to determine whether the populations were genetically different from each other (GenAlEx 6.5b2). The dissimilarity matrix using the Jaccard index was generated using binary data [
34]. The microsatellite data was converted into binary using GenAlEx 6.51b2. Cluster analysis was performed using the unweighted pair group method (UPGMA) using XLSTAT 2020.5.1.1047. The genetic structure was determined by studying the number of private alleles for the local and exotic spider plant accessions. In GenAlEx 6.51b2 [
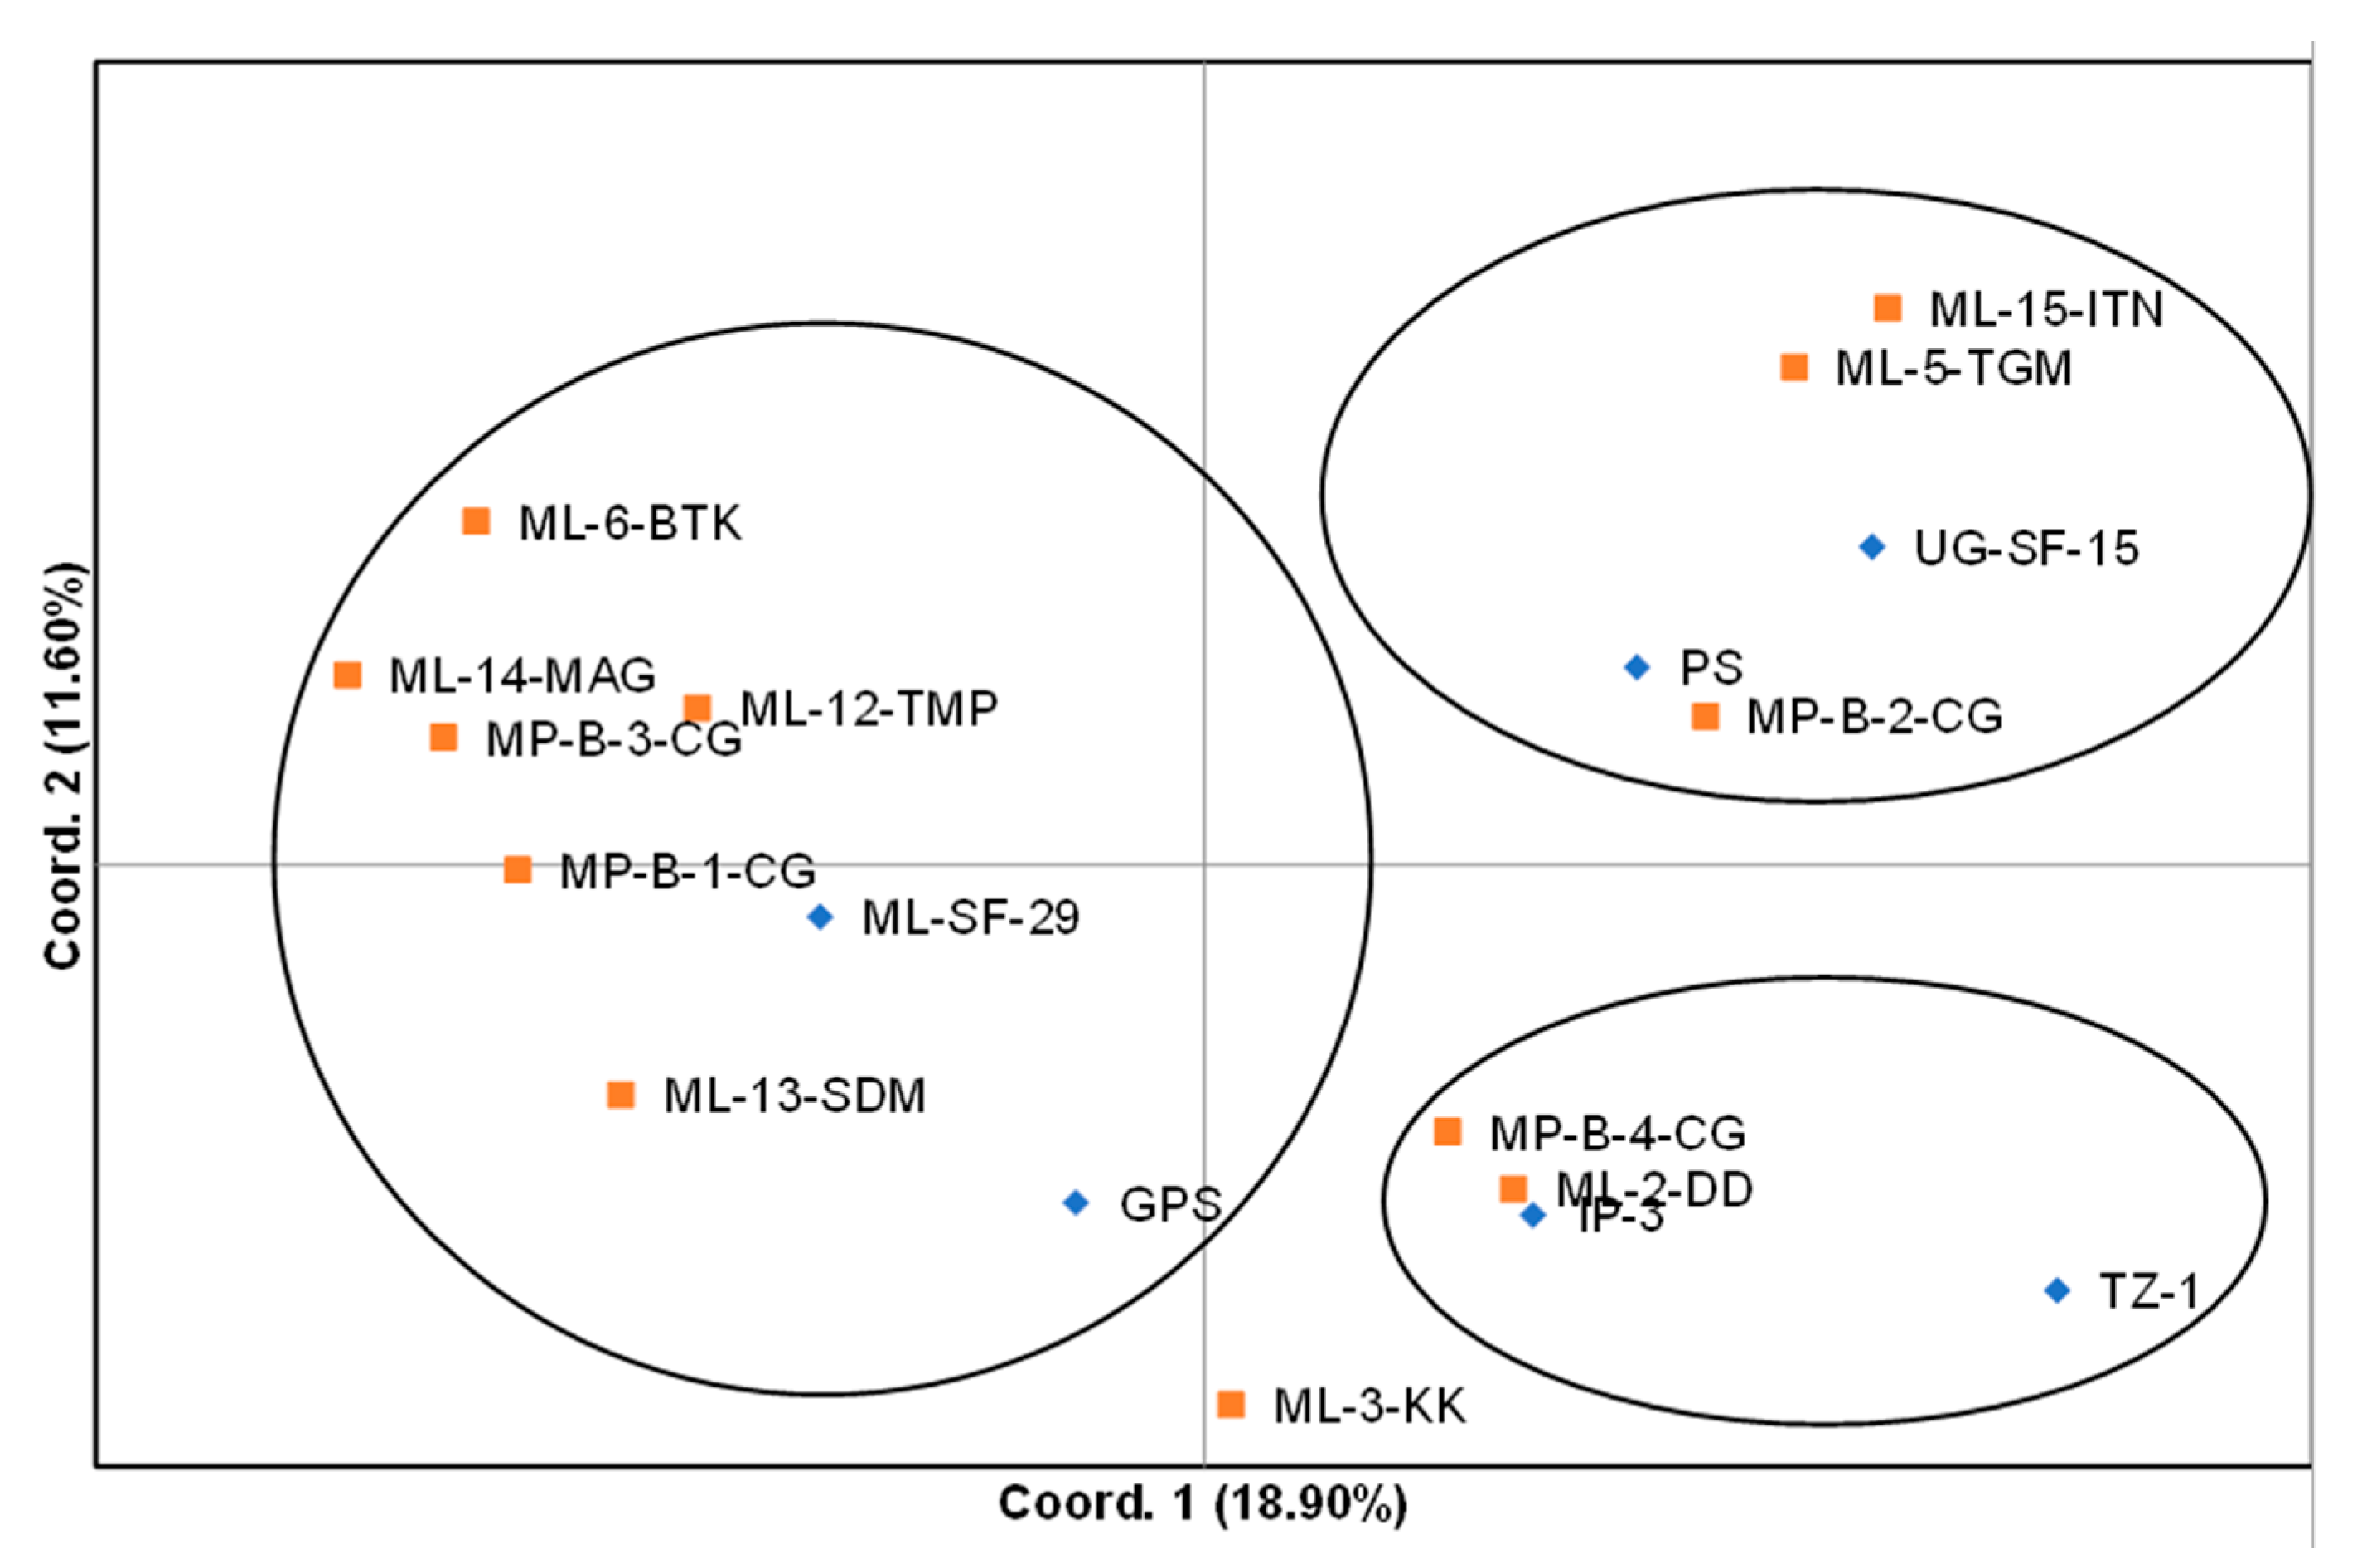
31], principal coordinates analysis (PCoA) was carried out using the genetic distance matrix.
4. Discussion
This study found variation in the number of alleles generated per locus with at least three alleles per locus. This was consistent with previous reports in similar studies in which the number of alleles per locus ranged from 3–7 in 30 entries of spider plant [
27]. In addition, some of the informative SSR markers (for instance CG001), were able to distinguish between the local and exotic accessions. Such markers could be useful in cultivar identification, as demonstrated previously in several crop species including potato [
35] and watermelon [
36], among others. The high polymorphism observed in the study suggested that the markers used in this study were effective in discriminating between the spider plant accessions. The relatively high average Shannon’s information index (1.52) which was observed, suggested a high discriminatory capacity of the markers that were used in this study. Many factors affect PIC values, including the breeding method of the species, the genetic diversity in the collection, the size of the population, the sensitivity of the method used for genotyping, and locations of primers in the genome [
37].
The number of spider plant individuals was limited partly because the germplasm collection of this leafy vegetable is still at a preliminary phase in the envisaged breeding program of this crop. Currently, spider plant is considered largely as an orphan (or neglected) crop which is collected from the wild [
38]. Only a limited number of local accessions with distinct morphological characters was available for this initial study, but future germplasm collection expeditions intend to include more individuals from each local accession in order to map out a more robust population genetic structure of the local spider plant. Moreover, smaller sample sizes of accessions (less than 18) were used and reported previously in similar genetic diversity studies using SSR markers in several crop species, including maize [
39] and wheat [
40]. The molecular markers that were used in this study were deemed sufficient for a small sample size and were consistent with the approaches that were employed in previous similar work. For instance, in a similar study aimed at evaluating the genetic diversity among 25 Tunisian pear (
Pyrus communis) cultivars, seven SSR markers were used successfully to amplify at least 36 fragments, with a mean expected heterozygosity averaging 0.71—thus suggesting a high level of genetic diversity in germplasm [
41]. In another similar study involving red clover (
Trifolium pratense L.), over seven SSR loci produced a high genetic diversity, with a mean expected heterozygosity of 0.86 [
42].
Simple sequence repeats with high PIC values also showed a high number of effective alleles per locus, indicating a high marker ability for genetic analysis among spider plant accessions. The similarity between the local and exotic accessions was demonstrated by a negative fixation index observed for all the markers. Moreover, the AMOVA showed that the total variation (100%) was accounted for within individual variations. The high variation observed within individual accessions may be explained by the high heterozygosity observed in this study and the lack of differentiation between the exotic and local spider plant accessions, since the exotic accessions are gene bank accessions and the local spider plant accessions were collected from the wild. Furthermore, the low differentiation between the accessions may be attributed to a lack of isolation during seed multiplication in the field, since the spider plant is a cross-pollinated species. Another factor that might have contributed to the low differentiation between the exotic and local spider plant accessions is the limited number of accessions and markers used in this study. The Nei’s diversity index in this study was high when compared with previous reports in which the index ranged from 0.13–0.77 [
27] and 0.3–0.6 [
25]. Limited gene flow exchange is indicated by low Nm values [
43]. In this study, high Nm values were observed, suggesting high genetic exchange or gene flow.
A high average heterozygosity value was observed in the local spider plant accessions when compared to the exotic accessions, meaning that the former accessions were more diverse. In addition, the low heterozygosity observed in exotic germplasm could be attributed to the low number of accessions that were used in the study. The two populations presented differences in the loci with concern to the number of private alleles observed. Local spider plant accessions had a wide range of loci with private alleles, probably due to the relatively larger population that was used in comparison with the exotic population. Furthermore, the local spider plant accessions were more genetically diverse with concern to more private alleles. Such alleles provide useful information on rare variability in certain loci and identify diverse accessions that could be used as parental lines in breeding programmes to maximize the allele richness in the population.
The hierarchal clustering grouped the spider plant accessions into four distinct groups, with no clear distinction between exotic and local accessions. However, variation between individual accessions were observed. The results of the cluster analysis and PCoA were consistent with each other in grouping the 18 spider plant accessions into four groups, with ‘ML−3-KK’ on its own. This suggested that this accession was superior among the set of accessions that were evaluated in the study. The results from this study did not show a clear differentiation between the green and purple spider plant morphotypes. These results are different to those reported by [
25] who reported a clear difference between four morphotypes from Kenya using RAPD markers.


