Article

Amending Potassic Fertilizer with Charcoal and Sago (Metroxylon sagu) Bark Ash to Improve Potassium Availability in a Tropical Acid Soil

1
Department of Crop Science, Faculty of Agricultural Science and Forestry, Bintulu Sarawak Campus, Universiti Putra Malaysia, Bintulu 97008, Malaysia
2
Faculty of Agriculture and Forestry Sciences, Institut Ekosains Borneo (IEB), Bintulu Sarawak Campus, Universiti Putra Malaysia, Bintulu 97008, Malaysia
3
Institute of Tropical Agriculture, Universiti Putra Malaysia (ITAFoS), Serdang 43400, Malaysia
4
Faculty of Agro-Based Industry, Campus Jeli, Universiti Malaysia Kelantan, Jeli 17600, Malaysia
5
School of Agriculture, SIREC, CBAS, University of Ghana, Legon, Accra 23321, Ghana
*
Author to whom correspondence should be addressed.
Agronomy 2021, 11(11), 2222; https://doi.org/10.3390/agronomy11112222
Submission received: 23 June 2021 / Revised: 15 August 2021 / Accepted: 26 September 2021 / Published: 2 November 2021

Abstract

:
In Ultisols and Oxisols, potassium (K) in the soil solution is leached from the rhizosphere before it interacts with soil colloids, or exchanged with other cations at the exchange sites of the soils because of the abundance of kaolinite clay minerals. These soils are highly weathered, low in organic matter, and low in pH, but high aluminium (Al) and iron (Fe) ions. Hence, K becomes unavailable for plants, and this compromises crop production and farmers’ profitability. The pH neutralizing effects of sago (Metroxylon sagu) bark ash and the ability of charcoal to chelate Al and Fe could be utilized to improve soil pH, reduce soil acidity, and improve K availability. The objective of this study was to determine the effects of amending muriate of potash (MOP) with charcoal and sago bark ash on selected soil chemical properties in a tropical acid soil (Typic Paleudults) over 90 days in a laboratory incubation. The proportions of charcoal and sago bark ash were varied at 20%, 40%, 60%, 80%, and 100%, but the MOP was fixed at 100% of the recommended rate. Selected soil chemical properties before and after incubation were determined using standard procedures. Results revealed that co-application of the soil amendments with MOP increased soil-exchangeable K compared with conventional practice. Moreover, amending the acid soil with charcoal and sago bark ash positively enhanced the availability of other base cations and soil cation exchange capacity (CEC). This was possible because the amendments increased soil pH and reduced exchangeable acidity, exchangeable Al3+, and exchangeable Fe2+. However, there was no significant improvement in water-soluble K (WSK) in the soil with or without charcoal and sago bark over the 90 days laboratory study. The findings of this study suggested that increasing soil pH could potentially improve soil K sorption capacity. Thus, the optimum rates of charcoal and sago bark ash to increase K availability were found to be 80% charcoal with 80% sago bark ash, 60% charcoal with 60% sago bark ash, and 80% charcoal with 40% sago bark ash, because these rates improved soil-exchangeable K+ and CEC significantly, besides minimizing soil-exchangeable acidity.

1. Introduction

Maize (Zea mays L.) is one of the most important staple foods in the world. Maize is acknowledged as the queen of cereals worldwide, and as a matter of fact, it ranks second after wheat in terms of production and consumption. Maize is a source of food in Asian countries including Malaysia not only for human consumption, but also as livestock feed. However, production of maize in Malaysia is far from self-sufficiency level, and this is one of the reasons for maize importation in Malaysia. For example, Malaysia imported approximately 3.7 million tons of grain corn valued approximately US$ 737 million in 2017 [1]. The dependency on importation of maize has negative effects, such as the increased cost of corn-based food or livestock feed, and it can cause a deficit in trade balance [2]. Reliance on imported produce could be overcome by improving the present practices of maize production, mainly by ensuring efficient use of fertilizers, which is consistent with achieving sustainable soil and productivity.
Potassium (K) is required by plants in approximately the same or slightly larger amounts as nitrogen (N) and five to ten times as much as phosphorus (P). Uptake of K occurs in K+ form [3]. It plays an important role in photosynthesis, cellular energy production, plant osmoregulation, enzyme activation, regulation of stomatal function, transport of assimilates, cell wall synthesis, and protein synthesis [4]. Soil K can be categorized into water-soluble K (WSK), exchangeable K, non-exchangeable K, and mineral K or fixed K [5,6]. Water-soluble K is a K source that is readily available for plant uptake. Exchangeable K is a K reserve that is easily mobilized. Both WSK and exchangeable K are plant-available K, and they are approximately 1% to 2% of the total soil K. On the other hand, non-exchangeable K is poorly mobilized in soils, and takes time to become available for plants. Similarly, mineral K is inert and unweathered in soil. In tropical acid soils such as Ultisols and Oxisols, the bioavailability of K is low because of intense weathering and leaching [7,8]. Furthermore, weathering of sandstone usually produces soils that are low in WSK, whereas soils originating from young volcanic rocks have highly available K [7]. The order of availability of the four fractions of K to plants are: WSK > exchangeable K > non-exchangeable K > mineral K [4,5]. However, in Malaysian soils, WSK is easily leached from the rhizosphere before it interacts with soil colloids or is exchanged with other cations at the exchange sites of soils, because of the abundance of kaolinite clay minerals. Mineral soils of Malaysia, such as Ultisols and Oxisols, are highly weathered and low in pH, hence they are typically low in K, N, and P [9,10]. Aluminium (Al) and iron (Fe) toxicity and high annual rainfall in Malaysia also contribute to further leaching of K from Ultisols and Oxisols.
To overcome the aforestated problem, extensive application of K fertilizers is required to satisfy plants’ needs. This practice makes K available for plant uptake for a short period. However, it is uneconomical and causes environmental pollution, which includes leaching of K+ into ground water, surface leaching, or run-off of these nutrients to water bodies [11]. Furthermore, in term of economics, it is important to manage K to minimize losses so as to avoid extra or excessive fertilization [12]. Studies have been carried out to improve soil pH through liming. This practice increases K fixation in acidic soils, because tightly held hydrogen (H) and hydroxy aluminium ions in acid soils are reduced, if not completely removed, and K+ ion mobility is facilitated by the surfaces of soil colloids where K+ ions are fixed in clays. However, application of lime brings additional costs to farmers, and causes P fixation by calcium (Ca) if undertaken excessively [13,14,15]. This has steered attention to the application of soil amendments to minimize K loss. Soil-amendment utilization improves soil physical and chemical properties such as moisture retention, the bioavailability of nutrients, water infiltration, drainage, and aeration, cation exchange capacity (CEC), and pH [16]. In addition, soil amendments are able to improve carbon (C) sequestration [17]. The high CEC of soil amendments can be exploited to improve the CEC of acid soils to temporarily retain nutrients [18]. Simultaneously, the pH of the soil needs to be improved to make the K available for the plants.
Forestry and agricultural sectors in Malaysia have developed significantly in line with the economic growth spurt. Nevertheless, the increased activity in both sectors has led to increased waste generation. To emphasize the severity of the issue, 43% of total tree volumes (stumps, branches, defect-cuts) are left in the forest during logging operations in Malaysia [19]. In Sarawak, 2.7 million tonnes of wood residue waste are generated from plantations [20], whereas 3.4 million m3 of waste are generated each year from primary wood manufacturing activities in Malaysia [21]. It is worth noting that these industries usually opt to convert these wastes into charcoal, briquettes, or pellets.
In recent years, Sarawak, Malaysia has become the leading producer of sago starch and one of the largest exporters of sago products in the world. Sarawak’s, exports of sago products are approximately 25,000 tonnes annually, and this figure is expected to increase in coming years to meet the increasing demand for sago starch [22,23]. This will not only increase the production and processing of sago starch, but will also increase the amount of waste generated. The waste can be classified as sago trunk bark, fibrous pith residue (also known as hampas), and wastewater [24]. Sago trunk bark waste is generated during the debarking of sago logs before pulping and starch extraction, whereas pith residue and wastewater are the by-products of the starch extraction stage. The bark waste accounts for up to 17% of the log processed, and approximately 0.75 tonnes of sago bark waste is produced per ton of dried flour [25]. Ngaini et al. [26] enumerated 15.6 tonnes of sago bark waste being produced daily from 600 logs of sago palm in Malaysia. Moreover, in a more recent study it was emphasized that approximately 20,000 tonnes of sago bark are generated by Malaysia’s sago industry per annum [27] and are not fully utilized as higher value-added products.
Sago bark ash is the inorganic and organic residue remaining after the combustion of sago bark waste. Previous studies on ash from different sources have indicated its potential as a soil amendment [28,29,30]. For example, wood ash has been used on farms since its potential to substitute for commercial lime was discovered [31]. Having a smaller particle size makes ash materials superior in terms of time taken to improve pH. The presence of calcite (CaCO3), lime (CaO), and magnesium oxides (MgO) enables ash to neutralize pH changes in soils [32]. It may also dissociate H+ from functional groups through the effects of calcium (Ca) and magnesium (Mg).
Utilization of charcoal in soils with high K leaching enables K retention and also provides a slow-release mechanism that can be enhanced by sago bark ash, to improve, for example, soil pH. Charcoal is derived from the pyrolysis (thermal degradation in a low-oxygen atmosphere) of lignocellulosic residues from either forestry (sawdust, woodchips, and bark) or agricultural (corn stalks, coconut, rice husks, and manure) activities. Charcoal has recently been heralded for its ability to increase plant productivity and ameliorate poor soil conditions across a variety of systems [33] while mitigating anthropogenic climate change by enhancing soil carbon sequestration [34]. Charcoal’s ability to enhance plant growth is attributed to increased soil pH, the sorption of growth-inhibitory compounds, and increased water retention or improved soil physical properties [35]. Charcoal has a high initial carbon density (70–85%) relative to typical woody biomass (<50%), and it is primarily made up of irregularly arranged aromatic rings, with a highly porous structure [36]. Aromatic structures are stable and are responsible for the recalcitrance of charcoal [37]. Surface oxidation of aromatic rings results in carboxylation, creating large numbers of negative-charged sites. Negative surface charges increase cation exchange capacity, adsorption of cations, and P, but reduce nutrient leaching [38].
Co-application of charcoal and sago bark ash in agriculture could be pivotal in improving physico-chemical properties and nutrient availability in tropical acid soils. Therefore, it was hypothesized that amending potassic fertilizers such as muriate of potash (MOP) with the right amount of charcoal and sago bark ash in tropical acid soils could significantly improve K availability, because of their neutralizing effect and high CEC. To this end, a laboratory incubation study was carried out to determine the effects of amending MOP with charcoal and sago bark ash on K and other related soil chemical properties in a tropical acid soil (Typic Paleudults) over 90 days.

2. Materials and Methods

2.1. Soil Sampling and Preparation

The soil used in this study was sampled from an uncultivated secondary forest at Universiti Putra Malaysia, Bintulu Sarawak Campus (latitude 3°12′11.0” N and longitude 113°04′25.0” E), which is a typical representative of Bekenu Series, Typic Paleudults [39]. Despite the high content of Al and Fe and abundance of kaolinite clay minerals, it is a commonly cultivated soil in Sarawak, Malaysia. The area has an elevation of 27.3 m, an annual rainfall of 2993 mm, a mean temperature of 27 °C, and relative humidity of approximately 80%. The soil samples were collected at depth of 0–20 cm using a shovel. The soil samples were then air dried, ground, and sieved through a 2 mm sieve, after which they were bulked. One kg of soil was taken for each treatment, with triplicates based on the soil’s bulk density.

2.2. Initial Characterization of Soil, Charcoal, and Sago Bark Ash

With the exception of soil texture, the selected physical and chemical properties of the soil (Bekenu Series, Typic Paleudults) used in this study were within the range reported by Paramananthan [40]. However, the soil texture obtained was comparable to that reported in the Soil Survey Staff [39]. The sago bark ash used in this present study was obtained from Song Ngeng Sago Industries, Dalat, Sarawak, Malaysia, while the charcoal was obtained from Pertama Ferroalloys Sdn Bhd, Bintulu, Sarawak, Malaysia. The selected physico-chemical properties of the soil, charcoal, and sago bark ash are summarized in Table 1.

2.3. Incubation Set-Up

The percentages of charcoal and sago bark ash were derived from the respective literature (charcoal [41,42] and sago bark ash [43,44,45]). The 100% recommended rate of charcoal was 10 t ha−1, whereas that of sago bark ash was 5 t ha−1. These recommendations were scaled down to the equivalent proportions per one kg soil (Table 2). Charcoal and sago bark ash rates were varied by 20%, 40%, 60%, 80%, and 100%, whereas MOP rate was kept constant at 100% of the recommended rate. The recommended rate of K fertilizer used was 40 kg potassium oxide (K2O) ha−1 (67 kg MOP ha−1). This rate was based on the standard recommendation for maize (Zea mays L.) cultivation with planting distance of 0.6 m × 0.6 m [46]. The recommended rate of the K fertilizer was calculated based on planting density (planting density of 27,777 maize plants ha−1), which was equivalent to 2.41 g of MOP per plant (Table 2). The soil, charcoal, sago bark ash, and MOP were thoroughly mixed, after which the mixture was incubated in transparent polypropylene containers with perforated lids for good aeration. The samples were incubated under room temperature (26 °C) for 30, 60, and 90 days. Three replicates of each treatment were arranged to suit completely randomized design (CRD) at the Soil Science Laboratory, Universiti Putra Malaysia Bintulu Sarawak Campus, Malaysia. The samples were moistened to 60% of moisture content based on the soil’s field capacity. The soil moisture level was maintained using distilled water when necessary.

2.4. Soil Chemical Analysis before and after Incubation

The soil samples were characterized for physical and chemical properties before and after the incubation study. Soil pH in water and potassium chloride (KCl) and electrical conductivity (EC) were measured in a 1:2.5 (soil: distilled water/KCl) using a digital pH meter and an EC meter, respectively [47]. Soil texture was determined using the hydrometer method [48]. Soil total carbon (TC) was calculated as 58% of the organic matter that was determined using loss of weight on ignition method [49]. Soil samples were analyzed for soil bulk density using coring method [50]. The soil CEC was determined using leaching method [51] followed by steam distillation [52]. Exchangeable cations [Ca, Mg, Sodium (Na), and Fe] were extracted with 1 M ammonium acetate (NH4OAc), pH 7 using the leaching method [51]. Afterwards, the cations were quantified using Atomic Absorption Spectrophotometry (AAnalyst 800, Perkin Elmer Instruments, Norwalk, CT, USA). The fractions of the soil K evaluated in this study were total K, water-soluble K, and exchangeable K. The extractions of the water-soluble K and exchangeable K fractions were undertaken following the method of Wang et al. [3]. However, only total K was extracted using Aqua Regia method [53]. Determination of K content in the extracts was conducted using Atomic Absorption Spectrophotometry (AAnalyst 800, PerkinElmer, Norwalk, CT, USA). Soil-exchangeable acidity, H+, and Al3+ were determined using acid-base titration method [54].

2.5. Statistical Analysis

Data were analyzed statistically using analysis of variance (ANOVA) to detect treatment effects. The means of the treatment were compared using Tukey’s HSD test at p ≤ 0.05. Statistical Analysis System (SAS) Version 9.4 was used for the statistical analysis. A normality test was performed to ensure the data obtained fit the ANOVA assumption.

3. Results and Discussion

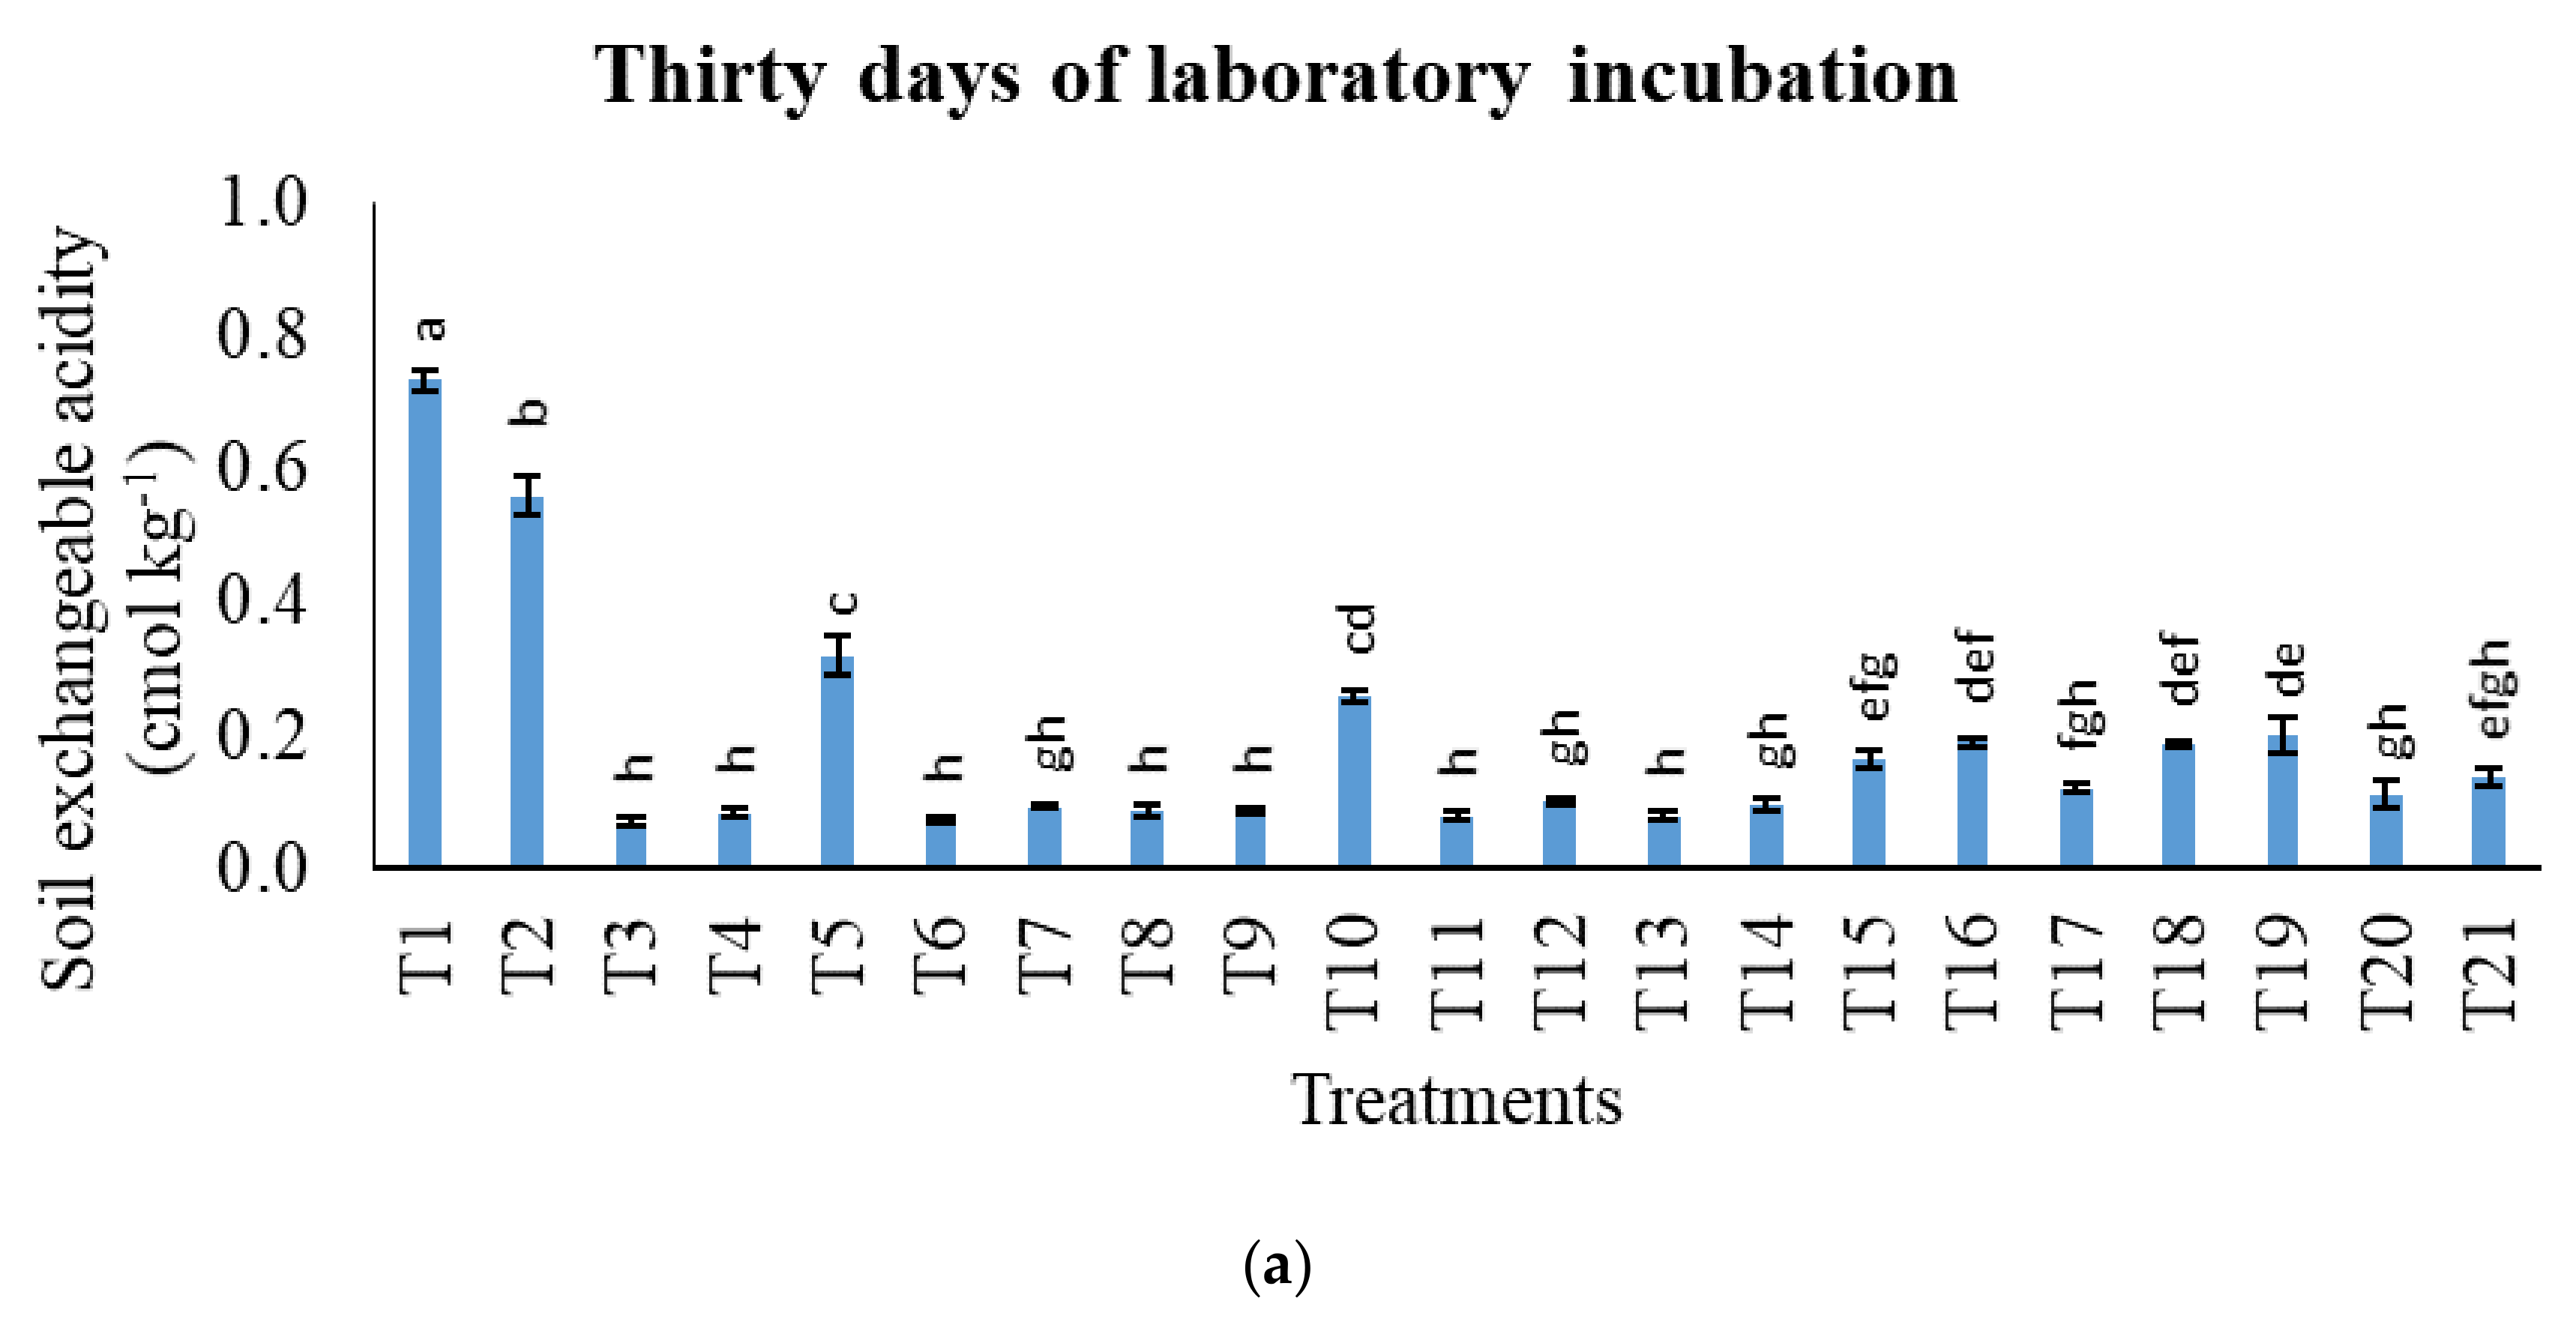
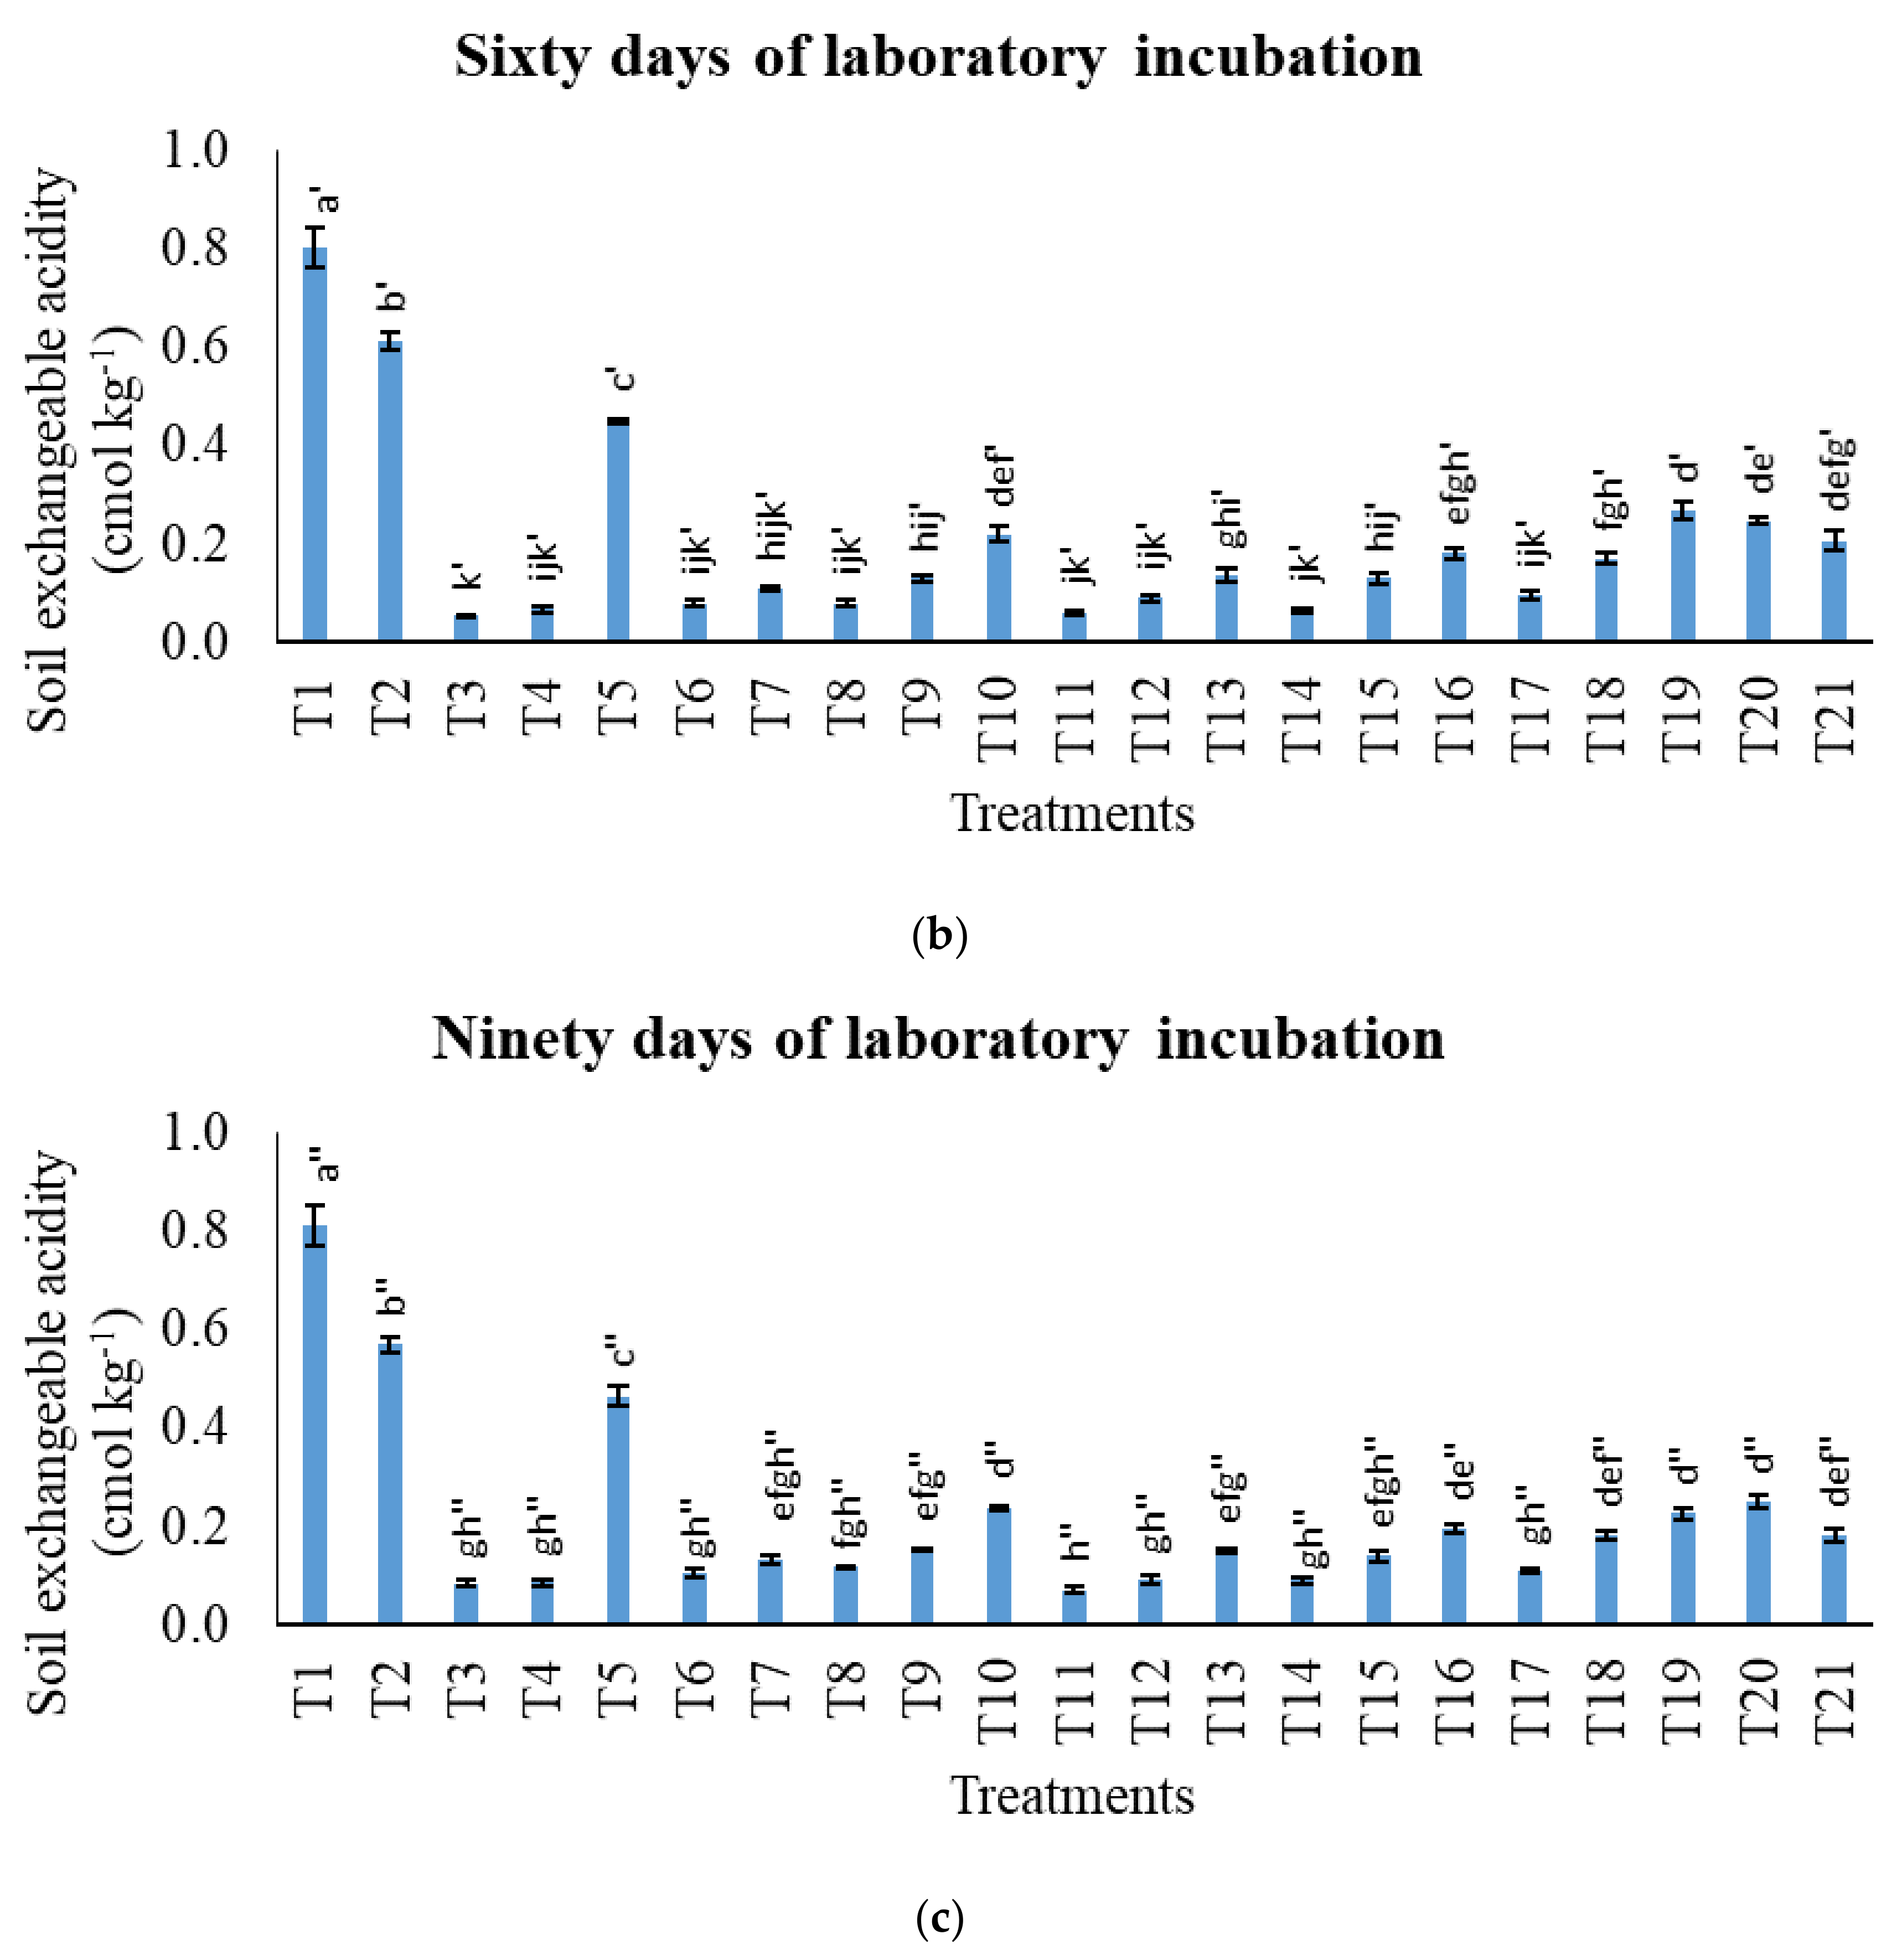
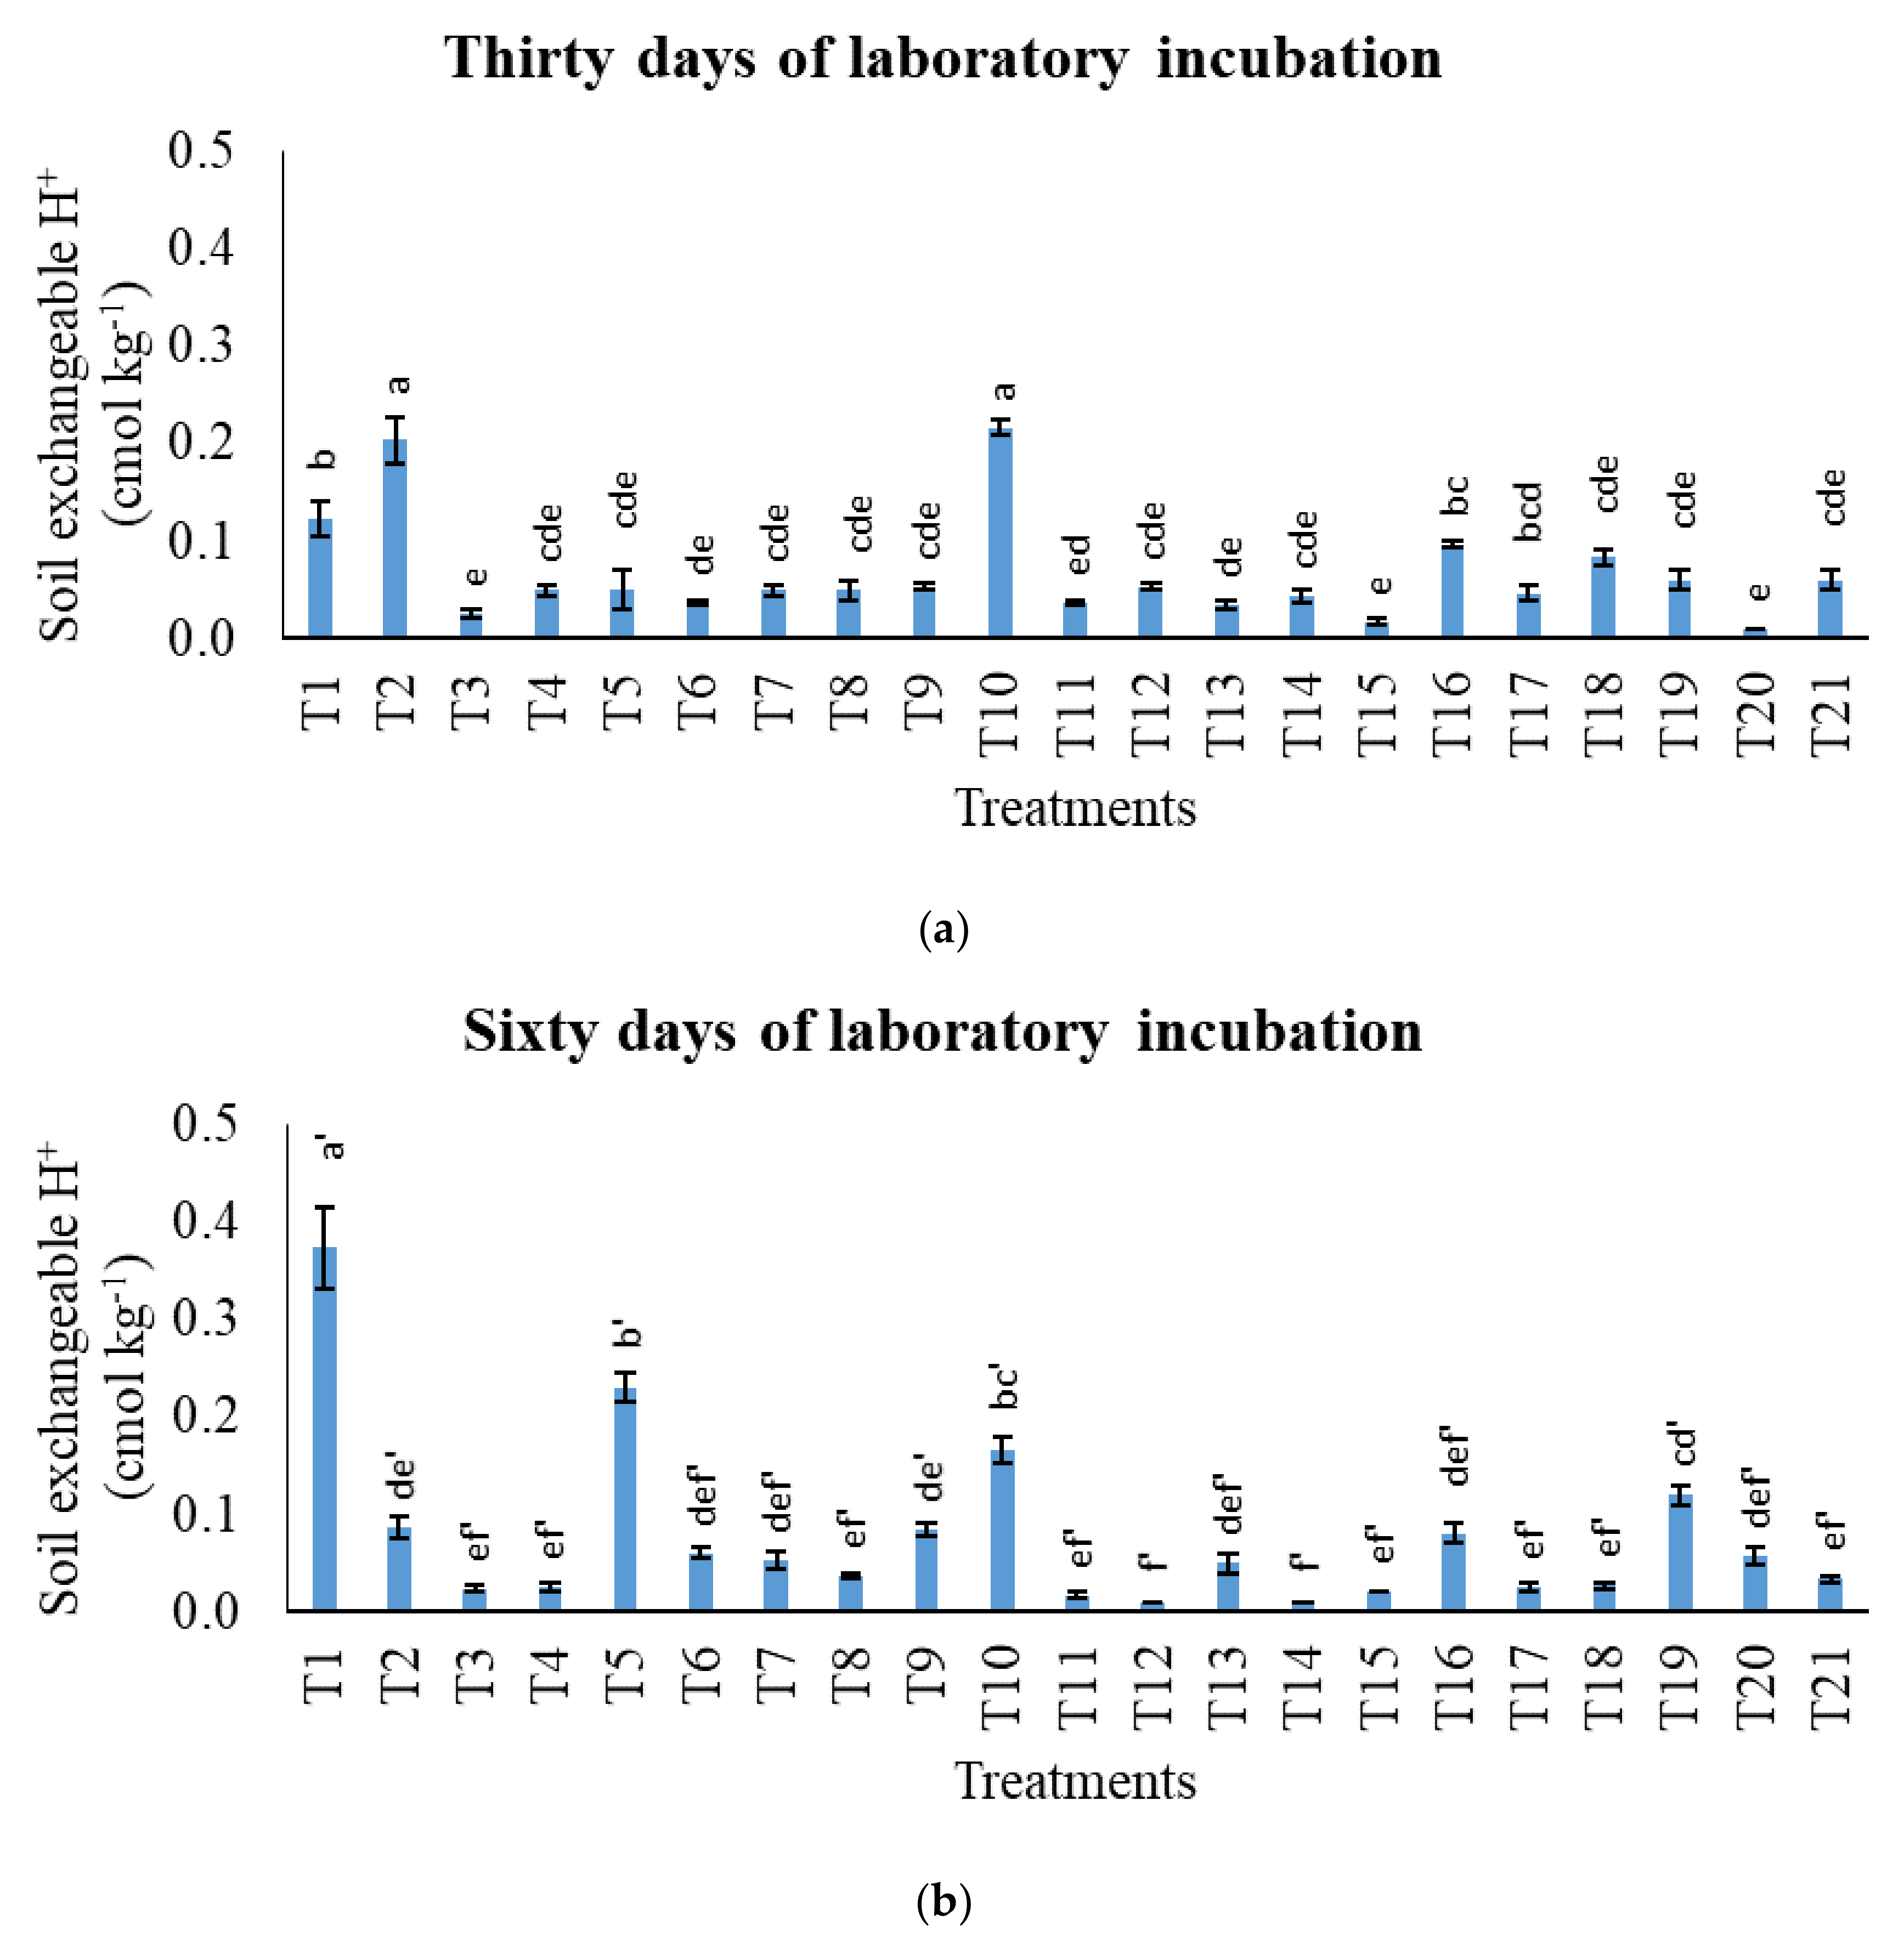
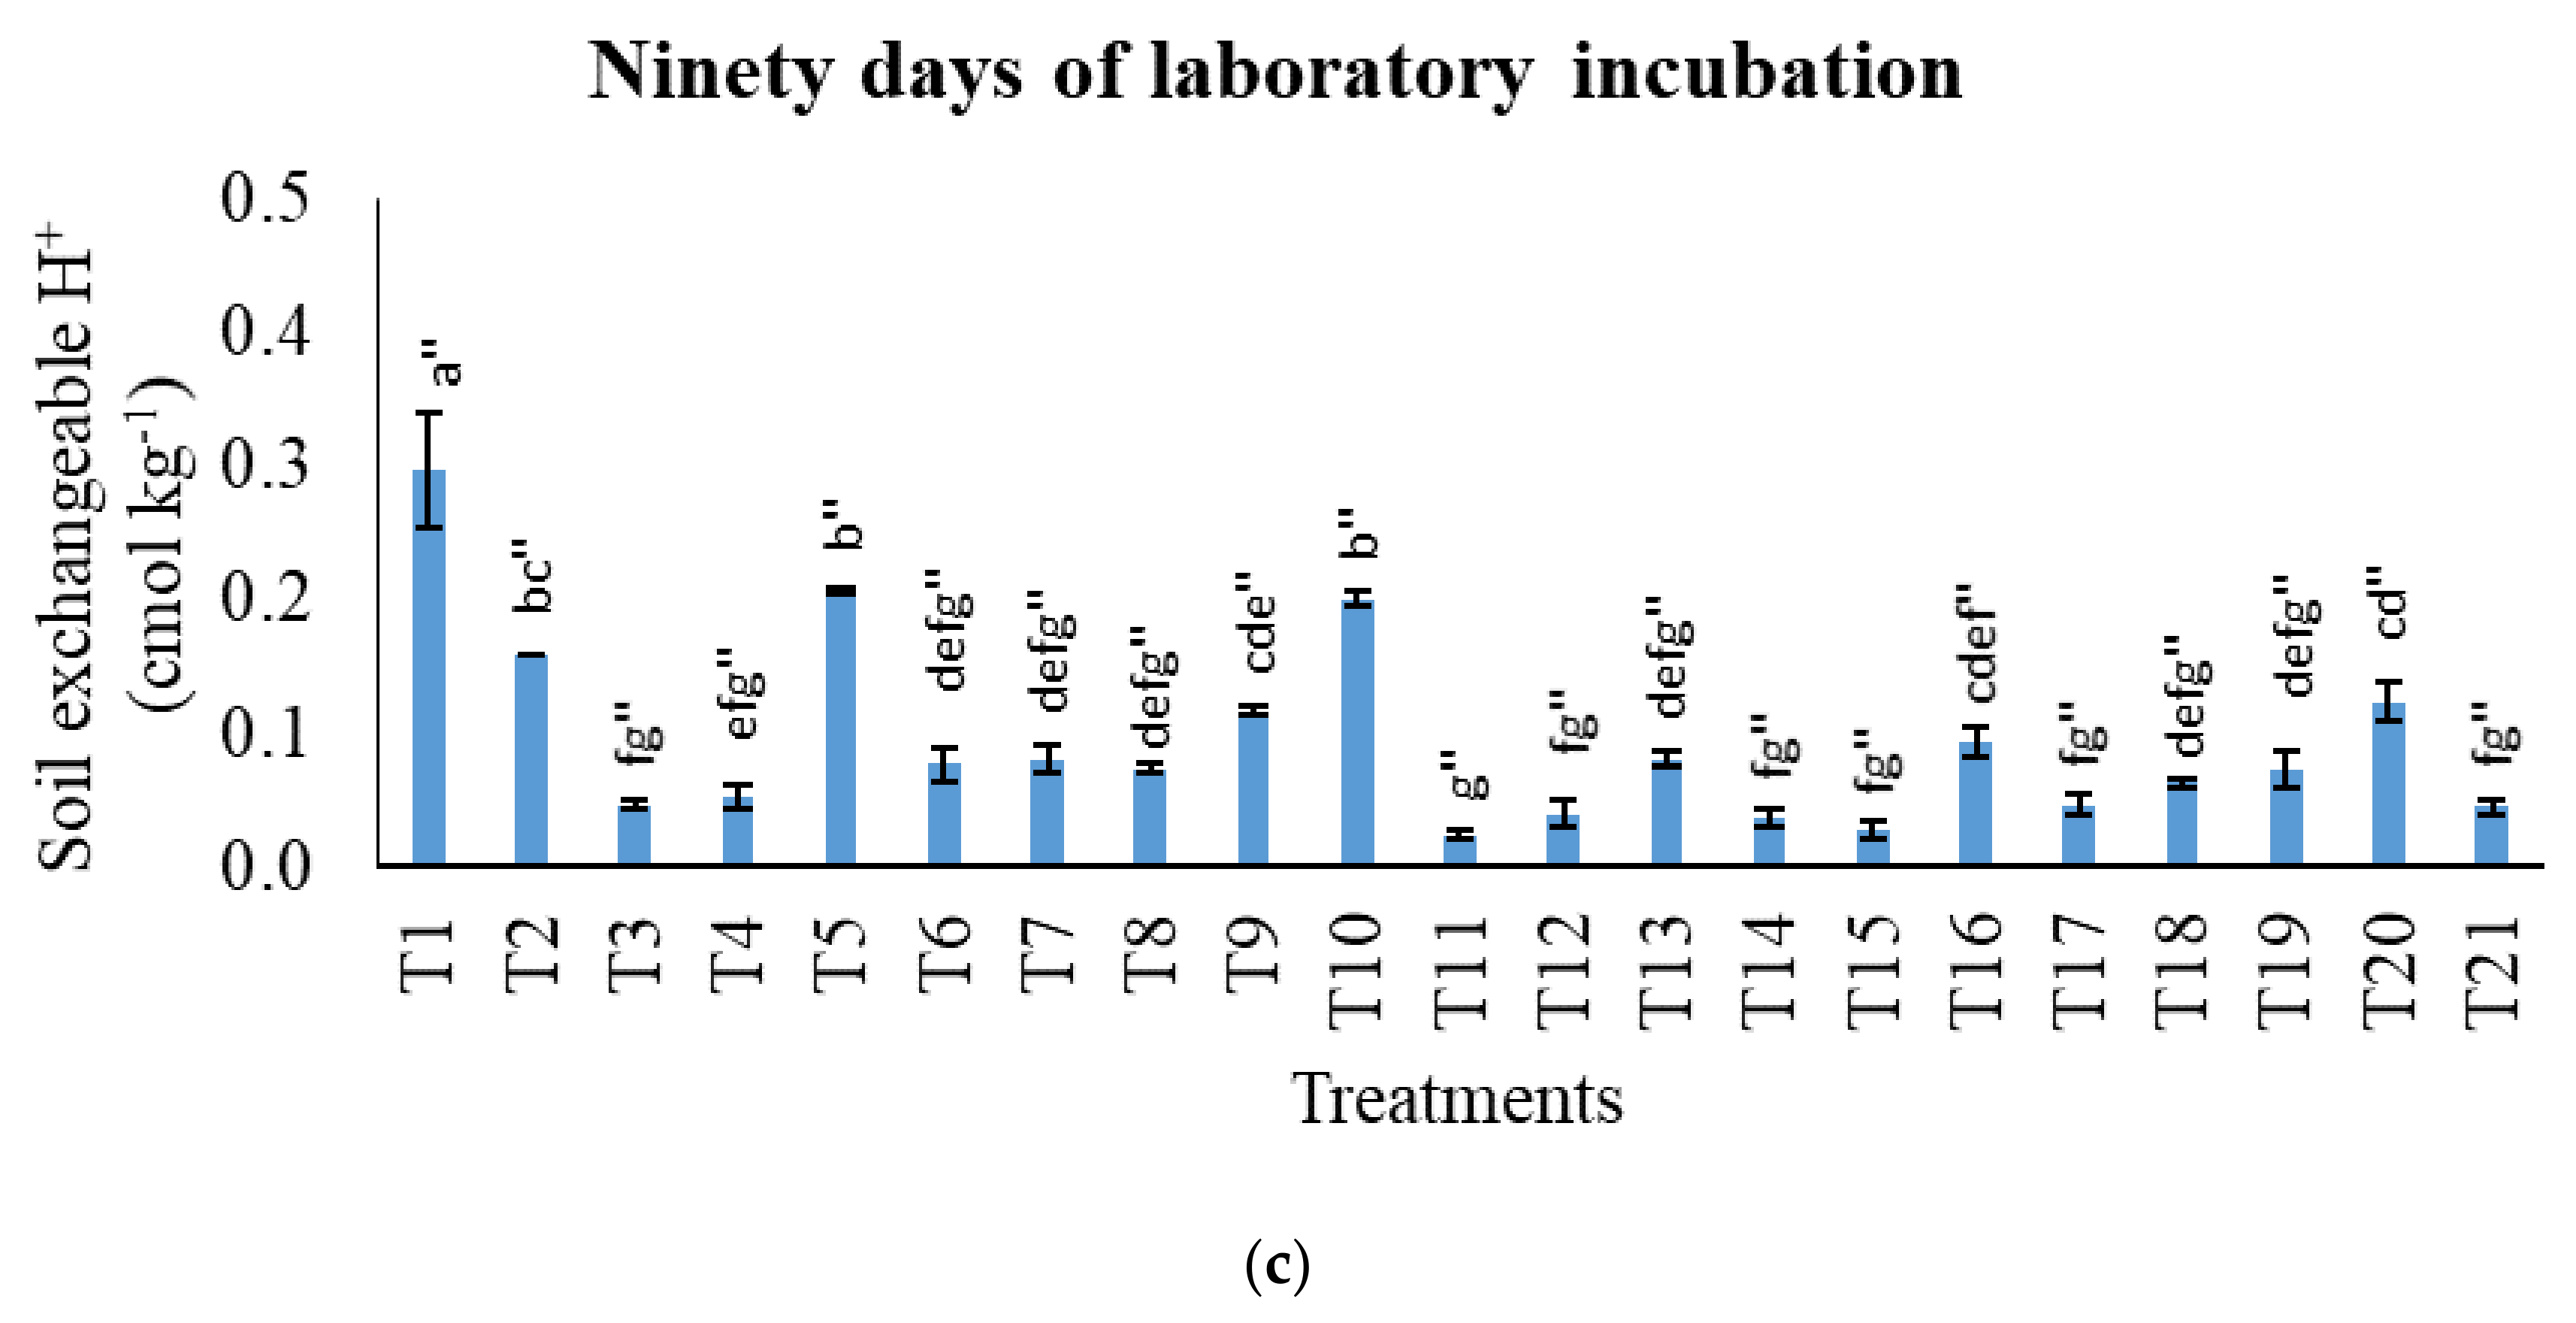
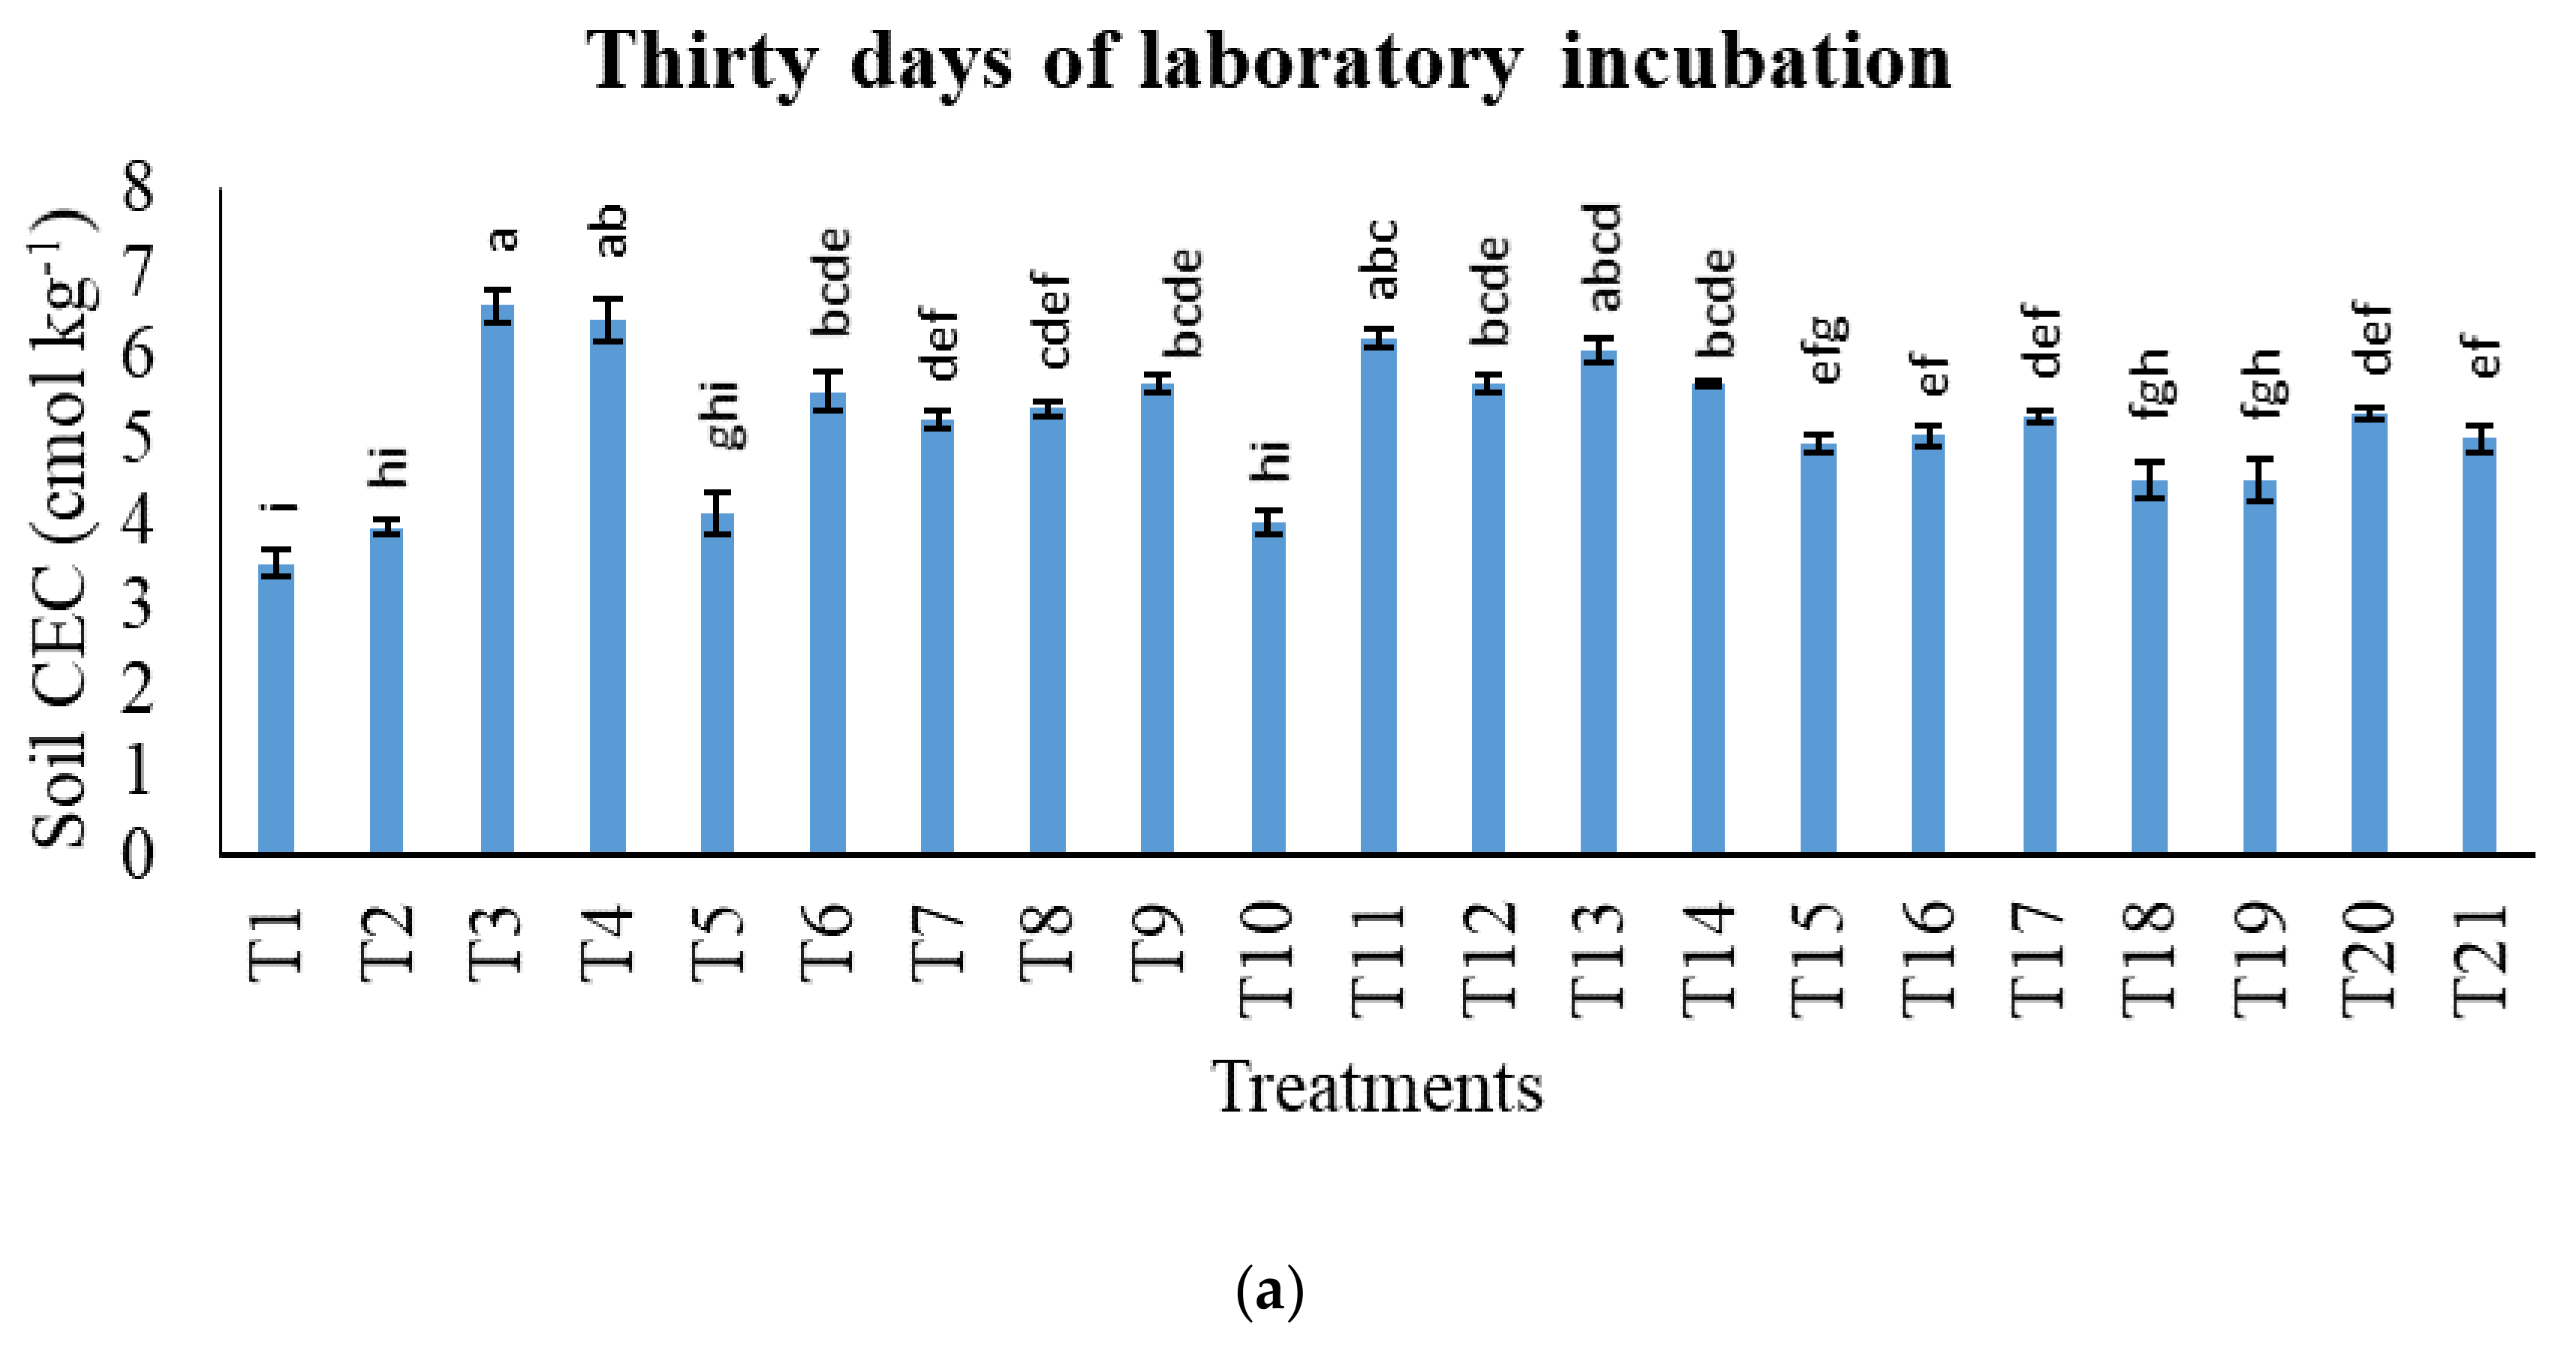
3.1. Treatments on pH in Potassium Chloride, Total Carbon, Cation Exchange Capacity, Exchangeable Acidity, Exchangeable Aluminium, and Exchangeable Hydrogen

At 30 DAI (days after incubation), the pH levels in KCl of the soil control (T1), the normal fertilization (T2), the soil with charcoal only (T5), and the soil with 20% recommended rate of charcoal and sago bark ash (T21) were similar but significantly lower than those of T3, T4, T6, T7, T8, T9, T10, T11, T12, T13, T14, and T15 (Figure 1). At 60 DAI, only T2 was similar to T1 in terms of pH, and it had the lowest pH compared with other treatments. This was due to the addition of amendments in the other treatments that were basic in nature (Table 1). Although the soil with 100% of the recommended rate of charcoal and sago bark ash (T3) had the highest value of pH at 60 DAI, statistically the effect was not significantly different compared to soil with sago bark ash only (T4), and soil with 80% of the recommended rate of charcoal and sago bark ash (T6). The high pH of these treatments could be ascribed to their high ash content (Table 1 and Table 2) because ash contains substantial amounts of CaCO3, CaO, and MgO, which serve as pH-neutralizing compounds [55]. The soil pH for T3 and T4 were similar at 90 DAI. The soil with 20% of the recommended rate of charcoal and sago bark ash (T21) improved pH significantly compared with T1 and T2 only from 60 DAI onwards. This was due to the low ash content in T21 and the charcoal’s resistance to decomposition. According to Paustian et al. [56], charcoal is considerably more recalcitrant than soil organic matter, and decomposes very slowly. A laboratory study on charcoal produced from six different biomass sources—living wood portions of oak (Quercus laurifolia), pine (Pinus taeda), cedar (Juniperus virginiana), and bubinga (Guibourtia demeusei), stems and blades of Eastern gamma grass (Tripsacum dactyloides), and sugar cane bagasse—reported half-lives ranging from 102 to 107 years [57]. The slow rate of charcoal decomposition could also be regarded as the reason behind low pH in KCl of soil with charcoal only (T5) throughout the incubation study. Nevertheless, the ability of the two amendments to release organic anions as they decompose [58] can also be accredited as a reason behind the increase in pH of amended treatments. Haynes and Mokolobate [59] asserted that phenolic and humic substances produced via decomposition of soil amendments are able to release organic anions which neutralize H+ to reduce soil pH. Acidic soils usually have very low levels of available nutrients, because nutrient availability depends on soil pH. Most nutrients are available at pH 6.5–7.5. Thus, improving soil pH could increase the nutrient uptake of crops. In this study, there was no significant difference between normal fertilization (T2) compared to soil only (T1), regardless of incubation period. This can be explained by the fact that the form in which K was added to the soil as MOP has no effect on soil acidification. This conforms to the findings of Belay et al. [60] who also reported no significant difference in the pH of soil applied with MOP compared to the soil control.
The highest soil-exchangeable acidity in the soil control (T1) compared with other treatments, irrespective of incubation period, was due to the acidic nature of Typic Paleudults (Table 1). Although there was no significant difference in terms of the pH of T1 and T2, T2 demonstrated lower soil-exchangeable acidity compared with T1 (Figure 2). This was due to the hydrolysis of Al and Fe creating inconsistent release of H+ into the soil solution. The application of amendments reduced the soil-exchangeable acidity significantly for all of the incubation periods. This was attributable to the high affinity of sago bark ash and charcoal for Al and Fe, which reduces the solubility of both ions. The addition of organic matter in the form of charcoal causes chelation of soluble Al and Fe by organic molecules. Organic matter is made up of humic substances comprising many negative charges and functional groups such as carboxyl, hydroxyl, and carbonyl, which react with Al and Fe to form stable complexes [61]. The affinity of ash for Al and Fe is associated with the presence of Mg and Ca oxides, which are capable of neutralizing soil acidity [62,63,64]. The effects of T6, T11, and T14 on soil-exchangeable acidity increased from 60 to 90 DAI. Reduction of soil-exchangeable acidity decreases heavy metals such as Al3+, Fe2+, and Mn2+ ions toxicity and this improves maize growth, nutrients uptake, nutrients recovery efficiency, agronomic efficiency, and yield [41].
Similar to soil-exchangeable acidity, the soil-exchangeable Al3+ in T1 and T2 were higher than in other treatments regardless of incubation period (Figure 3), because of the inherent content of Al3+ in Typic Paleudults (Table 1). According to Kochian et al. [65], the solubility of Al3+ increases at pH levels lower than 5.5, and this eventually becomes toxic for plants. Although the soil-exchangeable Al3+ of T1 was higher than in T2 at 30 DAI and 90 DAI, T2 had a greater amount of soil-exchangeable Al3+ at 60 DAI compared to T1. This could be attributed to the higher amounts of exchangeable H+ at 30 DAI in T2 causing a reverse reaction (condensation of H+). This resulted in higher Al production and lower release of exchangeable H+ at 60 DAI (Figure 4). Charcoal and sago bark ash mitigated Al toxicity by inhibiting the increase of exchangeable Al3+ in amended treatments. In other words, the amendments impeded Al3+ hydrolysis to produce more H+ ions. For example, a complete hydrolysis of one mole of Al3+ released three moles of H+ ions to decrease soil pH. The improved pH of the soils with these treatments caused the solubility of Al3+ to decrease during repeated deprotonation for Al3+ precipitate [58]. This validates another study where Al hydrolysis was reduced when the soil solution pH increased from 4.3 to 5.5 after application of char derived from manure [66]. In a study on the response of forest soil to different rates of wood ash application in a 35-year-old pine (Pinus sylvestris L.) stand in South Sweden, Bramyrd and Frashman [67] reported a decrease in soil acidity and Al concentration in ash amended plot. Moreover, the highly porous structure of charcoal is able to adsorb Al3+, hence improving soil pH. Several studies reported the ability of charcoal to trap Al3+ in their pores. Entrapment ultimately enhances the development of fine roots and hyphae of arbuscular mycorrhizae and ectomycorrhizae [68,69,70,71]. Application of charcoal and sago bark ash was effective in reducing soil-exchangeable acidity from 30 DAI. This indicates that the amendments can also be used for short-term crops such as radishes, turnips, and kale. A similar result was notable in another study that used biochar to mitigate Al and Fe toxicity by fixing P [72].
The effects of treatments on soil-exchangeable H+ at 30, 60, and 90 DAI are presented in Figure 4. At 30 DAI, the soil-exchangeable H+ levels in T2 and T10 were similar but higher than the other treatments evaluated. However, the soil-exchangeable H+ in these two treatments was significantly reduced at 60 DAI. Conversely, T1 demonstrated its highest soil-exchangeable H+ level at 60 and 90 DAI. At 60 and 90 DAI, T10 and T5 had higher soil-exchangeable H+ compared with other treatments that were amended with sago bark ash and charcoal. The high soil-exchangeable H+ of both treatments was due to their high soil-exchangeable acidity (Figure 2). Apart from these treatments, the addition of the amendments reduced soil-exchangeable H+, suggesting that the release of base cations such as K+, Ca2+, Mg2+, and Na+ from the amendments and MOP fertilizer contributed to the increase in the soil pH and the immobilization of H+. This finding is comparable to that of Cai et al. [73] who also reported that the addition of amendments with higher base saturation to acidic soils can increase their base saturation, thus improving immobilization of H+ via exchange reactions between soils and amendments. The differences between the initial characterization of the soil and the incubated samples of T1 were caused by the addition of water at 60% field capacity in the incubated samples. Water reacts with aluminium to produce H+ (hydrolysis reaction). Hence, the decrease in aluminium was notable in the incubated sample, whereas exchangeable H+ increased. However, the H+ released during the hydrolysis is lost through hydrogen gas. This was notable in the present study, where H+ initially increased from 30 DAI to 60 DAI, but decreased at 90 DAI. The loss of H+ through its gaseous state caused reduction in total acidity throughout the incubation study.
At 30 DAI and 60 DAI, the effects of the soil control (T1) on CEC compared to normal fertilization (T2), soil with charcoal only (T5), and soil with 80% of the recommended rate of charcoal and 60% of the recommended rate sago bark ash (T10) were similar to each other, but significantly lower than all the other treatments (Figure 5). In addition to T2, T5, and T10, at 90 DAI the effects of T16, T17, T19, T20, and T21 on CEC were similar to that of T1. Apart from these treatments, the addition of charcoal and sago bark bash improved CEC. Surface oxidation of aromatic rings of charcoal results in carboxylation, thus creating several negative-charged sites, to increase surface sorption ability [33,74], whereas sago bark ash enhances soil pH to increase base saturation of soil [75,76,77]. This reasoning is consistent with observations made by Mbah et al. [78] where CEC increased as a result of increases in soil-exchangeable bases after the application of wood ash and coconut shell ash on an Acrisol. Acrisols are defined by the presence of a subsurface layer of accumulated kaolinitic clays that is responsible for low CEC. Improved soil CEC enables soils to hold more cations such as K, Ca, and Mg [18] due to which these nutrients become available for plant uptake for a longer period. The low CEC of T1 and T2 was due to the lack of addition of soil amendments and to the inherent properties of Bekenu Series (Table 1). The effects of T6, T11, and T14 on CEC decreased from 60 to 90 DAI.
The TC of the soil control (T1) and normal fertilization (T2) were similar at 30 DAI and 60 DAI because of the lack of organic matter addition (Figure 6). Soil with sago bark ash only (T4), the soil with 20% of the recommended rate of charcoal and 60% of the recommended rate of sago bark ash (T13), the soil with 20% of the recommended rate of charcoal and 40% of the recommended rate sago bark ash (T17), and the soil with 20% of the recommended rate of charcoal and 20% of the recommended rate of sago bark ash (T21) had no significant effect on TC compared with T2 at 30 and 60 DAI. This was ascribed to the low or absence of charcoal in T4, T13, T17, and T21. Studies by Biederman and Harpole [33] and Major et al. [73] emphasized charcoal’s ability to increase carbon content. At 90 DAI, soil only (T1) demonstrated the lowest TC among the treatments. The TC of the soil with 20% of the recommended rate of charcoal and 60% of the recommended rate of sago bark ash (T13), and that of the soil with 20% of the recommended rate of charcoal and 40% of the recommended rate of sago bark ash (T17), were different from that of normal fertilization (T2) at 90 DAI. This was due to the slow decomposition rate of charcoal [79,80]. Soil TC increased with the increasing rates of charcoal. Increased TC could improve nutrient adsorption in the soil. Hence, more nutrients would be available for crop uptake and not compromised by leaching loss. Charcoal is made up of aromatic carbon resulting from loss of volatile matter and the conversion of alkyl groups to aryl groups [36]. The loss of volatile matter creates voids which form extensive pore networks in the charcoal structure that could serve to retain nutrients. Moreover, surface oxidation of aromatic rings of charcoal causes carboxylation, which results in the creation of large numbers of negative-charged sites that increase soil CEC, causing adsorption of cations to increase, while nutrient leaching is reduced [38]. In the current study, the addition of water at 60% field capacity enhanced the degradation of organic matter in T1 compared with the initial chemical properties before incubation. As a result, carbon content decreased, whereas nutrients such as K and Mg increased. The released nutrients occupied the exchange sites in the soil to reduce the soil CEC (T1).

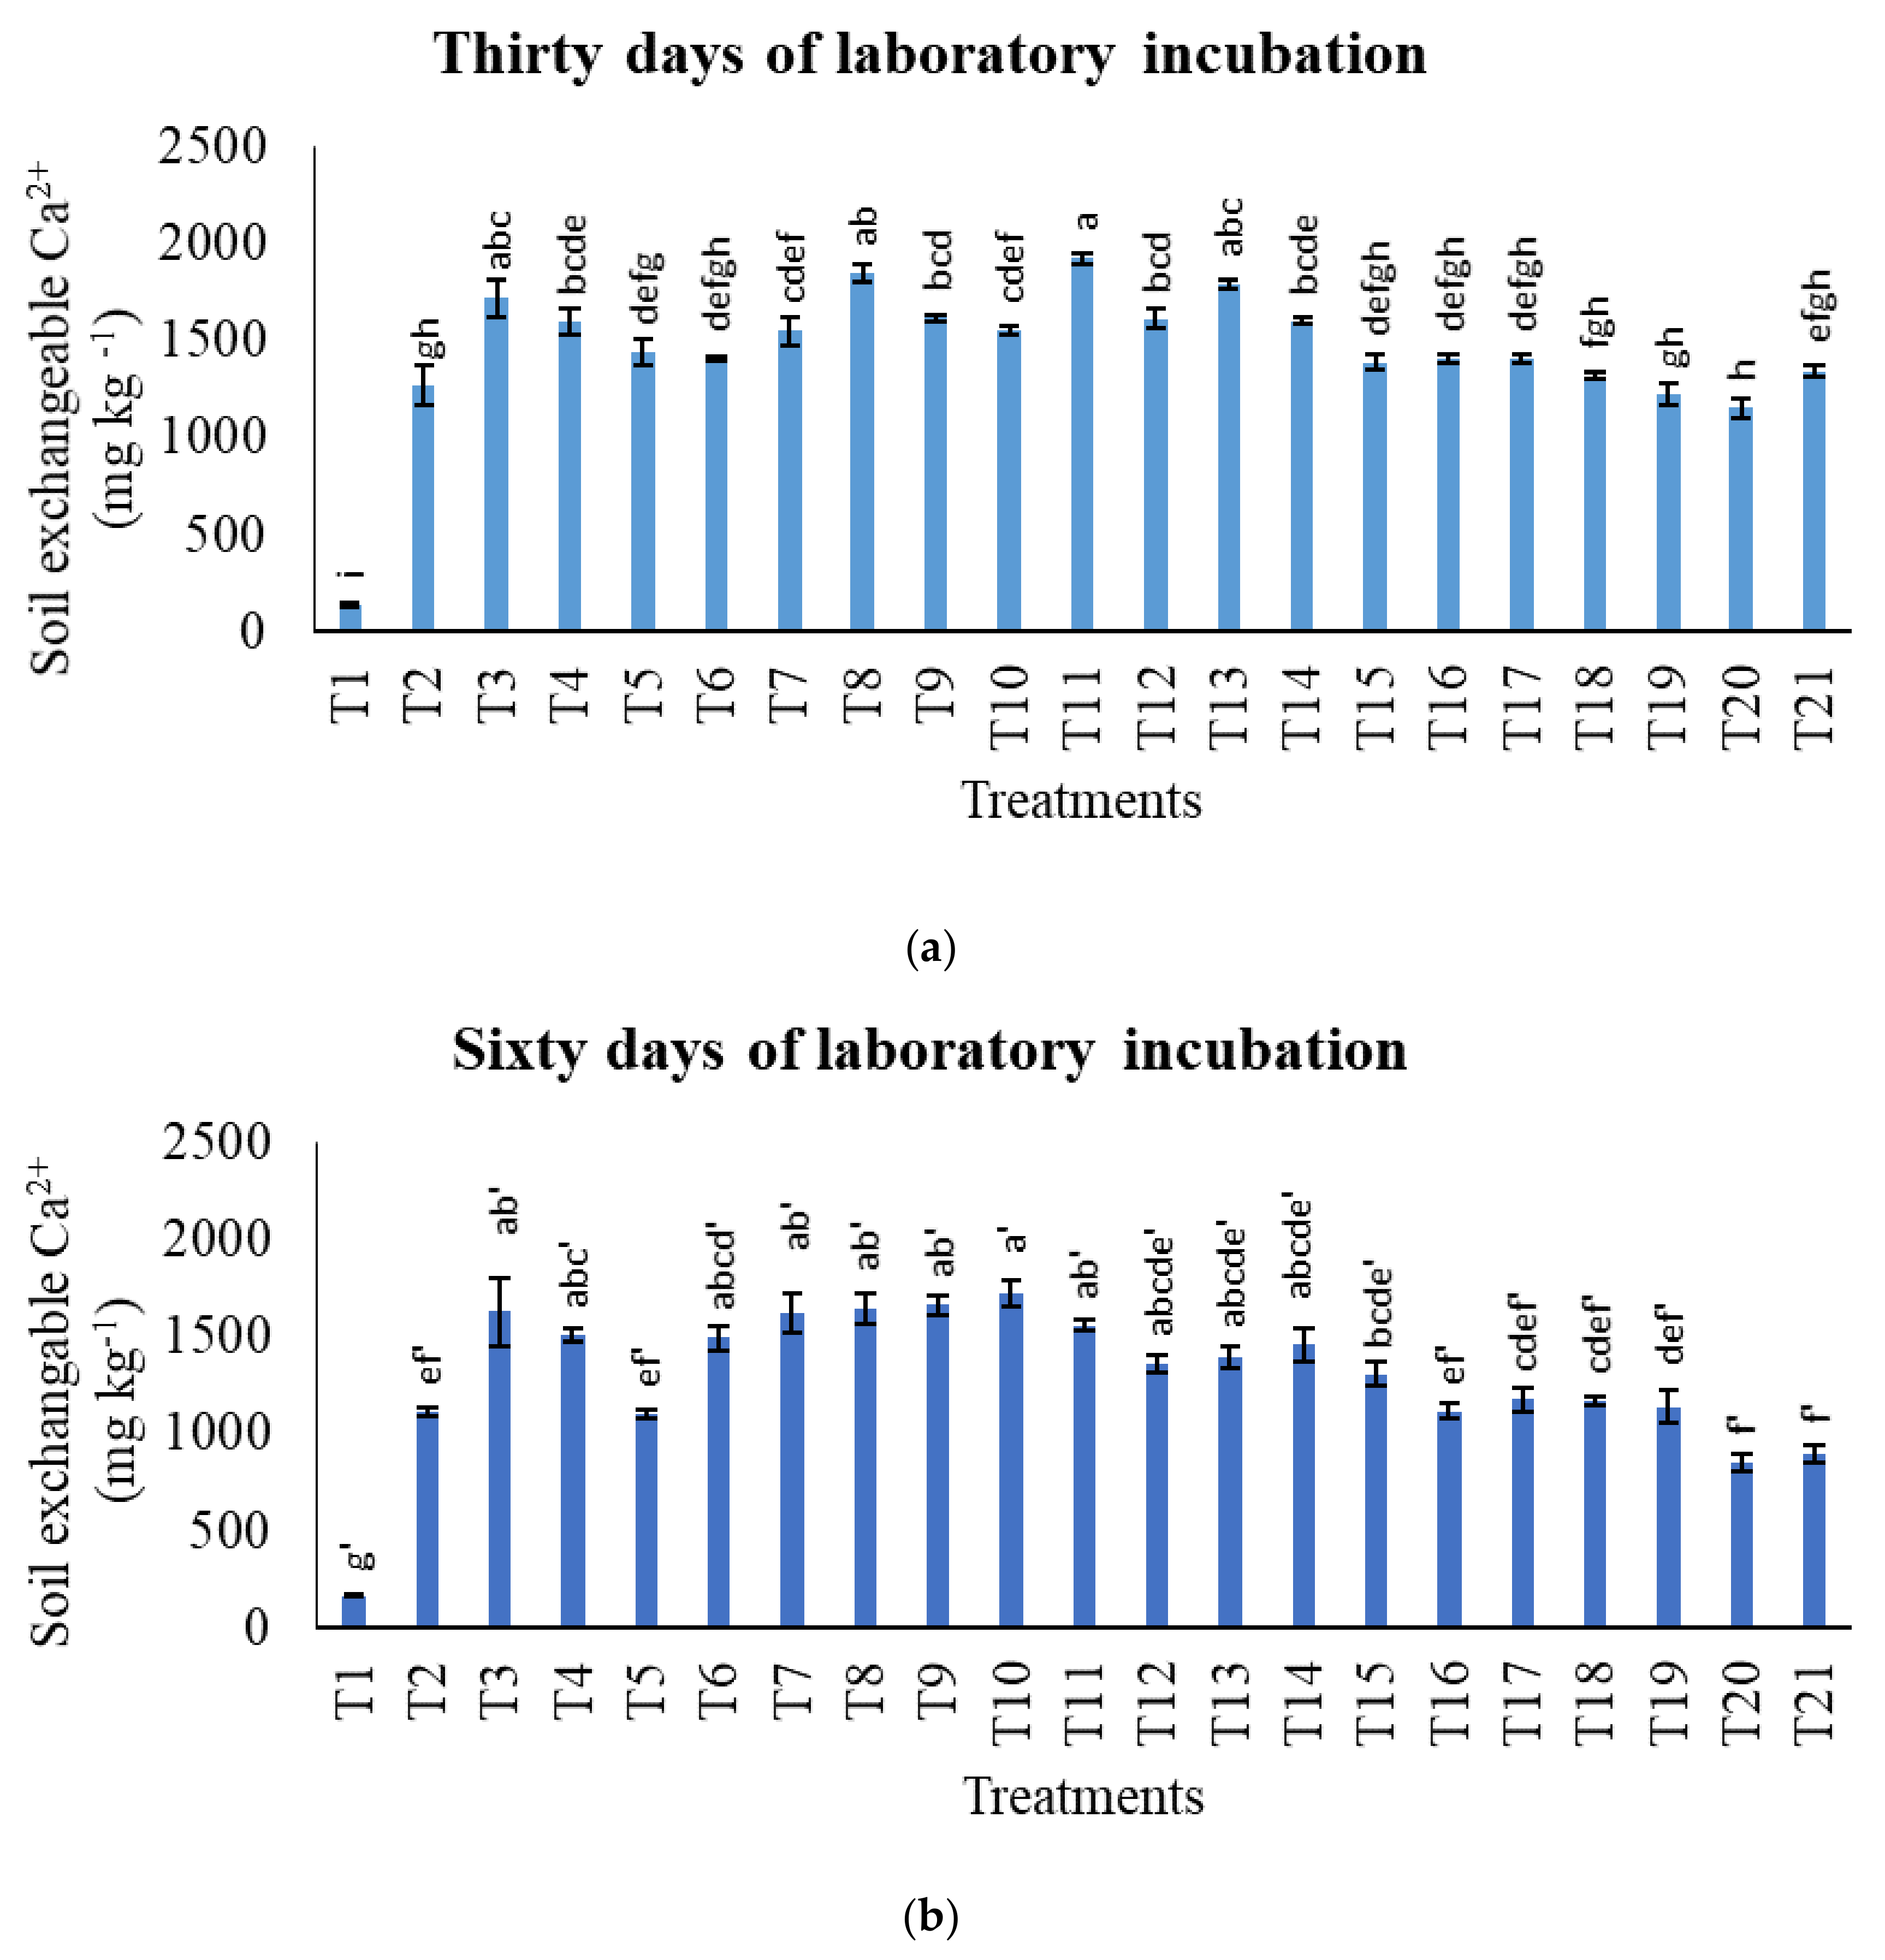
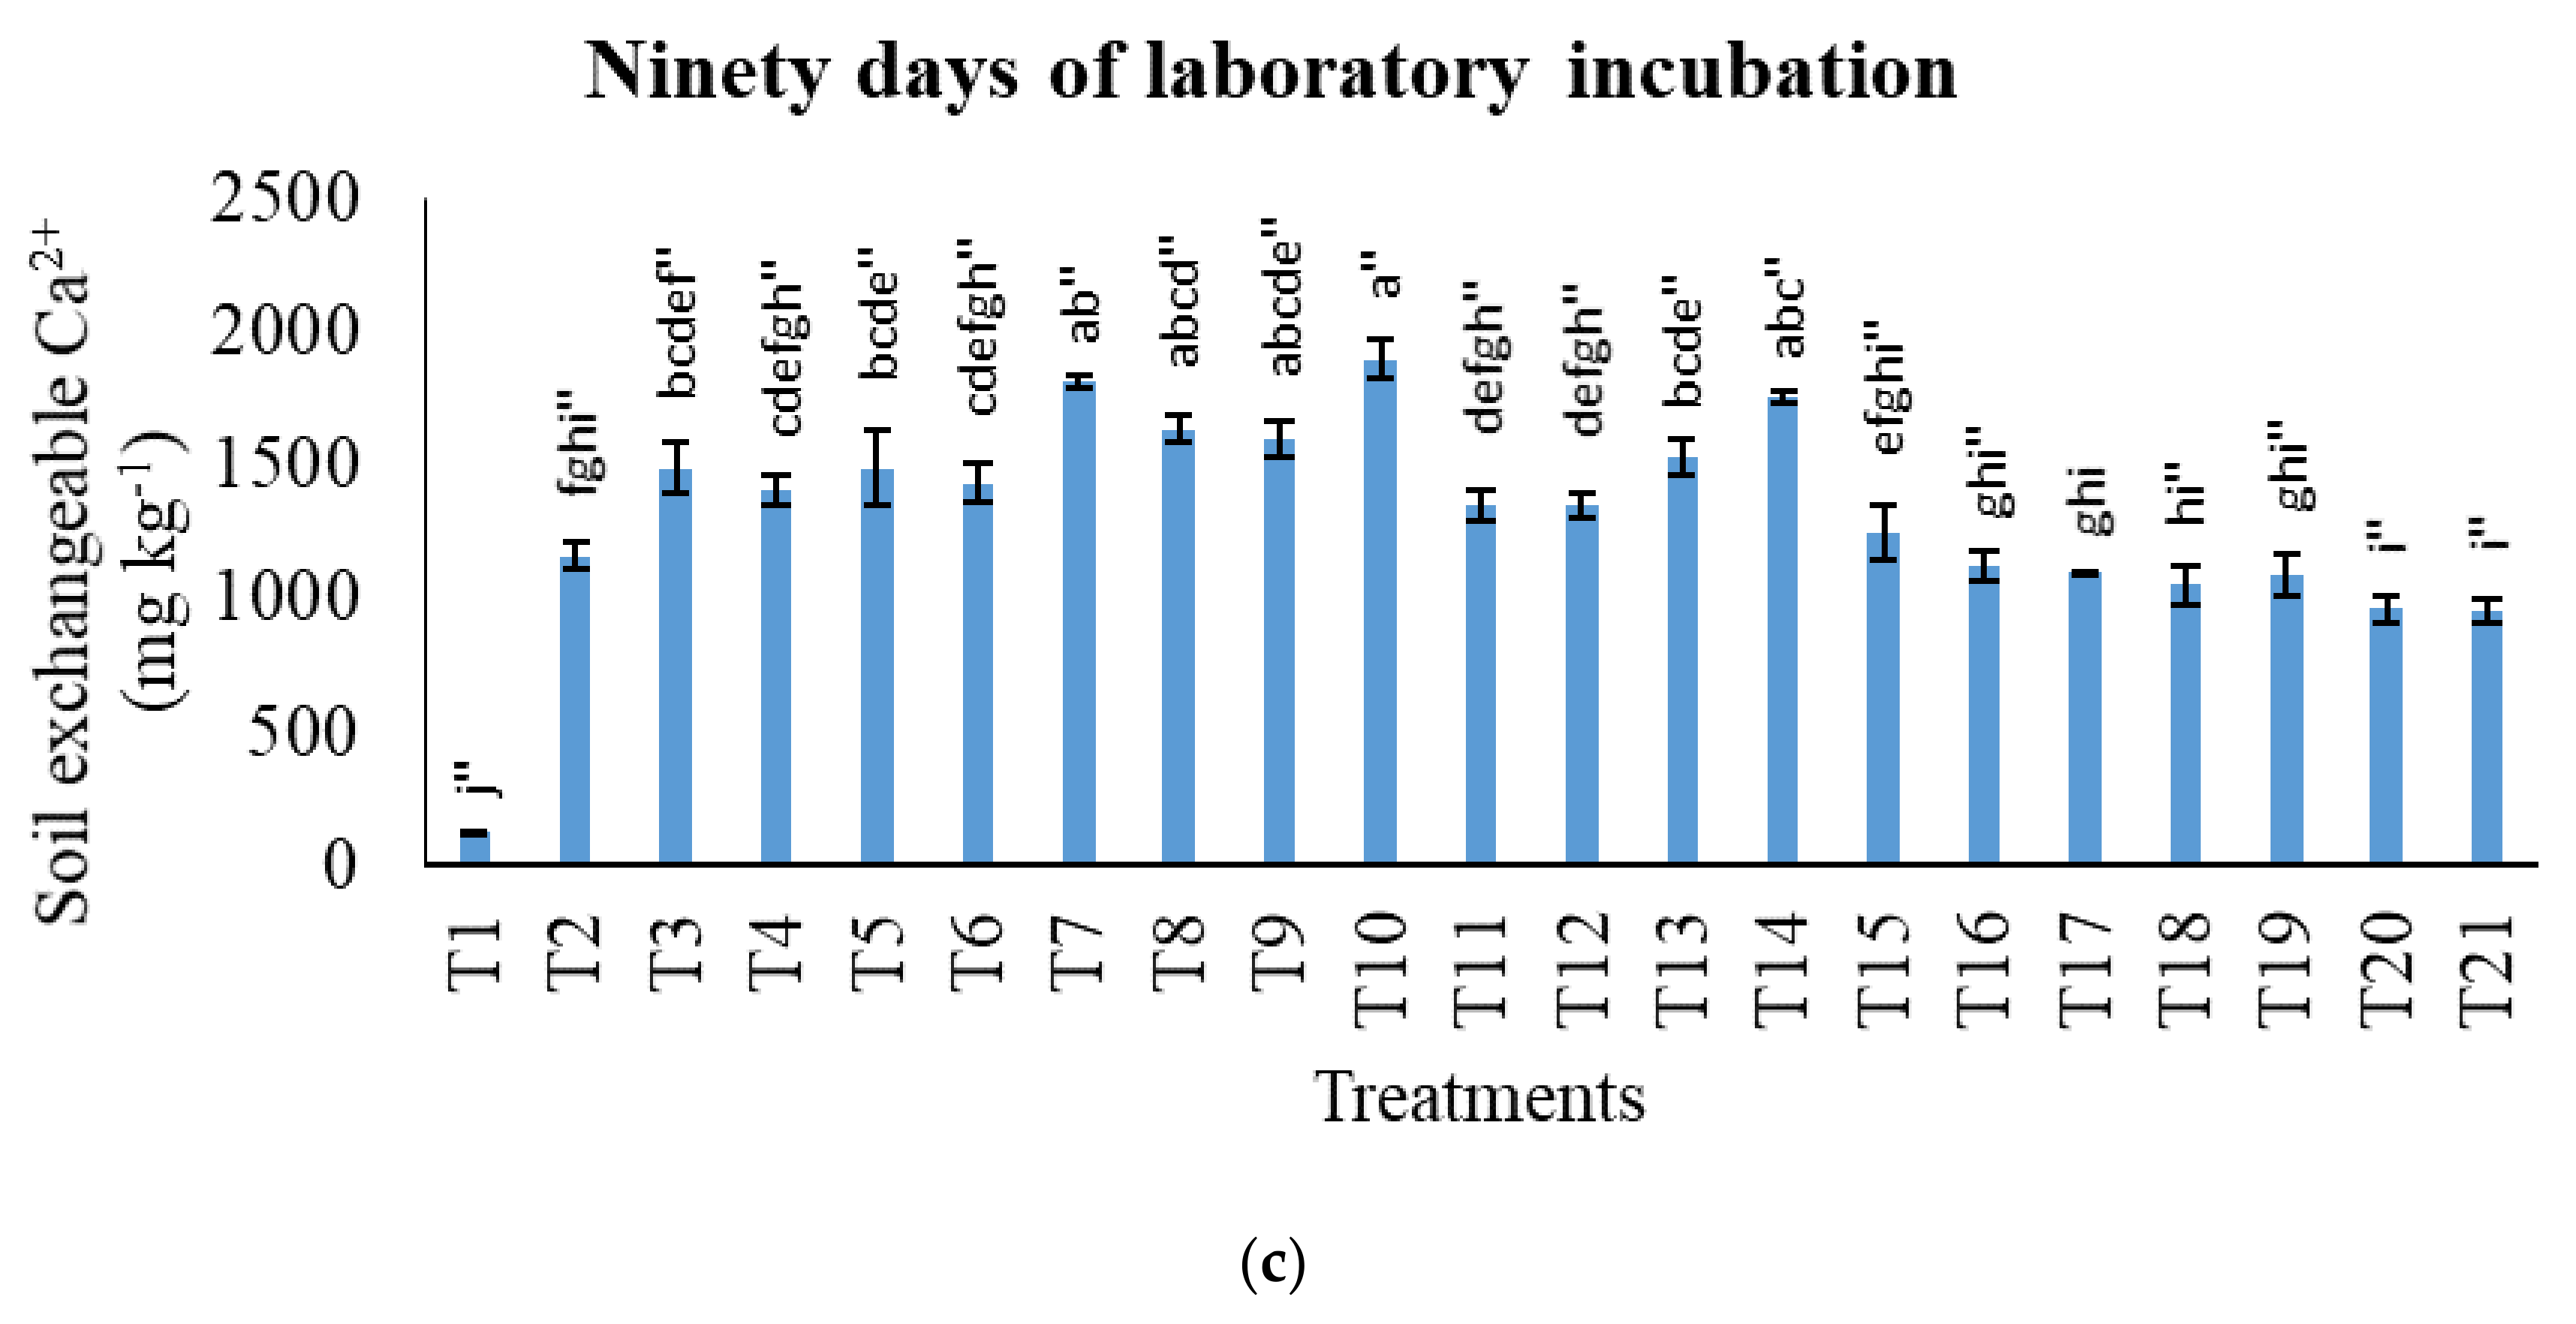
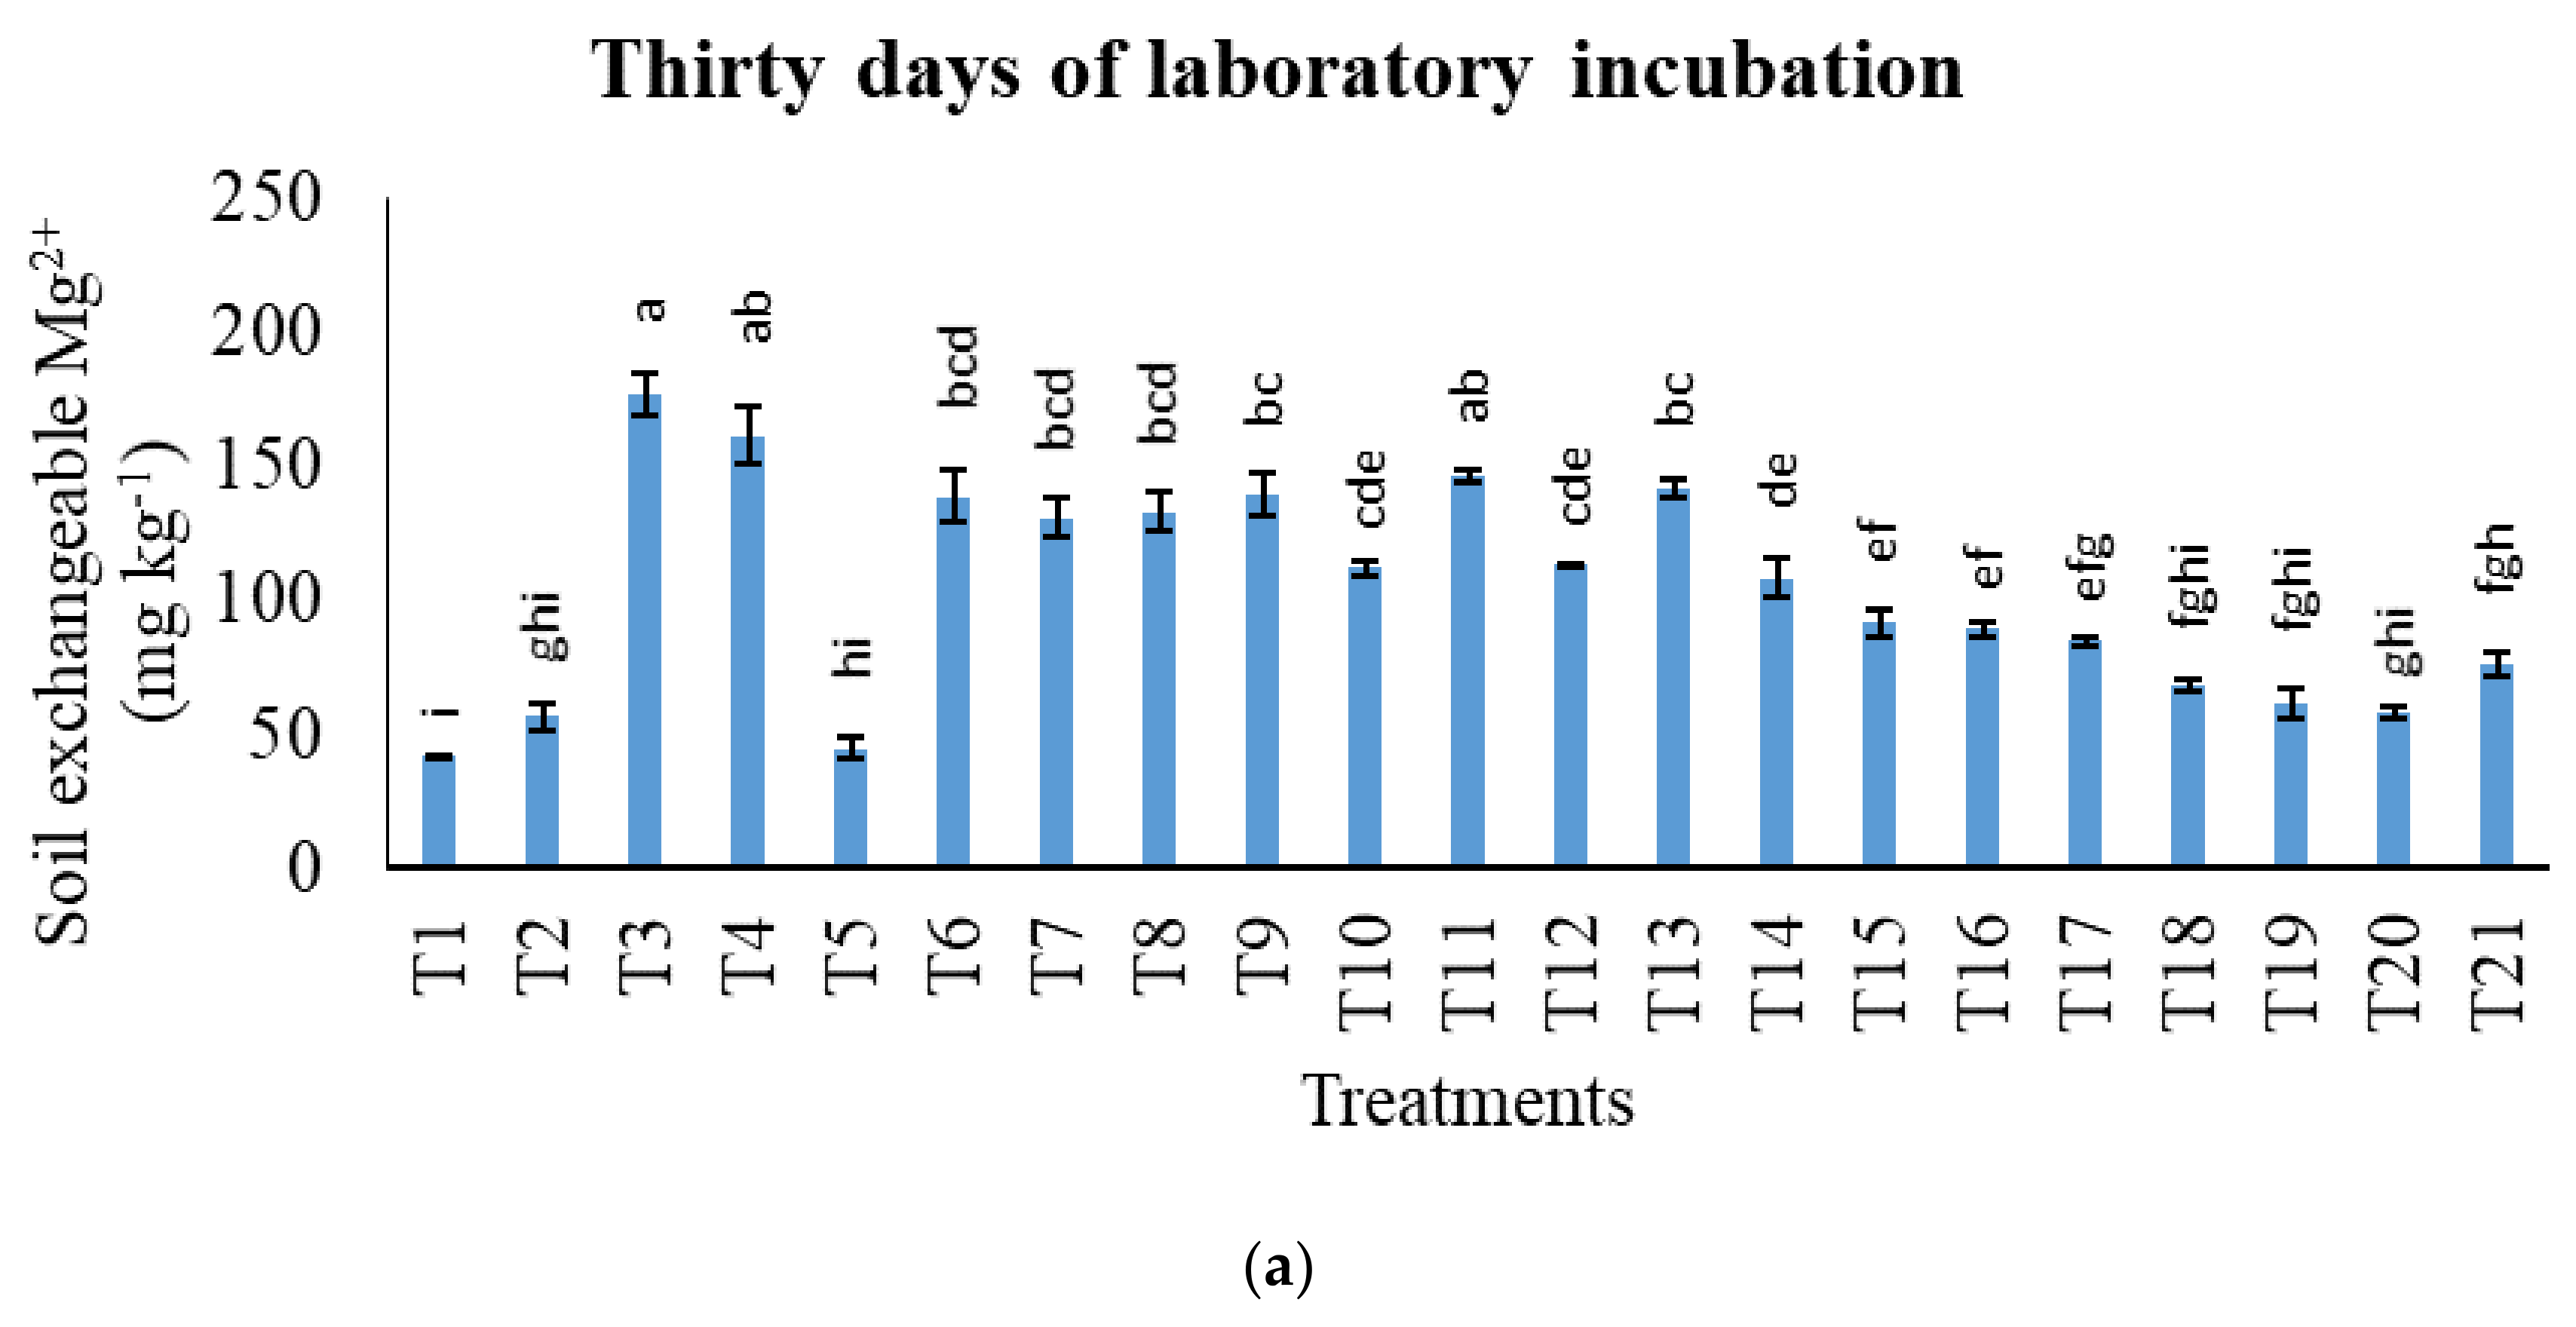
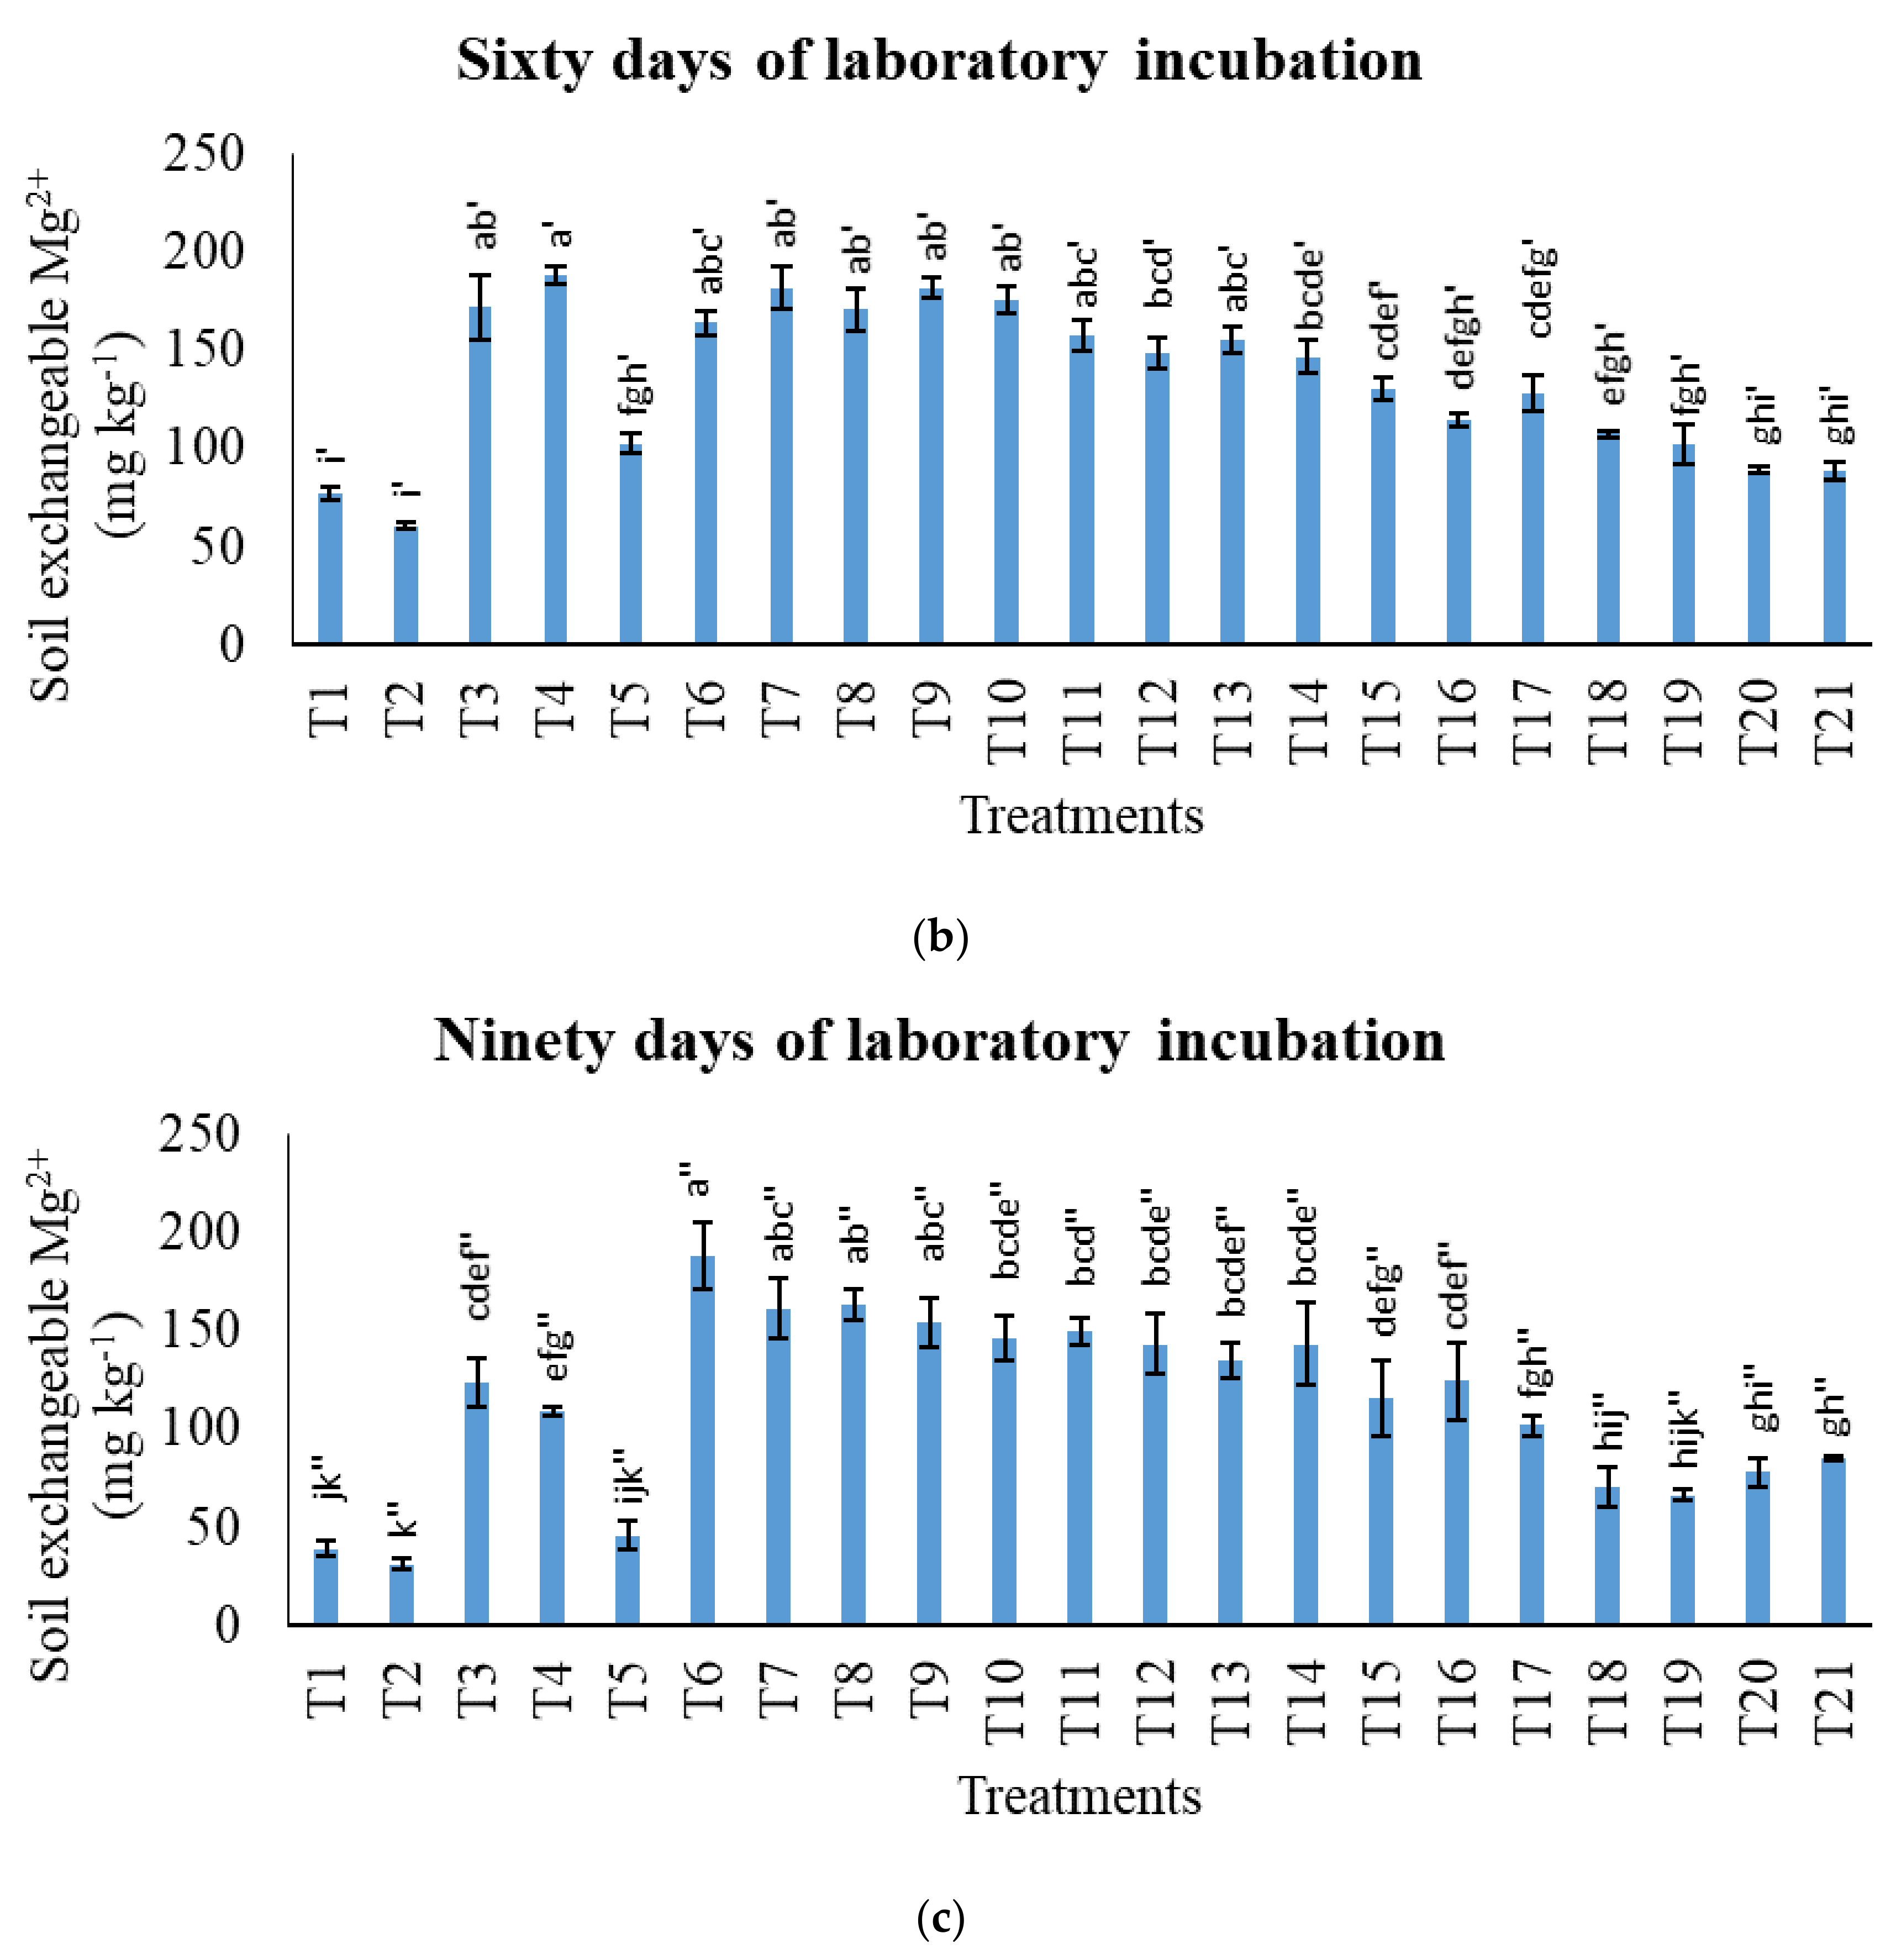
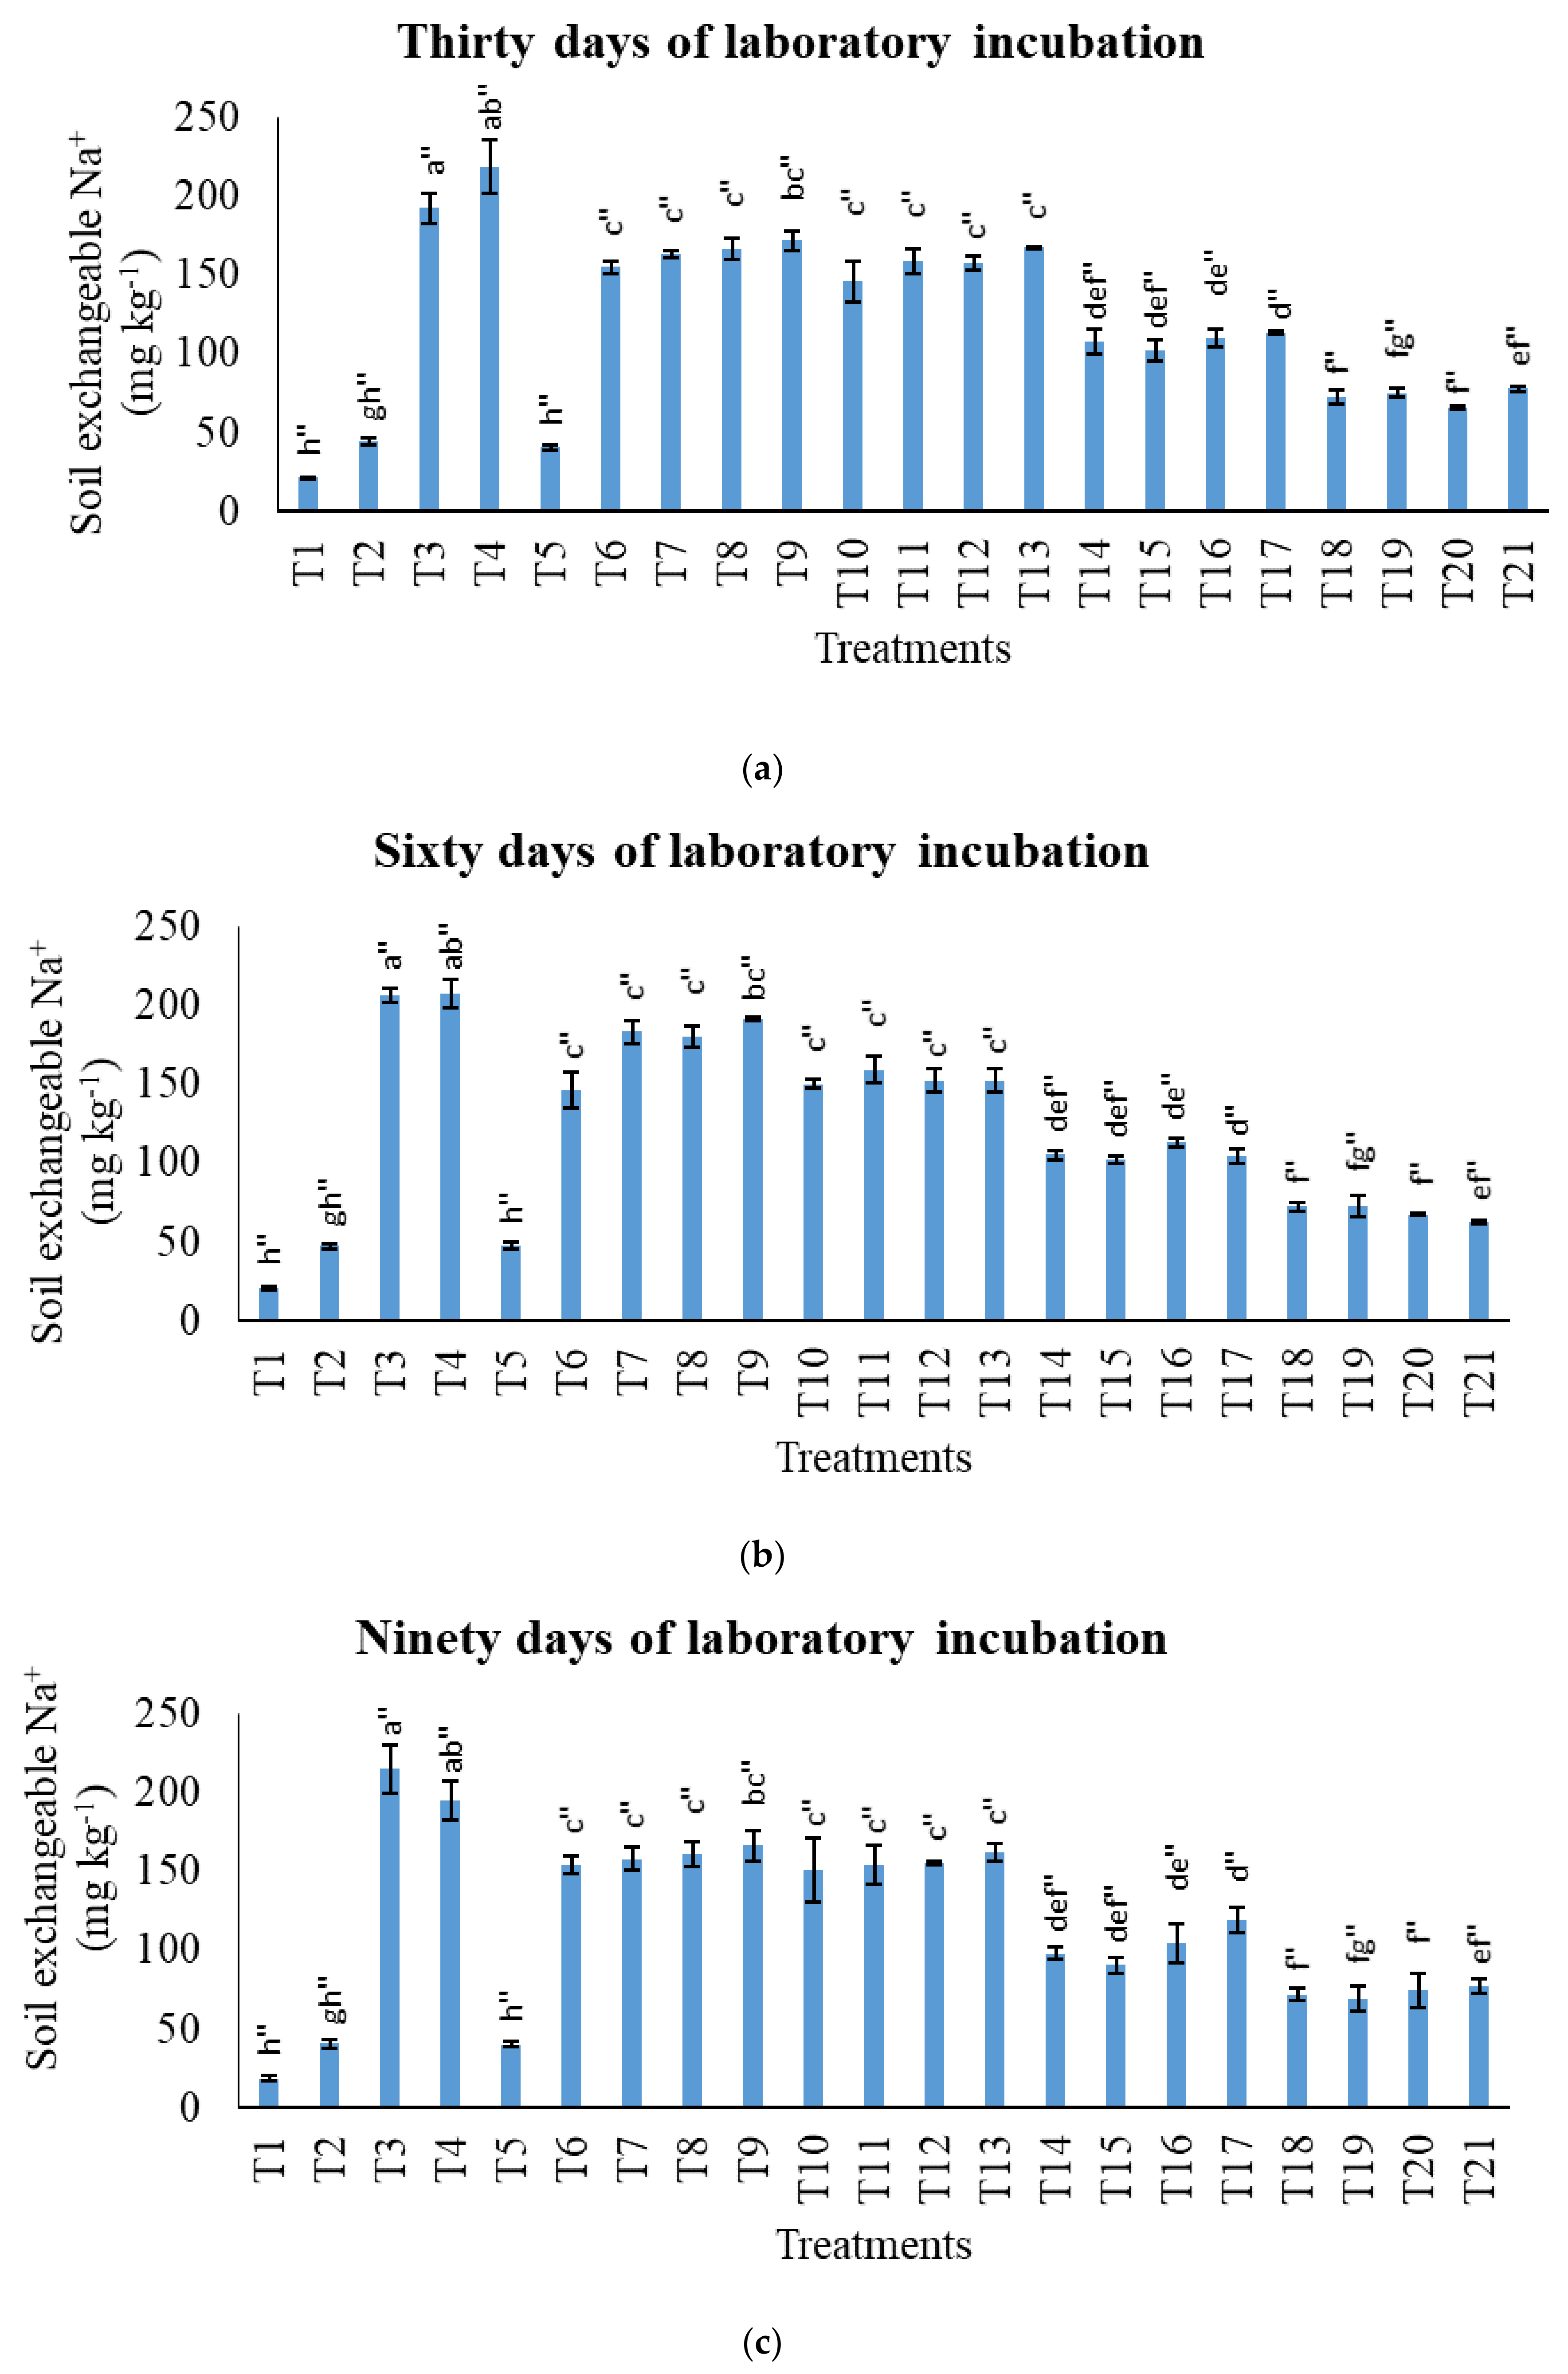
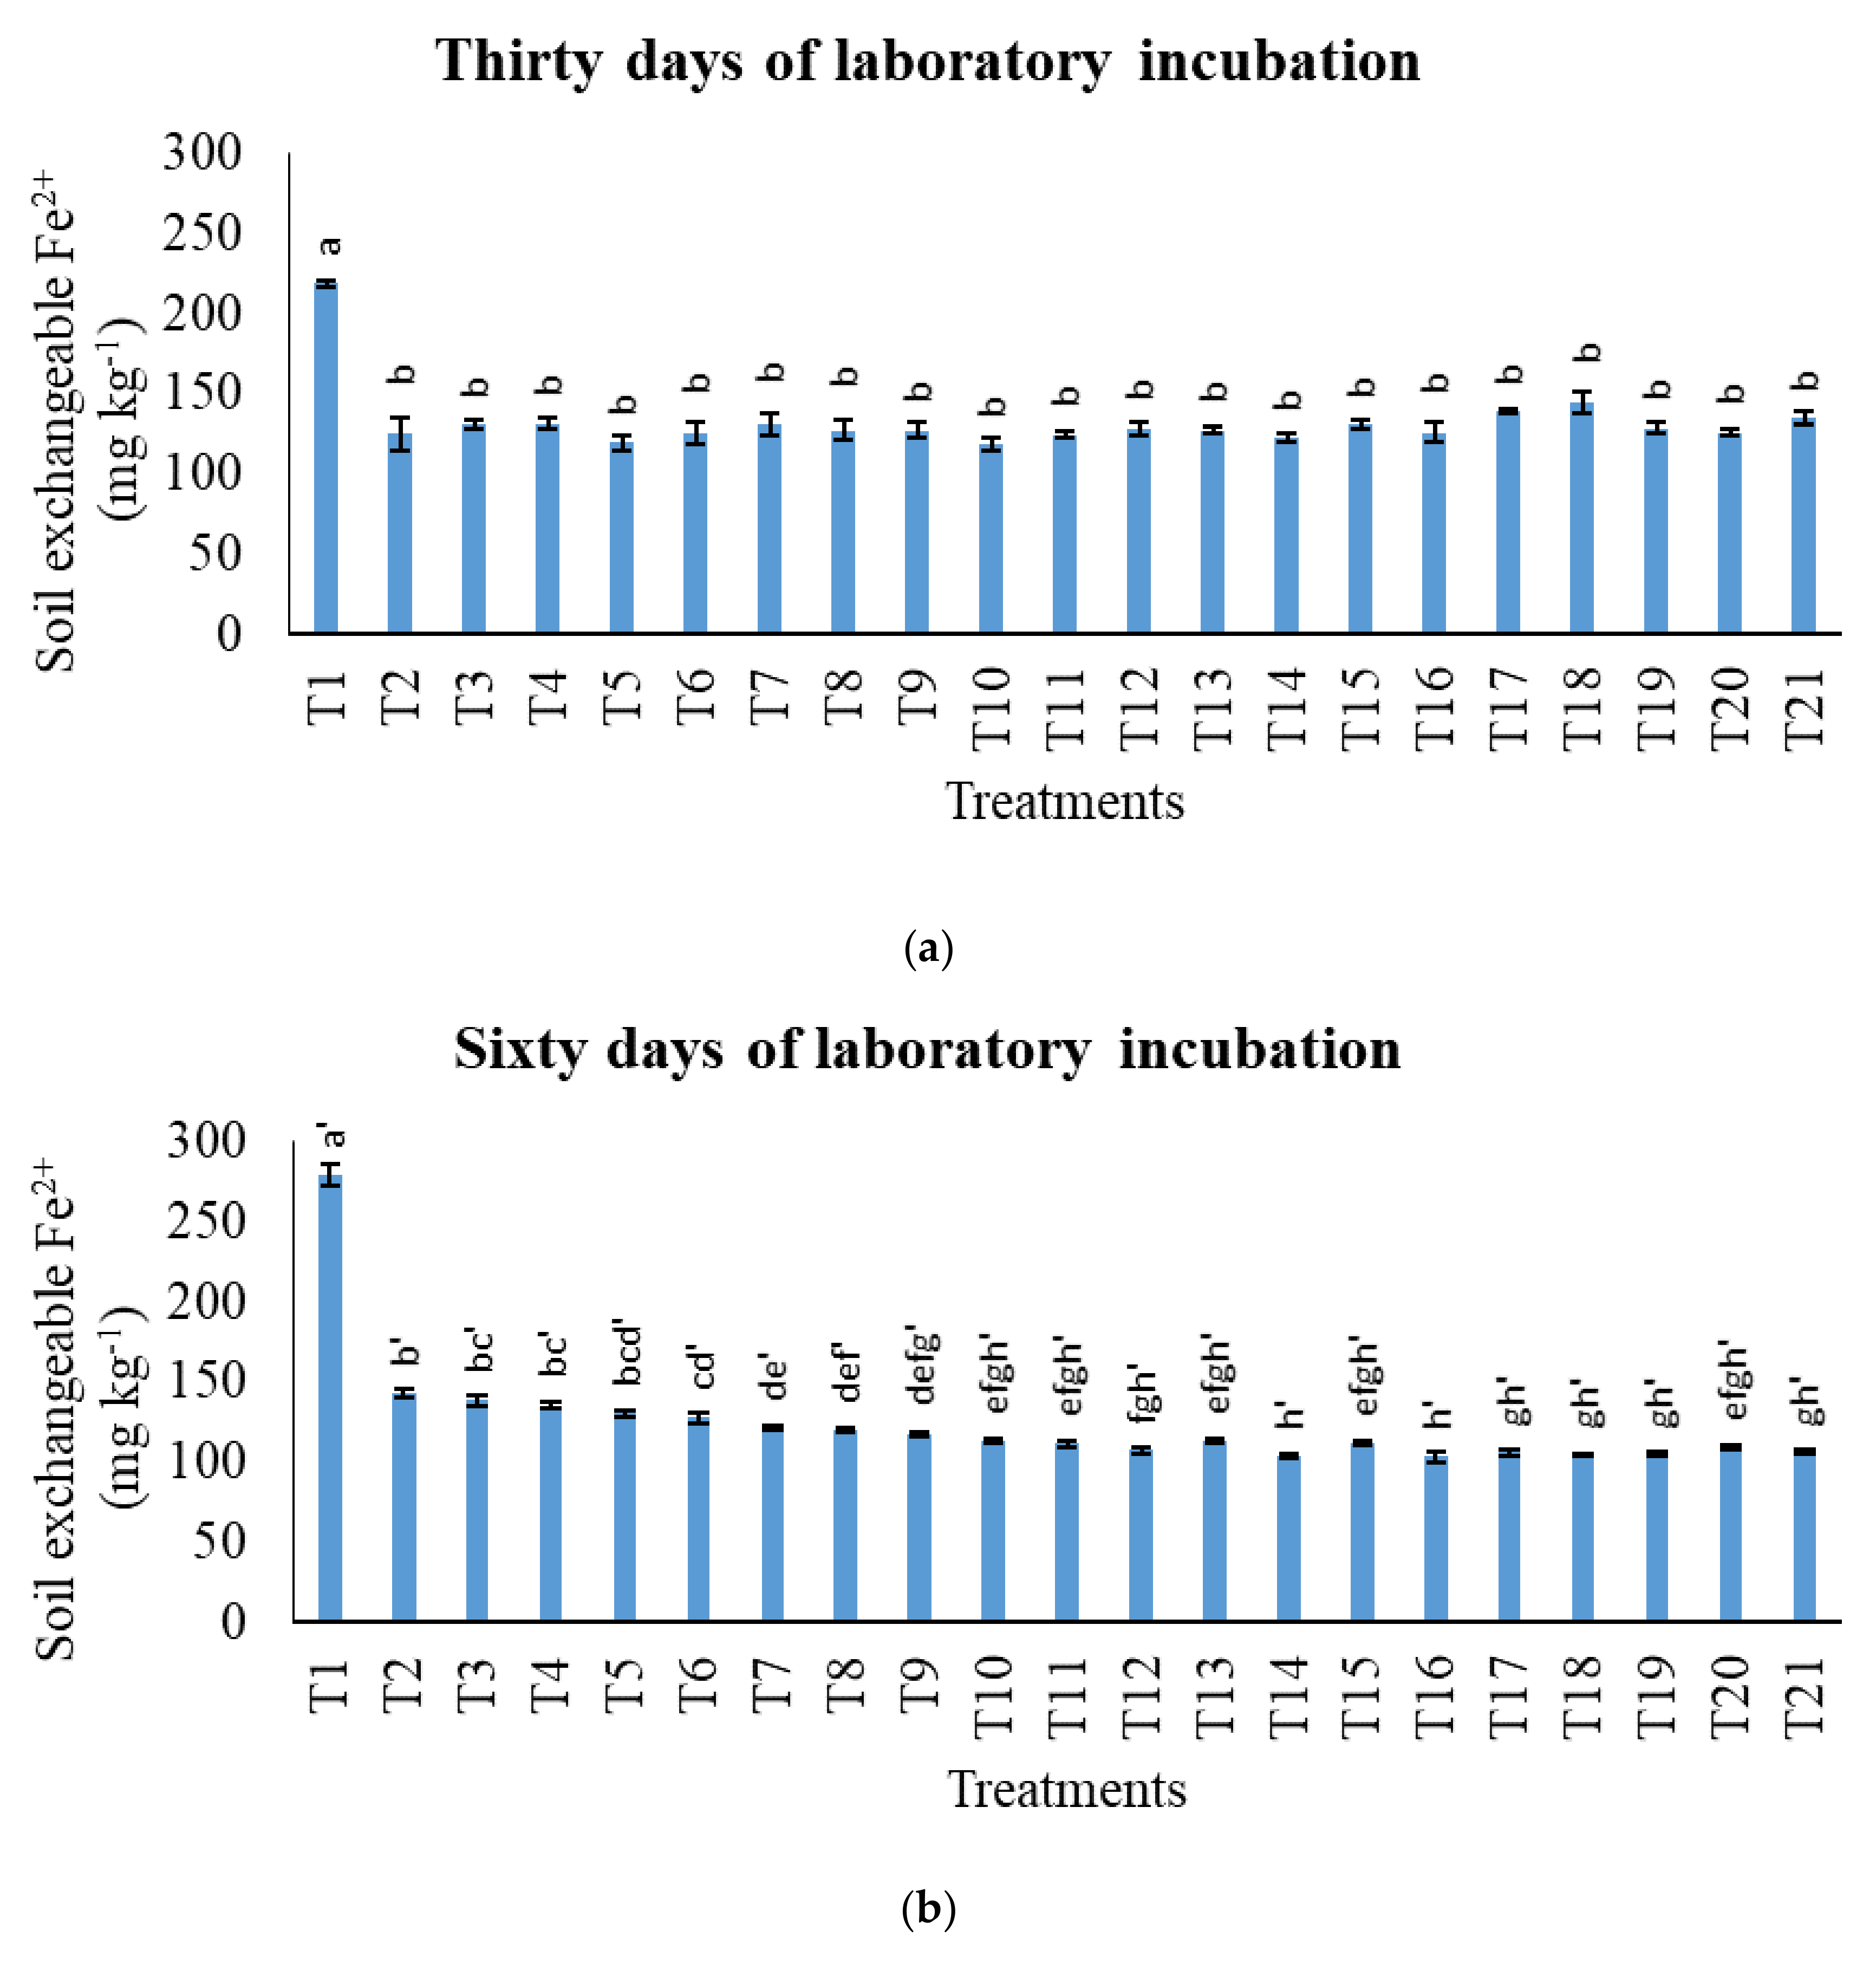
3.2. Treatments on Soil-Exchangeable Calcium, Exchangeable Magnesium, Exchangeable Sodium, and Exchangeable Iron

Application of MOP along with charcoal and sago bark ash increased soil-exchangeable Ca2+ (Figure 7). The soil control (T1) had the lowest soil-exchangeable Ca2+ regardless of incubation period; this is associated with the properties of Bekenu Series (Table 1). The calcium ions in the ash in the treatments improved soil Ca. These results are consistent with those of Unger and Fernandez [81] who also found that soil Ca improved with the application of ash. Although having lower ash content in comparison with soil with 100% of the recommended rate of charcoal and sago bark ash (T3), the soil-exchangeable Ca2+ of T7, T8, T9, T10 T11, T12, T13, and T14 was statistically similar to that of T3 at 30 DAI. Also, at 60 DAI, the soil-exchangeable Ca2+ of T3 was not significantly different to those of T6, T7, T8, T9, T10 T11, T12, T13, T14, and T15. This indicates that charcoal in substantial amounts could compensate for the reduction in Ca2+ because of the lower amount of ash applied. At 90 DAI, T10 had significantly improved soil-exchangeable Ca2+ compared with T3.
Figure 8 demonstrates that application of charcoal and sago bark ash improved soil-exchangeable Mg2+. The soil with 100% of the recommended rate of charcoal and sago bark ash (T3) had a high content of Mg2+ at 30 DAI and 60 DAI. Similar to soil-exchangeable Ca2+, ash contributed to the increased exchangeable Mg2+. Despite having lower amounts of the amendments compared with T3, in the soil with sago bark ash only (T4) and the soil with 60% of the recommended rate of charcoal and sago bark ash (T11) the Mg2+ ions were similar at 30 DAI. In addition to these two treatments, at 60 DAI, the effect of T3 on soil-exchangeable Mg2+ was similar to those of T6, T7, T8, T9, T10, T12, T13, and T14. The effect of T3 on soil-exchangeable Mg2+ reduced with increasing incubation period, whereas T6 exhibited increasing trend with time. The treatments with low ash content (T18, T19, T20, and T21) had little influence on soil-exchangeable Mg2+, but co-application of charcoal improved it. The ability of the charcoal to compensate soil-exchangeable Ca2+ and Mg2+ when the amount of sago ash was reduced supported the claims made by Glaser et al. [82] that charcoal contains a certain amount of ash that adds free bases such as K, Ca, and Mg to soils. Nevertheless, there was no clear trend on the proportion of charcoal needed for the deficit.
The treatments without sago bark ash (T1, T2 and T5) had no significant effect on soil-exchangeable Na+ (Figure 9). The soil amended with 60% of the recommended rate of charcoal and 20% of the recommended rate of sago bark ash (T19) had similar Na2+ to the normal fertilization (T2), regardless of incubation period. The higher amount of sago bark ash increased soil-exchangeable Na+ (T3 and T4) because of the inherent Na of the sago bark ash (Table 1). Therefore, application of sago bark ash at the rate of 100% is not a viable practice, as it could increase soil salinity and sodicity for a long time following its application.
The soil control (T1) exhibited higher exchangeable Fe2+ compared with other treatments in this study (Figure 10), although there was no significant difference in the pH of T1 compared to normal fertilization (T2). This is due to the inconsistent release of H+ exhibited by the treatments. The treatments amended with charcoal and sago bark ash demonstrated lower amounts of soil-exchangeable Fe2+ compared with T1. The improved soil pH due to these treatments (Figure 2) reduced the solubility of Fe and Al, thus resulting in the lower amounts of both ions in the soil solution. Exchangeable Fe decreased in the soils with charcoal and sago bark ash because of precipitation and the formation of organo-metallic complexes [83]. Nevertheless, the trends exhibited by soil-exchangeable Al (Figure 3) and Fe were dissimilar for all the treatments, indicating differences in their solubility with the application of charcoal and sago bark ash. This was due to the valency state of both ions. Because Al occurs exclusively in the trivalent form, only pH and complex formation affect the solubility of its oxides, but with Fe, more than one valency state could be involved, thus redox potential could also be an important factor controlling its solubility [84].

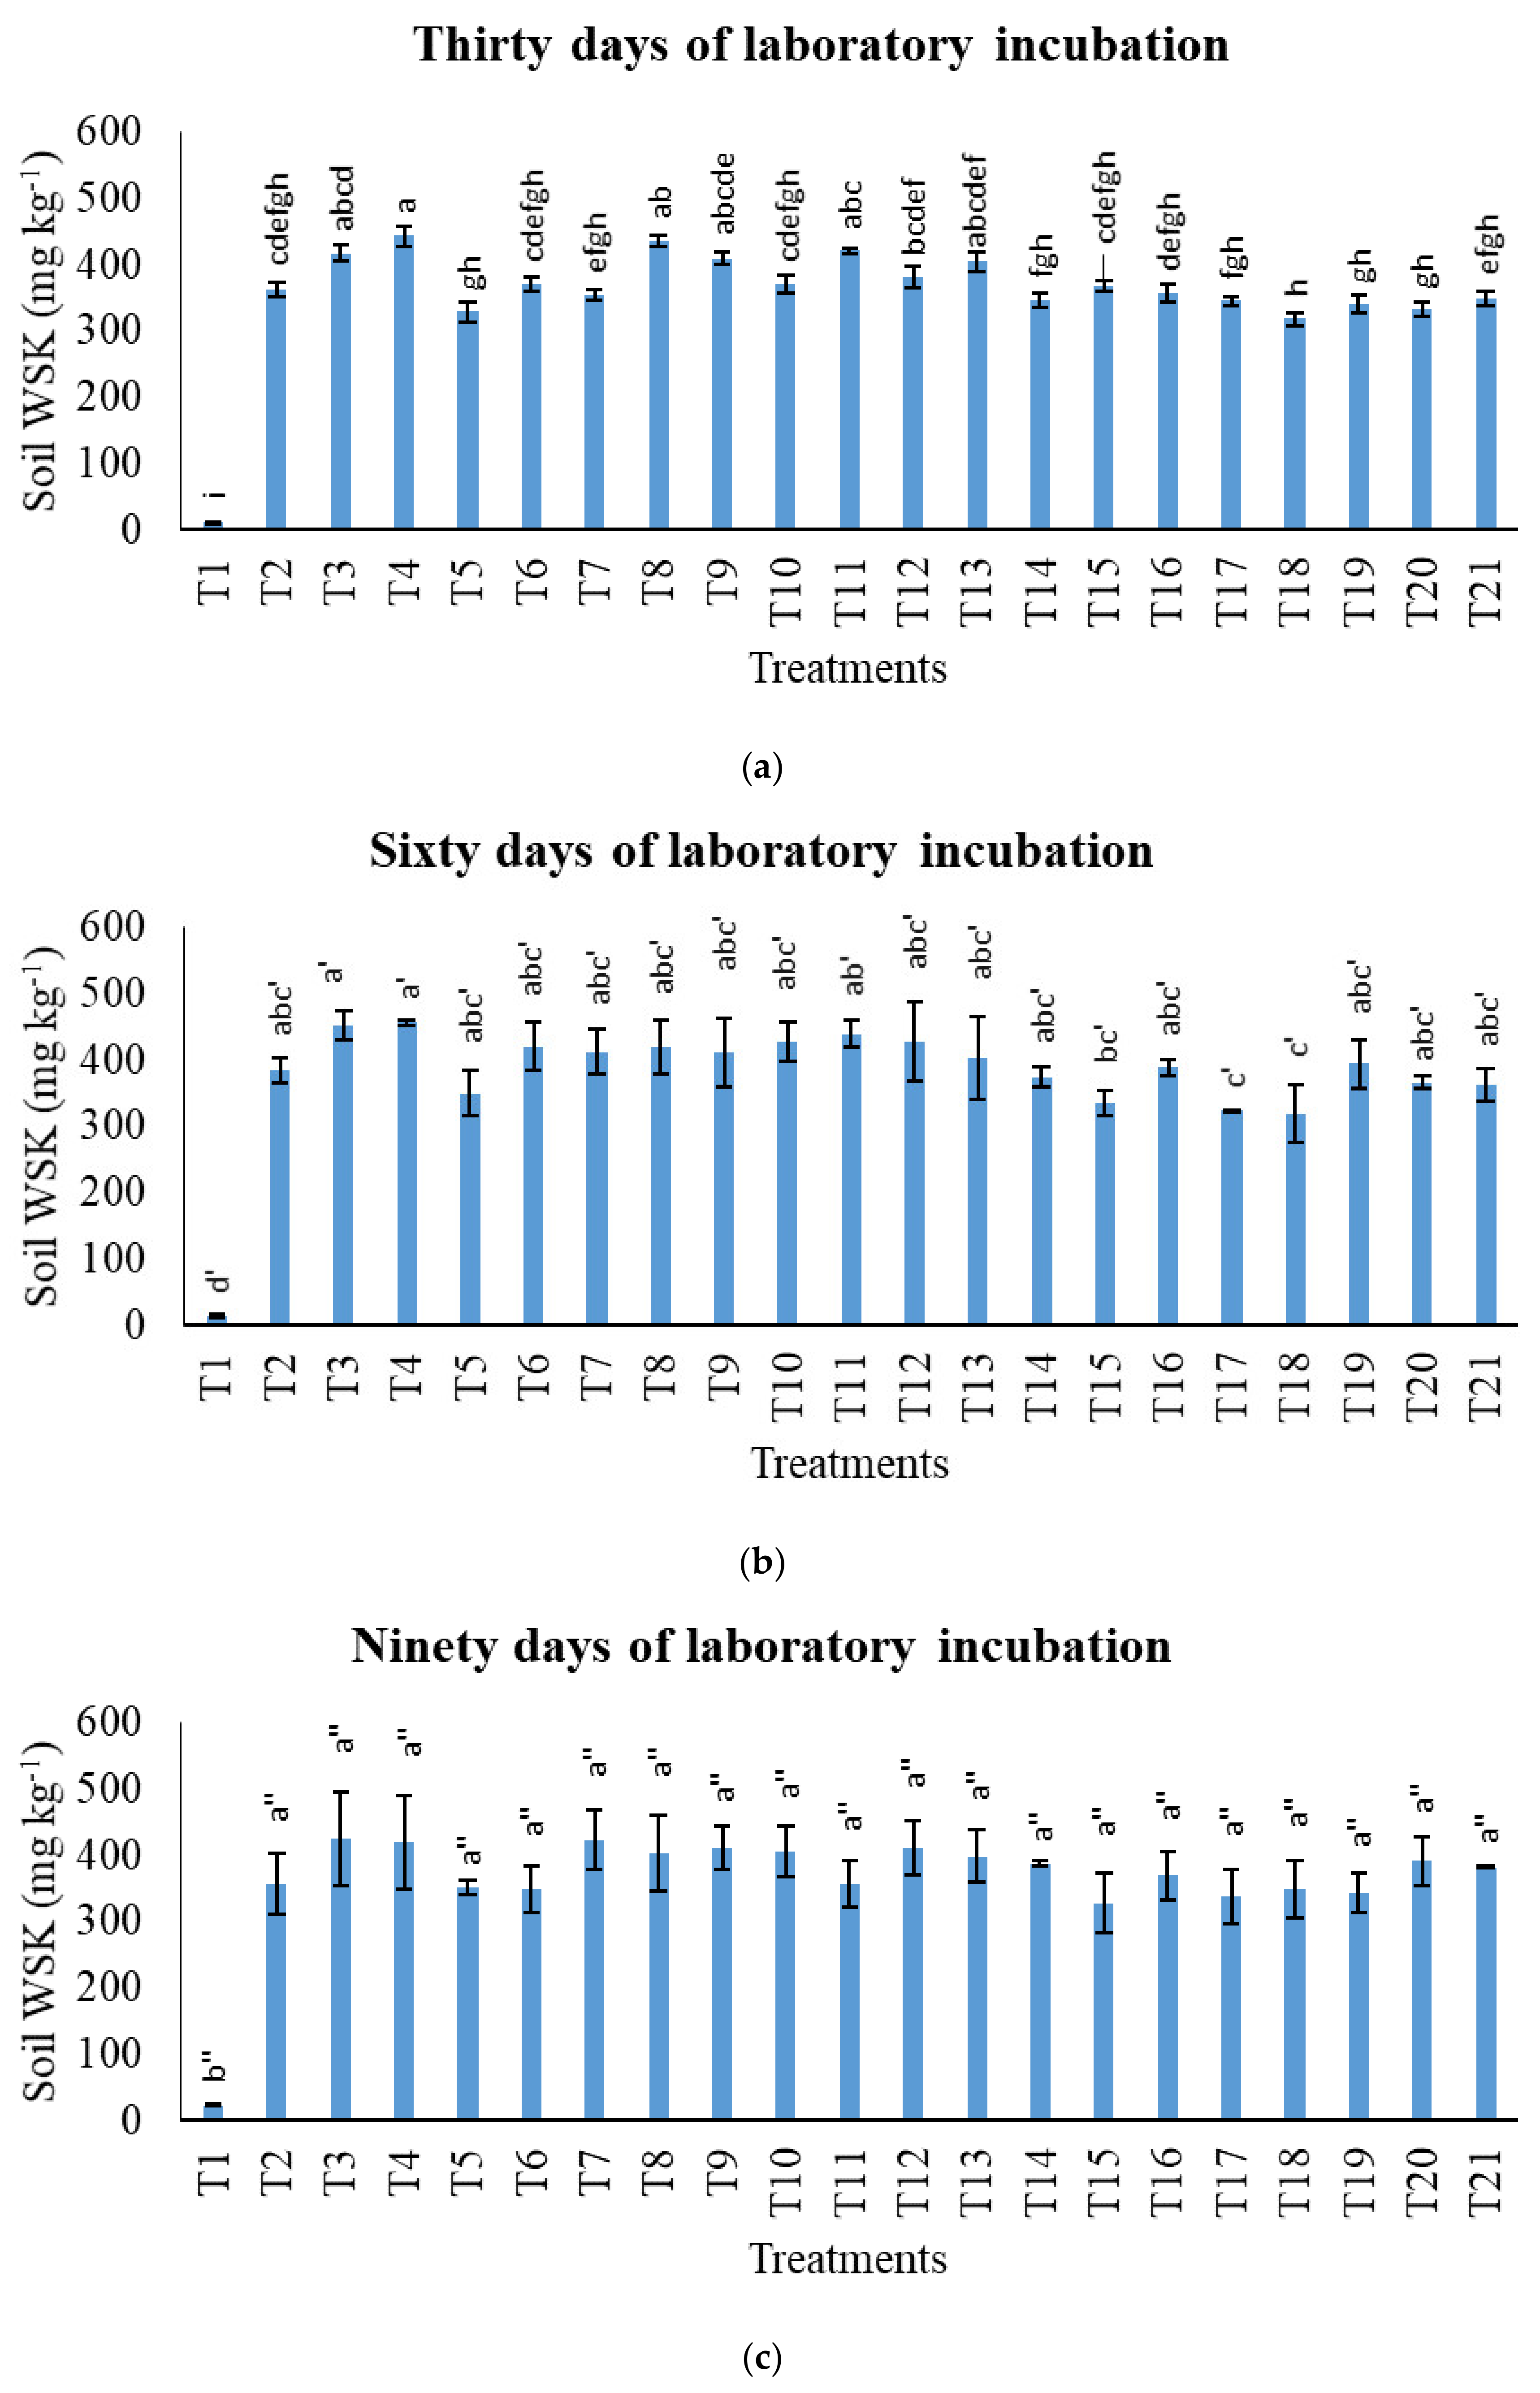
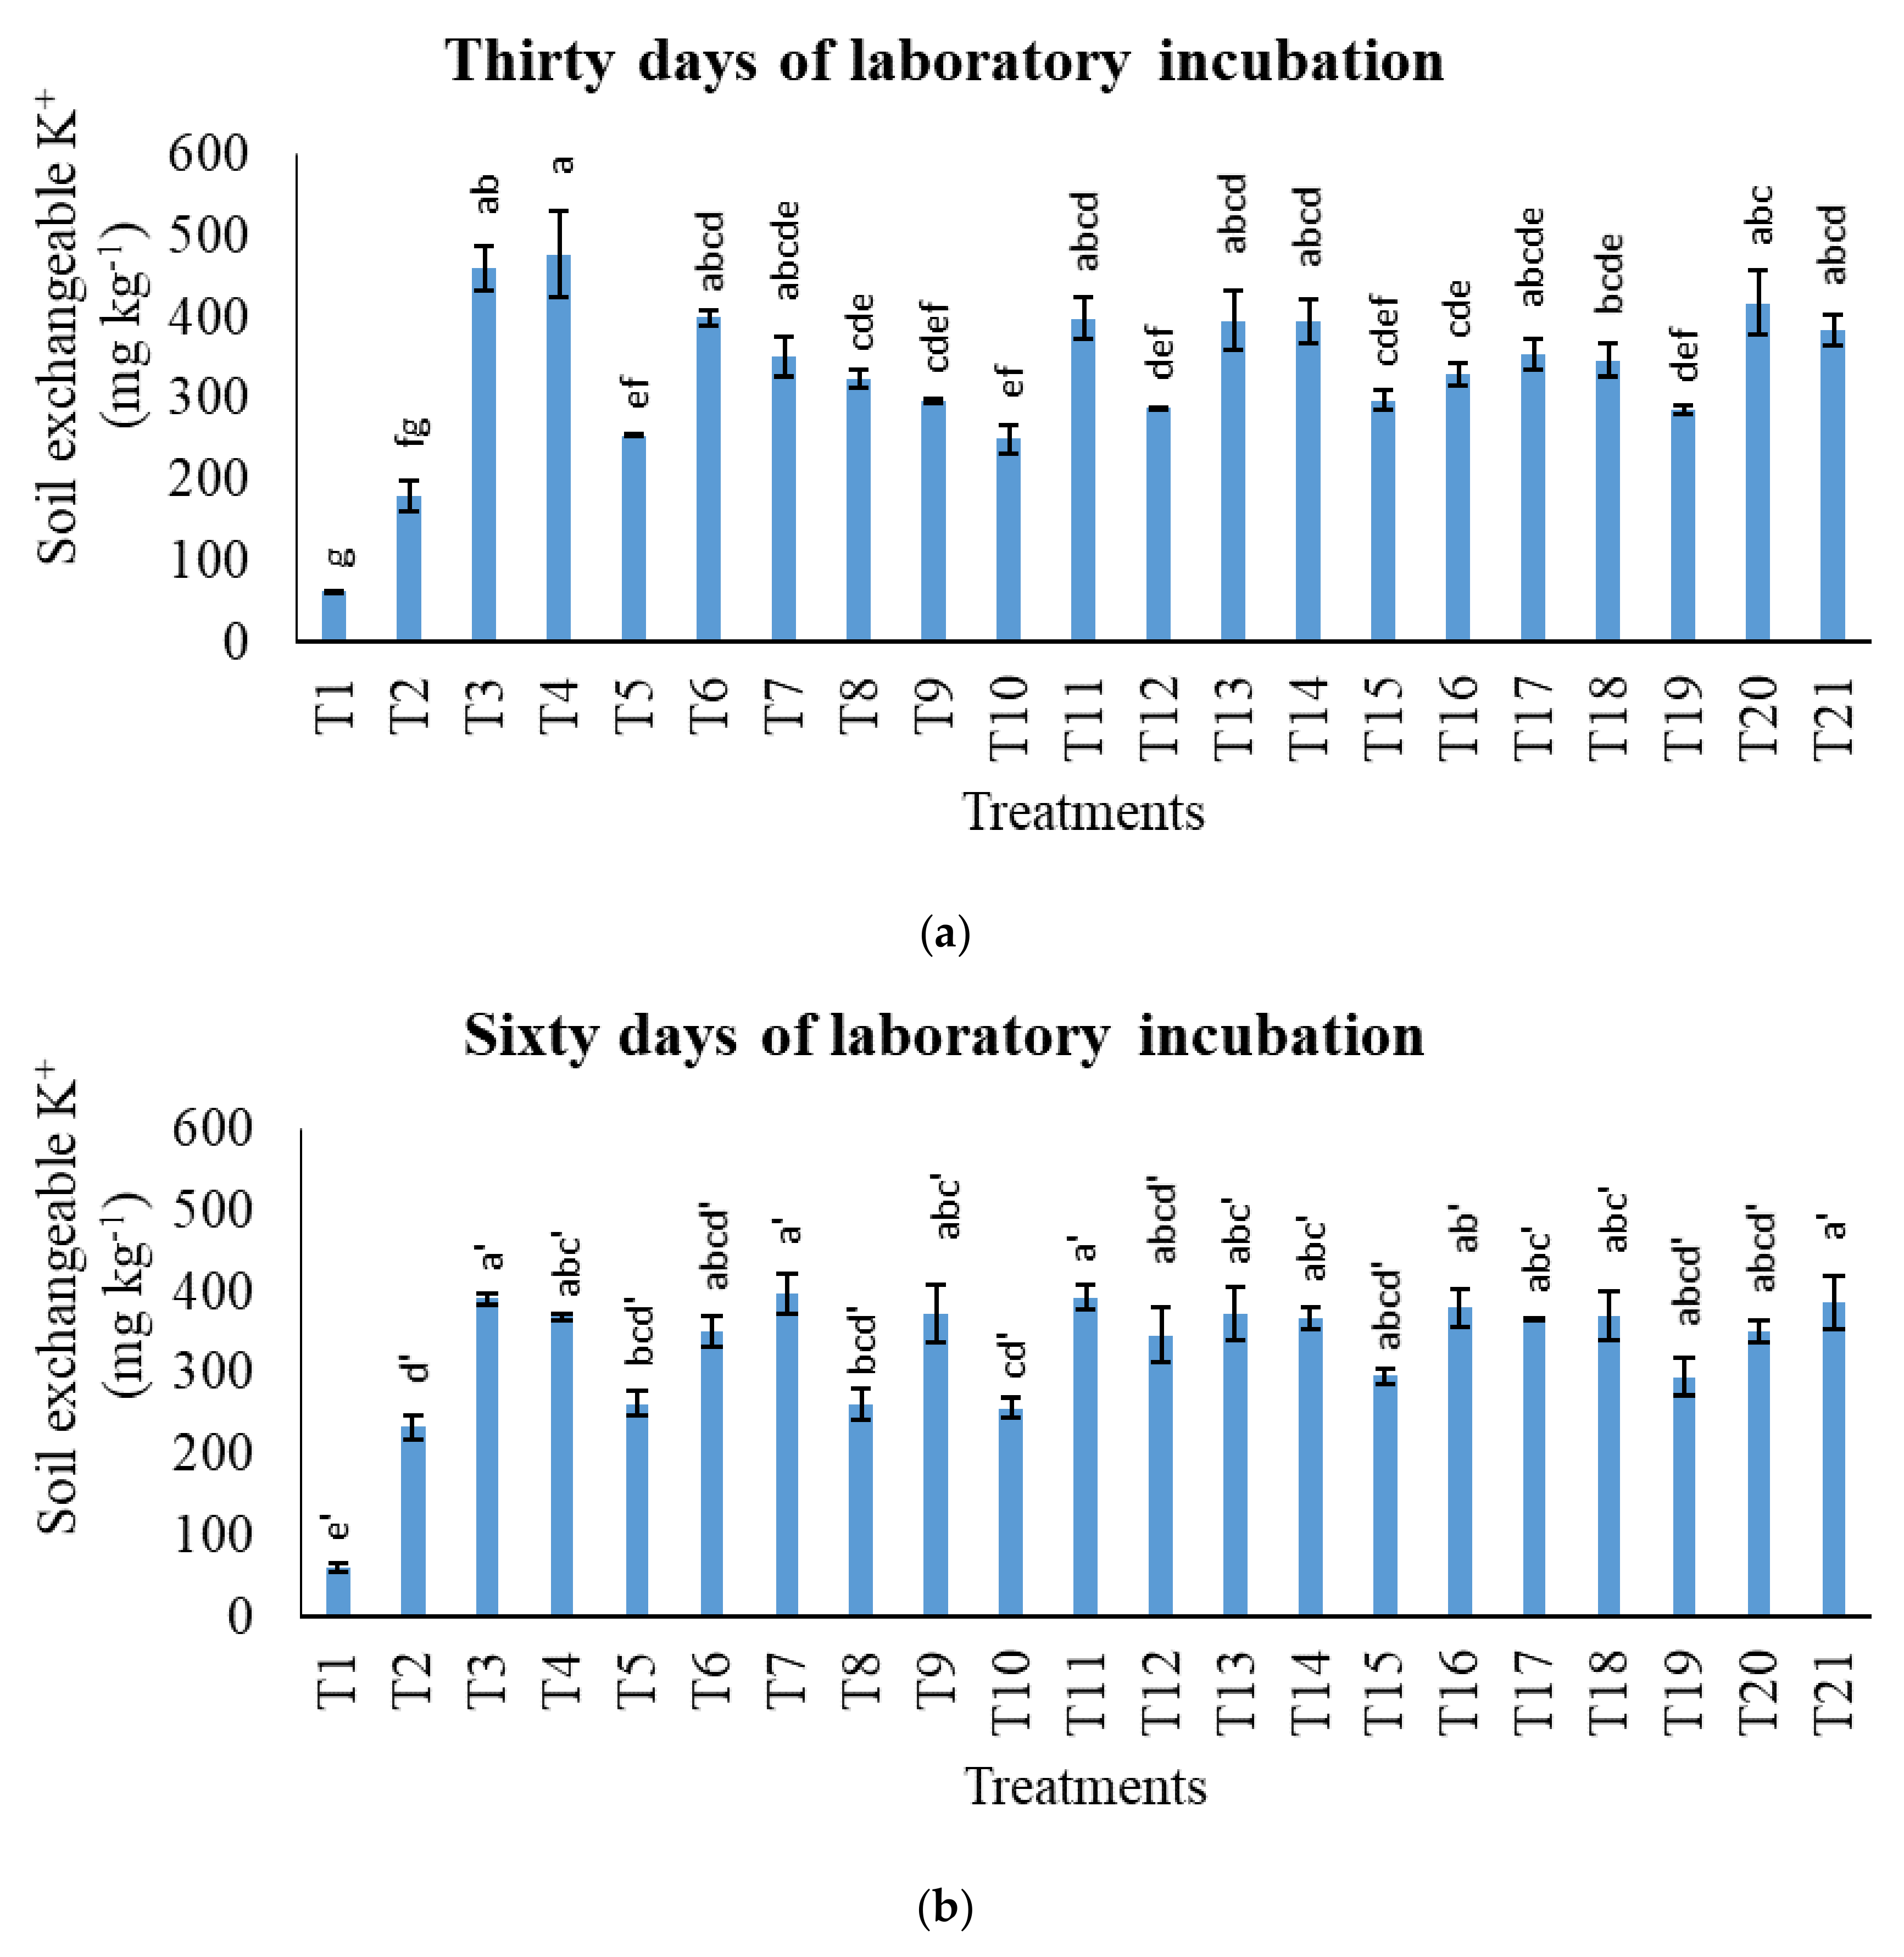
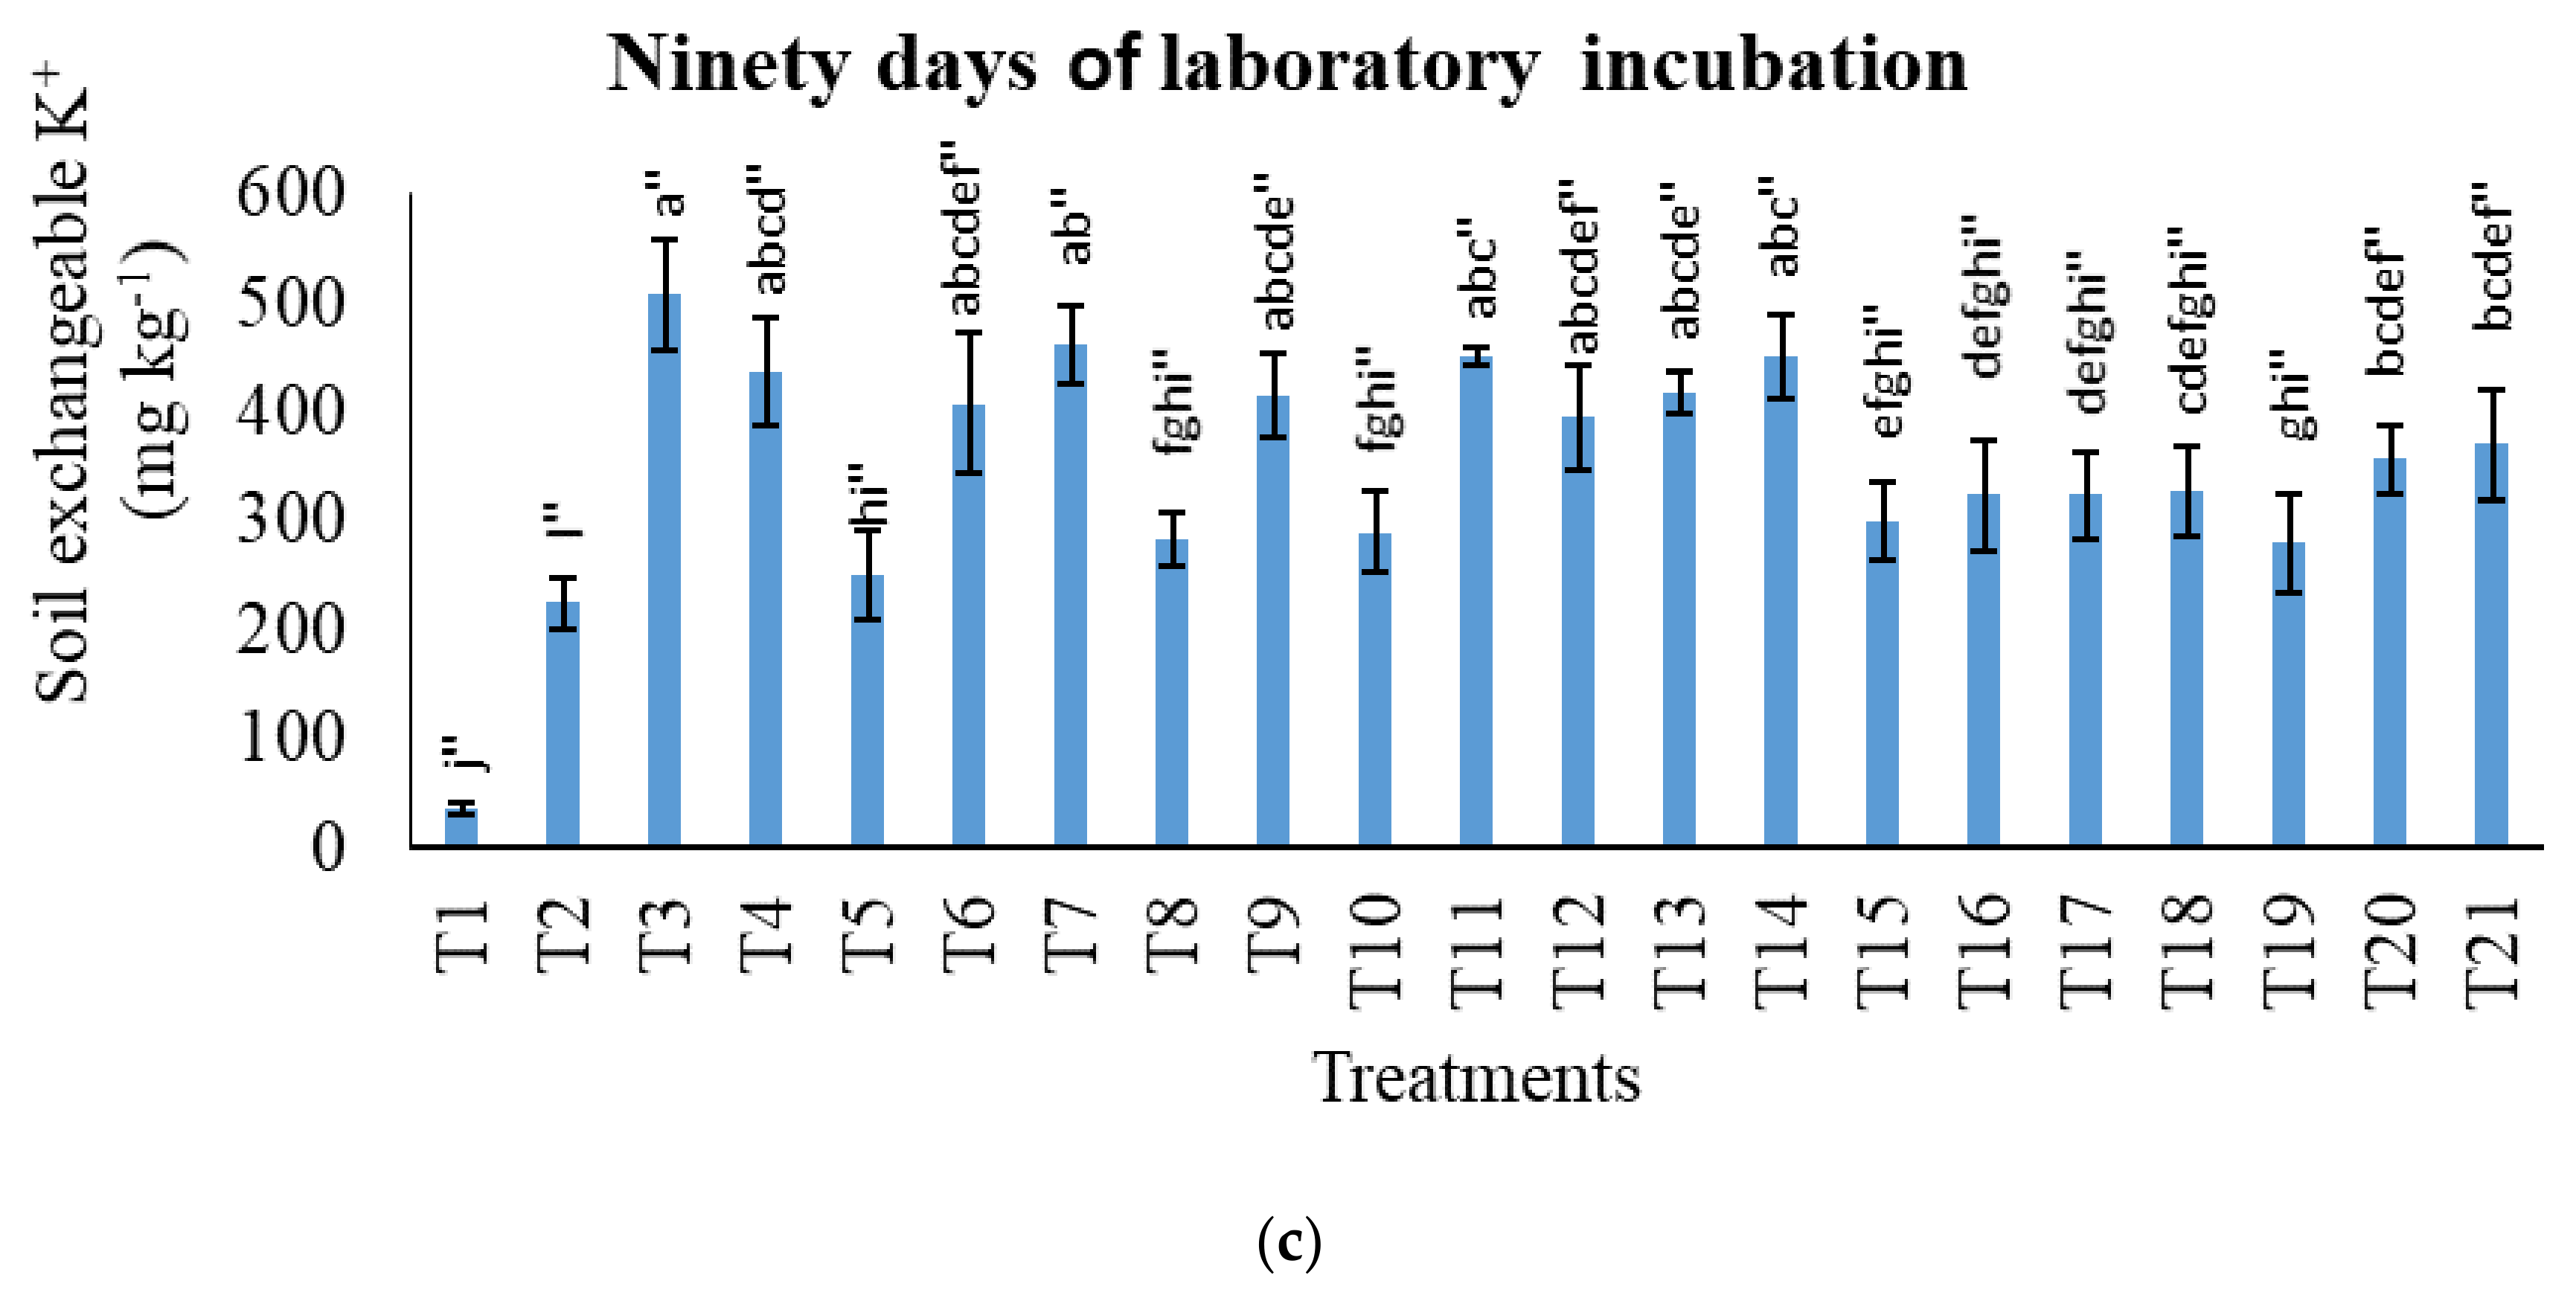
3.3. Treatments on Soil Total Potassium, Exchangeable Potassium, and Water-Soluble Potassium

Total K levels in the treatments with MOP and soil amendments (T2, T3, T4, T5, T6, T7, T8, T9, T10, T11, T12, T13, T14, T15, T16, T17, T18, T19, T20, and T21) were improved compared with the treatment without MOP and soil amendments (T1) (Figure 11). The soil with charcoal only (T5) had lower total K levels compared with other treatments with sago bark ash or mixtures of sago bark ash and charcoal. This was due to the lower content of K in charcoal in comparison with sago bark ash (Table 1) and its effect on total K was negligible with the addition of MOP. Throughout the incubation study, the effect of T5 on soil total K was not significantly different from that of T2. In addition to T5, the effects of the soil with 60% of the recommended rate of charcoal and 40% of the recommended rate of sago bark ash (T15) and the soil with 40% of the recommended rate of charcoal and 40% of the recommended rate of sago bark ash (T16) were similar to that of T2 from 60 DAI onwards.
The treatments with K (T2, T3, T4, T5, T6, T7, T8, T9, T10, T11, T12, T13, T14, T15, T16, T17, T18, T19, T20, and T21) showed significant increases in soil WSK compared with T1 (Figure 12). At 30 DAI, all amended treatments showed no significant difference in WSK compared to T2, with the exception of T4 and T8, which exhibited significantly higher WSK compared with T2. The high WSK of T4 can be explained by the high K content of sago bark ash (Table 1) and the absence of charcoal to increase K sorption capacity, which resulted in K+ being mobilized in the soil solution. The effect on soil WSK of the treatments with K were significantly similar at 90 DAI, indicating that the sorption of the soils was at equilibrium. While the soil WSK of these treatments was high, this effect may have been balanced by the presence of plants and also leaching losses. When WSK begins to deplete, K in the exchangeable pool is needed to replenish the loss [85]. The effect of treatment increased soil WSK for T6, T11, and T14 from 30 DAI to 60 DAI, but T6 and T14 had decreased soil WSK at 90 DAI.
Soil-exchangeable K demonstrated different trends compared with soil WSK (Figure 12 and Figure 13). Co-application of charcoal and sago bark ash (T3, T6, T7, T8, T9, T10, T11, T12, T13, T14, T15, T16, T17, T18, T19, T20, and T21) improved soil-exchangeable K compared with the soil control (T1). Treatment 3 improved soil-exchangeable K throughout the incubation study because of the high content of charcoal and sago ash. Nonetheless, the effect was significantly similar to those of T4, T6, T7, T11, T13, and T14, which had lower rates of amendments. The absence of charcoal and sago bark ash in T1 and T2 resulted in low soil-exchangeable K, despite their high WSK contents as the incubation progressed. This was due to the low CEC of T2 (Figure 5) which did not contain many exchange sites in which K+ could be held. Regardless of incubation period, T5, T15, and T19 exhibited similar effects on soil-exchangeable K compared to normal practice (T2) because of low levels or an absence of ash. Despite having high char content (60% of the recommended rate of charcoal), T15 and T19 showed lower levels of pH improvement (Figure 1). This suggests that the amount of ash in both treatments were not effective in increasing the pH to an extent where the K+ would be reactive to the exchange sites. Dissolution of neutralizing compounds such as CaO, MgO, K2O, and sodium hydroxide (NaOH) from the ash is required to neutralize the protons bound on the cation exchange sites in the soil [55] to create exchange sites for K+. The low soil total K, exchangeable K, and WSK of T1 was related to the inherently low K content of Bekenu Series (Table 1). Soil-exchangeable K for T6, T11, and T14 decreased from 30 DAI to 60 DAI, but increased at 90 DAI.

4. Conclusions

Co-application of charcoal and sago bark ash with MOP can improve soil K sorption capacity significantly. Soil-exchangeable K was more pronounced in the soil with MOP, charcoal, and sago bark ash compared with conventional practice. This was possible because these soil amendments increased soil pH while reducing exchangeable acidity, exchangeable Al, and exchangeable Fe. Amending acid soils with charcoal and sago bark ash also improved the availability of other base cations (Ca, Mg, and Na). Although there was no significant improvement in the WSK of soils with or without charcoal and sago bark ash, it was believed that, in the field, K from this pool would be susceptible to leaching. Therefore, the findings of this present study suggested that the optimum rates of charcoal and sago bark ash to increase K availability in soils were 80% charcoal with 80% sago bark ash (8 t ha−1 charcoal and 4 t ha−1 sago bark ash), 60% charcoal with 60% sago bark ash (6 t ha−1 charcoal and 3 t ha−1 sago bark ash), and 80% charcoal with 40% sago bark ash (8 t ha−1 charcoal and 2 t ha−1 sago bark ash), because these rates improved soil-exchangeable K+ and CEC significantly, while minimizing soil-exchangeable acidity. These treatments also significantly improved the TC of the soil compared with conventional practice. Reduction of soil-exchangeable acidity prevents the Al and Fe toxicity that can stunt maize root growth and compromise nutrient uptake. Improvements to CEC and TC are important in maize cultivation, because they reflect the soil’s ability to hold more nutrients and for a longer period. The application of sago bark ash at the rate of 100% is deemed unsuitable, as it would increase soil salinity and sodicity. Incorporation of sago bark ash with charcoal is essential, as charcoal has the ability to chelate Al and Fe via its high negative charge density, whereas the sago bark ash is able to deprotonate the functional groups of charcoal. This study will be further evaluated in a pot trial with maize plants to confirm its findings. Thereafter, a further study will be embarked on.

Author Contributions

Conceptualization, P.P. and A.M.; methodology, P.P.; validation, O.H.A., L.O., A.M., and H.Y.C.; formal analysis, P.P.; investigation, P.P.; data curation, P.P.; writing—original draft preparation, P.P.; writing—review and editing, O.H.A. and P.D.J.; visualization, P.P. and O.H.A.; supervision, O.H.A., L.O., and H.Y.C.; project administration, O.H.A.; funding acquisition, O.H.A. All authors have read and agreed to the published version of the manuscript.

Funding

This research was funded by Universiti Putra Malaysia with grant number [GP/2018/11/9622000].

Institutional Review Board Statement

Not applicable.

Informed Consent Statement

Not applicable.

Data Availability Statement

The data presented in this study are available within the article.

Acknowledgments

The authors would like to acknowledge Universiti Putra Malaysia for financial assistance and for providing research facilities.

Conflicts of Interest

The authors declare that there are no conflicts of interest regarding the publication of this paper.

References

  1. United Nations Commoidty Trade Statistics Database. UN Comtrade. 2019. Commodity Trade Statistics Database. 2019. Available online: http://data.un.org/Data.aspx?d=ComTrade&f=_l1Code%3A11 (accessed on 13 April 2021).
  2. United States Department of Agriculture 2018. Grain Feed Annual. Available online: https://gain.fas.usda.gov/Recent%20GAIN%20Publications/Grain%20and%20Feed%20Annual_Kuala%20Lumpur_Malaysia_4-12-2018.pdf (accessed on 20 April 2021).
  3. Wang, H.Y.; Zhou, J.M.; Du, C.W.; Chen, X.Q. Potassium fractions in soils as affected by monocalcium phosphate, ammonium sulfate, and potassium chloride application. Pedosphere 2010, 20, 368–377. [Google Scholar] [CrossRef]
  4. Wang, M.; Zheng, Q.; Shen, Q.; Guo, S. The critical role of potassium in plant stress response. Int. J. Mol. Sci. 2013, 14, 7370–7390. [Google Scholar] [CrossRef] [PubMed] [Green Version]
  5. Sparks, D.L. Bioavailability of soil potassium. In Handbook of Soil Science; Sumner, M.E., Ed.; CRC Press: Boca Raton, FL, USA, 2000. [Google Scholar]
  6. Jaiswal, D.K.; Verma, J.P.; Prakash, S.; Meena, V.S.; Meena, R.S. Potassium as an important plant nutrient in sustainable agriculture: A state of the art. Potassium Solubilizing Microorg. Sustain. Agric. 2016, 21–29. [Google Scholar] [CrossRef]
  7. Sumner, M.E. Handbook of Soil Science; CRC Press LLC: Boca Raton, FL, USA, 2000. [Google Scholar]
  8. Darunsontaya, T.; Suddhiprakarn, A.; Kheoruenromne, I.; Prakongkep, N.; Gilkes, R.J. The forms and availability to plants of soil potassium as related to mineralogy for upland Oxisols and Ultisols from Thailand. Geoderma 2012, 170, 11–24. [Google Scholar] [CrossRef]
  9. Goh, K.J.; Chew, P.S. Workshop on direct application of phosphate rocks and appropriate technology fertilisers in Asia: What hinder acceptance and growth. In Direct Application of Phosphates to Plantation Tree Crops in Malaysia; IFDC: Kandy, Sri Lanka, 1995; pp. 59–76. [Google Scholar]
  10. Sallade, Y.E.; Sims, J.T. Phosphorus transformations in the sediments of Delaware’s agricultural dranageways: II. Effect of reducing conditions on phosphorus release. J. Environ. Qual. 1997, 26, 1579–1588. [Google Scholar] [CrossRef]
  11. Khatri, N.; Tyagi, S. Influences of natural and anthropogenic factors on surface and groundwater quality in rural and urban areas. Front. Life Sci. 2015, 8, 23–39. [Google Scholar] [CrossRef]
  12. Motesharezadeh, B.; Valizadeh-Rad, K.; Dadrasnia, A.; Amir-Mokri, H. Trend of fertilizer application during the last three decades (Case study: America, Australia, Iran and Malaysia). J. Plant. Nutr. 2017, 40, 532–542. [Google Scholar] [CrossRef]
  13. Brady, N.C.; Weil, R.R. The Nature and Properties of Soils; Prentice Hall: Upper Saddle River, NJ, USA, 2008; pp. 662–710. [Google Scholar]
  14. Jusop, S.; Ishak, C.F. Weathered Tropical Soils the Ultisols and Oxisols; Universiti Putra Malaysia Press: Serdang, Malaysia, 2010. [Google Scholar]
  15. Troeh, F.R.; Thompson, L.M. Soils and Soil Fertility; Blackwell: New York, NY, USA, 2005. [Google Scholar]
  16. Girijaveni, V.; Reddy, K.S.; Sharma, K.L.; Moulika, G. Zeolites are emerging soil amendments for improving soil physical and chemical properties in agriculture: A Review. Int. J. Agric. Environ. Biotechnol. 2018, 11, 841–849. [Google Scholar] [CrossRef]
  17. Galinato, S.P.; Yoder, J.K.; Granatstein, D. The economic value of biochar in crop production and carbon sequestration. Energy Policy 2011, 39, 6344–6350. [Google Scholar] [CrossRef]
  18. Latifah, O.; Ahmed, O.H.; Majid, N.M.A. Enhancing nitrogen availability from urea using clinoptilolite zeolite. Geoderma 2017, 306, 152–159. [Google Scholar] [CrossRef]
  19. Hoi, W.K. Wood waste utilisation in Malaysia. In Proceedings of the Fourth Conference on Forestry and Forest Products Research, Forest Research Institute Malaysia, Kepong, Selangor, Malaysia, 2–4 October 1997. [Google Scholar]
  20. Forest Department Sarawak, Annual Report. 2011. Available online: https://forestry.sarawak.gov.my/modules/web/pages.php?mod=download&sub=download_show&id=73 (accessed on 23 April 2021).
  21. Shafie, S.M.; Othman, Z.; Hami, N. Potential utilisation of wood residue in Kedah: A preliminary study. J. Technol. Oper. Manag. 2017, 60–69. [Google Scholar] [CrossRef]
  22. Bujang, K. Potentials of bioenergy from the sago industries in Malaysia. In EOLSS-Encyclopedia of Life Support Systems; Doelle, H.W., Rokem, S., Berovic, M., Eds.; EOLSS Publisher: Oxford, UK, 2006; pp. 124–131. [Google Scholar]
  23. Singhal, R.S.; Kennedy, J.F.; Gopalakrishnan, S.M.; Kaczmarek, A.; Knill, C.J.; Akmar, P.F. Industrial production, processing, and utilization of sago palm-derived products. Carbohydr. Polym. 2008, 72, 1–20. [Google Scholar] [CrossRef]
  24. Awg-Adeni, D.S.; Abd-Aziz, S.; Bujang, K.; Hassan, M.A. Bioconversion of sago residue into value added products. Afr. J. Biotechnol. 2010, 9, 2016–2021. [Google Scholar]
  25. Vikineswary, S.; Shim, Y.L.; Thambirajah, J.J.; Blakebrough, N. Possible microbial utilization of sago processing wastes. Resour. Conserv. Recycl. 1994, 11, 289–296. [Google Scholar] [CrossRef]
  26. Ngaini, Z.; Noh, F.; Wahi, R. Esterified sago waste for engine oil removal in aqueous environment. Environ. Technol. 2014, 35, 2761–2766. [Google Scholar] [CrossRef] [PubMed]
  27. Amin, N.; Sabli, N.; Izhar, S.; Yoshida, H. Sago Wastes and Its Applications. Pertanika J. Sci. Technol 2019, 27, 1841–1862. [Google Scholar]
  28. Van Laer, T.; De Smedt, P.; Ronsse, F.; Ruysschaert, G.; Boeckx, P.; Verstraete, W.; Lavrysen, L.J. Legal constraints and opportunities for biochar: A case analysis of EU law. GCB Bioenergy 2015, 7, 14–24. [Google Scholar] [CrossRef]
  29. Nweke, I.A.; Mbah, C.N.; Oweremadu, E.O.; Dambaba, N.; Orji, E.C.; Ekesiobi, A.I.; Nnabuife, E.L.C. Soil pH, available P of an ultisol and castor performance as influenced by contrasting tillage methods and wood ash. Afr. J. Agric. Res. 2017, 12, 606–616. [Google Scholar] [CrossRef] [Green Version]
  30. Nabeela, F.; Murad, W.; Khan, I.; Mian, I.A.; Rehman, H.; Adnan, M.; Azizullah, A. Effect of wood ash application on the morphological, physiological and biochemical parameters of Brassica napus L. Plant. Physiol. Biochem. 2015, 95, 15–25. [Google Scholar] [CrossRef]
  31. Kopecky, M.J.; Meyers, N.L.; Wasko, W. Using industrial wood ash as a soil amendment. Magnes. Res. 1995, 1, 240–440. [Google Scholar]
  32. Jacobson, S.; Gustafsson, L. Effects on ground vegetation of the application of wood ash to a Swedish Scots pine stand. Basic Appl. Ecol. 2001, 2, 233–241. [Google Scholar] [CrossRef]
  33. Biederman, L.A.; Harpole, W.S. Biochar and its effects on plant productivity and nutrient cycling: A meta-analysis. GCB Bioenergy 2013, 5, 202–214. [Google Scholar] [CrossRef]
  34. Woolf, D.; Amonette, J.E.; Street-Perrott, F.A.; Lehmann, J.; Joseph, S. Sustainable biochar to mitigate global climate change. Nat. Commun. 2010, 1, 56. [Google Scholar] [CrossRef] [PubMed] [Green Version]
  35. Gale, N.V.; Halim, M.A.; Horsburgh, M.; Thomas, S.C. Comparative responses of early-successional plants to charcoal soil amendments. Ecosphere 2017, 8, e01933. [Google Scholar] [CrossRef] [Green Version]
  36. Boateng, A.A. Characterization and thermal conversion of charcoal derived from fluidized-bed fast pyrolysis oil production of switchgrass. Ind. Eng. Chem. Res. 2007, 46, 8857–8862. [Google Scholar] [CrossRef]
  37. Schmidt, M.W.; Noack, A.G. Black carbon in soils and sediments: Analysis, distribution, implications, and current challenges. Glob. Biogeochem. Cycles 2000, 14, 777–793. [Google Scholar] [CrossRef]
  38. Qiu, Y.; Cheng, H.; Xu, C.; Sheng, G.D. Surface characteristics of crop-residue-derived black carbon and lead (II) adsorption. Water Res. 2008, 42, 567–574. [Google Scholar] [CrossRef]
  39. Soil Survey Staff. Keys to Soil Taxonomy, 12th ed.; USDA-Natural Resources Conservation Service: Washington, DC, USA, 2014. [Google Scholar]
  40. Paramananthan, S. Soil of Malaysia: Their Characteristics and Identification; Academy of Sciences Malaysia: Kuala Lumpur, Malaysia, 2000; Volume 1, pp. 11–125. [Google Scholar]
  41. Free, H.F.; McGill, C.R.; Rowarth, J.S.; Hedley, M.J. The effect of biochars on maize (Zea mays) germination. N. Z. J. Agric. Res. 2010, 53, 1–4. [Google Scholar] [CrossRef]
  42. Ndor, E.; Dauda, S.N.; Azagaku, E.D. Response of maize varieties (Zea mays) to biochar amended soil in Lafia, Nigeria. J. Exp. Agric. Int. 2015, 5, 525–531. [Google Scholar] [CrossRef]
  43. Mandre, M.; Pärn, H.; Ots, K. Short-term effects of wood ash on the soil and the lignin concentration and growth of Pinus sylvestris L. For. Ecol. Manag. 2006, 223, 349–357. [Google Scholar] [CrossRef]
  44. Ozolincius, R.; Buozyte, R.; Varnagiryte, K.I. Wood ash and nitrogen influence on ground vegetation cover and chemical composition. Biomass Bioenergy 2007, 31, 710–716. [Google Scholar] [CrossRef]
  45. Perucci, P.; Monaci, E.; Onofri, A.; Vischetti, C.; Casucci, C. Changes in physico-chemical and biochemical parameters of soil following addition of wood ash: A field experiment. Eur. J. Agron. 2008, 28, 155–161. [Google Scholar] [CrossRef]
  46. Malaysian Agricultural Research and Development Institute (MARDI). Jagung Manis Baru, Masmadu [New Sweet Corn, Masmadu]; Malaysian Agricultural Research and Development: Serdang, Malaysia, 1993; pp. 3–5. [Google Scholar]
  47. Peech, H.M. Hydrogen-ion Activity. In Methods of Soil Analysis Chemical and Microbiological Properties; Black, C.A., Evans, D.D., White, J.L., Ensminger, L.E., Clark, F.E., Eds.; American Society of Agronomy: Madison, WI, USA, 1965; pp. 914–926. [Google Scholar]
  48. Bouyoucos, G.J. Hydrometer method improved for making particle size analyses of soils 1. Agron. J. 1962, 54, 464–465. [Google Scholar] [CrossRef]
  49. Chefetz, B.; Hatcher, P.H.; Hadar, Y.; Chen, Y. Chemical and biological characterization of organic matter during composting of municipal solid waste. J. Environ. Qual. 1996, 25, 776–785. [Google Scholar] [CrossRef]
  50. Dixon, R.K.; Wisniewski, J. Global Forest systems: An uncertain response to atmospheric pollutants and global climate change? Water Air Soil Pollut. 1995, 85, 101–110. [Google Scholar] [CrossRef]
  51. Cottenie, A. Soil testing and plant testing as a basis of fertilizer recommendation. FAO Soils Bull. 1980, 38, 70–73. [Google Scholar]
  52. Bremner, J.M. Total Nitrogen. In Methods of Soil Analysis: Part 2; Black, C.A., Evans, D.D., Ensminger, L.E., White, J.L., Clark, F.F., Dinauer, R.C., Eds.; American Society of Agronomy: Madison, WI, USA, 1965; pp. 1149–1178. [Google Scholar]
  53. Bernas, B. New method for decomposition and comprehensive analysis of silicates by atomic absorption spectrometry. Anal. Chem. 1968, 40, 1682–1686. [Google Scholar] [CrossRef]
  54. Rowell, D.L. Soil Science: Methods and Application; Longman Publishers Ltd.: London, UK, 1994; p. 169. [Google Scholar]
  55. Saarsalmi, A.; Mälkönen, E.; Kukkola, M. Effect of wood ash fertilization on soil chemical properties and stand nutrient status and growth of some coniferous stands in Finland. Scand. J. For. Res. 2004, 19, 217–233. [Google Scholar] [CrossRef]
  56. Paustian, K.; Lehmann, J.; Ogle, S.; Reay, D.; Robertson, G.P.; Smith, P. Climate-smart soils. Nature 2016, 532, 49–57. [Google Scholar] [CrossRef] [Green Version]
  57. Zimmerman, A.R. Abiotic and microbial oxidation of laboratory-produced black carbon (biochar). Environ. Sci. Technol. 2010, 44, 1295–1301. [Google Scholar] [CrossRef]
  58. Naramabuye, F.X.; Haynes, R.J. Short-term effects of three animal manures on soil pH and Al solubility. Soil Res. 2006, 44, 515–521. [Google Scholar] [CrossRef]
  59. Haynes, R.J.; Mokolobate, M.S. Amelioration of Al toxicity and P deficiency in acid soils by additions of organic residues: A critical review of the phenomenon and the mechanisms involved. Nutr. Cycl. Agroecosystems 2001, 59, 47–63. [Google Scholar] [CrossRef]
  60. Belay, A.; Claassens, A.; Wehner, F.C. Effect of direct nitrogen and potassium and residual phosphorus fertilizers on soil chemical properties, microbial components and maize yield under long-term crop rotation. Biol. Fertil. Soils 2002, 35, 420–427. [Google Scholar]
  61. Motavalli, P.; Miles, R. Soil phosphorus fractions after 111 years of animal manure and fertilizer applications. Biol. Fertil. Soils 2002, 36, 35–42. [Google Scholar]
  62. Bonfim-Silva, E.M.; Nonato, J.J.; Simeon, B.G.; Alves, R.D.D.S.; da Silva, M.I.P.; Silva, T.J.A.D. Mung bean shoot and root growth under wood ash as a soil acidity neutralizer and fertilizer. Int. J. Veg. Sci. 2020, 27, 303–314. [Google Scholar] [CrossRef]
  63. Haraldsen, T.K.; Pedersen, P.A.; Gronlund, A. Mixtures of bottom wood ash and meat and bone meal as NPK fertilizer. In Recycling of Biomass Ashes; Insam, H., Knapp, B.A., Eds.; Springer: Berlin, Germany, 2011; pp. 33–44. [Google Scholar]
  64. Saarsalmi, A.; Smolander, A.; Kukkola, M.; Arola, M. Effect of wood ash and nitrogen fertilization on soil chemical properties, soil microbial processes, and stand growth in two coniferous stands in Finland. Plant. Soil 2010, 331, 329–340. [Google Scholar] [CrossRef]
  65. Kochian, L.V.; Pineros, M.A.; Hoekenga, O.A. The physiology, genetics and molecular biology of plant aluminum resistance and toxicity. Plant. Soil 2005, 274, 175–195. [Google Scholar] [CrossRef]
  66. Qian, L.; Chen, B.; Hu, D. Effective alleviation of aluminum phytotoxicity by manure-derived biochar. Environ. Sci. Technol. 2013, 47, 2737–2745. [Google Scholar] [CrossRef]
  67. Bramyrd, T.; Fransman, B. Silvicultural use of wood ash. Effect of nutrients and heavy metal balance in a pine (Pinus sylvestris L.). For. Soil Air Soil Pollut. 1995, 85, 1039–1044. [Google Scholar] [CrossRef]
  68. Herrmann, S.; Oelmuller, R.; Buscot, F. Manipulation of the onset of ectomycorrhiza formation by indole-2-acetic acid, activated charcoal or relative humidity in the association between oak micocuttings and Piloderma croceum: Influence on plant development and photosynthesis. J. Plant. Physiol. 2004, 161, 509–517. [Google Scholar] [CrossRef] [Green Version]
  69. Topoliantz, S.; Ponge, J.F.; Ballof, S. Manioc peel and charcoal: A potential organic amendment for sustainable soil fertility in the tropics. Biol. Fertil. Soils 2005, 41, 15–21. [Google Scholar] [CrossRef] [Green Version]
  70. Rutto, K.L.; Mizutani, F. Effect of mycorrhizal inoculation and activated charcoal on growth and nutrition in peach (Prunus persica Batsch) seedlings treated with peach root-bark extracts. J. Jpn. Soc. Hortic. Sci. 2006, 75, 463–468. [Google Scholar] [CrossRef]
  71. Warnock, D.D.; Lehmann, J.; Kuyper, T.W.; Rillig, M.C. Mycorrhizal responses to biochar in soil: Concepts and mechanisms. Plant. Soil 2007, 300, 9–20. [Google Scholar] [CrossRef]
  72. Asap, A.; Haruna, A.O.; Ab Majid, N.M.; Ali, M. Amending triple superphosphate with chicken litter biochar improves phosphorus availability. Eurasian J. Soil Sci. 2018, 7, 121–132. [Google Scholar] [CrossRef]
  73. Cai, Z.; Wang, B.; Xu, M.; Zhang, H.; He, X.; Zhang, L.; Gao, S. Intensified soil acidification from chemical N fertilization and prevention by manure in an 18-year field experiment in the red soil of southern China. J. Soils Sediments 2015, 15, 260–270. [Google Scholar] [CrossRef]
  74. Major, J.; Lehmann, J.; Rondon, M.; Goodale, C. Fate of soil-applied black carbon: Downward migration, leaching and soil respiration. Glob. Chang. Biol. 2010, 16, 1366e1379. [Google Scholar] [CrossRef]
  75. Khanna, P.K.; Raison, R.; Falkiner, R. Chemical properties of ash derived from Eucalyptus litter and its effects on forest soils. For. Ecol. Manag. 1994, 66, 107–125. [Google Scholar] [CrossRef]
  76. Ludwig, B.; Rumpf, S.; Mindrup, M.; Meiwes, K.J.; Khanna, P.K. Effects of lime and wood ash on soil-solution chemistry, soil chemistry and nutritional status of a pine stand in northern Germany. Scand. J. For. Res. 2002, 17, 225–237. [Google Scholar] [CrossRef]
  77. Saarsalmi, A.; Mälkönen, E.; Piirainen, S. Effects of wood ash fertilization on forest soil chemical properties. Silva. Fenn. 2001, 35, 355–368. [Google Scholar] [CrossRef] [Green Version]
  78. Mbah, C.N.; Njoku, C.; Oludare, C. Use of ash to improve the nutrient content of an ultisol and its effect on maize (Zea mays L.) Growth and dry matter yield. Int. J. For. Soil Eros. (IJFSE) 2013, 3, 118–121. [Google Scholar]
  79. Nguyen, B.T.; Lehmann, J.; Kinyangi, J.; Smernik, R.; Riha, S.J.; Engelhard, M.H. Long-term black carbon dynamics in cultivated soil. Biogeochemistry 2009, 92, 163–176. [Google Scholar] [CrossRef]
  80. DeLuca, T.H.; Aplet, G.H. Charcoal and carbon storage in forest soils of the Rocky Mountain West. Front. Ecol. Environ. 2008, 6, 18–24. [Google Scholar] [CrossRef]
  81. Unger, Y.L.; Fernandez, I.J. The short-term effects of wood-ash amendment on forest soils. Water Air Soil Pollut. 1990, 49, 299–314. [Google Scholar] [CrossRef]
  82. Glaser, B.; Lehmann, J.; Zech, W. Ameliorating physical and chemical properties of highly weathered soils in the tropics with charcoal–a review. Biol. Fertil. Soils 2002, 35, 219–230. [Google Scholar] [CrossRef]
  83. Vu, D.T.; Tang, C.; Armstrong, R.D. Changes and availability of P fractions following 65 years of P application to a calcareous soil in a Mediterranean climate. Plant. Soil 2008, 304, 21–33. [Google Scholar] [CrossRef]
  84. Paterson, E.; Goodman, B.A.; Farmer, V.C. The chemistry of aluminium, iron and manganese oxides in acid soils. Soil Acidity 1991, 97–124. [Google Scholar] [CrossRef]
  85. Kundu, M.C.; Hazra, G.C.; Biswas, P.K.; Mondal, S.; Ghosh, G.K. Forms and distribution of potassium in some soils of Hooghly district of West Bengal. Crucible 2014, 2, 4. [Google Scholar]
Figure 1. Effects of treatments on soil pH in potassium chloride over (a) thirty; (b) sixty; and (c) ninety days after incubation. T1: soil control, T2: conventional practice, T3: muriate of potash + 100% charcoal + 100% sago bark ash, T4: muriate of potash + 100% sago bark ash, T5: muriate of potash + 100% charcoal, T6: muriate of potash + 80% charcoal + 80% sago bark ash, T7: muriate of potash + 60% charcoal + 80% sago bark ash, T8: muriate of potash + 40% + 80% sago bark ash, T9: muriate of potash + 20% charcoal + 80% sago bark ash, T10: muriate of potash + 80 charcoal + 60% sago bark ash, T11: muriate of potash + 60% charcoal + 60% sago bark ash, T12: muriate of potash + 40% charcoal + 60% sago bark ash, T13: muriate of potash + 20% charcoal + 60% sago bark ash, T14: muriate of potash + 80% charcoal + 40% sago bark ash, T15: muriate of potash + 60% charcoal + 40% sago bark ash, T16: muriate of potash + 40% charcoal + 40% sago bark ash, T17: muriate of potash + 20% charcoal + 40% sago bark ash, T18: muriate of potash + 80% charcoal + 20% sago bark ash, T19: muriate of potash + 60% charcoal + 20% sago bark ash, T20: muriate of potash + 40% charcoal + 20% sago bark ash, and T21: muriate of potash + 20% charcoal + 20% sago bark ash. Different letters indicate significant differences between means using Tukey’s HSD test at p ≤ 0.05. The error bars are the ± standard error of triplicates. Letters without any marks and letters with ‘ and ” indicate mean comparison within thirty, sixty, and ninety days after incubation, respectively.
Agronomy 11 02222 g001aAgronomy 11 02222 g001b
Figure 2. Effects of treatments on soil-exchangeable acidity over (a) thirty; (b) sixty; and (c) ninety days after incubation.T1: soil control, T2: conventional practice, T3: muriate of potash + 100% charcoal + 100% sago bark ash, T4: muriate of potash + 100% sago bark ash, T5: muriate of potash + 100% charcoal, T6: muriate of potash + 80% charcoal + 80% sago bark ash, T7: muriate of potash + 60% charcoal + 80% sago bark ash, T8: muriate of potash + 40% + 80% sago bark ash, T9: muriate of potash + 20% charcoal + 80% sago bark ash, T10: muriate of potash + 80 charcoal + 60% sago bark ash, T11: muriate of potash + 60% charcoal + 60% sago bark ash, T12: muriate of potash + 40% charcoal + 60% sago bark ash, T13: muriate of potash + 20% charcoal + 60% sago bark ash, T14: muriate of potash + 80% charcoal + 40% sago bark ash, T15: muriate of potash + 60% charcoal + 40% sago bark ash, T16: muriate of potash + 40% charcoal + 40% sago bark ash, T17: muriate of potash + 20% charcoal + 40% sago bark ash, T18: muriate of potash + 80% charcoal + 20% sago bark ash, T19: muriate of potash + 60% charcoal + 20% sago bark ash, T20: muriate of potash + 40% charcoal + 20% sago bark ash, and T21: muriate of potash + 20% charcoal + 20% sago bark ash. Different letters indicate significant differences between means using Tukey’s HSD test at p ≤ 0.05. The error bars are the ± standard error of triplicates. Letters without any marks and letters with ‘ and ” indicate mean comparison within thirty, sixty, and ninety days after incubation, respectively.
Agronomy 11 02222 g002aAgronomy 11 02222 g002b
Figure 3. Effects of treatments on soil-exchangeable aluminium over (a) thirty; (b) sixty; and (c) ninety days after incubation. T1: soil control, T2: conventional practice, T3: muriate of potash + 100% charcoal + 100% sago bark ash, T4: muriate of potash + 100% sago bark ash, T5: muriate of potash + 100% charcoal, T6: muriate of potash + 80% charcoal + 80% sago bark ash, T7: muriate of potash + 60% charcoal + 80% sago bark ash, T8: muriate of potash + 40% + 80% sago bark ash, T9: muriate of potash + 20% charcoal + 80% sago bark ash, T10: muriate of potash + 80 charcoal + 60% sago bark ash, T11: muriate of potash + 60% charcoal + 60% sago bark ash, T12: muriate of potash + 40% charcoal + 60% sago bark ash, T13: muriate of potash + 20% charcoal + 60% sago bark ash, T14: muriate of potash + 80% charcoal + 40% sago bark ash, T15: muriate of potash + 60% charcoal + 40% sago bark ash, T16: muriate of potash + 40% charcoal + 40% sago bark ash, T17: muriate of potash + 20% charcoal + 40% sago bark ash, T18: muriate of potash + 80% charcoal + 20% sago bark ash, T19: muriate of potash + 60% charcoal + 20% sago bark ash, T20: muriate of potash + 40% charcoal + 20% sago bark ash, and T21: muriate of potash + 20% charcoal + 20% sago bark ash. Different letters indicate significant differences between means using Tukey’s HSD test at p ≤ 0.05. The error bars are the ± standard error of triplicates. Letters without any marks and letters with ‘ and ” indicate mean comparison within thirty, sixty, and ninety days after incubation, respectively.
Agronomy 11 02222 g003
Figure 4. Effects of treatments on soil-exchangeable hydrogen over (a) thirty; (b) sixty; and (c) ninety days after incubation. T1: soil control, T2: conventional practice, T3: muriate of potash + 100% charcoal + 100% sago bark ash, T4: muriate of potash + 100% sago bark ash, T5: muriate of potash + 100% charcoal, T6: muriate of potash + 80% charcoal + 80% sago bark ash, T7: muriate of potash + 60% charcoal + 80% sago bark ash, T8: muriate of potash + 40% + 80% sago bark ash, T9: muriate of potash + 20% charcoal + 80% sago bark ash, T10: muriate of potash + 80 charcoal + 60% sago bark ash, T11: muriate of potash + 60% charcoal + 60% sago bark ash, T12: muriate of potash + 40% charcoal + 60% sago bark ash, T13: muriate of potash + 20% charcoal + 60% sago bark ash, T14: muriate of potash + 80% charcoal + 40% sago bark ash, T15: muriate of potash + 60% charcoal + 40% sago bark ash, T16: muriate of potash + 40% charcoal + 40% sago bark ash, T17: muriate of potash + 20% charcoal + 40% sago bark ash, T18: muriate of potash + 80% charcoal + 20% sago bark ash, T19: muriate of potash + 60% charcoal + 20% sago bark ash, T20: muriate of potash + 40% charcoal + 20% sago bark ash, and T21: muriate of potash + 20% charcoal + 20% sago bark ash. Different letters indicate significant differences between means using Tukey’s HSD test at p ≤ 0.05. The error bars are the ± standard error of triplicates. Letters without any marks and letters with ‘ and ” indicate mean comparison within thirty, sixty, and ninety days after incubation, respectively.
Agronomy 11 02222 g004aAgronomy 11 02222 g004b
Figure 5. Effects of treatments on soil cation exchange capacity over (a) thirty; (b) sixty; and (c) ninety days after incubation. T1: soil control, T2: conventional practice, T3: muriate of potash + 100% charcoal + 100% sago bark ash, T4: muriate of potash + 100% sago bark ash, T5: muriate of potash + 100% charcoal, T6: muriate of potash + 80% charcoal + 80% sago bark ash, T7: muriate of potash + 60% charcoal + 80% sago bark ash, T8: muriate of potash + 40% + 80% sago bark ash, T9: muriate of potash + 20% charcoal + 80% sago bark ash, T10: muriate of potash + 80 charcoal + 60% sago bark ash, T11: muriate of potash + 60% charcoal + 60% sago bark ash, T12: muriate of potash + 40% charcoal + 60% sago bark ash, T13: muriate of potash + 20% charcoal + 60% sago bark ash, T14: muriate of potash + 80% charcoal + 40% sago bark ash, T15: muriate of potash + 60% charcoal + 40% sago bark ash, T16: muriate of potash + 40% charcoal + 40% sago bark ash, T17: muriate of potash + 20% charcoal + 40% sago bark ash, T18: muriate of potash + 80% charcoal + 20% sago bark ash, T19: muriate of potash + 60% charcoal + 20% sago bark ash, T20: muriate of potash + 40% charcoal + 20% sago bark ash, and T21: muriate of potash + 20% charcoal + 20% sago bark ash. Different letters indicate significant differences between means using Tukey’s HSD test at p ≤ 0.05. The error bars are the ± standard error of triplicates. Letters without any marks and letters with ‘ and ” indicate mean comparison within thirty, sixty, and ninety days after incubation, respectively.
Agronomy 11 02222 g005aAgronomy 11 02222 g005b
Figure 6. Effects of treatments on soil total carbon over (a) thirty; (b) sixty; and (c) ninety days after incubation. T1: soil control, T2: conventional practice, T3: muriate of potash + 100% charcoal + 100% sago bark ash, T4: muriate of potash + 100% sago bark ash, T5: muriate of potash + 100% charcoal, T6: muriate of potash + 80% charcoal + 80% sago bark ash, T7: muriate of potash + 60% charcoal + 80% sago bark ash, T8: muriate of potash + 40% + 80% sago bark ash, T9: muriate of potash + 20% charcoal + 80% sago bark ash, T10: muriate of potash + 80 charcoal + 60% sago bark ash, T11: muriate of potash + 60% charcoal + 60% sago bark ash, T12: muriate of potash + 40% charcoal + 60% sago bark ash, T13: muriate of potash + 20% charcoal + 60% sago bark ash, T14: muriate of potash + 80% charcoal + 40% sago bark ash, T15: muriate of potash + 60% charcoal + 40% sago bark ash, T16: muriate of potash + 40% charcoal + 40% sago bark ash, T17: muriate of potash + 20% charcoal + 40% sago bark ash, T18: muriate of potash + 80% charcoal + 20% sago bark ash, T19: muriate of potash + 60% charcoal + 20% sago bark ash, T20: muriate of potash + 40% charcoal + 20% sago bark ash, and T21: muriate of potash + 20% charcoal + 20% sago bark ash. Different letters indicate significant differences between means using Tukey’s HSD test at p ≤ 0.05. The error bars are the ± standard error of triplicates. Letters without any marks and letters with ‘ and ” indicate mean comparison within thirty, sixty, and ninety days after incubation, respectively.
Agronomy 11 02222 g006
Figure 7. Effects of treatments on soil-exchangeable calcium over (a) thirty; (b) sixty; and (c) ninety days after incubation. T1: soil control, T2: conventional practice, T3: muriate of potash + 100% charcoal + 100% sago bark ash, T4: muriate of potash + 100% sago bark ash, T5: muriate of potash + 100% charcoal, T6: muriate of potash + 80% charcoal + 80% sago bark ash, T7: muriate of potash + 60% charcoal + 80% sago bark ash, T8: muriate of potash + 40% + 80% sago bark ash, T9: muriate of potash + 20% charcoal + 80% sago bark ash, T10: muriate of potash + 80 charcoal + 60% sago bark ash, T11: muriate of potash + 60% charcoal + 60% sago bark ash, T12: muriate of potash + 40% charcoal + 60% sago bark ash, T13: muriate of potash + 20% charcoal + 60% sago bark ash, T14: muriate of potash + 80% charcoal + 40% sago bark ash, T15: muriate of potash + 60% charcoal + 40% sago bark ash, T16: muriate of potash + 40% charcoal + 40% sago bark ash, T17: muriate of potash + 20% charcoal + 40% sago bark ash, T18: muriate of potash + 80% charcoal + 20% sago bark ash, T19: muriate of potash + 60% charcoal + 20% sago bark ash, T20: muriate of potash + 40% charcoal + 20% sago bark ash, and T21: muriate of potash + 20% charcoal + 20% sago bark ash. Different letters indicate significant differences between means using Tukey’s HSD test at p ≤ 0.05. The error bars are the ± standard error of triplicates. Letters without any marks and letters with ‘ and ” indicate mean comparison within thirty, sixty, and ninety days after incubation, respectively.
Agronomy 11 02222 g007aAgronomy 11 02222 g007b
Figure 8. Effects of treatments on soil-exchangeable magnesium over (a) thirty; (b) sixty; and (c) ninety days after incubation. T1: soil control, T2: conventional practice, T3: muriate of potash + 100% charcoal + 100% sago bark ash, T4: muriate of potash + 100% sago bark ash, T5: muriate of potash + 100% charcoal, T6: muriate of potash + 80% charcoal + 80% sago bark ash, T7: muriate of potash + 60% charcoal + 80% sago bark ash, T8: muriate of potash + 40% + 80% sago bark ash, T9: muriate of potash + 20% charcoal + 80% sago bark ash, T10: muriate of potash + 80 charcoal + 60% sago bark ash, T11: muriate of potash + 60% charcoal + 60% sago bark ash, T12: muriate of potash + 40% charcoal + 60% sago bark ash, T13: muriate of potash + 20% charcoal + 60% sago bark ash, T14: muriate of potash + 80% charcoal + 40% sago bark ash, T15: muriate of potash + 60% charcoal + 40% sago bark ash, T16: muriate of potash + 40% charcoal + 40% sago bark ash, T17: muriate of potash + 20% charcoal + 40% sago bark ash, T18: muriate of potash + 80% charcoal + 20% sago bark ash, T19: muriate of potash + 60% charcoal + 20% sago bark ash, T20: muriate of potash + 40% charcoal + 20% sago bark ash, and T21: muriate of potash + 20% charcoal + 20% sago bark ash. Different letters indicate significant differences between means using Tukey’s HSD test at p ≤ 0.05. The error bars are the ± standard error of triplicates. Letters without any marks and letters with ‘ and ” indicate mean comparison within thirty, sixty, and ninety days after incubation, respectively.
Agronomy 11 02222 g008aAgronomy 11 02222 g008b
Figure 9. Effects of treatments on soil-exchangeable sodium over (a) thirty; (b) sixty; and (c) ninety days after incubation. T1: soil control, T2: conventional practice, T3: muriate of potash + 100% charcoal + 100% sago bark ash, T4: muriate of potash + 100% sago bark ash, T5: muriate of potash + 100% charcoal, T6: muriate of potash + 80% charcoal + 80% sago bark ash, T7: muriate of potash + 60% charcoal + 80% sago bark ash, T8: muriate of potash + 40% + 80% sago bark ash, T9: muriate of potash + 20% charcoal + 80% sago bark ash, T10: muriate of potash + 80 charcoal + 60% sago bark ash, T11: muriate of potash + 60% charcoal + 60% sago bark ash, T12: muriate of potash + 40% charcoal + 60% sago bark ash, T13: muriate of potash + 20% charcoal + 60% sago bark ash, T14: muriate of potash + 80% charcoal + 40% sago bark ash, T15: muriate of potash + 60% charcoal + 40% sago bark ash, T16: muriate of potash + 40% charcoal + 40% sago bark ash, T17: muriate of potash + 20% charcoal + 40% sago bark ash, T18: muriate of potash + 80% charcoal + 20% sago bark ash, T19: muriate of potash + 60% charcoal + 20% sago bark ash, T20: muriate of potash + 40% charcoal + 20% sago bark ash, and T21: muriate of potash + 20% charcoal + 20% sago bark ash. Different letters indicate significant differences between means using Tukey’s HSD test at p ≤ 0.05. The error bars are the ± standard error of triplicates. Letters without any marks and letters with ‘ and ” indicate mean comparison within thirty, sixty, and ninety days after incubation, respectively.
Agronomy 11 02222 g009
Figure 10. Effects of treatments on soil-exchangeable iron (a) thirty; (b) sixty; and (c) ninety days after incubation. T1: soil control, T2: conventional practice, T3: muriate of potash + 100% charcoal + 100% sago bark ash, T4: muriate of potash + 100% sago bark ash, T5: muriate of potash + 100% charcoal, T6: muriate of potash + 80% charcoal + 80% sago bark ash, T7: muriate of potash + 60% charcoal + 80% sago bark ash, T8: muriate of potash + 40% + 80% sago bark ash, T9: muriate of potash + 20% charcoal + 80% sago bark ash, T10: muriate of potash + 80 charcoal + 60% sago bark ash, T11: muriate of potash + 60% charcoal + 60% sago bark ash, T12: muriate of potash + 40% charcoal + 60% sago bark ash, T13: muriate of potash + 20% charcoal + 60% sago bark ash, T14: muriate of potash + 80% charcoal + 40% sago bark ash, T15: muriate of potash + 60% charcoal + 40% sago bark ash, T16: muriate of potash + 40% charcoal + 40% sago bark ash, T17: muriate of potash + 20% charcoal + 40% sago bark ash, T18: muriate of potash + 80% charcoal + 20% sago bark ash, T19: muriate of potash + 60% charcoal + 20% sago bark ash, T20: muriate of potash + 40% charcoal + 20% sago bark ash, and T21: muriate of potash + 20% charcoal + 20% sago bark ash. Different letters indicate significant differences between means using Tukey’s HSD test at p ≤ 0.05. The error bars are the ± standard error of triplicates. Letters without any marks and letters with ‘ and ” indicate mean comparison within thirty, sixty, and ninety days after incubation, respectively.
Agronomy 11 02222 g010aAgronomy 11 02222 g010b
Figure 11. Effects of treatments on soil total potassium over (a) thirty; (b) sixty; and (c) ninety days after incubation.T1: soil control, T2: conventional practice, T3: muriate of potash + 100% charcoal + 100% sago bark ash, T4: muriate of potash + 100% sago bark ash, T5: muriate of potash + 100% charcoal, T6: muriate of potash + 80% charcoal + 80% sago bark ash, T7: muriate of potash + 60% charcoal + 80% sago bark ash, T8: muriate of potash + 40% + 80% sago bark ash, T9: muriate of potash + 20% charcoal + 80% sago bark ash, T10: muriate of potash + 80 charcoal + 60% sago bark ash, T11: muriate of potash + 60% charcoal + 60% sago bark ash, T12: muriate of potash + 40% charcoal + 60% sago bark ash, T13: muriate of potash + 20% charcoal + 60% sago bark ash, T14: muriate of potash + 80% charcoal + 40% sago bark ash, T15: muriate of potash + 60% charcoal + 40% sago bark ash, T16: muriate of potash + 40% charcoal + 40% sago bark ash, T17: muriate of potash + 20% charcoal + 40% sago bark ash, T18: muriate of potash + 80% charcoal + 20% sago bark ash, T19: muriate of potash + 60% charcoal + 20% sago bark ash, T20: muriate of potash + 40% charcoal + 20% sago bark ash, and T21: muriate of potash + 20% charcoal + 20% sago bark ash. Different letters indicate significant differences between means using Tukey’s HSD test at p ≤ 0.05. The error bars are the ± standard error of triplicates. Letters without any marks and letters with ‘ and ” indicate mean comparison within thirty, sixty, and ninety days after incubation, respectively.
Agronomy 11 02222 g011aAgronomy 11 02222 g011b
Figure 12. Effects of treatments on soil water-soluble potassium over (a) thirty; (b) sixty; and (c) ninety days after incubation. T1: soil control, T2: conventional practice, T3: muriate of potash + 100% charcoal + 100% sago bark ash, T4: muriate of potash + 100% sago bark ash, T5: muriate of potash + 100% charcoal, T6: muriate of potash + 80% charcoal + 80% sago bark ash, T7: muriate of potash + 60% charcoal + 80% sago bark ash, T8: muriate of potash + 40% + 80% sago bark ash, T9: muriate of potash + 20% charcoal + 80% sago bark ash, T10: muriate of potash + 80 charcoal + 60% sago bark ash, T11: muriate of potash + 60% charcoal + 60% sago bark ash, T12: muriate of potash + 40% charcoal + 60% sago bark ash, T13: muriate of potash + 20% charcoal + 60% sago bark ash, T14: muriate of potash + 80% charcoal + 40% sago bark ash, T15: muriate of potash + 60% charcoal + 40% sago bark ash, T16: muriate of potash + 40% charcoal + 40% sago bark ash, T17: muriate of potash + 20% charcoal + 40% sago bark ash, T18: muriate of potash + 80% charcoal + 20% sago bark ash, T19: muriate of potash + 60% charcoal + 20% sago bark ash, T20: muriate of potash + 40% charcoal + 20% sago bark ash, and T21: muriate of potash + 20% charcoal + 20% sago bark ash. Different letters indicate significant differences between means using Tukey’s HSD test at p ≤ 0.05. The error bars are the ± standard error of triplicates. Letters without any marks and letters with ‘ and ” indicate mean comparison within thirty, sixty, and ninety days after incubation, respectively.
Agronomy 11 02222 g012
Figure 13. Effects of treatments on soil-exchangeable potassium over (a) thirty; (b) sixty; and (c) ninety days after incubation. T1: soil control, T2: conventional practice, T3: muriate of potash + 100% charcoal + 100% sago bark ash, T4: muriate of potash + 100% sago bark ash, T5: muriate of potash + 100% charcoal, T6: muriate of potash + 80% charcoal + 80% sago bark ash, T7: muriate of potash + 60% charcoal + 80% sago bark ash, T8: muriate of potash + 40% + 80% sago bark ash, T9: muriate of potash + 20% charcoal + 80% sago bark ash, T10: muriate of potash + 80 charcoal + 60% sago bark ash, T11: muriate of potash + 60% charcoal + 60% sago bark ash, T12: muriate of potash + 40% charcoal + 60% sago bark ash, T13: muriate of potash + 20% charcoal + 60% sago bark ash, T14: muriate of potash + 80% charcoal + 40% sago bark ash, T15: muriate of potash + 60% charcoal + 40% sago bark ash, T16: muriate of potash + 40% charcoal + 40% sago bark ash, T17: muriate of potash + 20% charcoal + 40% sago bark ash, T18: muriate of potash + 80% charcoal + 20% sago bark ash, T19: muriate of potash + 60% charcoal + 20% sago bark ash, T20: muriate of potash + 40% charcoal + 20% sago bark ash, and T21: muriate of potash + 20% charcoal + 20% sago bark ash. Different letters indicate significant differences between means using Tukey’s HSD test at p ≤ 0.05. The error bars are the ± standard error of triplicates. Letters without any marks and letters with ‘ and ” indicate mean comparison within thirty, sixty, and ninety days after incubation, respectively.
Agronomy 11 02222 g013aAgronomy 11 02222 g013b
Table 1. Selected physical and chemical properties of Bekenu Series (Typic Paleudults), charcoal, and sago bark ash used in the incubation study.
Property SoilCharcoal Sago Bark Ash
pH (water)3.957.749.99
pH (KCl)4.617.319.66
EC (µS cm−1)35.10269.335753.00
Bulk density (g m−3)1.25ndnd
(%)
Total carbon2.16ndnd
Total N0.08ndnd
(mg kg−1)
Total P22.25ndnd
Total K101.27ndnd
(cmol kg−1)
Cation exchange capacity4.67nd13.13
Exchangeable acidity1.150.10nd
Exchangeable Al3+0.130.047nd
Exchangeable H+1.020.05nd
(mg kg−1)
Exchangeable K+0.061435.209120.00
Exchangeable Ca2+0.022346.673361.20
Exchangeable Mg2+0.22409.07433.73
Exchangeable Na+0.0399.38348.00
Exchangeable Fe2+1.0941.908.43
Sand (%)71.90ndnd
Silt (%)13.50ndnd
Clay (%)14.60ndnd
Texture (USDA)Sandy loamndnd
Note: the values given are on a dry-weight basis; nd: not determined.
Table 2. Amounts of muriate of potash, charcoal, and sago bark used in the incubation study.
TreatmentSoil (kg)MOP (g)Charcoal (g)Sago Bark Ash (g)
g Container−1
T11---
T212.41--
T312.4151.425.7
T412.41-25.7
T512.4151.4-
T612.4141.120.6
T712.4130.820.6
T812.4120.620.6
T912.4110.320.6
T1012.4141.115.4
T1112.4130.815.4
T1212.4120.615.4
T1312.4110.315.4
T1412.4141.110.3
T1512.4130.810.3
T1612.4120.610.3
T1712.4110.310.3
T1812.4141.15.1
T1912.4130.85.1
T2012.4120.65.1
T2112.4110.35.1
Note: 2.41 g MOP refers to 100% of the recommended rate of the MOP fertilizer; 51.4 g charcoal: charcoal recommended rate at 100%; 41.1 g charcoal: charcoal recommended rate at 80%; 30.8 g charcoal: charcoal recommended rate at 60%; 20.6 g charcoal: charcoal recommended rate at 40%, 10.3 g charcoal: charcoal recommended rate at 20%; 25.7 g sago bark ash: sago bark ash recommended rate at 100%; 20.6 g sago bark ash: sago bark ash recommended rate at 80%; 15.4 g sago bark ash: sago bark ash recommended rate at 60%; 10.3 g sago bark ash: sago bark ash recommended rate at 40%; 5.1 g sago bark ash: sago bark ash recommended rate at 20%.
Publisher’s Note: MDPI stays neutral with regard to jurisdictional claims in published maps and institutional affiliations.

