Article

Moringa oleifera Leaf Extract Enhanced Growth, Yield, and Silybin Content While Mitigating Salt-Induced Adverse Effects on the Growth of Silybum marianum

1
Department of Biological Sciences, College of Science, King Faisal University, AlAhsa 31982, Saudi Arabia
2
Department of Horticulture, Faculty of Agriculture, Suez Canal University, Ismailia 41522, Egypt
3
Department of Pharmacognosy, Faculty of Pharmacy, Suez Canal University, Ismailia 41522, Egypt
*
Author to whom correspondence should be addressed.
Agronomy 2021, 11(12), 2500; https://doi.org/10.3390/agronomy11122500
Submission received: 23 October 2021 / Revised: 1 December 2021 / Accepted: 6 December 2021 / Published: 9 December 2021

Abstract

:
Silybin A and B are two major hepatoprotective flavonolignans produced predominantly in Silybum marianum fruits. Similar to other plant secondary metabolites, silybin production is enhanced by biotic or abiotic stresses under the expanse of plant growth and yield. In this study, a novel strategy for enhancing silybin production was investigated by applying a natural plant growth enhancer, moringa leaf extract (MLE), to the S. marianum plants cultivated under salinity abiotic stress. The experiment was conducted using a split-plot design with salinity as the main factor and MLE concentrations as the sub-factor. The individual and combined effects of salinity and MLE on the growth, yield, and silybin content of S. marianum were recorded. The MLE at concentrations of 5 g/L or 10 g/L was applied as foliar spray to S. marianum plants, which were irrigated with either tap water or saline (2000 ppm or 4000 ppm). Our results revealed that 10 g/L MLE effectively enhances the growth, yield, and silybin (A + B) content in S. marianum plants not exposed to salinity stress. On the other hand, for plants that were exposed to 4000 ppm salinity, the application of MLE was able to alleviate the salinity-induced adverse effects on some of the plant growth parameters but did not significantly increase their silybin (A + B) compositions. The current study also indicated that the increase in silybin contents was accompanied by the upregulation of the chalcone synthase 1 and 3 genes, which have been implicated in the synthesis of silybin.

1. Introduction

Secondary metabolites from many plant fruits and/or seeds are often good sources of bioactive compounds used in medicinal and pharmaceutical industries [1]. Silymarin is one of these bioactive compounds and has been used in treating various forms of liver disorders [2]. Silymarin is produced by the fruits of Silybum marianum (L.) Gaertn (milk thistle, Asteraceae), an annual or biannual medicinal plant indigenous to the Middle East and Mediterranean regions. Silymarin is a stereoisomeric flavonolignan mixture of silybin (SB), isosilybin (ISB), silydianin (SD), silychristin (SC), and their precursor taxifolin (TXF) [3] The hepatoprotective effects of silymarin have been attributed to natural silybin, a mixture of silybin A and silybin B [4,5]. Naturally, secondary metabolites are synthesized in plants as responses to various biotic or abiotic stresses such as drought or salinity. Elicitation is the process in which abiotic or biotic stress factors are applied to plants, especially medicinal plants, to enhance their bioactive compound production. The elicitation of silymarin production in S. marianum by various elicitors has been documented [6,7,8,9]. Nevertheless, one of the problems often faced in elicitation studies is the adverse effects of elicitors on plant growth or yield.
Fertilizers are substance that are applied to plants to enhance their growth and yield. Lately, the replacement of synthetic chemical fertilizers with organic fertilizers has been highly promoted as a sustainable agricultural strategy because organic fertilizers promote plant growth without risks of chemically polluting the land or water sources. Among the various organic fertilizers, plant extracts have been documented to enhance plant growth by improving nutrient usage efficiency and by alleviating various biotic or abiotic stress effects on plants [10]. Moringa oleifera, from the family Moringaceae, is well known for its nutritional and medicinal properties [11]. The moringa leaf extract (MLE) has been classified as one of the prominent bio-stimulants due to its rich minerals, free amino acids, vitamins, phytohormones, and antioxidant contents [12]. Moreover, the preparation of MLE in 80% ethanol or in water is both cost-efficient and eco-friendly [12]; therefore, it has been used as a natural growth promoter and/or stress-reducing agent for many plant species [12,13,14,15,16,17,18].
Chalcone synthase (EC 2.3.1.74) has been implicated in the biosynthesis of multiple secondary metabolites in plants, fungi, and bacteria [19]. In S. marianum, chalcone synthase catalyzes the first committed step of the biosynthesis of taxifolin, the flavonoid precursor that forms the flavonolignans mixture of silymarin. Three S. marianum chalcone synthase genes (SmCHS1, SmCHS2, and SmCHS3) have been identified and partially cloned. These genes were reported to be differentially expressed in various organs of the plants during the early and late flowering stages [20]. El-Garhy et al. [8] have reported that these CHS genes were differentially activated by salinity and gamma radiation and that their activation profiles were found to be closely associated with silymarin accumulation in fruit samples.
In this study, salinity stress was imposed on S. marianum plants by irrigating the plants with different concentrations of saline. The effect of salinity on S. marianum was investigated as it is one of the abiotic stresses that is threatening plant growth and production worldwide, and being a stress factor, it could be manipulated to enhance the production of secondary metabolites, particularly silymarin. In addition, MLE was applied as a foliar spray to S. marianum plants to examine its plant growth and yield enhancement effects as well as its potential in alleviating adverse effects from salinity stress. The aim of this study was to explore the best strategy for enhancing silymarin production with minimal adverse effects on plant growth and yield by investigating the combining effects of salinity and MLE on S. marianum plant growth, yield, and silybin (A + B) production. Furthermore, the expression of the S. marianum chalcone synthase genes (CHS 1, CHS 2, and CHS 3) in the experimental plants was examined to establish a correlation between silybin (A + B) content and the expression of these genes.

2. Materials and Methods

2.1. Source of Moringa Leaves

Young leaves of Moringa oleifera were collected from fully grown (four-year-old) trees planted at the AL Sahab farm, Al-Hassa, Saudi Arabia.

2.2. Chemical Analysis of Moringa Leaves

Table 1 showed the chemical composition of Moringa oleifera leaves. Analyses of the elements and secondary metabolites were performed on dried leaves, while fresh leaves were used to determine the free amino acid, vitamin, and plant growth regulator contents [13,14].

2.3. Preparation of Moringa Leaf Extracts

The Moringa oleifera leaf extract (MLE) was prepared by mixing 20 g of Moringa oleifera air-dried leaves with 675 mL of 80% ethanol and left at room temperature for 72 h with occasional manual swirling [21]. The extracts were filtered with Whatman filter paper, and ethanol was removed by drying the filtrate in a fume hood. The dried extract was then resuspended in 20% ethanol to achieve final concentrations of 5 and 10 g/L of MLE.

2.4. Silybum Plant Material and Growth Conditions

A field experiment was conducted during two successive seasons, in 2018 and 2019, at the Agriculture and Veterinary Research and Training Centre, King Faisal University. The Silybum marianum seeds were harvested from plants grown at the Institute for Horticultural Science, Agricultural Research Center (ARC), Department of Medicinal and Aromatic Plants, Giza, Egypt. Dry seeds were germinated in a 24-well (5 cm × 5 cm × 5 cm) germination tray containing a moist mixture of (1:1 v:v) sand and peat moss on 1 October of each planting years. After one month, the seedlings were transplanted to plastic pots (37.5 cm in diameter and 27.5 cm in depth) containing approximately 25 kg of moist mixture of (1:1 v:v) sand and peat moss per pot. The pots were arranged in a split-plot design with two factors: salinity (control, 2000 ppm, and 4000 ppm) as the main factor (whole-plot), and MLE concentration (control, 5 g/L, and 10 g/L) as a sub-factor (sub-plot). Each sub-plot contained 28 pots. The chemical properties and composition of the tap water used are shown in Table 2. The controls for salinity and MLE consisted of tap water. Sea salt was dissolved in fresh tap water to prepare the saline at 2000 and 4000 ppm salinity. The salinity of all solutions was measured using a portable electrical conductivity meter (YSI EcoSense EC300). The MLE treatments were applied by foliar spray every two months throughout the vegetative growth stage of the S. marianum. The seeds and seedlings (up to two months old) were irrigated with tap water. The salinity treatments begun one month after the transplantation of seedlings from the germination trays to the pots. When the salinity treatment began, extra seedlings from each pot were removed to ensure that each pot contained only a single plant. All irrigations were performed daily up to the soil’s water-holding capacity.

2.5. Measurement of Vegetative Growth

The Silybum plants were harvested at 270 days after sowing. The growth parameters such as plant height (cm), number of leaves (n), number of branches (n), and respective dry weights of the aerial part (g) and roots (g) from 20 plants of each treatment group (sub-plot) were recorded.

2.6. Measurement of Yield

Mature fruits were harvested regularly from all of the plants and dried at room temperature. The number of capitula (n) and dry weight of fruits (g) from 20 plants of each treatment group (sub-plot) were documented.

2.7. Determination of Photosynthetic Pigments

The plant pigments (chlorophyll a (Chl-a), chlorophyll b (Chl-b), and carotenoid) were extracted from the third fresh leaf from the top of 20 randomly selected 270-day-old S. marianum plants of each treatment group (sub-plot) using 80% acetone. The pigment contents were measured spectrophotometrically and quantified as milligrams per 100 g of fresh leaf weight [22].

2.8. Determination of Mineral Composition

For each treatment group (sub-plot), the leaf samples from 20 randomly selected plants that were harvested at 270 days were dried at 60 °C in an oven for 24 h. The oven-dried leaves samples were ground and digested with sulfuric acid [23], and the potassium (K+) and sodium (Na+) contents were determined by Atomic Absorption Flame Photometry [24].

2.9. Determination of Silybin (A + B) Content by High-Performance Liquid Chromatography (HPLC)

2.9.1. Instrumentation

The HPLC analysis was performed using the WatersTM 2690 Alliance HPLC system (Waters, Milford, MA, USA) equipped with a WatersTM 996 photodiode array detector (Waters, Milford, MA, USA).

2.9.2. Preparation of Silybin (A + B) Standard Curve

The silybin (A + B) authentic standard (93.06%) (catalogue no. sc-473918) was purchased from the Santa Cruz Biotechnology, Dallas, TX, USA. A stock solution of 1 mg/mL of silybin (A + B) in methanol was prepared and diluted to obtain standard solutions with 750, 500, 250, 100, and 50 μg/mL. All standard solutions were filtered using 0.22 μm syringe filters, and 10 μL of each standard solution was injected into the HPLC system per run.

2.9.3. Preparation of Silybum Fruit Methanolic Extract

The contents of silybin (A + B) were determined from the air-dried fruit samples collected from 20 plants per each treatment group (sub-plot). The air-dried fruits were ground with a blender, and the powders were used to perform the methanolic extraction. The known weight of the fruit powder was combined with 50 mL of methanol in a conical flask, sonicated for 30 min, and kept in the dark for 24 h. These processes (sonication for 30 min followed by maintenance in the dark for 24 h) were repeated for two subsequent days by collecting the supernatant and by adding another 50 mL of fresh methanol to ensure complete extraction. All of the methanol supernatants collected from each sample for three consecutive days were combined and placed in a rotary evaporator operated at 40 °C to remove the solvent completely. A known weight of the residue (methanolic extract) was then dissolved in 5 mL of methanol, and the solution was filtered using a 0.22 μm syringe filter. For each sample, 10 μL of filtrate was injected into the HPLC system.

2.9.4. HPLC Analysis Conditions

The HPLC separation and quantitation were performed at ambient temperature with a C18 Kromasil (4.6 mm × 150 mm, 5 µm) column (Waters, Milford, MA, USA). A gradient mobile phase was generated by systematically varying the mixture percentage of two solvents (A and B) throughout the operation (50 min). Solvent A consisted of water, methanol, and phosphoric acid (80:20:0.5), while solvent B consisted of methanol, water, and phosphoric acid (80:20:0.5). The flow rate was maintained at 1 mL/min. The eluted compounds were detected at 288 nm.

2.10. Analysis Chalcone Synthase 1, 2, and 3 Gene Expressions by Real-Time Reverse-Transcribed Polymerase Chain Reaction (Real Time RT-PCR)

2.10.1. Total RNA Preparation and cDNA Synthesis

In each treatment group (sub-plot), the petals of 10 individual plants were collected and stored at −80 °C until RNA extraction was performed using the RNeasy Mini Kit (Qiagen LLC, Hilden, Germany, catalogue. no. 74104). From each biological sample, 1 μg of total RNA was reverse transcribed into cDNA using the ReadyScriptTM cDNA synthesis mix (Sigma-Aldrich Inc. St. Louis, Missouri, USA, catalogue no. RDRT) following the manufacturers reaction conditions (25 °C for 5 min, 42 °C for 30 min, and 85 °C for 5 min). The cDNA synthesis mix was supplied with a proprietary ratio of oligo-dT and random primers as determined by the manufacturer (ReadyScriptTM).

2.10.2. Real-Time RT-PCR and Chalcone Synthase Gene Expression Analysis

The real-time PCR reaction (25 μL total volume) consisted of 2 μL of the cDNA reaction mixture, a final concentration of 0.3 µM of the respective forward and reverse primers (Table 3), 12.5 μL of SYBR Green PCR Master Mix (QuantiTech SYBR Green PCR Kit, Qiagen LLC, Hilden, Germany, catalogue no. 204143), 1 μL of the RNase inhibitor, and an appropriate volume of RNase-free water. The forward and reverse primers for the three target genes—chalcone synthase 1 (CHS1), chalcone synthase 2 (CHS2), and chalcone synthase 3 (CHS3)—and a reference gene, dehydrogenase (NADH), were designed according to the gene sequences available in GenBank (Table 3). The real-time PCR (95 °C initial heating for 10 min, and 45 cycles of 95 °C for 20 s and 60 °C for 1 min) was performed using the Applied Biosystem 7500 Real-time PCR system (Termo Fisher Scientific, Waltham Massachusetts, USA). The expression of the individual chalcone synthase gene was quantified using the 2−ΔΔCT method [25] by normalizing the target gene expression with that of the reference gene. The mean expressions of each of the three CHS genes from every treatment group were calculated based on six biological samples, with two technical replicates from each biological sample. The relative fold expressions of the CHS1, CHS2, and CHS3 genes for individual treatment groups were calculated and compared with the expression of the corresponding gene for the control group (control salinity and MLE).

2.11. Statistical Analysis

The experiment was conducted with a split-plot design and three whole plots (control, 2000 ppm, and 4000 ppm salinity) and three sub-plots (control, 5 g/L, and 10 g/L MLE). The data were statistically analyzed using Statistica 6 program ANOVA/MANOVA [26]. The significance of differences among means was detected using the Least Significant Test (L.S.D) at p < 0.05.

3. Results

3.1. Analysis of Moringa Oleifera Leaf Composition

The chemical composition of the Moringa oleifera leaves is displayed in Table 1. The moringa leaves are rich in macro and micro elements (Ca, Cu, Fe, Mg, P, K, and Zn); proteins; free amino acids (Arg, His, Ile, Leu, Lys, Met, Phe, Thr, Trp, and Val); vitamins (A, B1, B2, B3, and C); phytohormones (gibberellin, zeatin, and indole acetic acid); and secondary metabolites such as polyphenol, flavonoid, tocopherol, rutin, and gallic acid.

3.2. The Effects of Salinity and MLE Foliar Spray on the Growth and Yield of Silybum Marianum

The analyses of the salinity and MLE foliar treatment effects on the growth and yield parameters of Silybum marianum during both the 2018 and 2019 planting seasons are presented in Table 4 and Table 5, respectively. The single factor analyses of the salinity treatments implied that an increase in salinity reduced all of the growth parameters in dose-dependent manners during both planting seasons (Table 4a). The single factor analyses of the MLE foliar treatments indicated that both MLE concentrations (5 g/L and 10 g/L) positively impacted the plant height, number of leaves, number of branches, and aerial part dry weight (Table 4b). In both planting seasons, the 10 g/L MLE performed better than the 5 g/L MLE in all of the above parameters except for the number of branches. In contrast with all of the growth parameters mentioned above, the root dry weight was negatively affected by the MLE foliar treatments.
When the effects of both the salinity and MLE treatments were analyzed together, the enhancement effects of MLE foliar treatments on plant height, number of leaves, and number of branches were only obvious at control salinity. In addition, the negative impact of MLE on root dry weight observed in the single factor data analysis appeared to result from the influence of salt stress as reduced root dry weight trends were only observed in plants irrigated with 2000 and 4000 ppm saline but not in those irrigated with tap water (control salinity). At moderate salinity levels (2000 ppm), the application of MLE reduced all of the growth parameters (plant height, number of leaves, number of branches, root dry weight, and aerial part dry weight) of S. marianum. As expected, the plant height, number of leaves, and number of branches were greatly reduced at high salinity levels (4000 ppm) compared with those cultivated at control and moderate (2000 ppm) salinity. The application of either 5 or 10 g/L of MLE to plants cultivated at high salinity (4000 ppm) resulted in huge enhancements in aerial parts dry weight. In addition, increases in the number of leaves and branches were also observed in plants sprayed with 10 g/L MLE (Table 4c).
A single factor analysis of the salinity treatment indicated that salinity decreased the number of capitula as well as the dry weight of fruits in both planting seasons (Table 5a). Single factor analyses of the MLE treatments indicated that MLE increased the number of capitula in both the 2018 and 2019 planting seasons, with the 10 g/L MLE treatment giving the highest number of capitula. The effects of MLE on the fruit dry weight were different in the two planting seasons. In 2018, the MLE was found to increase the fruit dry weight, though not statistically significantly. However, in 2019, the MLE was found to decrease the fruit dry weight (Table 5b).
Analyses of interaction effects between MLE and salinity treatments revealed that the MLE treatments increased the number of capitula at control and moderate salinity (2000 ppm), with 10 g/L MLE producing the highest number of capitula in both seasons. At high salinity (4000 ppm), the results were inconsistent, as in 2018, the presence of MLE was found to reduce the number of capitula, while in another season, the 5 g/L MLE increased the number of capitula. Under moderate (2000 ppm) and high (4000 ppm) salinity, the presence of MLE lowered the fruit dry weight in both planting seasons; however, under control salinity, the MLE effect was contradictory between seasons. For instance, in 2018, the application of MLE to plants cultivated under control salinity have higher fruit dry weight, but the reverse was observed in 2019 (Table 5c).

3.3. The Effects of Salinity and MLE Foliar Spray on the Compositions of Chlorophyll a, Chlorophyll b, and Carotenoid in S. marianum Leaves

Single factor analyses of the salinity effect showed a consistent reduction in the chlorophyll b contents in both planting seasons (Table 6a). On the other hand, single factor analyses of the MLE effects on the photosynthetic pigment (chlorophyll a (Chl a), chlorophyll b (Chl b), and carotenoids) contents in the S. marianum leaves revealed that the application of MLE reduced the contents of Chl a and carotenoid in both planting seasons (Table 6b).
Analyses of the interaction effects of salinity and MLE indicated that, under control salinity, the presence of MLE reduced the Chl a, Chl b, and carotenoid contents significantly in the 2018 season. Even though increases in Chl b and carotenoid contents were observed in plants sprayed with 5 g/L MLE in the 2019 season, the difference was not statistically different from those of the control (without MLE) and the 10 g/L MLE groups. In the 2018 planting season, the application of 5 g/L MLE to plants grown at moderate salinity (2000 ppm) significantly reduced the contents of Chl a and carotenoid, while the application of 10 g/L MLE increased the contents of these pigments even though the differences were not statistically different from those of the control (without MLE). A similar trend (decreased by 5 g/L MLE but increased by 10 g/L MLE) was also observed in the chlorophyll b contents, even though the difference among the means was not statistically significant. At high salinity (4000 ppm), the presence of 5 g/L MLE elevated the carotenoid contents in both planting seasons. However, the effects of MLE on Chl a and Chl b were contradictory between the two planting seasons (Table 6c).

3.4. The Effects of Salinity and MLE Foliar Spray on the Mineral Contents in S. marianum Leaves

The sole effects of salinity were very clear. An increase in salinity resulted in an increased sodium content but a reduced potassium content (Table 7a). In contrast with that of salinity, the sole effects of MLE on the sodium or potassium contents in S. marianum leaves were inconsistent between the two planting seasons. In the 2018 planting season, increases in Na+ content and reductions in K+ content were associated with the application of MLE. On the other hand, in the 2019 planting season, the application of 10 g/L MLE increased both Na+ and K+ in the plant leaves (Table 7b).
The combined effects of MLE and salinity were complex. Nevertheless, in control and high salinity (4000 ppm), plants with the highest sodium contents were found to have the lowest potassium contents. For instance, in the control salinity treatment, plants treated with 5 g/L MLE contained the highest sodium but lowest potassium contents compared with the control (without MLE) and 10 g/L MLE-treated plants. Similarly, under high salinity (4000 ppm), the plants treated with control (without MLE) also contained the highest sodium but lowest potassium contents compared with those treated with either concentration of MLE. In general, we observed that plants cultivated under 4000 ppm salinity accumulated less Na+ but more K+ if they were treated with MLE foliar spray (Table 7c).

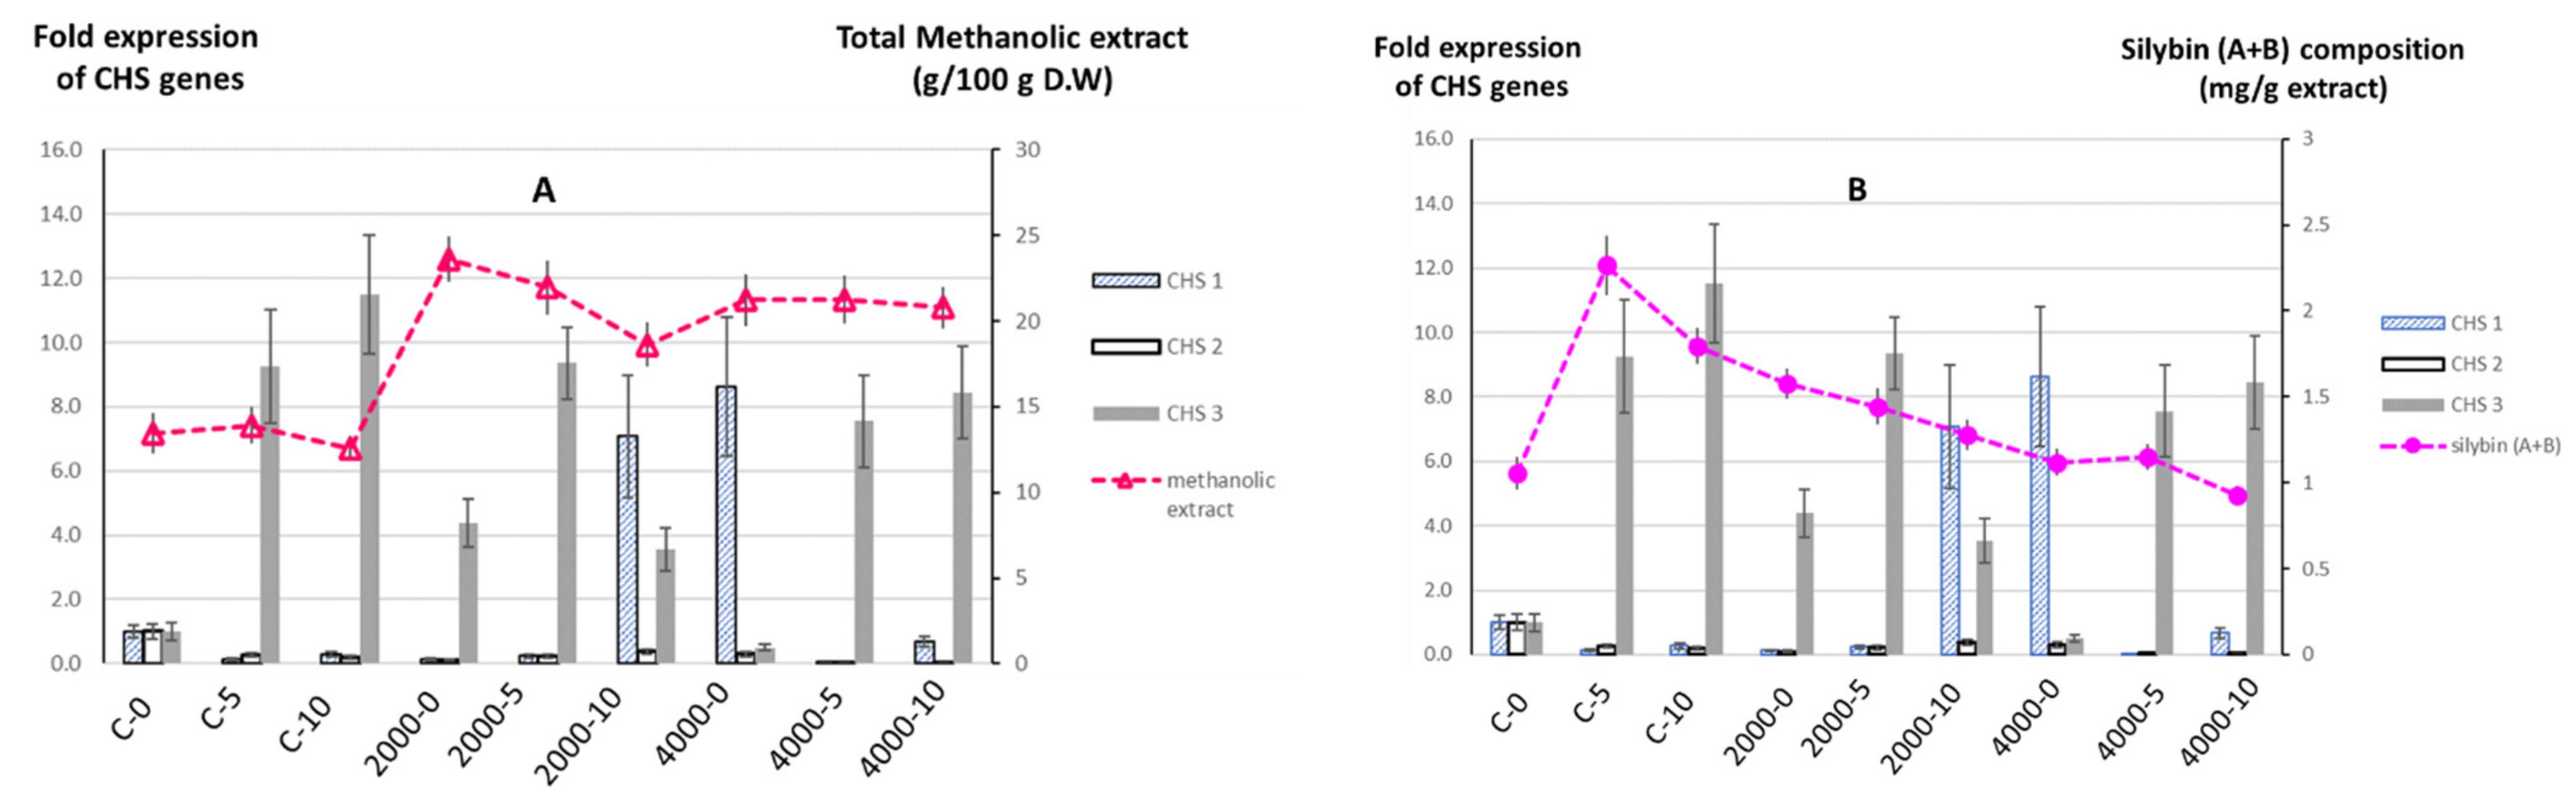
3.5. The Effects of Salinity and MLE Foliar Spray on the Total Amount of Methanolic Extract and Silybin (A + B) Composition of S. marianum Fruits

The combined effects of salinity and MLE on the production of secondary metabolites in S. marianum were investigated (Table 8, Figure 1). Methanolic extracts were prepared from the ground, air-dried fruits of S. marianum plants treated with various combinations of salinity levels and concentrations of MLE. The amounts of silybin (A + B) present in the methanolic extracts were quantified using high-performance liquid chromatography (HPLC) by comparing the standard curve prepared using a series of silybin (A + B) solutions with known concentrations.
As expected, salinity as an abiotic stress factor increased the total methanolic extract as well as the silybin (A + B) composition. The highest amounts of methanolic extract and silybin (A + B) composition were observed in plants cultivated under moderate salinity (2000 ppm) without MLE foliar spray. The 2000 ppm salinity led to the accumulation of the highest amount of extract (23.614 g/100 g D.W) from the dried fruit compared with those plants grown under 4000 ppm (21.240 g/100 g D.W) or control salinity (13.421 g/100 g D.W). In addition, the corresponding extract also contained the highest composition of silybin (A + B) (1.578 mg/g extract) compared to extracts from plants grown under 4000 ppm (1.119 g/100 g mg/g extract) or control salinity (1.056 g mg/g extract).
The effects of MLE foliar spray on the amount of total methanolic extracts produced and the composition of silybin (A + B) were dependent on the salinity levels in which the plants were cultivated. For plants grown under control salinity, the application of MLE significantly increased the composition of silybin (A + B) within the methanolic extract. The 5 g/L MLE foliar spray induced the highest silybin (A + B) composition (2.262 mg/g extract) compared with the 10 g/L MLE (1.796 mg/g extract) or control (1.056 mg/g extract) treatments. Interestingly, we observed no significant change in the total amount of methanolic extract when 5 g/L MLE was applied, and a reduction in total amount of methanolic extract was observed when 10 g/L MLE was applied. The application of MLE on plants grown under moderate salinity (2000 ppm) reduced the total amount of methanolic extract as well as the composition of silybin (A + B) within the extracts compared with plants that were sprayed with the control (tap water). On the other hand, the application of MLE on plants grown under high (4000 ppm) salinity did not show any significant difference in the total amount of methanolic extract content. In addition, a small reduction in silybin (A + B) composition was observed in the plants treated with 10 g/L MLE.

3.6. The Effects of Salinity and MLE Foliar Spray on the Expressions of Chalcone Synthase 1, 2, and 3 Genes in S. marianum Petals

In this study, our results indicated that the CHS1 and CHS3 genes were upregulated differentially by salinity and/or MLE treatments. In contrast to the CHS1 and CHS3 genes, the CHS2 gene was downregulated in all of the treatments compared with the control (control salinity level and without MLE foliar spray). Approximately seven- to eightfold higher expression levels of the CHS1 gene were observed in combination treatments of 2000 ppm salinity/10 g MLE and 4000 ppm salinity/without MLE. All combinations of salinity and MLE treatments except that of 4000 ppm/without MLE showed three- to elevenfold higher CHS3 gene expressions compared to the control (control salinity level and without MLE foliar sprayed) (Figure 1).

4. Discussion

The present study aimed to examine the combined effects of different concentrations of moringa leaf extract (MLE) and salinity levels on the vegetative growth, yield, and silybin (A + B) compositions of S. marianum plants. The increase in S. marianum plant growth and yield observed in plants cultivated without salinity stress (control salinity) supported previous reports from other plants species, which implies that MLE is a highly promising bio-stimulant [12,13,14,17,18,27]. Phytohormones such as indoleacetic acids (IAA), gibberellins, and zeatin, which promote cell division and cell expansion, have been associated with MLE-induced plant growth and yield enhancement [12]. In contract with many previous studies on other plant species, no MLE-induced enhancement effects were observed on the contents of photosynthetic pigments in the S. marianum leaves despite the increase in plant growth and yield. HPLC analyses revealed that the application of MLE foliar spray to plants cultivated under control salinity differentially affected the compositions of the methanolic extracts produced from the fruits of the treated plants. We observed that MLE increased the silybin (A + B) compositions without significantly altering the total amount of methanolic extract produced from these plants; 5 g/L MLE produced the highest amount of silybin (A + B) compared with those without MLE spray or sprayed with 10 g/L MLE. Taken together, our results suggest that the application of 10 g/L MLE foliar spray has greater enhancement effects on the growth and yield of S. marianum while 5 g/L MLE led to higher methanolic extract production and higher silybin (A + B) compositions within the extract.
Decreased plant growth and yield have been widely reported in plants cultivated under saline conditions, as the plants diverted their resources to cope with stress. Consistent with previous investigations from S. marianum [8] and other plant species [28,29,30], salinity-associated reductions in growth and yield of S. marianum plants as well as their chlorophyll a and b contents were also noted in the present study. The salinity-induced adverse effects on the abovementioned parameters were mild under 2000 ppm salinity but became severe when the salinity was raised to 4000 ppm. Elevated levels of carotenoid, a photosynthetic pigment, also play a critical antioxidant role [31] in easing the adverse effects caused by the accumulation of reactive oxygen species (ROS) in S. marianum plants grown under 2000 ppm and 4000 ppm salinity levels. As expected, S. marianum plants grown under higher salinity level accumulated a higher level of sodium salt but a comparatively lower level of potassium salts due to the competition between both type of salts for binding to the same type of ion transporter [32]. Similar to drought stress [33], the S. marianum plants increased the production of secondary metabolites, as seen in the increase amount of methanolic extract as well as in the composition of silybin (A + B) within the extract in order to cope with salt stress.
The MLE enhancement effects on growth (number of leaves and branches, and arial part dry weight), yield (no. of capitula), and carotenoid contents observed in S. marianum plants grown under high salinity (4000 ppm) in the present investigation conformed to previous reports on numerous plant species grown under salinity [34,35,36,37] and other stresses [15,36,38,39,40]. Besides the above parameters, MLE foliar spray also reduced the accumulation of Na+ ions while increasing K+ ions in the cells of plants irrigated with 4000 ppm saline. Increases in K+ and Na+ have been associated with increases in the osmo-tolerance of plants exposed to salt stress [28]. Despite the positive impacts mentioned above, enhancements in both the amount of methanolic extract and the silybin (A + B) compositions in plants treated with 5 g/L MLE were mild and statistically insignificant. In addition, decreases in the amount of methanolic extract and silybin (A + B) composition were observed in plants treated with 10 g/L MLE. In summary, for plants irrigated with 4000 ppm saline, 5 g/L MLE has shown enhancement effects on the aerial part dry weight and carotenoid contents, while 10 g/L MLE has shown improvements on the number of leaves and branches. For plants grown under 2000 ppm salinity, we did not observe any positive impacts of MLE on any of the growth parameters; moreover, MLE dose-dependent decreases in the total amount of methanolic extract and silybin (A + B) were also observed.
The concomitant upregulation of chalcone synthase (CHS 1 and 3) genes and total methanolic extract content and/or silybin (A + B) composition as observed in the current study were in accordance with previous reports [8,41,42,43] even though the roles of each CHS gene needs to be further elucidated.

5. Conclusions

Our results have revealed that, without salinity stress, the 10 g/L MLE foliar application was optimal for growth, yield, and silybin (A + B) composition. The MLE foliar spray was able to reduce the salinity-induced adverse effects on the growth of S. marianum plants irrigated with 4000 ppm saline but has little impact on those irrigated with 2000 ppm saline. The application of MLE has either no significant impact or negative impact on the compositions of silybin (A + B) in plants cultivated under 2000 ppm and 4000 ppm salinity.

Author Contributions

Conceptualization, Y.-K.Y., F.E.-S. and S.K.; methodology, Y.-K.Y. and F.E.-S.; formal analysis, Y.-K.Y., F.E.-S., S.K. and E.S.H.; data curation, Y.-K.Y. and F.E.-S.; writing—original draft preparation, F.E.-S.; writing—review and editing, Y.-K.Y.; All authors have read and agreed to the published version of the manuscript.

Funding

The authors extend their appreciations to the Deanship of Scientific Research, King Faisal University, for funding this research work through grant number 170108.

Institutional Review Board Statement

Not applicable.

Informed Consent Statement

Not applicable.

Data Availability Statement

Not applicable.

Acknowledgments

Assistance from the greenhouse staff at the Agriculture and Veterinary Research and Training Centre, King Faisal University, was highly appreciated.

Conflicts of Interest

The authors declare no conflict of interest.

References

  1. Jimenez-Garcia, S.N.; Vazquez-Cruz, M.A.; Guevara-Gonzalez, R.G.; Torres-Pacheco, I.; Cruz-Hernandez, A.; Feregrino-Perez, A.A. Current Approaches for Enhanced Expression of Secondary Metabolites as Bioactive Compounds in Plants for Agronomic and Human Health Purposes—A Review. Pol. J. Food Nutr. Sci. 2013, 63, 67–78. [Google Scholar] [CrossRef] [Green Version]
  2. Crocenzi, F.; Roma, M. Silymarin as a New Hepatoprotective Agent in Experimental Cholestasis: New Possibilities for an Ancient Medication. Curr. Med. Chem. 2006, 13, 1055–1074. [Google Scholar] [CrossRef] [PubMed]
  3. Biedermann, D.; Vavříková, E.; Cvak, L.; Křen, V. Chemistry of Silybin. Nat. Prod. Rep. 2014, 31, 1138–1157. [Google Scholar] [CrossRef]
  4. Ou, Q.; Weng, Y.; Wang, S.; Zhao, Y.; Zhang, F.; Zhou, J.; Wu, X. Silybin Alleviates Hepatic Steatosis and Fibrosis in NASH Mice by Inhibiting Oxidative Stress and Involvement with the Nf-ΚB Pathway. Dig. Dis. Sci. 2018, 63, 3398–3408. [Google Scholar] [CrossRef] [PubMed]
  5. Sun, R.; Xu, D.; Wei, Q.; Zhang, B.; Aa, J.; Wang, G.; Xie, Y. Silybin Ameliorates Hepatic Lipid Accumulation and Modulates Global Metabolism in an NAFLD Mouse Model. Biomed. Pharmacother. 2020, 123, 109721. [Google Scholar] [CrossRef]
  6. Firouzi, A.; Mohammadi, S.A.; Khosrowchahli, M.; Movafeghi, A.; Hasanloo, T. Enhancement of Silymarin Production in Cell Culture of Silybum marianum (L) Gaertn by Elicitation and Precursor Feeding. J. Herbs Spices Med. Plants 2013, 19, 262–274. [Google Scholar] [CrossRef]
  7. Madrid, E.; Corchete, P.N. Silymarin Secretion and Its Elicitation by Methyl Jasmonate in Cell Cultures of Silybum marianum Is Mediated by Phospholipase D-Phosphatidic Acid. J. Exp. Bot. 2010, 61, 747–754. [Google Scholar] [CrossRef] [PubMed]
  8. El-Garhy, H.A.S.; Khattab, S.; Moustafa, M.M.A.; Abou Ali, R.; Abdel Azeiz, A.Z.; Elhalwagi, A.; el Sherif, F. Silybin Content and Overexpression of Chalcone Synthase Genes in Silybum marianum L. Plants under Abiotic Elicitation. Plant Physiol. Biochem. 2016, 108, 191–202. [Google Scholar] [CrossRef] [PubMed]
  9. El Sherif, F.; Khattab, S.; Ibrahim, A.K.; Ahmed, S.A. Improved Silymarin Content in Elicited Multiple Shoot Cultures of Silybum marianum L. Physiol. Mol. Biol. Plants 2013, 19, 127–136. [Google Scholar] [CrossRef] [Green Version]
  10. Bulgari, R.; Franzoni, G.; Ferrante, A. Biostimulants Application in Horticultural Crops under Abiotic Stress Conditions. Agronomy 2019, 9, 306. [Google Scholar] [CrossRef] [Green Version]
  11. Mangundayao, K.; Yasurin, P. Bioactivity of Moringa oleifera and Its Applications: A Review. J. Pure Appl. Microbiol. 2017, 11, 43–50. [Google Scholar] [CrossRef]
  12. Zulfiqar, F.; Casadesús, A.; Brockman, H.; Munné-Bosch, S. An Overview of Plant-Based Natural Biostimulants for Sustainable Horticulture with a Particular Focus on Moringa Leaf Extracts. Plant Sci. 2020, 295, 110194. [Google Scholar] [CrossRef]
  13. Alkuwayti, M.A.A.; El-Sherif, F.; Yap, Y.-K.; Khattab, S. Foliar Application of Moringa oleifera Leaves Extract Altered Stress-Responsive Gene Expression and Enhanced Bioactive Compounds Composition in Ocimum basilicum. S. Afr. J. Bot. 2020, 129, 291–298. [Google Scholar] [CrossRef]
  14. ElSherif, F.; Albotnoor, N.; Yap, Y.K.; Meligy, A.; Khattab, S. Enhanced Bioactive Compounds Composition in Lavandula officinalis In vitro Plantlets Using NaCl and Moringa oleifera, Aloe vera and Spirulina platensis Extracts. Ind. Crop. Prod. 2020, 157, 112890. [Google Scholar] [CrossRef]
  15. Batool, S.; Khan, S.; Basra, S.M.A. Foliar Application of Moringa Leaf Extract Improves the Growth of Moringa Seedlings in Winter. S. Afr. J. Bot. 2020, 129, 347–353. [Google Scholar] [CrossRef]
  16. Hoque, T.S.; Rana, M.S.; Zahan, S.A.; Jahan, I.; Abedin, M.A. Moringa Leaf Extract as a Bio-Stimulant on Growth, Yield and Nutritional Improvement in Cabbage. Asian J. Med Biol. Res. 2020, 6, 196–203. [Google Scholar] [CrossRef]
  17. Ngcobo, B.L.; Bertling, I. Influence of Foliar Moringa oleifera Leaf Extract (MLE) Application on Growth, Fruit Yield and Nutritional Quality of Cherry Tomato. Acta Hortic. 2021, 1306, 249–254. [Google Scholar] [CrossRef]
  18. Kanchani, A.M.K.D.M.; Harris, K.D. Effect of Foliar Application of Moringa (Moringa oleifera) Leaf Extract with Recommended Fertilizer on Growth and Yield of Okra (Abelmoschus esculentus). Agriest 2019, 13, 38–54. [Google Scholar] [CrossRef]
  19. Dao, T.T.H.; Linthorst, H.J.M.; Verpoorte, R. Chalcone Synthase and Its Functions in Plant Resistance. Phytochem. Rev. 2011, 10, 397–412. [Google Scholar] [CrossRef] [PubMed] [Green Version]
  20. Sepideh, S.; Shobbar, S.Z.; Ebrahimi, M.; Hasanloo, T.; Sadat-Noori, S.-A.; Tirnaz, S. Chalcone Synthase Genes from Milk Thistle (Silybum marianum): Isolation and Expression Analysis. J. Genet. 2015, 94, 611–617. [Google Scholar] [CrossRef]
  21. Makkar, H.P.S.; Becker, K. Nutrional Value and Antinutritional Components of Whole and Ethanol Extracted Moringa oleifera Leaves. Anim. Feed. Sci. Technol. 1996, 63, 211–228. [Google Scholar] [CrossRef]
  22. Horwitz, W.; Chichilo, P.; Reynolds, H. Official Methods of Analysis of the Association of Official Analytical Chemists; Association of Official Analytical Chemists: Washington, DC, USA, 1970. [Google Scholar]
  23. Piper, C.S. Soil and Plant Analysis; Hans Publishers: Cambridge, MA, USA, 1942. [Google Scholar]
  24. Mazumdar, B.C.; Majumder, K. Methods of Physiochemical Analysis of Fruits; Daya Publisher: Delhi, India, 2003. [Google Scholar]
  25. Livak, K.J.; Schmittgen, T.D. Analysis of Relative Gene Expression Data Using Real-Time Quantitative PCR and the 2-ΔΔCT Method. Methods 2001, 25, 402–408. [Google Scholar] [CrossRef]
  26. StatSoft STATISTICA for Windows, Version 6; 2300; StatSoft Inc.: Tulsa, OK, USA, 2001.
  27. Ali, E.F.; Hassan, F.A.S.; Elgimabi, M. Improving the Growth, Yield and Volatile Oil Content of Pelargonium graveolens L. Herit by Foliar Application with Moringa Leaf Extract through Motivating Physiological and Biochemical Parameters. S. Afr. J. Bot. 2018, 119, 383–389. [Google Scholar] [CrossRef]
  28. Van Zelm, E.; Zhang, Y.; Testerink, C. Salt Tolerance Mechanisms of Plants. Annu. Rev. Plant Biol. 2020, 71, 403–433. [Google Scholar] [CrossRef] [Green Version]
  29. Zhao, S.; Zhang, Q.; Liu, M.; Zhou, H.; Ma, C.; Wang, P. Regulation of Plant Responses to Salt Stress. Int. J. Mol. Sci. 2021, 22, 4609. [Google Scholar] [CrossRef]
  30. Zhu, J.K. Salt and Drought Stress Signal Transduction in Plants. Annu. Rev. Plant Biol. 2002, 53, 247–273. [Google Scholar] [CrossRef] [PubMed] [Green Version]
  31. Aslam, M.; Sultana, B.; Anwar, F.; Munir, H. Foliar Spray of Selected Plant Growth Regulators Affected the Biochemical and Antioxidant Attributes of Spinach in a Field Experiment. Turk. J. Agric. For. 2016, 40, 136–145. [Google Scholar] [CrossRef]
  32. Park, H.J.; Kim, W.Y.; Yun, D.J. A New Insight of Salt Stress Signaling in Plant. Mol. Cells 2016, 39, 447–459. [Google Scholar] [CrossRef] [PubMed]
  33. Elsayed, A.I.; El-Hamahmy, M.A.M.M.; Rafudeen, M.S.; Mohamed, A.H.; Omar, A.A. The Impact of Drought Stress on Antioxidant Responses and Accumulation of Flavonolignans in Milk Thistle (Silybum marianum (L.) Gaertn). Plants 2019, 8, 611. [Google Scholar] [CrossRef] [PubMed] [Green Version]
  34. Rady, M.M.; Mohamed, G.F. Modulation of Salt Stress Effects on the Growth, Physio-Chemical Attributes and Yields of Phaseolus vulgaris L. Plants by the Combined Application of Salicylic Acid and Moringa oleifera Leaf Extract. Sci. Hortic. 2015, 193, 105–113. [Google Scholar] [CrossRef]
  35. Yasmeen, A.; Basra, S.M.A.; Farooq, M.; ur Rehman, H.; Hussain, N.; ur Rehman Athar, H. Exogenous Application of Moringa Leaf Extract Modulates the Antioxidant Enzyme System to Improve Wheat Performance under Saline Conditions. Plant Growth Regul. 2013, 69, 225–233. [Google Scholar] [CrossRef]
  36. Latif, H.H.; Mohamed, H.I. Exogenous Applications of Moringa Leaf Extract Effect on Retrotransposon, Ultrastructural and Biochemical Contents of Common Bean Plants under Environmental Stresses. S. Afr. J. Bot. 2016, 106, 221–231. [Google Scholar] [CrossRef]
  37. Howladar, S.M. A Novel Moringa oleifera Leaf Extract Can Mitigate the Stress Effects of Salinity and Cadmium in Bean (Phaseolus vulgaris L.) Plants. Ecotoxicol. Environ. Saf. 2014, 100, 69–75. [Google Scholar] [CrossRef] [PubMed]
  38. De Vasconcelos, A.C.F.; Garófalo Chaves, L.H. Biostimulants and Their Role in Improving Plant Growth under Abiotic Stresses. In Biostimulants in Plant Science; IntechOpen: London, UK, 2020. [Google Scholar]
  39. Khalofah, A.; Bokhari, N.A.; Migdadi, H.M.; Alwahibi, M.S. Antioxidant Responses and the Role of Moringa oleifera Leaf Extract for Mitigation of Cadmium Stressed Lepidium sativum L. S. Afr. J. Bot. 2020, 129, 341–346. [Google Scholar] [CrossRef]
  40. Abbas, S.; Zaglool, M.; El-Ghadban, E.; Abd El-Kareem, S.; Waly, A. Effect of Moringa Leaf Extract Spray on Sage (Salvia officinalis L.) Plant under Sandy Soil Conditions. Hortsci. J. Suez Canal Univ. 2016, 5, 15–21. [Google Scholar] [CrossRef] [Green Version]
  41. Drouet, S.; Tungmunnithum, D.; Lainé, É.; Hano, C. Gene Expression Analysis and Metabolite Profiling of Silymarin Biosynthesis during Milk Thistle (Silybum marianum (L.) Gaertn.) Fruit Ripening. Int. J. Mol. Sci. 2020, 21, 4730. [Google Scholar] [CrossRef]
  42. Elwekeel, A.; Elfishawy, A.; Abouzid, S. Silymarin Content in Silybum marianum Fruits at Different Maturity Stages. J. Med. Plant Res. 2013, 7, 1665–1669. [Google Scholar] [CrossRef]
  43. Torres, M.; Corchete, P. Gene Expression and Flavonolignan Production in Fruits and Cell Cultures of Silybum marianum. J. Plant Physiol. 2016, 192, 111–117. [Google Scholar] [CrossRef] [PubMed]
Figure 1. The fold expressions of chalcone synthase (CHS) genes in relation to total methanolic extract (A) and silybin (A + B) composition (B). The expressions of CHS1, CHS2, and CHS3 for control salinity, without MLE foliar spray (C-0), were normalized as 1. The expressions of the CHS genes for all other treatments (C-5, C-10, 2000-0, 2000-5, 2000-10, 4000-0, 4000-5, and 4000-10) were expressed as fold expressions with respect to the expressions of corresponding genes for C-0 treatment. The amount of methanolic extract was expressed as grams of extract per 100 g of fruit by dry weight, while the silybin composition was measured using high-performance liquid chromatography (HPLC) and expressed as milligrams of silybin (A + B) per gram of methanolic extract. The +/− bar on the graphs represents the standard error of the corresponding measurement.
Agronomy 11 02500 g001
Table 1. Chemical composition of Moringa oleifera leaves.
ChemicalAmountUnit
Calcium440mg/100 g
Copper0.07mg/100 g
Iron0.85mg/100 g
Magnesium42mg/100 g
Phosphorus70mg/100 g
Potassium259mg/100 g
Zinc0.16mg/100 g
Protein6.70g/100 g
Fat1.70g/100 g
Carbohydrate12.5g/100 g
Arginine406.6mg/100 g
Histidine149.8mg/100 g
Isoleucine299.6mg/100 g
Leucine492.2mg/100 g
Lysine342.4mg/100 g
Methionine117.7mg/100 g
Phenylalanine310.3mg/100 g
Threonine117.7mg/100 g
Tryptophan107mg/100 g
Valine374.5mg/100 g
Vitamin A6.78mg/100 g
Vitamin B10.06mg/100 g
Vitamin B20.05mg/100 g
Vitamin B30.8mg/100 g
Vitamin C220mg/100 g
Gibberellin5.4mg/100 g
Zeatin3.0mg/100 g
Indole acetic acid (IAA) 0.52mg/100 g
Total polyphenol28.05mg/g
Total flavonoid80mg/g
Total tocopherol5μg/g
Total rutin0.27810mg/g
Total gallic acid0.12786mg/g
Table 2. Chemical properties and compositions of the irrigation water.
Salinity Level (ppm) Cations (meq/L)Anions (meq/L)SAR
Ca2+Mg2+Na+K+CO32−HCO3SO42−Cl
8645.722.027.270.380.282.684.038.43.43
Table 3. Sequences of forward and reverse primers for real-time RT-PCR.
GenePrimer’s SequenceAmplicon Length (bp)GenBank Accession Number
Chalcone synthase1
(CHS1)
CHS1F 5-TCTTGATTCCCTCGTTGGTC-3
CHS1R 5-TCTCAAACAACGGCCTCTCT-3
101JN182805.1
Chalcone synthase2
(CHS2)
CHS2F 5-AGGACATTGCGGAAAACAAC-3
CHS2R 5-AACGGCCTCTCTGTCTTCAA-3
184JN182806.1
Chalcone synthase3
(CHS3)
CHS3F 5-ACCCACCTCATCTTTTGCAC-3
CHS3R 5--CATCATGAGGCGTTTGATTG-3
105JN182807.1
NADHndhchs_L 5-TTCCGCATTTTGGAAATACC-3
ndhchs_R 5-CCCGTCTTGATTGAAAGGAA-3
134KC589999.1
Table 4. Effects of salinity levels; Moringa oleifera leaf extract (MLE) concentrations; and their interactions on plant height (cm), number of leaves (n), number of branches (n), root dry weight (g), and aerial part dry weight of S. marianum plants during the 2018 and 2019 planting seasons.
TreatmentPlant Height (cm)No. of Leaves (n)No. of Branches (n)Root Dry Weight (g)Aerial Part Dry Weight (g)
Salinity
(ppm)
MLE
(g/L)
Season
(2018)
Season
(2019)
Season
(2018)
Season
(2019)
Season
(2018)
Season
(2019)
Season
(2018)
Season
(2019)
Season
(2018)
Season
(2019)
(a) Main effect salinity
Control 62.3 a *66.9 a60.9 a64.2 a19.4 a20.7 a6.2 a4.8 a66.1 a79.6 a
2000 43.5 b48.8 b39.6 b39.5 b12.4 b12.9 b2.3 b2.9 b33.6 b36.4 b
4000 24.7 c25.9 c24.6 c22.1 c7.8 c7.7 c1.2 c0.9 c13.4 c14.2 c
(b) Main effect of MLE
Control39.1 b47.9 a38.1 a30.5 b11.7 a11.6 b3.8 a3.7 a34.3 a46.9 ab
542.7 ab48.6 a42.1 a42.1 b14.0 a16.9 a3.1 a2.3 b36.2 a40.7 b
1048.8 a51.1 a44.6 a51.0 a13.8 a14.7 ab2.8 a3.1 ab42.8 a51.9 a
(c) Interacting effects of salinity and MLE
Control41.7 bc62.0 abc45.3 b54.5 b13 bc15.5 b6.2 a5.1 ab41.4 b76.3 b
Control570.3 a73.0 a66.7 a60.0 b24.7 a24.5 a6.6 a3.4 bc68.9 b65.2 b
1075.0 a65.8 ab70.7 a79.0a20.7 a22.0 a5.9 a5.8 a87.9 a97.3 a
Control52.3 b55.0 bcd44.3 b40.3 c14.3 b16.7 bc3.1 b4.3 abc40.8 c40.9 c
2000535.0 cd42.3 de36.8 b38.3 c11.8 b11.3 bcd2.1 bc2.3 cd32.2 cd31.5 cde
1046.0 b49.0 cd38.7 b39.8 c11.3 bcd12.8 bcd1.9 bc2.3 cd28.1 cd36.6 cd
Control23.3 e27.7 ef24.3 c20.7 d7.7 de7.5 d2.0 bc1.3 d8.7 e13.6 e
4000525.3 de22.3 f24.5 c21.3 d6.3 e6.7 d0.8 c0.7 d20.6 de17.2 de
1025.1 de27.9 ef24.8 c24.3 d9.3 cde9.0 cd0.7 c0.7 d12.3 e11.8 e
* Means followed by the same letter within a column are not significantly different at the 0.05 level of probability according to the L.S.D. test.
Table 5. Effects of salinity levels, Moringa oleifera leaf extract (MLE) concentrations, and their interactions on S. marianum capitula number (n) and fruit dry weight (g) during the 2018 and 2019 planting seasons.
TreatmentCapitula Number (n)Fruit Dry Weight (g)
Salinity (ppm)MLE
(g/L)
Season
(2018)
Season
(2019)
Season
(2018)
Season
(2019)
(a) Main effect of salinity
Control 18.3 a *14.3 a38.8 a41.8 a
2000 17.6 ab14.2 a23.5 b24.4 b
4000 9.0 b12.9 a9.3 c4.5 c
(b) Main effect of MLE
Control14.3 a11.7 b22.6 a33.9 a
514.8 a12.1 b25.7 a20.9 b
1017.9 a16.9 a23.2 a25.8 b
(c) Interacting effects of salinity and MLE
control16.3 abc13.7 ab28.4 c52.9 a
control519.0 ab11.0 b49.4 a31.1 bc
1021.5 a17.7 a38.9 b41.4 b
control14.3 abc11.7 ab28.0 c28.7 c
2000516.0 abc13 ab22.1 c21.3 cd
1021.0 a16.7 ab20.9 c23.6 cd
control12.3 bc10.3 b11.7 d13.8 de
400059.0 c12.5 ab6.5 d6.8 e
1011.3 bc10.0 b9.8 d7.8 e
* Means followed by the same letter within a column are not significantly different at the 0.05 level of probability according to the L.S.D. test.
Table 6. Effects of salinity levels, Moringa oleifera leaf extract (MLE) concentrations, and their interactions on the compositions (mg/100 g fresh weight of leaves) of chlorophyll a (Chl a), chlorophyll b (Chl b), and carotenoids in S. marianum leaf samples during the 2018 and 2019 planting seasons.
TreatmentChl a
(mg/100 g F.W.)
Chl b
(mg/100 g F.W.)
Carotenoids
(mg/100 g F.W.)
Salinity (ppm)MLE (g/L)Season (2018)Season (2019)Season (2018)Season (2019)Season (2018)Season (2019)
(a) Main effect of salinity
Control 89.69 a *92.46 a24.41 a26.20 a85.46 a89.05 a
2000 86.94 a93.10 a23.35 a25.28 a86.42a91.47 a
4000 87.53 a86.72 a23.52 a23.37 a87.38 a87.23 a
(b) Main effect of MLE
Control94.44 a92.97 a25.47 a25.03 a91.56 a91.15 a
586.70 a86.66 a23.38 a23.81 a86.29 a86.94 a
1083.02 a92.65 a22.43 a26.00 a81.40 a89.67 a
(c) Interacting effects of salinity and MLE
Control109.96 a93.93 a29.57 a26.30 a85.02 ab89.62 a
Control589.26 ab93.14 a24.18 ab27.08 a84.90 ab91.99 a
1069.86 b90.32 a19.27 b25.21 a67.17 b85.53 a
Control87.76 ab104.12 a23.52 ab27.98 a90.31 a101.67 a
2000579.27 b77.52 a21.12 ab19.82 a81.41 ab78.12 a
1093.79 ab97.65 a25.41 ab28.03 a92.47 a94.63 a
Control85.59 ab80.86 a23.32 ab20.81 a85.37 ab85.53 a
4000591.58 ab89.32 a24.83 ab24.54 a92.54 ab90.62 a
1085.42 ab89.99 a22.39 ab24.78 a84.58 ab88.85 a
* Means followed by the same letter within a column are not significantly different at the 0.05 level of probability according to the L.S.D. test.
Table 7. Effects of salinity levels, Moringa oleifera leaf extract (MLE) concentrations, and their interactions on the percentages of sodium (% Na+) and potassium (% K+) in S. marianum leave samples during the 2018 and 2019 planting seasons.
Treatment% Na+% K+
Salinity
(ppm)
MLE
(g/L)
Season
(2018)
Season
(2019)
Season
(2018)
Season
(2019)
(a) Main effect of salinity
Control 0.212 c *0.187 c1.139 a0.975 a
2000 0.329 b0.389 b0.696 b0.608 b
4000 0.538 a0.532 a0.420 c0.440 c
(b) Main effect of MLE
Control0.334 b 0.372 a0.880 a0.663 a
50.394 a0.360 a0.673 b0.673 a
100.351 b0.376 a0.703 b0.686 a
(c) Interacting effects of salinity and MLE
Control0.216 c0.179 d1.488 a1.103 a
Control50.244 c0.223 d0.818 c0.828 b
100.176 c0.158 d1.113 b0.995 a
Control0.222 c0.404 c0.759 cd0.483 cd
200050.411 b0.366 c0.739 cd0.759 b
100.355 b0.399 c0.591 de0.581 c
Control0.561 a0.571 a0.394 f0.404 d
400050.528 a0.493 b0.463 ef0.433 d
100.520 a0.532 ab0.404 ef0.483 cd
* Means followed by the same letter within a column are not significantly different at the 0.05 level of probability according to the L.S.D. test.
Table 8. Effects of the interactions of salinity levels and Moringa oleifera leaf extract (MLE) concentrations on the total amount of methanolic extracts (grams per 100 g of fruits in dry weight) and silybin (A + B) compositions (milligrams per gram of extract) from S. marianum fruit samples during the 2018 planting season.
TreatmentTotal Methanolic
Extract (g/100 g D.W.)
Silybin (A + B)
Composition (mg/g Extract)
Salinity (ppm)MLE (g/L)
ControlControl13.421 d *1.056 a
513.910 d2.262 cd
1012.560 cd1.796 bc
2000Control23.614 a1.578 d
521.960 b1.444 c
1018.620 bc1.279 b
4000Control21.240 b1.119 b
521.261 b1.148 b
20.790 b0.926 a
* Means followed by the same letter within a column are not significantly different at the 0.05 level of probability according to the L.S.D. test.
Publisher’s Note: MDPI stays neutral with regard to jurisdictional claims in published maps and institutional affiliations.

