Article

Combined Fertilization Could Increase Crop Productivity and Reduce Greenhouse Gas Intensity through Carbon Sequestration under Rice-Wheat Rotation

1
Institution of Plant Nutrition and Environmental Resources, Henan Academy of Agricultural Sciences, Zhengzhou 450002, China
2
Institution of Agricultural Resources and Regional Planning, Chinese Academy of Agricultural Sciences, Beijing 100081, China
3
College of Forestry, Hebei Agricultural University, Baoding 071000, China
*
Author to whom correspondence should be addressed.
Agronomy 2021, 11(12), 2540; https://doi.org/10.3390/agronomy11122540
Submission received: 30 September 2021 / Revised: 4 November 2021 / Accepted: 13 December 2021 / Published: 14 December 2021

Abstract

:
Quantifying greenhouse gas intensity (GHGI) and soil carbon sequestration is a method to assess the mitigation potential of agricultural activities. However, the effects of different fertilizer amendments on soil carbon sequestration and net GHGI in a rice-wheat cropping system are poorly understood. Here, fertilizer treatments including PK (P and K fertilizers); NPK (N, P and K fertilizers), NPK + OM (NPK plus manure), NPK + SR (NPK plus straw returning), and NPK + CR (NPK plus controlled-release fertilizer) with equal N input were conducted to gain insight into the change of soil organic carbon (SOC) derived from the net ecosystem carbon budget (NECB), net global warming potential (GWP), and GHGI under rice-wheat rotation. Results showed that compared with NPK treatment, NPK + OM significantly increased wheat yield and NPK + SR caused significant increase in rice yield. Meanwhile, NPK + SR and NPK + CR treatments reduced net GWP by 30.80% and 21.83%, GHGI by 36.84% and 28.07%, respectively, which suggested that improved grain production could be achieved without sacrificing the environment. With the greatest C sequestration, lowest GHGI, the NPK plus straw returning practices (NPK + SR) might be the best strategy to mitigate net GWP and improve grain yield and NUE in the current rice-wheat rotation system.

1. Introduction

Atmospheric carbon dioxide (CO2), methane (CH4), and nitrous oxide (N2O) are potent and major long-lived greenhouse gases (GHGs) because of their strong radiative forcing. Agricultural activities have been considered as one of the contributors to GHG emissions and accounted for approximately 25% of total global anthropogenic emissions of GHGs which was estimated to be 5.1–6.1 Pg CO2-equivalents [1,2]. Furthermore, the global warming potential (GWP) of CH4 and N2O are almost 28 and 265 times greater, respectively, than CO2 over a 100-year scale [3]. However, net GHG emission from those activities could potentially be reduced by increasing soil organic carbon (SOC) storage and/or decreasing CH4 and N2O emissions with improved farm practices, such as various fertilizer amendments in agricultural lands [4,5].
Rice–wheat rotation systems play an important role in South Asia and China, constituting ~13 million hectares in South Asia and ~4.5 million hectares along the Yangtze River valley in China [6]. This type of crop rotation, providing a stable source of food for more than 20% of the world’s population, is crucial for ensuring regional and even global food security [7]. China is the largest fertilizer consumer, and large amounts of chemical N fertilizer have been applied to increase cereal grain production with total input of more than 600 kg N ha−1 yr−1 to soils under rice–wheat rotation systems [8,9]. However, the excessive use of synthetic N fertilizers and low nitrogen use efficiency (NUE) in the intensive agricultural region of China has resulted in serious environmental problems, such as soil degradation and GHG emissions [10]. Accordingly, it is important to explore the suitable N managements to guide farmers to select the appropriate fertilizers practices in improving N use efficiency, crop productivity and minimizing the negative impact on environmental quality.
Organic-based fertilizers (e.g., NPK plus manure, NPK plus straw) could fairly meet plant requirements and improve fertilizer-use efficiency, which subsequently contributed to the improvement of grain yield, soil fertility and the mitigation of GHGs [11]. Carbon stock can be increased via appropriate cultivation practices and extra C input (e.g., manure or crop residue incorporation) [12]. The application of organic fertilizers (manure or crop residues) has always been reported to be feasible to sequester carbon from the atmosphere, improve soil fertility, and enhance crop yield [13,14,15,16]. At the same time, the worldwide use of organic incorporation has drawn frequent criticism mostly because of its acceleration of GHG emissions and whether increased GHG emissions can be offset by soil carbon sequestration [17]. So it is imperative to find optimized organic incorporation strategies to achieve maximum yield with minimum costs and ecological risk, especially those regarding such emissions. Meanwhile, using controlled-release fertilizer also has been widely proposed as effective GHG mitigation alternative option. Numerous literatures have indicated the potential of controlled-release fertilizer to reduce N loss from leaching as NO3, volatilization as NH3, and emission as N2O [18,19]. The third assessment report from IPCC considered controlled-release fertilizer application might reduce N2O emissions by 30% and potential N2O mitigation was estimated at 0.07 t CO2-eq ha−1 yr−1 globally [20]. However, most studies only focused on controlled-release fertilizer effects on nitrogen use efficiency, crop yield and mitigation of N2O emissions, but fewer considered their effects on overall GHGs and C sequestration. In general, the application of f manures or straw and fertilizer could increase soil microbial biomass and activities which seemed to be a practical and effective way to improve soil fertility, enhance yield and mitigate GHG emissions. Thus, we hypothesized that organic amendments (e.g., manure or crop residue) would both increase soil C sequestration, offsetting the potential effects of additional emissions of CO2 equivalents. Nevertheless, few studies have been conducted to simultaneously evaluate the comprehensive impact of different fertilizers on crop productivity, SOC sequestration and greenhouse gas emissions.
In general, detecting change in SOC stocks is difficult due to the difficulty in observing a minor change against a large background in SOC and great spatial variability in SOC stocks [21]. Smith et al. [22] reported that the NECB approach is a precise tool to estimate soil carbon balance between C gains and losses, and can essentially provide a simplified, chamber-based technique for the development of carbon sequestration strategies on the crop seasonal time scale, which is particularly important for newly established field trials [23,24]. Greenhouse gas intensity (GHGI) is considered as a potential barometer comparing the impact of agricultural practices for crop productivity on global warming [3]. Considering these conditions, simultaneous measurements of ecosystem respiration, CH4, and N2O emissions were done in a rice-wheat rotation field experiment along the Yangtze River from 2013–2014. The objectives of this study were to: (i) quantify the effects of combined application of manure, straw and controlled-release fertilizer on GHG emissions, grain yield, NECB, SOC change using the adapted approach and (ii) to evaluate the impact of these strategies on net global warming potential (GWP) and greenhouse gas intensity (GHGI).

2. Materials and Methods

2.1. Experimental Design

The experiment was located in Jingmen (30°53′37″ N, 112°48′18″ E), Hubei province, China, where rice-wheat rotation is the common cropping regime. The tested yellow-brown paddy soil is classified as Udalfs with clay loam texture (USDA soil classification). The region is located in the northern subtropical to middle subtropical transitional geographic climate zone with an altitude of 30 m, annual precipitation of 1085 mm, sunshine of 1971 h, and frost-free period of 251 days. At the start of the experiment, soil at 0–20 cm depth has a pH (H2O) of 5.88, organic carbon of 18.91 g kg−1, total nitrogen of 1.95 g kg−1, available phosphorus (P) and potassium (K) of 17.26 and 108.47 mg kg−1 and cation exchange capacity of 12.60 cmol kg−1.
The experiment included winter wheat and rice season, in which five treatments with three replicates (40 m2) were established in a completely randomized design from November 2013 to October 2014. The wheat (Triticum aestivum L.) cultivar of Ermai 596 and the rice (Oryza sativa L.) cultivar of Yuefeng 202 were adopted during the rice-wheat rotation. The fertilizer rates of different treatments and agronomic practice were listed in Table 1. Organic manure used in this study (C/N = 21.72) is commercial fertilizer consisted of a compost of pig manure and rice straw containing 1.86% N, 2.17% P2O5 0.59% K2O, and 22.3% water (Jiangsu Tianniang Agricultural Technology CO., LTD, Changshu, China). Wheat and rice straw were both obtained from the preceding seasons with C:N ratios of 87.20 and 77.40, respectively. The controlled-release fertilizer is a product of Shandong Kingenta Ecological Engineering CO., LTD, China, which is the thermoplastic resin-coated fertilizer containing 4% coated material, 42% N, 8% P2O5 and 10% K2O. Seeding rate, irrigation, pesticide management were consistent with local farmers.

2.2. Gas Sampling and Measurement

The ecosystem respiration (Re), CH4 and N2O fluxes were simultaneously measured in triplicate once a week throughout the wheat and rice crop season with static, opaque chamber [23]. Samples were collected more frequently after fertilizer application, precipitation events and during the mid-season drainage. The chamber made of PVC covered a field area of 0.30 m2 and was placed on a fixed stainless-steel frame on each plot. The top edge of each frame had a groove (5 cm in depth) for filling with water to seal the rim of the chamber. The chamber with 0.5 m or 1 m height was chosen according to crop growth and wrapped with a layer of sponge and aluminum foil to minimize air temperature changes inside the chamber. Gas samples were collected from 8:00 to 11:00 a.m. by a 50-mL syringe fitted with three-way stopcocks at 0, 5, 10, 15 and 20 min after chamber closure. The air temperature inside the chamber was monitored during gas collection.
Average fluxes and standard deviations of CH4, N2O and CO2 were calculated from triplicate plots. Seasonal amounts of CH4, N2O and Ecosystem respiration (Re: measured by a static, opaque chamber including the respiration of soil microorganisms and plants) emissions were sequentially accumulated from the emissions between every two adjacent intervals of the measurements. Three gas samples mentioned above were analyzed by a gas chromatograph (Agilent 7890A) equipped with an electron capture detector (ECD) and a flame ionization detector (FID). Procedures for simultaneously measuring three gas fluxes were given in detail in the previous studies [25].

2.3. Soil Sampling and Chemical Analysis

Soil samples (0–20 cm), consisting of five cores, were randomly collected from each plot at different growth stages (5 times during wheat season and at 4 times during rice season) using soil auger with 3.8 cm diameter and 20 cm height. The five sub-samples were mixed into one sample, representing each replicate of fertilizer treatments. The samples were immediately transported to the laboratory. Plants roots were removed by 2 mm sieving, and the samples were then stored at room temperature for chemical analysis, at 4 °C to analyze the NH4+-N, NO3-N, microbial biomass carbon (MBC) and microbial biomass nitrogen (MBN) content. Air temperature was monitored during each gas collection, using a portable digital thermometer (TP3001, CEM Instrument Co. Ltd., Shenyang, China). Grain and straw yield of rice and wheat were dried and weighed after the physiological maturity.
Ammonium N (NH4+-N) and nitrate N (NO3-N) contents were extracted with 1M KCl solution (dry soil: KCl = 1:5) for 1 h, and NH4+-N and NO3-N concentrations were determined by flow injection autoanalyzer (FLA star 5000 Analyzer, Foss, Denmark) [26]. Microbial biomass carbon and nitrogen were tested with chloroform fumigation following the procedure of Wu et al. [27] and Brookes et al. [28].

2.4. Calculation of Components for SOC Change and NECB of Croplands

Net ecosystem carbon budget (NECB) was calculated using the equations [29] as follows:
NECB = GPP − Re − Harvest − CH4 + Manure
NPP/GPP = 0.58
NPP = NPPgrain + NPPstraw + NPProot + NPPlitter + NPPrhizodeposit
SOC change = 0.213 × NECB
where GPP is gross primary production (kg C ha−1) inferred via the NPP/GPP ratio method [30], and Re is ecosystem respiration measured using the static, opaque chamber method [23]. Manure was applied as organic manure for NPK + OM treatment and straw return for NPK + SR treatment. Harvest was calculated following Huang et al. [31] which includes the grain and straw yield converted to carbon by carbon contents of 0.39 and 0.38 for wheat and rice grain, respectively, and 0.49 and 0.42 for wheat and rice straw, respectively. For NPP (net primary production) calculation, the grain and straw NPP is measured using the dry biomass weight at harvest. Root NPP is estimated by aboveground/root ratio of 0.9/0.1 for wheat and 1.0/0.1 for rice [31]. Litter accounts for 5% of the aboveground and root dry biomass, and rhizodeposits account for 18% and 15% of the total biomass for wheat and rice, respectively [32,33]. The apparent average efficiency of NECB to SOC change was reported to be 0.213 under rice-wheat rotation [23].
To understand an accounting of the climate impact of rice-wheat system under different fertilization management completely, the IPCC factors were adopted to estimate the net global warming potential (GWP) for 100 years [3].
Net GWP = 28 × CH4 + 265 × N2O − 44/12 × SOC change (kg CO2 eq ha−1)
where the factor of 28 and 265 are respectively the warming forces of CH4 and N2O based on 100 years. Factor 44 is the molecular weight of CO2 and 12 is the molecular weight of C in CO2.
Thereafter, the GHGI is related with GWP and grain yield, as calculated in Shang et al. [34]:
GHGI = net GWP/grain yield (kg CO2 eq kg−1 grain yield)

2.5. Calculation of Nitrogen Use Efficacy (NUE)

NUE was determined based on the N uptake and N fertilizer application rate [35]:
NUE (%) = (Nt − N0) ∗ 100%/FN
where Nt is the aboveground N uptake (kg ha−1) under fertilizer treatment and N0 is the aboveground N uptake (kg ha−1) under PK treatment. FN is the rate of N application (kg ha−1).

2.6. Statistical Analysis

One-way ANOVA analysis was used to detect the differences of seasonal CH4, N2O and CO2 emissions among treatments using Fisher’s least significant differences (LSD, p < 0.05). Linear Regression was applied to analyze the simple correlations between CO2, CH4 seasonal emissions with grain biomass. All statistical procedures were carried out with SAS 9.1.

3. Results

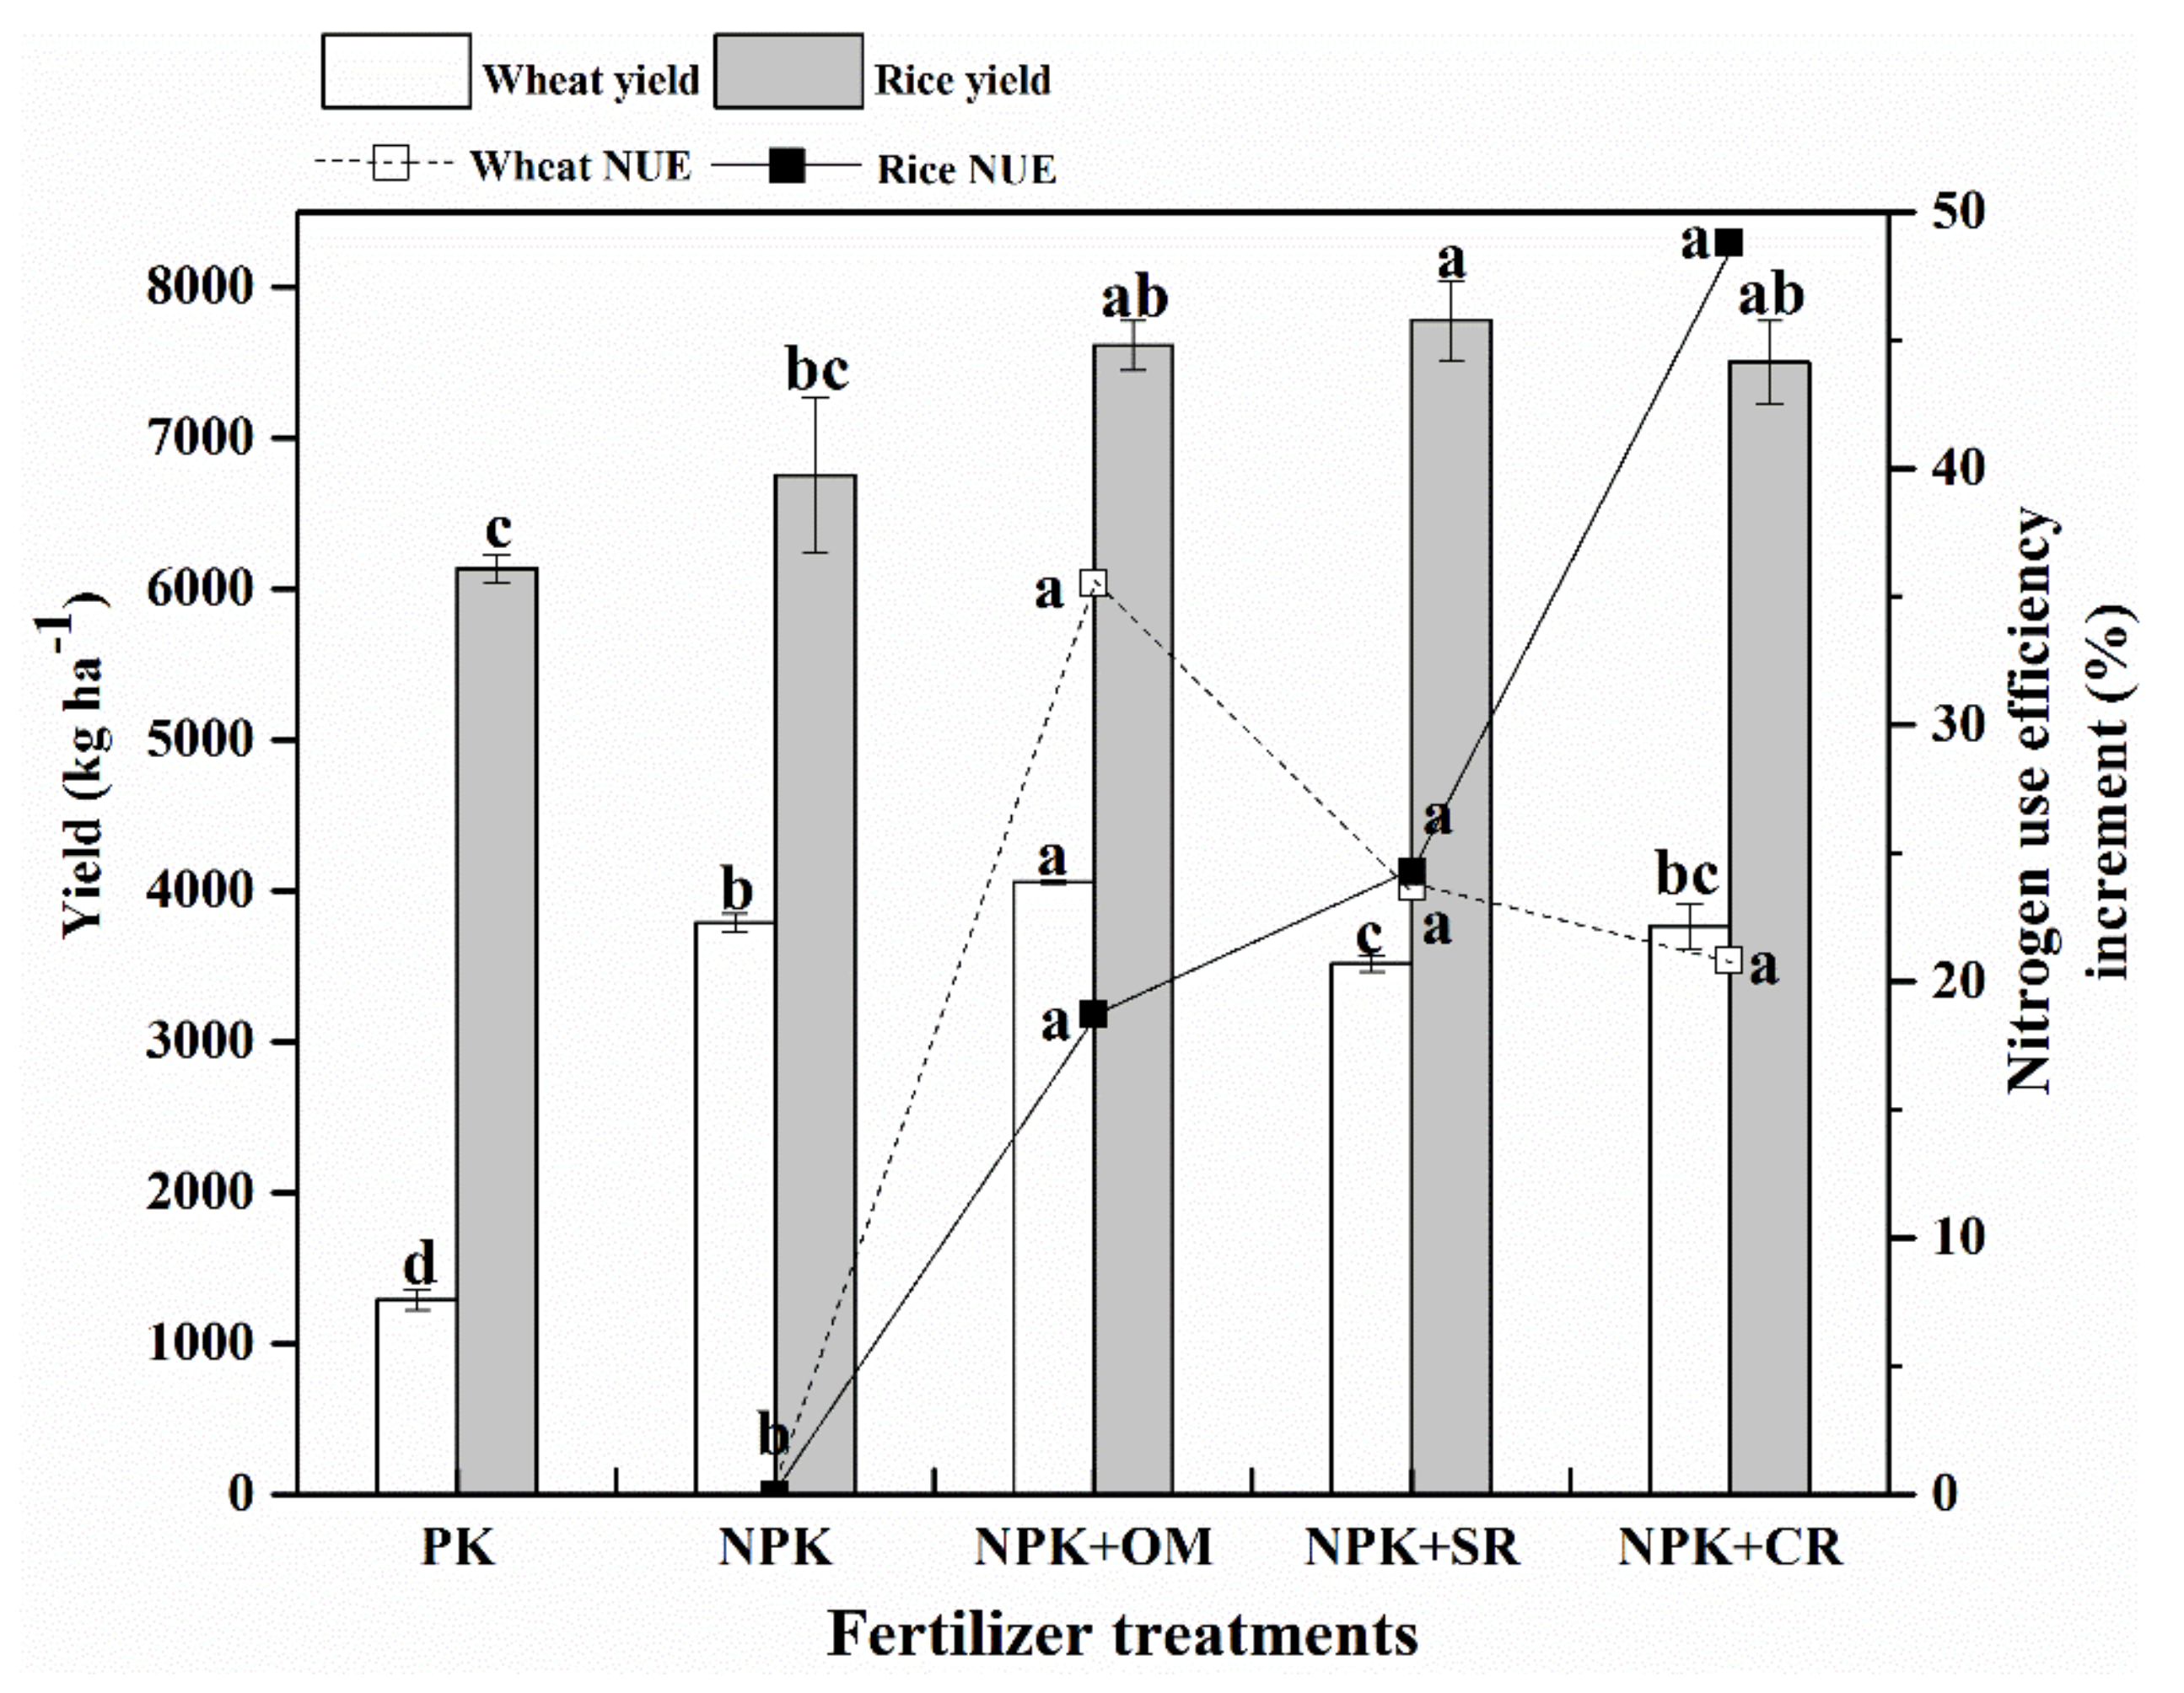
3.1. Grain Production and Agronomic Nitrogen Use Efficiency (NUE)

Over the annual rotation cycle, grain yields ranged from 1.3–4.1 t ha−1 for wheat and 6.1–7.8 t ha−1 for rice. NUE increments were from 20.8–35.5% for wheat and 18.7–48.8% for rice (Figure 1). Compared with PK treatment, the yield was significantly highest under manure treatment (NPK + OM) in wheat season and higher yield under straw returning treatment (NPK + SR) in rice season. However, yield did not show a significant difference under NPK + OM, NPK + SR and NPK + CR treatments in rice season. The NUE in wheat season significantly increased by 35.5%, 23.7% and 20.8% under NPK + OM, NPK + SR and NPK + CR treatments compared with NPK treatment (Figure 1). The NUE in rice season significantly increased by 18.7%, 24.3%, and 48.8% under NPK + OM, NPK + SR and NPK + CR treatments compared with NPK treatment (Figure 1).

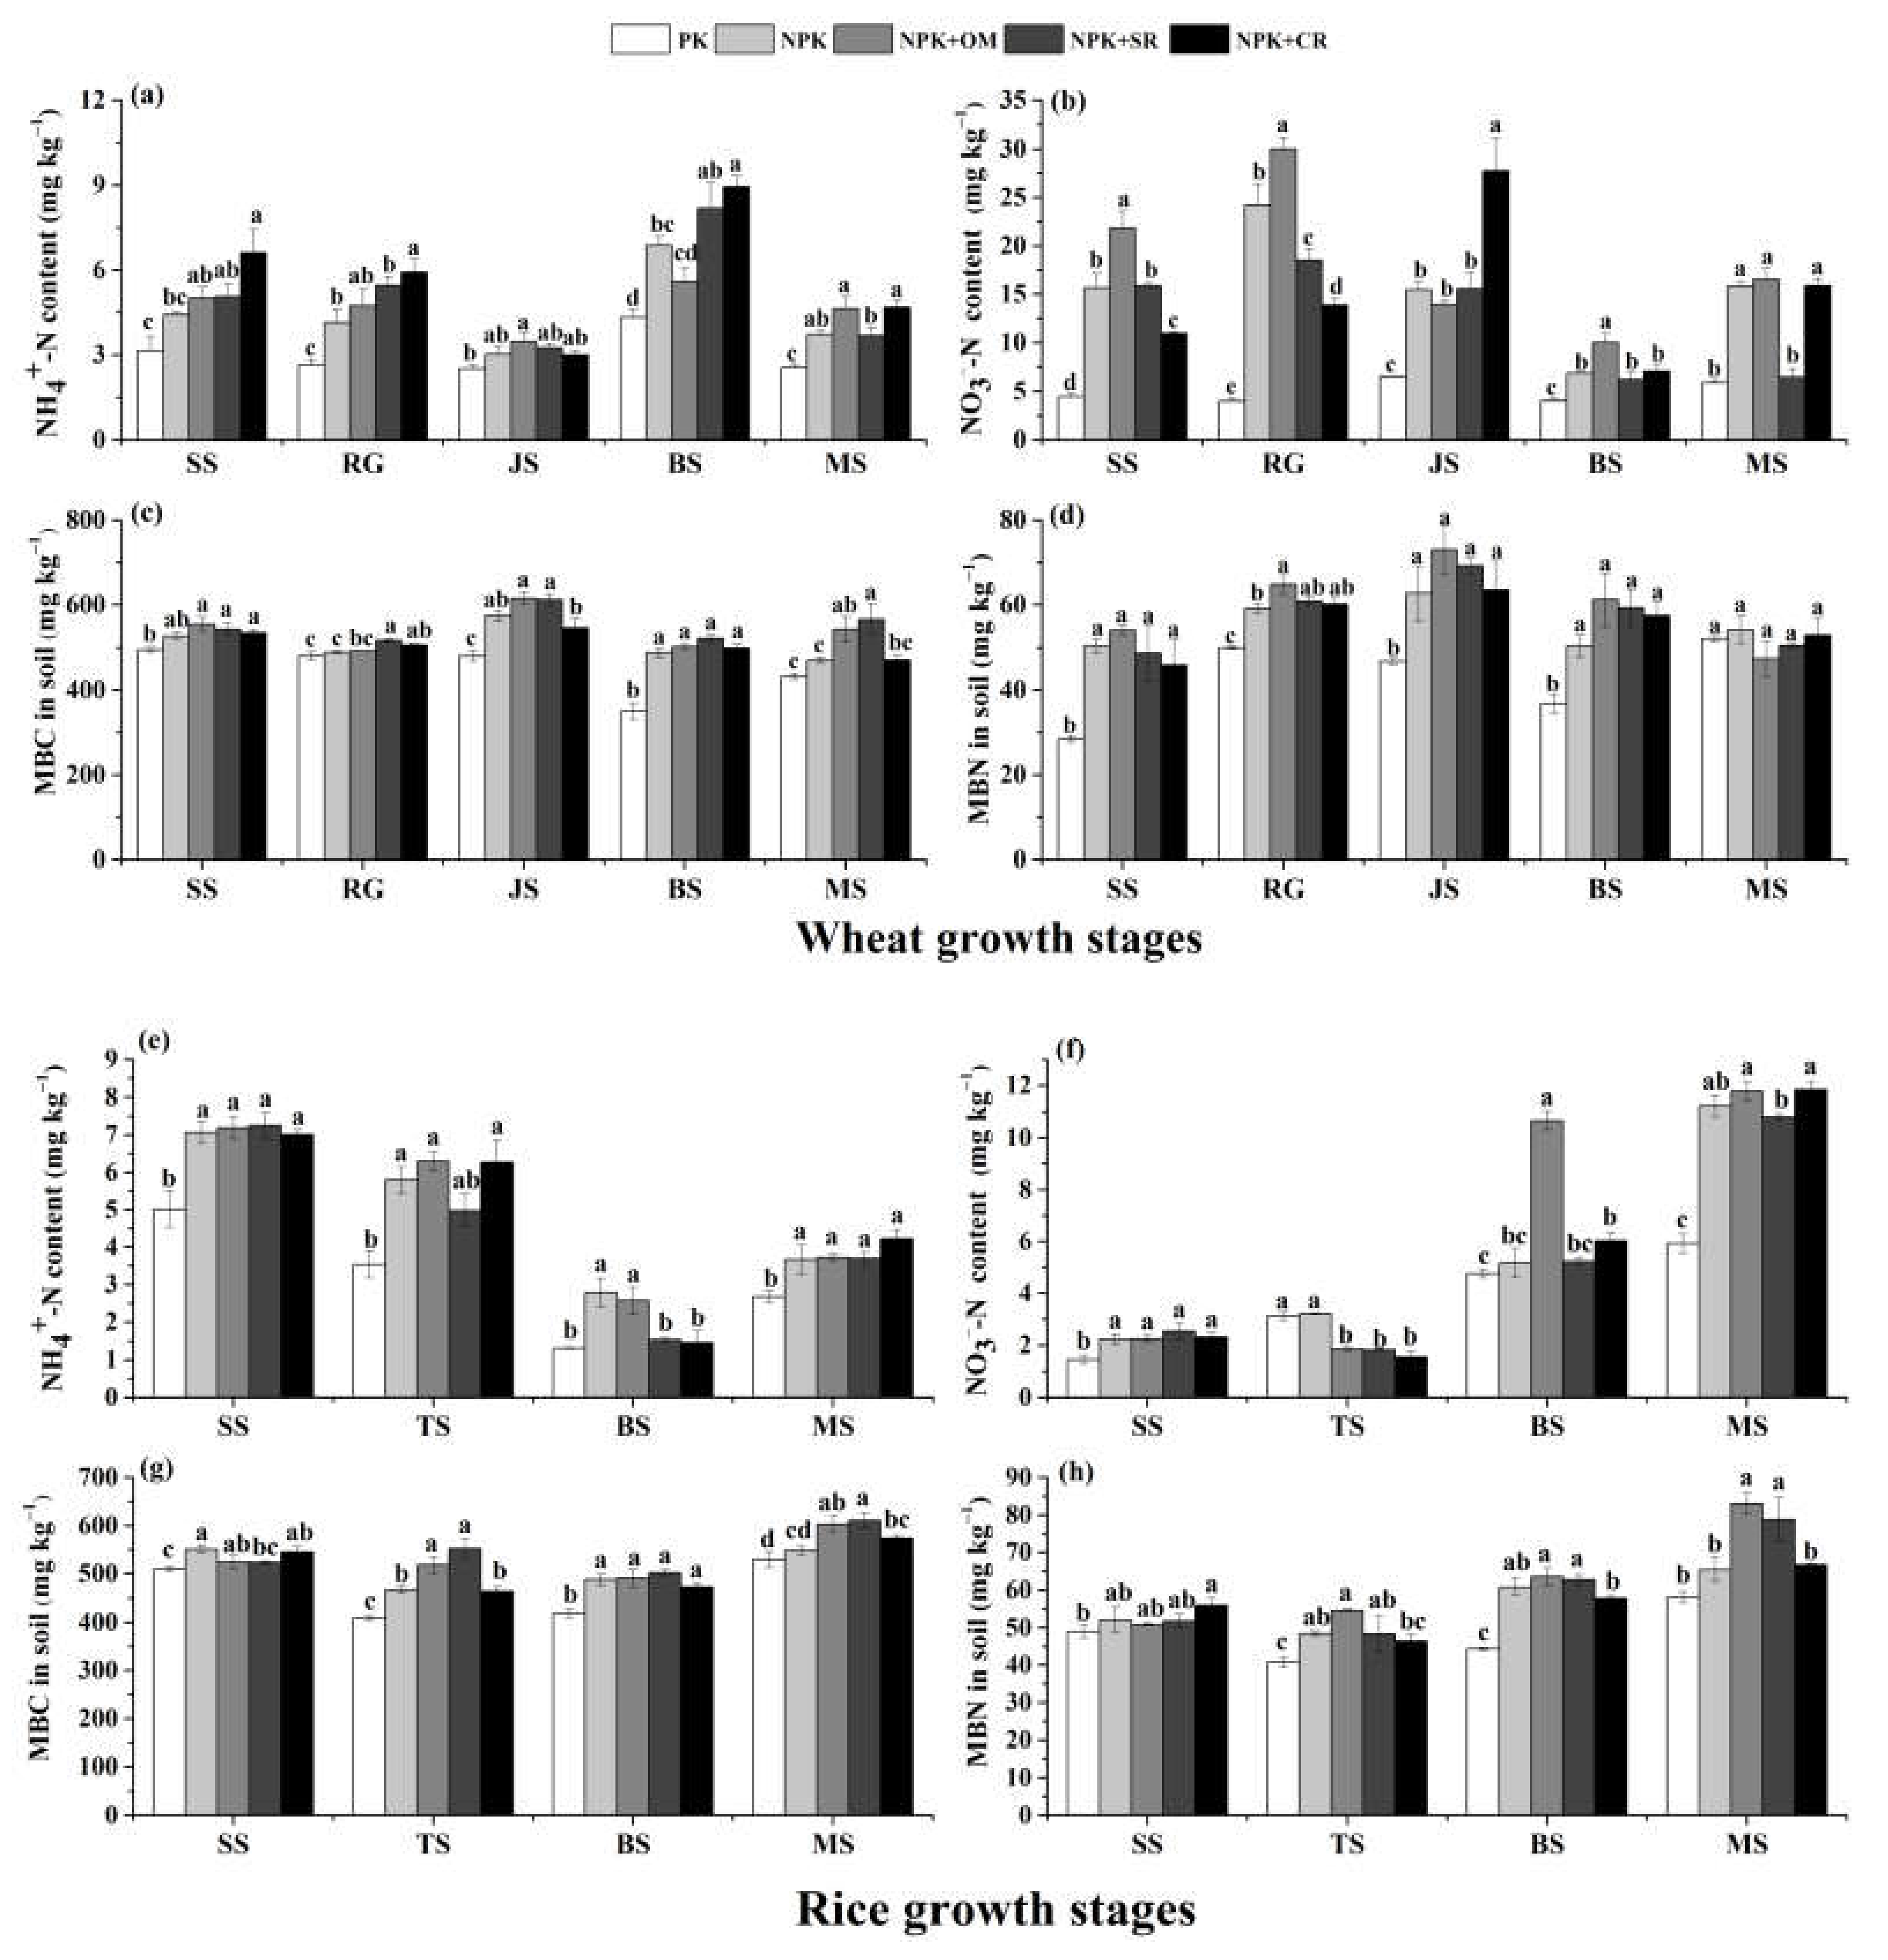
3.2. Soil Properties
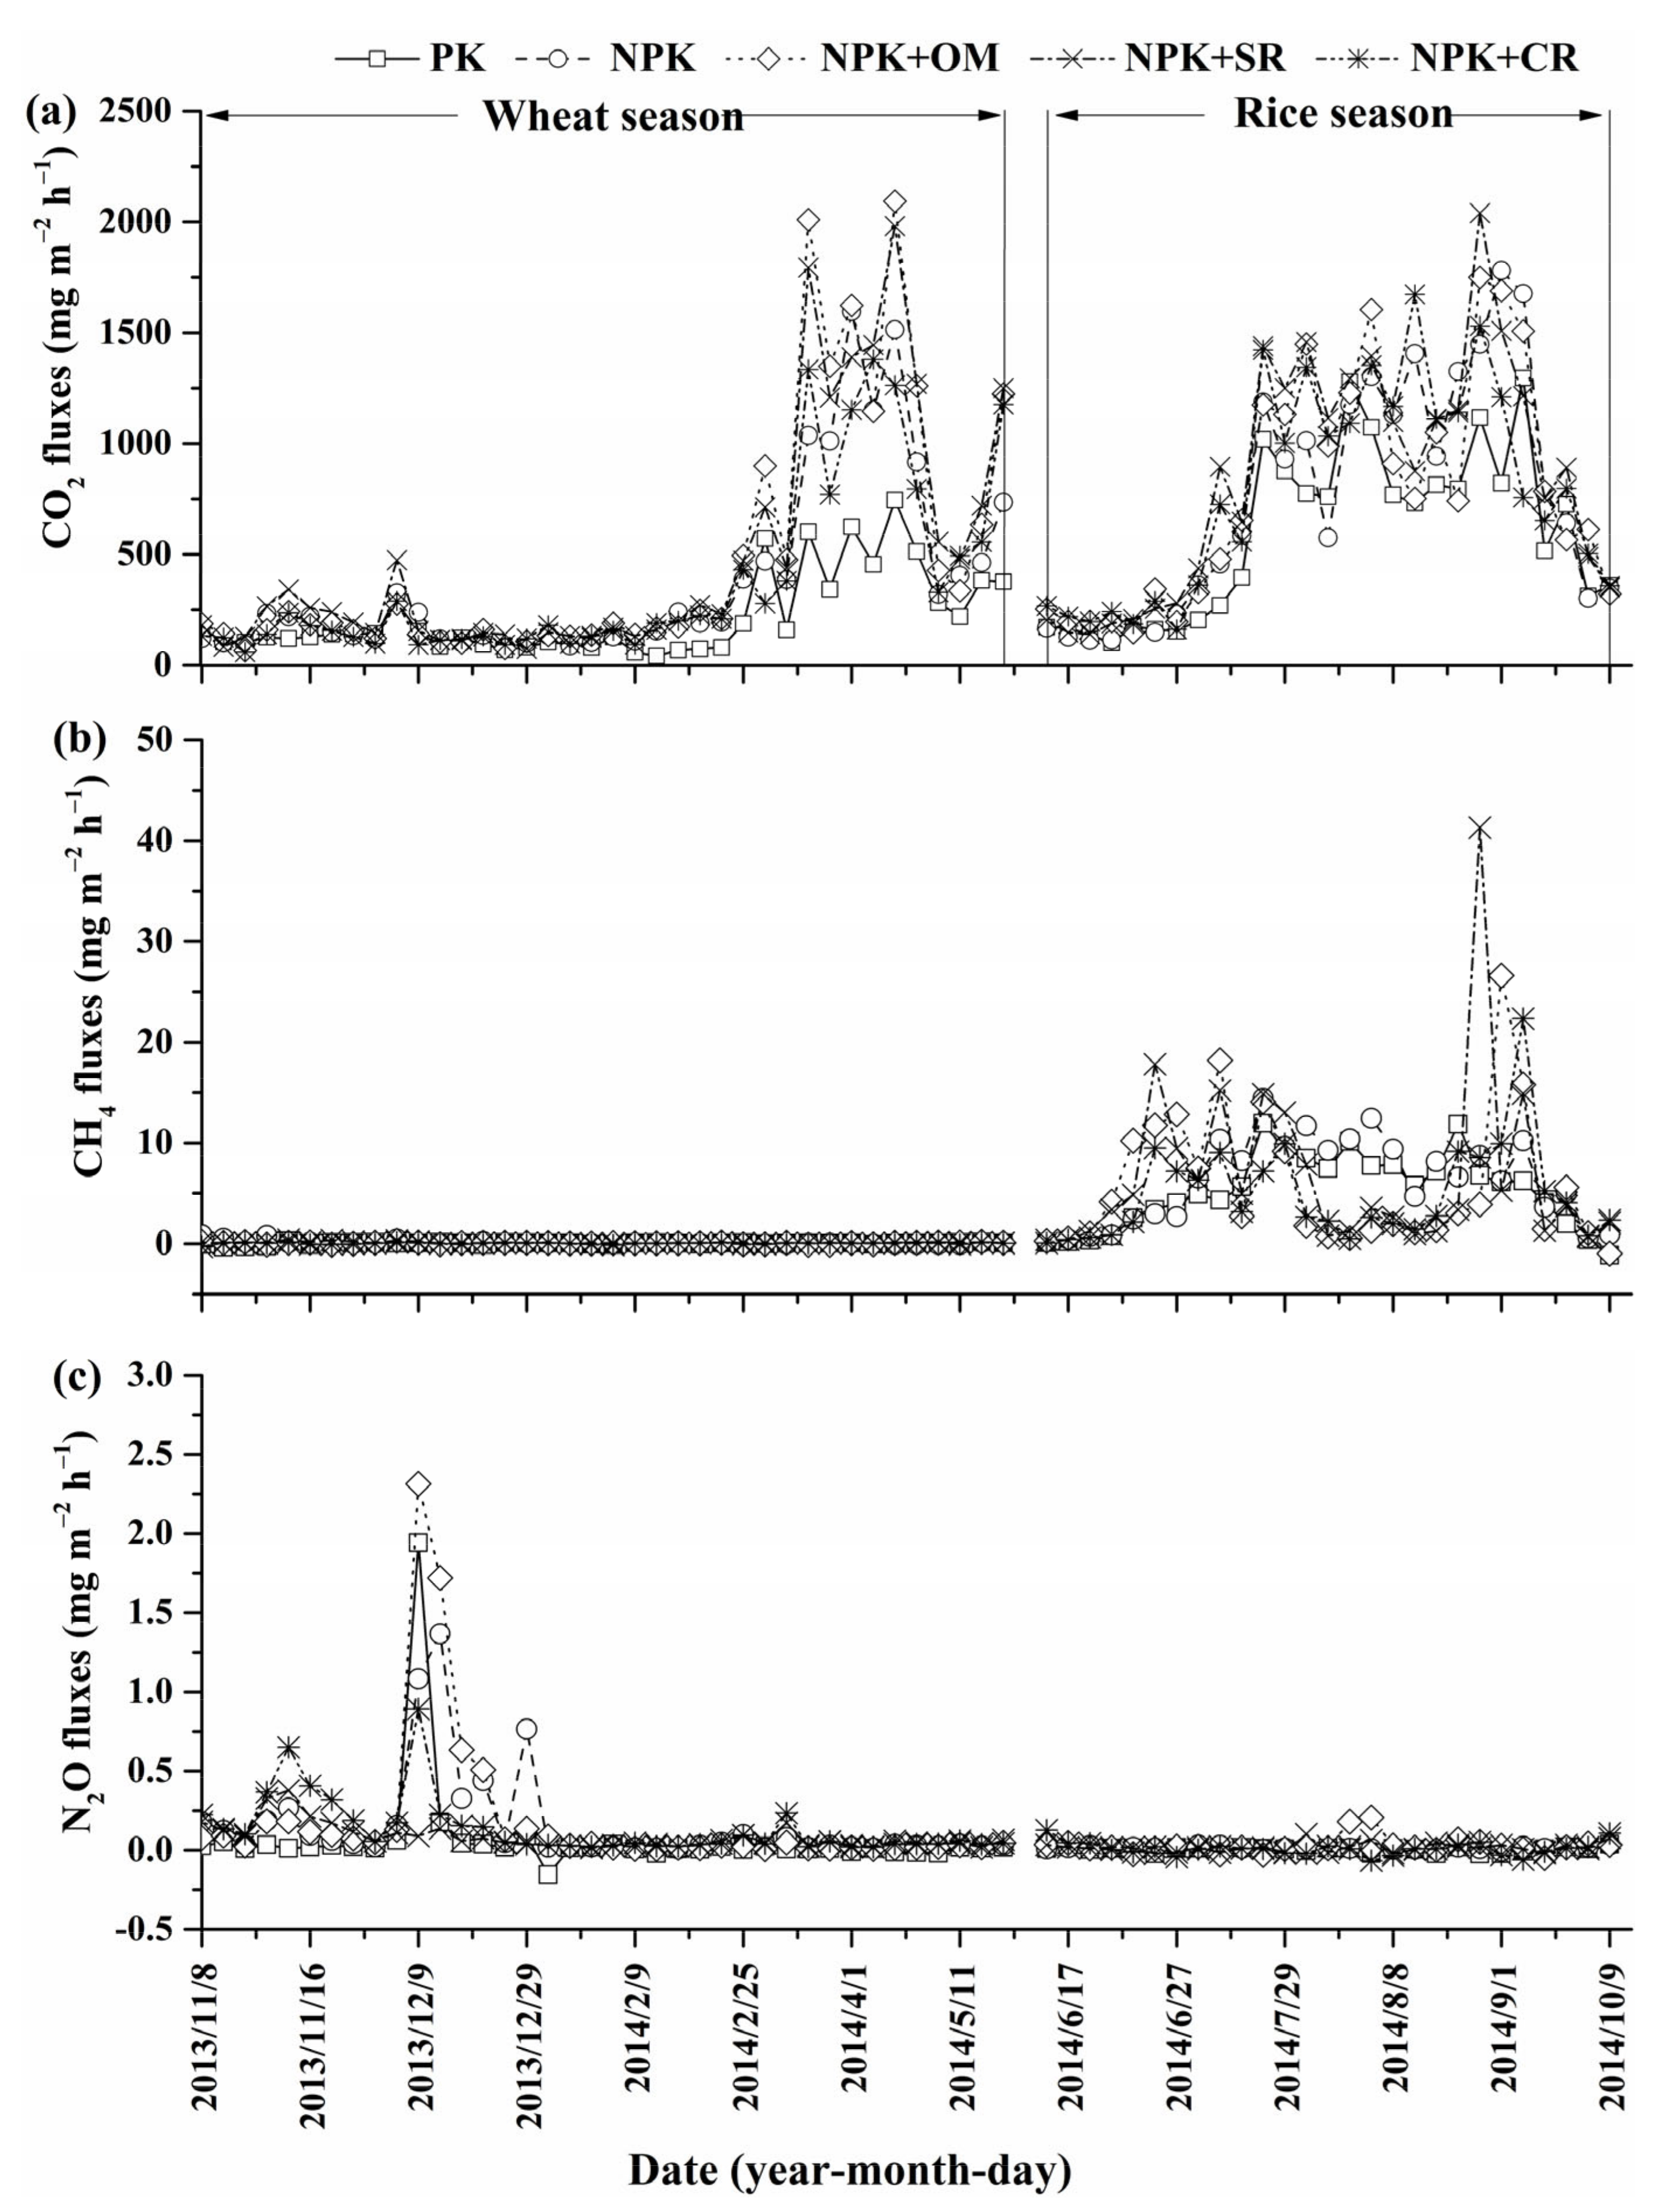
During the wheat season, soil NO3-N was the main form of soil inorganic N, and the average contents of NO3-N (between 4.98 and 18.47 mg kg−1) were much higher than those of NH4+-N, which were 3.04–5.83 mg kg−1 (Figure 2). Manure incorporation greatly increased soil NO3-N contents, particularly in the return green stage (spring green-up) (p < 0.05). During rice season, mean soil contents of NH4+-N (between 3.22 and 5.15 mg kg−1) were comparable to those of NO3-N (3.86–6.64 mg kg−1). Soil NH4+-N contents for all treatments were highest after basal fertilizer application, and then decreased steadily until rice harvest. Soil NO3-N contents showed the opposite trend, lowest in the seeding stage and increasing steadily until mature stage (Figure 2). Compared with PK, N-applied treatments markedly increased NO3-N contents (p < 0.05) during the wheat season and enhanced NH4+-N contents in rice season.
Mean contents of soil microbial biomass carbon (MBC) varied between 467.78 and 552.50 mg kg−1 in the wheat season and 469.30 and 546.94 mg kg−1 in rice season with no temporal variation between different cropping seasons (Figure 2). The difference in MBC content among treatments was mostly evident during the mature stage of wheat season and tillering stage of rice season which were generally higher under NPK + SR and NPK + OM treatments than the other treatments. Similar to MBC, soil microbial biomass nitrogen (MBN) contents exhibited a relatively small variation between treatments during the rice-wheat rotation. Mean contents of soil MBN varied between 46.90 and 60.14 mg kg−1 in wheat season and 48.04 and 63.03 mg kg−1 in rice season (Figure 2). The highest MBN content was mostly observed in soils under the NPK + OM treatment in both wheat and rice seasons.

3.3. GHG Emission

Ecosystem respiration (Re) measured by a static, opaque chamber includes the respiration of soil microorganisms and plants. The highest Re was 2.1 g m−2 h−1 in wheat season and 2.0 g m−2 h−1 in rice season under NPK + OM and NPK + SR treatments (Figure 3a). Unlike the fluxes of CH4 and N2O, Re remained positive during rice-wheat rotation. There was no obvious difference in CO2 emission between the wheat and rice seasons (Table 2). During those two seasons, the greatest cumulative CO2 emission was in NPK + SR plot (27.8 t ha−1 for wheat; 26.3 t ha−1 for rice), while the lowest was in the PK plot (12.3 t ha−1 for wheat; 17.8 t ha−1 for rice). Compared with NPK of wheat season, Re under NPK + OM and NPK + SR treatments increased by 28.7% and 29.7% dramatically. We found a significantly positive correlation between cumulative CO2 emission and wheat and rice biomass (p < 0.001) (Figure 4).
During the whole rice-wheat season, temporal dynamics of CH4 flux were not affected by fertilizer management but greatly varied with cropping season (Figure 3b). CH4 total fluxes were negligible during the wheat-growing season (1.59–4.53 kg C ha−1), but were considerable (149.30–239.25 kg C ha−1) when the field was waterlogged during the rice season (Table 2). Multiple peaks of CH4 emission were mainly in the seedling and stem elongation stages during the rice-growing season, and declined gradually toward harvest time. In comparison with PK, seasonal cumulative CH4 emission during the rice season increased averagely under the NPK, NPK + OM, NPK + SR and NPK + CR treatments by 23.2%, 41.4%, 60.2% and 18.9%, respectively.
Total seasonal N2O emissions for the five treatments were 0.22–5.69 kg ha−1 during the whole rotation, with large variations among the treatments and stages during wheat season and small variations during rice season (Figure 3c and Table 2). During the wheat season, cumulative N2O emissions of all treatments were 2.64–5.69 kg ha−1. Daily average emissions were consistently low except for some peaks at each plot within 1 week after fertilizer application. Seasonal total N2O emissions among the treatments in the rice-growing season were 0.22–0.56 kg ha−1, and there was no obvious flux peak throughout the season. Compared with NPK, seasonal cumulative N2O emission during the wheat-growing season was increased by 4.1% under NPK + OM treatment, but reduced by 99.7% and 39.1% under NPK + SR and NPK + CR treatments, respectively.

3.4. Net Ecosystem Carbon Budget (NECB) and Soil Organic Carbon (SOC) Change

Overall gas emissions in C-equivalent of Re, CH4 and N2O were negative under PK treatment and exceeded ecosystem production for the rice–wheat rotation (Table 3). A positive net ecosystem carbon budget (NECB) value represented ecosystem carbon gain on the crop seasonal scale in this experiment. NECBs of −2.60 to 3.84 t C ha−1 yr−1 were recorded over the entire rotation, in which all treatments except PK (the smallest NECB, at −2.60 t C ha−1 yr−1) produced larger positive NECB values, which ranged from 0.70 to 3.84 t C ha−1 yr−1 (averagely 1.92 t C ha−1 yr−1) (Table 3). Compared with PK, fertilizer application with NPK, NPK + OM and NPK + CR treatments did significantly increase NECB, but the difference among these three did not reach statistical significance. Meanwhile, NECB under NPK + SR was substantially highest which was even 5 times than NPK treatments (Table 3).
SOC change ranged from −0.06 to 0.82 t C ha−1 yr−1 under various fertilizers in the current rotation system annually (Table 3). A conversion of NECB to SOC change was adopted in this experiment, thus the pattern in SOC change was similar to that in NECB. Compared with NPK treatment, SOC rate was statistically higher in the three combined fertilizer treatments, where NPK + SR significantly increased SOC at 0.82 t C ha−1 yr−1 and NPK + OM and NPK + CR had relatively higher SOC rate at 0.30 t C ha−1 yr−1 and 0.36 t C ha−1 yr−1, respectively, though no obvious difference was observed among these two and NPK practices.

3.5. Net Global Warming Potential (GWP) and Greenhouse Gas Intensity (GHGI)

Net GWP accounted for all GHG emissions, fertilizer production, and SOC sequestration over the annual rotation. As shown in Table 3, net GWP varied from 4.09 to 6.01 t CO2 equivalent ha−1 during the experimental period. All fertilization plots with positive net GWP indicated that soil acted as net GWP source. The application of organic manure showed the greatest net GWP at 6.01 t CO2 equivalent ha−1, owing to relatively high CH4 and N2O emissions (Table 3). In contrast, the least net GWP was recorded in the NPK + SR plot at 4.09 t CO2 equivalent ha−1, and decreased by 31.9%, 30.8%, 15.3% and 11.4% compared with NPK + OM, NPK, PK and NPK + CR, respectively. These decreases were attributable to the greatest SOC change. No significant difference in GHGIs was observed among PK, NPK and NPK + OM, which were lower in NPK and NPK + OM plots (Table 3). Compared with NPK, GHGIs under NPK + SR and NPK + CR were substantially decreased by 36.8% and 28.1%, while NPK + OM treatment produced a comparable GHGI.

4. Discussion

4.1. Effect of Different Fertilizers on CH4 and N2O Emissions

The annually cumulative CH4 emission during the rice–wheat rotation varied between 3.78 and 6.09 t CO2 ha−1 yr−1, which is within previously reported ranges under the same cropping system [23]. The NPK plot emitted 23.45% more CH4 than the PK plot, but the difference did not reach a statistically significant level. Although previous studies have shown ambiguous effects of chemical N fertilizer on CH4 emissions in paddy fields [12,36], the cumulative CH4 emissions largely depended on crop growth [34,37]. This was partially explained by a significant linear relationship between seasonal CH4 emission and grain biomass in our study (p < 0.05; Table 4). It was generally believed that CH4 emissions could be enhanced under organic amendments [24,38], which is also true in our study because CH4 emissions were higher in the NPK + OM and NPK + SR plots. Obviously, the greater CH4 emission from NPK + OM may be due to the improved microbial decomposition of organic matter which was the predominant source of methanogen substrates [39,40]. This result was convinced by the significantly positive correlation between CH4 emission and MBC concentration (p < 0.05). The C:N ratio is also an important parameter affecting CH4 production [41]. Straw with a higher C:N ratio (87.20 or 77.40) than applied manure (21.72) may accelerate CH4 emission (Table 2) in our study. Johnson-Beeout et al. [42] and Hu et al. [43] also reported straw with a higher C:N ratio usually corresponds to substantial input of labile organic carbon and a decrease in soil Eh (soil redox potential), thus alters soil microbial communities and their activities and enhances CH4 production. Interestingly, we found that at the end of the rice growing season, CH4 emissions peaked in all N treatment combinations even if CH4 emissions from NPK + SR and NPK + CR treatments declined to near- zero emissions prior to these last CH4 peaks. This is probably because of the increase of biomass and variation of water contents which were showed strong effects on it [44].
N2O is generally produced through denitrification in soil, and corresponds to soil mineral N content [45]. In the present study, annual N2O emissions for all treatments ranged from 0.85 to 1.86 t CO2 ha−1 yr−1, which is comparable with previous reports [41,44], whereas, much lower than the result of Ma et al. [23]. N2O emissions were negligible in rice season with a floodwater regime [46]. As expected, cumulative N2O emission under NPK treatment was significantly higher than that under PK treatment, indicating that chemical N application may greatly increase N2O emissions. The lower N input (315 N kg ha−1) in our study might lead to the decreased N2O emissions than that of Ma et al. [23] with 360–480 N kg ha−1 applied on the annual rice-wheat rotation. Another possible reason is that the clay loam soil in our study led to longer N2O retention in soil, raising more potential of N2O reduction to N2 [47]. It was generally acknowledged that controlled-release fertilizers could decrease cumulative N2O emissions under rice-wheat rotation [18,44,48], which also convinced our observation with an average 20.85% reduction of N2O emission under NPK+ CR compared with NPK treatment in both seasons. Controlled-release fertilizers could release N-nutrients by diffusion at a varying rate with the composition of its coating to meet the crop’s N demand through the entire rice and wheat season, thus reducing the amount of N available for denitrification [49]. Furthermore, Murphy et al. [50] and Yang et al. [24] suggested that organic amendments may appreciably increase N2O emissions, which may be attributed to the stimulation of high C input. However, our results indicated that straw returning greatly suppressed total annual N2O emissions, while manure incorporation raised annual N2O emissions. This phenomenon might result from the following reasons: (1) wheat and rice straw with C:N ratio higher than 30 incorporated in our study enhanced soil N immobilization and decreased available N for denitrification, thus decreasing the N2O production [51]; (2) crop residue shifted soil microbial community and activity, promoting the reduction of N2O to N2 during denitrification [52]. Nonetheless, inorganic N content is considered an important factor that controls N2O emissions [52], which is supported by the significant positive correlation between N2O emissions with NO3. Considering soil N2O is produced through the microbial processes which are primarily by soil edaphic factors [47], further studies are required to link the N2O production process with the N cycling-related functional genes and more edaphic factors to gain insight into the mechanism of effect of organic amendments and controlled-release fertilizers on N2O emissions.

4.2. Effect of Different Fertilizers on Soil C Sequestration

Soil carbon sequestration potentials vary greatly with the scenarios estimated by CEVSA and DNDC [13], and SOC measurement in long- or short-term experiments have shown variations in field experiments [53]. The net ecosystem carbon budget (NECB) is typically estimated from SOC measurements [34], soil respiration measurements [21], and model assessments [54]. In our study, the NECB was estimated over a seasonal crop time scale by the approach of the gross primary production and ecosystem respiration with intermittent chamber measurements [23]. A conversion coefficient (0.213) of NECB to SOC change from Xie et al. [55] was adopted in this case. The SOC sequestration rate ranged from −0.06 t C ha−1 yr−1 under PK treatment to 0.82 t C ha−1 yr−1 under straw returning plot. This was comparable to results (−0.27 to 0.67 t C ha−1 yr−1) estimated by Ma et al. [23] for rice–wheat rotation in eastern China. Except for the PK plot, SOC sequestration rates fell within 0.13–2.20 t C ha−1 yr−1 for paddy soil in China estimated by Pan et al. [56]. The estimates in the current study generally supported that nutrients supplied via chemical fertilizers, organic manure, straw return, and controlled-release fertilizer could augment soil C sequestration by increasing C inputs from improved plant productivity or organic amendments returned to the soil [24].
The SOC sequestration rates were significantly affected by the management practices. Although it was lower than other three combined fertilizer treatments, the SOC sequestration rate for the NPK treatment was still positive, indicating that chemical fertilizer could sequester carbon in the soil, possibly because of sufficient supply of plant nutrition to increase above-ground and root biomass due to improved growth rate of crops [57]. Without additional organic carbon input, the NPK + CR treatment showed a higher SOC sequestration rate than NPK + OM treatment, mainly owing to the large mitigation of GHGs emissions. The NPK + SR treatment showed the highest SOC sequestration rate. The possible reason is that the application of chemical fertilizers incorporated with straw increased SOC storage and prolonged duration through the decomposition and mineralization of the crop residues [16]. Moreover, the NPK + SR treatment sequestered more carbon than the NPK + OM and NPK + CR treatments, mainly due to higher C inputs in these studied strategies. Earlier, Marland et al. [58] estimated that the practice of straw return was able to increase the SOC sequestration rate by three times that of chemical fertilizers alone, equal to 2.2% of carbon emissions from fossil fuel consumption in China. Significant linear relationships between SOC sequestration rate and amount of straw returning were also found in four agricultural regions of China, and the potential SOC sequestration rate increased 2.5 times over that of the current situation when the straw amount reached 450 T g yr−1 [13,59,60], thus straw returning should be strongly advocated in consideration of carbon sequestration in soil.

4.3. Effect of Different Fertilizers on Net GWP and GHGI

Great efforts have been recently made to understand the dynamics of SOC [34,61] and estimate global warming potential (GWP) [62,63]. Typically, net GWP should include the net exchange of gases (CH4 and N2O) and sequestration of soil carbon. To completely understand the effects of different fertilization on relative forcing, we used IPCC factors estimating the net GWP on a 100-year scale [3]. The positive net GWP for all field treatments was 4.09–5.91 t CO2-eq ha−1 yr−1 annually. Zhang et al. [44] estimated annual net GHG balance between −12.0 and −7.9 t C ha−1 yr−1 in the rice-wheat cropping systems with biochar amendments. Yang et al. [24] estimated annual net GWPs of −0.37 to 4.58 t CO2-eq ha−1 yr−1 for the rice-wheat systems in the central Yangtze River Delta. The aforementioned results differed mainly from the methods for calculating net GWP or estimating ecosystem C balance. We hypothesized that varying combinations of different fertilizers would increase soil C sequestration, offsetting the potential effects of additional emissions of CO2 equivalents. Although the greatest cumulative CH4 emission was observed for the NPK + SR treatment, it had the least net GWP which indicated that our estimates of NPK + SR partially supported the previous hypothesis.
The GHGI-related net GWP of crop production was 0.36–0.65 kg CO2-eq kg−1 grain in the present study. This was less than the 0.92–2.95 kg CO2-eq kg−1 grain estimated by Hu et al. [43] for continuously waterlogged paddies, but comparable to estimates (0.24–0.74 kg CO2-eq kg−1) for organic manure amendments and midseason drainage of rice paddies [62]. Compared with the net GWP (5.91 t CO2-eq ha−1 yr−1) and GHGI (0.57 kg CO2-eq kg−1 grain) under NPK treatment, net GWPs were decreased by 30.80% under NPK+ SR treatment and 21.83% under the NPK + CR treatment. GHGIs were also decreased by 36.84% and 28.07% respectively, with the least GWP (4.09 t CO2-eq ha−1 yr−1) and GHGI (0.36 kg CO2-eq kg−1 grain) found in the NPK + SR plots. These results suggested that the mitigation of GHG emissions can be achieved with simultaneous increase of grain production and NUE under combined fertilizer management. The GHGI must be considered before GWP when assessing the crop management strategy for agricultural sustainability, because the main purpose of arable land is to support human consumption [37]. Thus, the NPK + OM treatment was still advocated for food security, as it decreased GHGI compared with NPK treatment. However, under long-term NPK application only, a high SOC level could not be sustained, and water and soil quality might even be jeopardized by soil acidification [64].

5. Conclusions

In comparison with NPK treatment, NPK + OM significantly increased wheat yield, NPK + SR significantly increased rice yield and both three combined fertilizers significantly enhanced the NUE, indicating the organic manure/crop residue/controlled-release fertilizer incorporation is an effective way for sustainable agriculture in terms of grain yield and NUE. In addition, this study adopted a method to comprehensively evaluate the effects of different fertilizers on grain yield and net GWP. The results suggested combined fertilizer treatments were recommended because of their relatively lower GHGI. With the least GHGI, largely caused by the greatest SOC change, the combined straw returning practices could be the most effective option in the current rice-wheat rotation system.

Author Contributions

Conceptualization, G.L. and W.Z.; methodology, H.L.; software, D.S.; validation, S.Z., G.L. and W.Z.; formal analysis, T.G.; investigation, H.L.; resources, D.S.; data curation, T.G.; writing—original draft preparation, T.G.; writing—review and editing, G.L.; visualization, D.S.; supervision, W.Z.; funding acquisition, G.L. All authors have read and agreed to the published version of the manuscript.

Funding

This research was financially supported by the National Natural Science Foundation of China (Grant no. 31772392), the earmarked fund for China Agriculture Research System (CARS–01–23), and Innovation Project of Chinese Academy of Agricultural Sciences (No. Y2020CG04).

Institutional Review Board Statement

Not applicable.

Informed Consent Statement

Not applicable.

Data Availability Statement

The data presented in this study are available on request from the corresponding author.

Acknowledgments

The authors would like to thank Cheng Hu and Donghai Liu for the assistance in the field sampling.

Conflicts of Interest

The authors declare no conflict of interest.

References

  1. Chiodi, A.; Donnellan, T.; Breen, J.; Deane, P.; Hanrahan, K.; Gargiulo, M.; Gallachóir, B.P. Integrating agriculture and energy to assess GHG emissions reduction: A methodological approach. Clim. Policy 2015, 16, 215–236. [Google Scholar] [CrossRef]
  2. Pratibha, G.; Srinivas, I.; Rao, K.V.; Shanker, A.K.; Raju, B.M.K.; Choudhary, D.K.; Maheswari, M. Net global warming potential and greenhouse gas intensity of conventional and conservation agriculture system in rainfed semi arid tropics of India. Atmos. Environ. 2016, 145, 239–250. [Google Scholar] [CrossRef]
  3. Intergovernmental Panel on Climate Change (IPCC). Future Pathways for Adaptation, Mitigation and Sustainable Development; Climate Change 2014, Synthesis Report 3; IPCC: Geneva, Switzerland, 2014; pp. 87–89. [Google Scholar]
  4. Smith, P.; Martino, D.; Cai, Z.; Gwary, D.; Janzen, H.; Kumar, P.; McCarl, B.; Ogle, S. Greenhouse gas mitigation in agriculture. Philos. Trans. R. Soc. B 2008, 363, 789–813. [Google Scholar] [CrossRef] [Green Version]
  5. Li, R.; Gao, Y.; Chen, Q.; Li, Z.; Gao, F.; Meng, Q.; Li, T.G.; Liu, A.R.; Wang, Q.; Wu, L.; et al. Blended controlled-release nitrogen fertilizer with straw returning improved soil nitrogen availability, soil microbial community, and root morphology of wheat. Soil Tillage Res. 2021, 212, 105045. [Google Scholar] [CrossRef]
  6. Ladha, J.K.; Pathak, H.; Padre, A.T.; Dawe, D.; Gupta, R.K. Productivity trends in intensive rice-wheat cropping systems in Asia. In Improving the Productivity and Sustainability of Rice–Wheat Systems: Issues and Impacts; Ladha, J.K., Hill, J.E., Duxbury, J.M., Gupta, R.K., Buresh, R.J., Eds.; American Society of Agronomy: Madison, WI, USA, 2003; pp. 45–76. [Google Scholar]
  7. Kumari, M.; Chakraborty, D.; Gathala, M.K.; Pathak, H.; Dwivedi, B.S.; Tomar, R.K.; Garg, R.N.; Singh, R.; Ladha, J.K. Soil aggregation and associated organic carbon fractions as affected by tillage in a rice–wheat rotation in North India. Soil Sci. Soc. Am. J. 2011, 75, 560–567. [Google Scholar] [CrossRef]
  8. Ju, X.T.; Xing, G.X.; Chen, X.P.; Zhang, S.L.; Zhang, L.J.; Liu, X.J.; Cui, Z.L.; Yin, B.; Christie, P.; Zhu, Z.L.; et al. Reducing environmental risk by improving N management in intensive Chinese agricultural systems. Proc. Natl. Acad. Sci. USA 2009, 106, 3041–3046. [Google Scholar] [CrossRef] [PubMed] [Green Version]
  9. Zhang, A.F.; Liu, Y.M.; Pan, G.X.; Hussain, Q.; Li, L.Q.; Zheng, J.W.; Zhang, X.H. Effect of biochar amendment on maize yield and greenhouse gas emissions from a soil organic carbon poor calcareous loamy soil from Central China Plain. Plant Soil 2012, 351, 263–275. [Google Scholar] [CrossRef]
  10. Chen, X.P.; Wang, G.X.; Zhang, T.; Mao, T.X.; Wei, D.; Hu, Z.Y.; Song, C.L. Effects of warming and nitrogen fertilization on GHG flux in the permafrost region of an alpine meadow. Atmos. Environ. 2017, 157, 111–124. [Google Scholar] [CrossRef]
  11. Tan, Y.; Xu, C.; Liu, D.; Wu, W.; Lal, R.; Meng, F. Effects of optimized N fertilization on greenhouse gas emission and crop production in the North China Plain. Field Crops Res. 2017, 205, 135–146. [Google Scholar] [CrossRef]
  12. Hillier, J.G.; Hawes, C.; Squire, G.; Hilton, A.; Wale, S.; Smith, P. The carbon footprints of food crop production. Int. J. Agric. Sustain. 2012, 7, 107–118. [Google Scholar] [CrossRef]
  13. Lu, F.; Wang, X.; Han, B.; Ouyang, Z.; Duan, X.; Zheng, H. Soil carbon sequestrations by nitrogen fertilizer application, straw return and no-tillage in China’s cropland. Glob. Chang. Biol. 2009, 15, 281–305. [Google Scholar] [CrossRef]
  14. Ye, G.P.; Lin, Y.; Kuzyakov, Y.; Liu, D.; Luo, J.; Lindsey, S.; Wang, W.J.; Fan, J.B.; Ding, W.X. Manure over crop residues increases soil organic matter but decreases microbial necromass relative contribution in upland Ultisols: Results of a 27-year field experiment. Soil Biol. Biochem. 2019, 34, 15–24. [Google Scholar] [CrossRef]
  15. Guan, X.K.; Wei, L.; Turner, N.C.; Ma, S.C.; Yang, M.D.; Wang, T.C. Improved straw management practices promote in situ straw decomposition and nutrient release, and increase crop production. J. Clean. Prod. 2020, 250, 119514. [Google Scholar] [CrossRef]
  16. Liu, J.; Jiang, B.S.; Shen, J.L.; Zhu, X.; Yi, W.Y.; Li, Y.; Wu, J.S. Contrasting effects of straw and straw-derived biochar applications on soil carbon accumulation and nitrogen use efficiency in double-rice cropping systems. Agric. Ecosyst. Environ. 2021, 311, 107286. [Google Scholar] [CrossRef]
  17. Lee, J.H.; Lee, J.G.; Jeong, S.T.; Gwon, H.S.; Kim, P.J.; Kim, G.W. Straw recycling in rice paddy: Trade-off between greenhouse gas emission and soil carbon stock increase. Soil Tillage Res. 2020, 199, 104598. [Google Scholar] [CrossRef]
  18. Ardell, D.H.; Stephen, J.D.; Francesco, A. Tillage and inorganic nitrogen source effects on nitrous oxide emissions from irrigated cropping systems. Soil Sci. Soc. Am. J. 2010, 74, 436–445. [Google Scholar]
  19. Li, C.J.; Xiong, Y.W.; Huang, Q.Z.; Xu, X.; Huang, G.H. Impact of irrigation and fertilization regimes on greenhouse gas emissions from soil of mulching cultivated maize (Zea mays L.) field in the upper reaches of Yellow River, China. J. Clean. Prod. 2020, 259, 120873. [Google Scholar] [CrossRef]
  20. IPCC. Agriculture. In Climate Change 2007: Mitigation, Contribution of Working Group III to the Fourth Assessment Report of the Intergovernmental Panel on Climate Change; Metz, B., Davidson, O.R., Bosch, P.R., Dave, R., Meyer, L.A., Eds.; Cambridge University Press: Cambridge, UK, 2007; pp. 498–540. [Google Scholar]
  21. Kim, G.W.; Jeong, S.T.; Kim, P.J.; Gwon, H.S. Influence of nitrogen fertilization on the net ecosystem carbon budget in a temperate mono–rice paddy. Geoderma 2017, 306, 58–66. [Google Scholar] [CrossRef]
  22. Smith, P.; Lanigan, G.; Kutsch, W.L.; Buchmann, N.; Eugster, W.; Aubinet, M. Measurements necessary for assessing the net ecosystem carbon budget of croplands. Agric. Ecosyst. Environ. 2010, 139, 302–315. [Google Scholar] [CrossRef]
  23. Ma, Y.C.; Kong, X.W.; Yang, B.; Zhang, X.L.; Yan, X.Y.; Yang, J.C.; Xiong, Z.Q. Net global warming potential and greenhouse gas intensity of annual rice–wheat rotations with integrated soil–crop system management. Agric. Ecosyst. Environ. 2013, 164, 209–219. [Google Scholar] [CrossRef] [Green Version]
  24. Yang, B.; Xiong, Z.; Wang, J.; Xu, X.; Huang, Q.; Shen, Q.R. Mitigating net global warming potential and greenhouse gas intensities by substituting chemical nitrogen fertilizers with organic fertilization strategies in rice–wheat annual rotation systems in China: A 3–year field experiment. Ecol. Eng. 2015, 81, 289–297. [Google Scholar] [CrossRef]
  25. Zhang, F.S.; Cui, Z.L.; Chen, X.P.; Ju, X.T.; Shen, J.B.; Chen, Q.; Liu, X.J.; Zhang, W.F.; Mi, G.H.; Fan, M.S.; et al. Integrated nutrient management for food security and environmental quality in China. Adv. Agron. 2012, 116, 1–40. [Google Scholar]
  26. Ai, C.; Liang, G.Q.; Sun, J.W.; Wang, X.B.; Zhou, W. Responses of extracellular enzyme activities and microbial community in both the rhizosphere and bulk soil to long-term fertilization practices in a fluvo-aquic soil. Geoderma 2012, 173, 330–338. [Google Scholar] [CrossRef]
  27. Wu, J.; Joergensen, R.G.; Pommerening, B. Measurement of soil microbial biomass C by fumigation-extraction-an automated procedure. Soil Biol. Biochem. 1990, 22, 1167–1169. [Google Scholar] [CrossRef]
  28. Brookes, P.C.; Landman, A.; Pruden, G. Chloroform fumigation and the release of soil nitrogen: A rapid direct extraction method to measure microbial biomass nitrogen in soil. Soil Biol. Biochem. 1985, 7, 837–842. [Google Scholar] [CrossRef]
  29. Qi, L.; Pokharel, P.; Chang, S.X.; Zhou, P.; Niu, H.D.; He, X.H.; Gao, M. Biochar application increased methane emission, soil carbon storage and net ecosystem carbon budget in a 2-year vegetable–rice rotation. Agric. Ecosyst. Environ. 2020, 292, 106831. [Google Scholar] [CrossRef]
  30. Koyama, S.; Inazaki, F.; Minamikawa, K.; Kato, M.; Hayashi, H. Increase in soil carbon sequestration using rice husk charcoal without stimulating CH4 and N2O emissions in an Andosol paddy field in Japan. Soil Sci. Plant Nutr. 2015, 61, 873–884. [Google Scholar] [CrossRef] [Green Version]
  31. Huang, Y.; Zhang, W.; Sun, W.J.; Zheng, X.H. Net primary production of Chinese croplands from 1950 to 1999. Ecol. Appl. 2007, 17, 692–701. [Google Scholar] [CrossRef]
  32. Kimura, M.; Murase, J.; Lu, Y. Carbon cycling in rice field ecosystems in the context of input, decomposition and translocation of organic materials and the fates of their end products (CO2 and CH4). Soil Biol. Biochem. 2004, 36, 1399–1416. [Google Scholar] [CrossRef]
  33. Mandal, B.; Majumder, B.; Adhya, T.; Bandyopadhyay, P.; Gangopadhyay, A.; Sarkar, D.; Kundu, M.; Choudhury, S.G.; Hazra, G.; Kundu, S. Potential of double–cropped rice ecology to conserve organic carbon under subtropical climate. Glob. Chang. Biol. 2008, 14, 2139–2151. [Google Scholar] [CrossRef]
  34. Shang, Q.Y.; Yang, X.X.; Gao, C.M.; Wu, P.; Liu, J.J.; Xu, Y.C.; Shen, Q.R.; Zou, J.W.; Guo, S.W. Net annual global warming potential and greenhouse gas intensity in Chinese double rice–cropping systems: A 3–year field measurement in long–term fertilizer experiments. Glob. Chang. Biol. 2011, 17, 2196–2210. [Google Scholar] [CrossRef]
  35. Guo, B.B.; Liu, B.C.; He, L.; Wang, Y.Y.; Feng, W.; Zhu, Y.J.; Jiao, N.Y.; Wang, C.Y.; Guo, T.C. Root and nitrate-N distribution and optimization of N input in winter wheat. Sci. Rep. 2019, 9, 1–12. [Google Scholar] [CrossRef]
  36. Zou, J.W.; Liu, S.W.; Qin, Y.M.; Pan, G.X.; Zhu, D. Sewage irrigation increased methane and nitrous oxide emissions from rice paddies in southeast China. Agric. Ecosyst. Environ. 2009, 129, 516–522. [Google Scholar] [CrossRef]
  37. Linquist, B.; Groenigen, K.; Borbe, A.; Pittelkow, C.; Kessel, C. An agronomic assessment of greenhouse gas emissions from major cereal crops. Glob. Chang. Biol. 2012, 18, 194–209. [Google Scholar] [CrossRef]
  38. Bhattacharyya, P.; Roy, K.S.; Neogi, S.; Adhya, T.K.; Rao, K.S.; Manna, M.C. Effects of rice straw and nitrogen fertilization on greenhouse gas emissions and carbon storage in tropical flooded soil planted with rice. Soil Tillage Res. 2012, 124, 119–130. [Google Scholar] [CrossRef]
  39. Shen, J.; Tang, H.; Liu, J.; Wang, C.; Li, Y.; Ge, T.; Jones, D.L.; Wu, J. Contrasting effects of straw and straw–derived biochar amendments on greenhouse gas emissions within double rice cropping systems. Agric. Ecosyst. Environ. 2014, 188, 264–274. [Google Scholar] [CrossRef]
  40. Liu, G.; Yu, H.; Ma, J.; Xu, H.; Wu, Q.; Yang, J.; Zhuang, Y. Effects of straw incorporation along with microbial inoculant on methane and nitrous oxide emissions from rice fields. Sci. Total Environ. 2015, 518, 209–216. [Google Scholar] [CrossRef]
  41. Devevre, O.C.; Horwath, W.R. Decomposition of rice straw and microbial carbon use efficiency under different soil temperatures and moistures. Soil Biol. Biochem. 2000, 32, 1773–1785. [Google Scholar] [CrossRef]
  42. Johnson-Beebout, S.E.; Angeles, O.R.; Alberto, M.C.R.; Buresh, R.J. Simultaneous minimization of nitrous oxide and methane emission from rice paddy soils is improbable due to redox potential changes with depth in a greenhouse experiment without plants. Geoderma 2009, 149, 45–53. [Google Scholar] [CrossRef]
  43. Hu, Q.Y.; Liu, T.Q.; Jiang, S.S.; Cao, C.G.; Li, C.F.; Chen, B.; Liu, J.B. Combined effects of straw returning and chemical N fertilization on greenhouse gas emissions and yield from paddy fields in Northwest Hubei Province, China. J. Soil Sci. Plant Nutr. 2020, 20, 392–406. [Google Scholar] [CrossRef]
  44. Zhang, A.F.; Bian, R.J.; Hussain, Q.; Li, L.Q.; Pan, G.X.; Zheng, J.W.; Zhang, X.H.; Zheng, J.F. Change in net global warming potential of a rice–wheat cropping system with biochar soil amendment in a rice paddy from China. Agric. Ecosyst. Environ. 2013, 173, 37–45. [Google Scholar] [CrossRef]
  45. Davidson, E.A.; Swank, W.T.; Perry, T.O. Distinguishing between nitrification and denitrification as sources of gaseous nitrogen production in soil. Appl. Environ. Microbiol. 1986, 52, 1280–1286. [Google Scholar] [CrossRef] [Green Version]
  46. Liu, S.; Qin, Y.; Zou, J.W.; Liu, Q. Effects of water regime during rice–growing season on annual direct N2O emission in a paddy rice–winter wheat rotation system in southeast China. Sci. Total Environ. 2010, 408, 906–913. [Google Scholar] [CrossRef]
  47. Gu, J.; Nicoullaud, B.; Rochette, P.; Grossel, A.; Hénault, C.; Cellier, P.; Richard, G. A regional experiment suggests that soil texture is a major control of N2O emissions from tile-drained winter wheat fields during the fertilization period. Soil Biol. Biochem. 2013, 60, 134–141. [Google Scholar] [CrossRef]
  48. Gurung, R.B.; Ogle, S.M.; Breidt, F.J.; Parton, W.J.; Del Grosso, S.J.; Zhang, Y.; Venterea, R.T. Modeling nitrous oxide mitigation potential of enhanced efficiency nitrogen fertilizers from agricultural systems. Sci. Total Environ. 2021, 801, 149342. [Google Scholar] [CrossRef] [PubMed]
  49. Ji, Y.; Liu, G.; Ma, J.; Xu, H.; Yagi, K. Effect of controlled-release fertilizer on nitrous oxide emission from a winter wheat field. Nutr. Cycl. Agroecosyst. 2012, 94, 111–122. [Google Scholar] [CrossRef]
  50. Murphy, D.V.; Recous, S.; Stockdale, E.A.; Fillery, I.R.P.; Jensen, L.S.; Hatch, D.J.; Goulding, K.W.T. Gross nitrogen fluxes in soil: Theory, measurement and application of 15n pool dilution techniques. In Advances in Agronomy; Sparks, D.L., Ed.; Academic Press: San Diego, CA, USA, 2003; Volume 79, pp. 69–118. [Google Scholar]
  51. Kindaichi, T.; Ito, T.; Okabe, S. Ecophysiological interaction between nitrifying bacteria and heterotrophic bacteria in autotrophic nitrifying biofilms as determined by micro autoradiography–fluorescence in situ hybridization. Appl. Environ. Microbiol. 2004, 70, 1641–1650. [Google Scholar] [CrossRef] [PubMed] [Green Version]
  52. Pitombo, L.M.; Cantarella, H.; Packer, A.P.C.; Ramos, N.P.; Do Carmo, J.B. Straw preservation reduced total N2O emissions from a sugarcane field. Soil Use Manag. 2017, 33, 583–594. [Google Scholar] [CrossRef]
  53. VandenBygaart, A.J.; Bremer, E.; McConkey, B.G.; Janzen, H.H.; Angers, D.A.; Carter, M.R.; Drury, C.F.; Lafond, G.P.; McKenzie, R.H. Soil organic carbon stocks on long-term agroecosystem experiments in Canada. Can. J. Soil Sci. 2010, 90, 543–550. [Google Scholar] [CrossRef] [Green Version]
  54. Zhang, L.M.; Yu, D.S.; Shi, X.Z.; Weindorf, D.C.; Zhao, L.M.; Ding, W.X.; Wang, H.J.; Pan, J.J.; Li, C.S. Simulation of global warming potential (GWP) from rice fields in the Tai-Lake region, China by coupling 1:50,000 soil database with DNDC model. Atmos. Environ. 2009, 43, 2737–2746. [Google Scholar] [CrossRef]
  55. Xie, Z.B.; Liu, G.; Bei, Q.C.; Tang, H.Y.; Liu, J.S.; Sun, H.; Xu, Y.P.; Zhu, J.G.; Cadisch, G. CO2 mitigation potential in farmland of China by altering current organic matter amendment pattern. Sci. China Earth Sci. 2010, 53, 1351–1357. [Google Scholar] [CrossRef]
  56. Pan, G.X.; Li, L.; Wu, L.; Zhang, X. Storage and sequestration potential of topsoil organic carbon in China’s paddy soils. Glob. Chang. Biol. 2003, 10, 79–92. [Google Scholar] [CrossRef]
  57. Ghosh, A.; Bhattacharyya, R.; Meena, M.C.; Dwivedi, B.S.; Singh, G.; Agnihotri, R.; Sharma, C. Long-term fertilization effects on soil organic carbon sequestration in an Inceptisol. Soil Tillage Res. 2018, 177, 134–144. [Google Scholar] [CrossRef]
  58. Marland, G.; Boden, T.A.; Andres, R.J. Global, regional, and national CO2 emissions. In In Trends: A Compendium of Data on Global Change; Carbon Dioxide Information Analysis Center, Oak Ridge National Laboratory, US Department of Energy: Oak Ridge, TN, USA, 2003. [Google Scholar]
  59. Bhattacharyya, R.; Prakash, V.; Kundu, S.; Srivastva, A.K.; Gupta, H.S.; Mitra, S. Long term effects of fertilization on carbon and nitrogen sequestration and aggregate associated carbon and nitrogen in the Indian sub-himalayas. Nutr. Cycl. Agroecosystems 2010, 86, 1–16. [Google Scholar] [CrossRef]
  60. Chen, J.; Luo, Y.; Van Groenigen, K.J.; Hungate, B.A.; Cao, J.; Zhou, X.; Wang, R. A keystone microbial enzyme for nitrogen control of soil carbon storage. Sci. Adv. 2018, 4, eaaq1689. [Google Scholar] [CrossRef] [PubMed] [Green Version]
  61. Wang, H.; Shen, M.; Hui, D.; Chen, J.; Sun, G.; Wang, X.; Zhang, Y. Straw incorporation influences soil organic carbon sequestration, greenhouse gas emission, and crop yields in a Chinese rice (Oryza sativa L.)–wheat (Triticum aestivum L.) cropping system. Soil Tillage Res. 2019, 195, 104377. [Google Scholar] [CrossRef]
  62. Qin, Y.M.; Liu, S.W.; Guo, Y.Q.; Liu, Q.; Zou, J.W. Methane and nitrous oxide emissions from organic and conventional rice cropping systems in Southeast China. Biol. Fertil. Soils 2010, 46, 825–834. [Google Scholar] [CrossRef]
  63. Lee, J.G.; Cho, S.R.; Jeong, S.T.; Hwang, H.Y.; Kim, P.J. Different response of plastic film mulching on greenhouse gas intensity (GHGI) between chemical and organic fertilization in maize upland soil. Sci. Total Environ. 2019, 696, 133827. [Google Scholar] [CrossRef]
  64. Raza, S.; Miao, N.; Wang, P.Z.; Ju, X.T.; Chen, Z.J.; Zhou, J.B.; Kuzyakov, Y. Dramatic loss of inorganic carbon by nitrogen-induced soil acidification in Chinese croplands. Glob. Chang. Biol. 2020, 26, 3738–3751. [Google Scholar] [CrossRef] [PubMed]
Figure 1. Wheat and rice grain yield and agronomic nitrogen use efficiency (NUE) increment under different fertilizer treatments. (OM = organic manure; SR = straw returning; CR = controlled-release fertilizer). Different letters between treatments represent significant differences at p < 0.05.
Agronomy 11 02540 g001
Figure 2. Effect of different fertilizer treatments on (a,e) NH4+-N, (b,f) NO3-N, (c,g)microbial biomass carbon (MBC), (d,h) microbial biomass nitrogen (MBN) content in the 0–20 cm topsoil layer during the wheat season and the rice season, respectively. Data are Mean ± S.E. (n = 3) and value followed by different letters between treatments represent significant differences at p < 0.05. (SS: Seeding stage, RG: Return green stage, JS: Jointing stage, BS: Booting stage, MS: Mature stage, TS: Tillering stage).
Agronomy 11 02540 g002
Figure 3. Seasonal variations of (a) ecosystem respiration CO2, (b) CH4, (c) N2O during the rice-wheat rotation from 2013 to 2014.
Agronomy 11 02540 g003
Figure 4. Correlations between wheat and rice biomass with CO2 and CH4 emissions.
Agronomy 11 02540 g004
Table 1. Fertilizer application and filed operation during different periods of wheat-rice rotation.
TreatmentsN Rates for Two Vegetable Crops (N kg ha−1)N Application Rate (%)
UreaOMSRCRBasalElongationBooting
Wheat season
NPK150 502030
NPK + OM12030 502030
NPK + SR120 30 502030
NPK + CR90 60100
Rice season
NPK165 403030
NPK + OM13233 403030
NPK + SR132 33 403030
NPK + CR99 66 100
PK: P and K fertilizer only; Calcium superphosphate for P and potassium chloride for K were applied as basal fertilizers at rates of 67.5 kg P2O5 ha−1 and 90 kg K2O ha−1 during wheat season, and 75 kg P2O5 ha−1 and 75 kg K2O ha−1 during rice season respectively. (OM = organic manure; SR = straw returning; CR = controlled-release fertilizer).
Table 2. Effects of different fertilizer treatments on total emissions of CO2, CH4 and N2O during wheat season and rice season, respectively.
TreatmentsWheat SeasonRice Season
Re
(kg ha−1)
CH4 Total Flux
(kg ha−1)
N2O Total Flux
(kg ha−1)
Re
(kg ha−1)
CH4 Total Flux
(kg ha−1)
N2O Total Flux
(kg ha−1)
PK12,260.63 ± 545.67 c1.59 ± 0.30 c2.64 ± 0.51 b17,774.09 ± 720.36 b149.30 ± 9.21 b0.22 ± 0.03 c
NPK21,447.1 ± 974.42 b2.28 ± 0.48b c5.58 ± 0.40 a23,500.66 ± 2278.98 a184.00 ± 8.76a b0.43 ± 0.02 ab
NPK + OM27,611.59 ± 2223.06 a2.60 ± 0.16 b5.69 ± 0.38 a23,938.82 ± 1605.75 a211.13 ± 11.81 ab0.56 ± 0.04 a
NPK + SR27,825.39 ± 992.69 a4.53 ± 0.16 a2.95 ± 0.31 b26,294.63 ± 986.54 a239.25 ± 46.11 a0.39 ± 0.05 abc
NPK + CR20,966.94 ± 779.06 b2.15 ± 0.29b c4.55 ± 0.41 a23,084.69 ± 829.69 a177.55 ± 18.30 ab0.33 ± 0.08 bc
Note: Mean ± S.E., different letters within the same column for each item indicate significant difference at p < 0.05 by the student’s multiple range tests.
Table 3. NECB and its components (NPP, Harvest and Re), CH4 and N2O emissions, SOC change and Grain yield, net GWP and GHGI over rice-wheat rotation.
TreatmentNECB 1
(t C ha−1 yr−1)
NPP 2
(t C ha-1 yr−1)
Harvest
(t C ha−1 yr−1)
Re
(t C ha−1 yr−1)
CH4
(t CO2 ha−1 yr−1)
N2O
(t CO2 ha−1 yr−1)
SOC Change 3
(t C ha−1 yr−1)
Grain Yield
(t ha−1 yr−1)
Net GWP 4
(t CO2-eq ha−1 yr−1)
GHGI 5
(kg CO2-eq kg−1 grain)
PK−2.60 ± 0.09 c0.92 ± 0.19 c7.33 ± 0.40 c8.19 ± 0.10 d3.78 ± 0.41 b0.85 ± 0.25 c−0.06 ± 0.02 c7.42 ± 0.13 c4.83 ± 0.16 a0.65 ± 0.03 a
NPK0.70 ± 0.41 b1.32 ± 0.34 b9.63 ± 0.27 b12.26 ± 0.45 c4.66 ± 0.39 ab1.79 ± 0.21 a0.15 ± 0.09 b10.54 ± 0.81 b5.91 ± 0.42 a0.57 ± 0.06 ab
NPK + OM1.42 ± 0.17 b1.37 ± 0.03 ab9.88 ± 0.06 ab13.53 ± 0.18 b5.26 ± 0.51a b1.86 ± 0.20 ab0.30 ± 0.04 b11.67 ± 0.27 a6.01 ± 0.52 a0.51 ± 0.04 abc
NPK + SR3.84 ± 0.44 a1.38 ± 0.52 ab10.26 ± 0.38 a14.76 ± 0.29 a6.09 ± 1.15 a1.00 ± 0.19 c0.82 ± 0.10 a11.30 ± 0.28 ab4.09 ± 1.19 a0.36 ± 0.11 c
NPK + CR1.70 ± 0.48 b1.41 ± 0.16 a10.45 ± 0.11 a12.01 ± 0.43c4.50 ± 0.78ab1.45 ± 0.17b0.36 ± 0.10b11.27 ± 0.44 ab4.62 ± 0.74 a0.41 ± 0.07 bc
Mean ± S.E., different letters within the same column for each item indicate significant difference at p < 0.05 by the student’s multiple range tests. 1 NECB = NEP−harvest−CH4+manure; NEP, net ecosystem production. NEP = GPP−Re; GPP, gross primary production; Re, ecosystem respiration. NPP/GPP = 0.58; NPP, net primary production. 2 NPP = NPPgrain + NPPshoot + NPProot+ NPPlitter + NPPrhizodeposit. 3 SOC change = 0.213 × NECB. 4 Net GWP = 28 × CH4 + 265 × N2O − 44/12 × SOC change. 5 GHGI = net GWP/grain yield.
Table 4. Correlation coefficients (r) for simple correlation analysis between GHGs emissions and environmental factors under different fertilizer treatments.
Air TemperatureSoil TemperatureWater ContentNO3-NMBC
Wheat Season
CO2 flux0.6122 ***0.5355 ***−0.4460 ***n.s.0.8954 ***
CH4 fluxn.s.n.s.n.s.n.s.0.4537 *
N2O fluxn.s.n.s.n.s.0.5424 **n.s.
Rice Season
CO2 flux0.24852 **0.38322 ***n.s.n.s.0.6645 **
CH4 flux0.18815 *0.3419 ***0.46783 **n.s.0.3327 *
N2O fluxn.s.n.s.n.s.n.s.n.s.
* Significant at p < 0.05; ** Significant at p < 0.01; *** Significant at p < 0.001.
Publisher’s Note: MDPI stays neutral with regard to jurisdictional claims in published maps and institutional affiliations.

