Article

Yield Potential and Variability of Teff (Eragrostis tef (Zucc.) Trotter) Germplasms under Intensive and Conventional Management Conditions

1
United Graduate School of Agricultural Sciences, Tottori University, 4-101 Koyama-Minami, Tottori 680-8553, Japan
2
Amhara Regional Agricultural Research Institute, P.O. Box 527, Bahir Dar, Ethiopia
3
Arid Land Research Center, Tottori University, 1390 Hamasaka, Tottori 680-0001, Japan
4
International Platform for Dryland Research and Education, Tottori University, Tottori 680-0001, Japan
5
College of Agriculture and Environmental Sciences, Bahir Dar University, P.O. Box 1289, Bahir Dar, Ethiopia
6
Faculty of Agriculture, Tottori University, 4-101 Koyama-Minami, Tottori 680-8553, Japan
7
Faculty of Life and Environmental Sciences, Shimane University, Shimane, Matsue 690-0823, Japan
*
Author to whom correspondence should be addressed.
Agronomy 2021, 11(2), 220; https://doi.org/10.3390/agronomy11020220
Submission received: 13 December 2020 / Revised: 19 January 2021 / Accepted: 21 January 2021 / Published: 24 January 2021

Abstract

:
Teff is the most strategic cereal crop grown from high rainfall to drought prone areas of Ethiopia, where it covers nearly 30% of the land allotted for cereals. However, its productivity remains very low due to lack of knowledge and research interventions. To investigate the grain yield potential, estimate the genetic parameters, and the diversity, a pot experiment with intensive management and a field experiment with conventional management at two contrasting locations for two seasons using the same 317 genotypes and additional 3 improved cultivars in the field experiment were carried out. The results showed highly significant variation among the genotypes for grain yield, biomass, harvest index, and phenological traits under both experiments. The best linear unbiased predictor (BLUP)-adjusted grain yield performance of the genotypes ranged from 4.2 to 8.8 g/plant in the intensive management and 1.8 to 4.3 g/plant in the field growing condition with conventional management. Coefficient of genetic variation, heritability, and expected genetic advance for grain yield were the highest in both experiments. Among the phenological traits, the grain filling period in the intensive growing condition exceptionally showed the highest genetic coefficient of variation and genetic advance. The high grain yield performance and wider range of the harvest index observed under the intensive management condition with moderate to high heritability signifies the genetic potential of teff for further improvement through trait recombination.

1. Introduction

Global climate trends such as recurrent drought and warming due to elevated carbon dioxide are the concerns of diminishing crop production [1,2,3]. Consequently, the levels of poverty, food insecurity, and malnutrition are becoming a routine pain for human beings particularly in less developed countries [4]. On the other hand, food demand is expected to increase as the world population keeps increasing [5,6]. The increased grain yield achieved in most common cereals during the Green Revolution largely resulted from improved partitioning of biomass to grain which is usually expressed as increased harvest index. However, such an improvement seems to have stagnated since the 1990s on major cereal crops [5,7,8,9,10] mainly due to the fact that attainable yield reached a plateau in favorable environments on the one hand and the challenging biotic and abiotic production factors are still threatening the agricultural system on the other hand. Investigations witnessed that modern wheat cultivars have reached a harvest index of greater than 0.50 which is close to the maximum hypothetical value of 0.62 [7,11]. In the world’s leading rice producing countries, yield gain, which reached 36% during the 1980s has declined to 7% [12]. These facts suggest that to further increase productivity, the biological yield potential ceiling needs to be raised, or mechanisms to enable crops to cope with unfavorable growing conditions need to be improved. Clearly, without another breakthrough, the task of ending world hunger remains daunting.
In addition to exerting a substantial effort to increase grain yield in unfavorable environments through crop stress resistance and resource use efficiency in traditional cereal crops, it is also important to consider some niche crops that could contribute to food and nutrient security with a potential for improvement. Several food crops play an important role in the food security and income of small-scale farmers in less developed countries [4,13], yet despite their importance and significant area coverage in the center of diversity, the grain yield per unit area is very low due to less scientific research interventions, and they have remained under-utilized for centuries. Among those crops, the Ethiopian small cereal called teff is known for food and nutrition security and income for the local population. Currently, because teff is gluten free [14,15] and has high dietary fiber content [16], it is attracting global attention from consumers, researchers, and food processing companies. This interest indicates that teff has the potential to be adapted as one component of the healthy food and beverage production industry. Consequently, adaptation and pilot level production has been underway in India, China, Australia, and Europe, while the United States has increased its teff production and supply to the world market [13].
Teff (Eragrostis tef (Zucc.) Trotter) is a C4 cereal and the major staple food crop grown in Ethiopia. Although the productivity is still regarded as low, grain yield of teff shows an increasing trend during the past decades mainly due to wide dissemination and adoption of improved cultivars [17,18]. In Ethiopia, teff productivity, which was only 0.7 t/ha in 1995, when the seed supply of the improved cultivars was limited, reached 1.76 tone/ha in 2018 [19]. Teff production keeps its first rank in terms of area coverage among the other cereal crops which accounts about 30% of the land allotted to cereal production followed by maize (23%), sorghum (18%), and wheat (17%) [19]. However, the lowest in its productivity which is only one third of the average wheat productivity of the nation [19]. Today, nearly three million hectares of land are covered annually by teff and more than six million small scale farmers are involved in teff cultivation.
In addition to susceptibility to lodging, low grain yield potential has been supposed as one of the major production constraints of teff [20]. Grain yield is a complex trait influenced by the growing environment, the genotype, and their interactions. The success of any crop management interventions to boost the productivity in a given environment is highly dependent on the genetic yield potential of the cultivars used. This is mainly because an increase in yield potential will uplift the actual farm yield. Yield potential is defined as the maximum yield that can be achieved by a cultivar when grown under nutrient and water non-limited environments to which it is adapted with stresses such as pests, diseases, weeds, and lodging effectively controlled [21]. Understanding the yield potential among the teff germplasm collections could play an important role in selecting best parental lines for desirable genetic recombination as it indicates how far breeders can attempt to increase the grain yield. However, how to quantify the yield potential continues debating. Although most yield potential studies used model-based prediction [22], experimental quantification is also another option of estimating the yield potential with all the stresses being controlled as much as possible.
Genetic variability for yield and desirable traits is the backbone of any improvement program. The existence of considerable genetic variability has been reported in teff [23,24,25]. As the main yield determining factor, the variability, heritability, and genetic advance of harvest index in teff has been reported to be exceptionally low [20]. Unlike the achievements observed during the Green Revolution on wheat and rice, reports in teff witnessed that the grain yield improvement achieved has been found due to an increase in plant height [26]. Consequently, the harvest index of teff is low and significant improvement has not been made despite decades of breeding efforts [25,26,27]. On the other hand, due to differences in the nature of the genotypes used and the target environments, reports showed highly variable results of the genetic parameters on grain yield and related traits. Thus, further investigation of the genetic parameters using large number of germplasm collections of teff is important to implement guided breeding strategies. Therefore, the objectives of this study were to evaluate the yield potential and determine the variabilities of teff genotypes under pot experiment with known stresses being controlled and field experiments with conventional management condition.

2. Materials and Methods

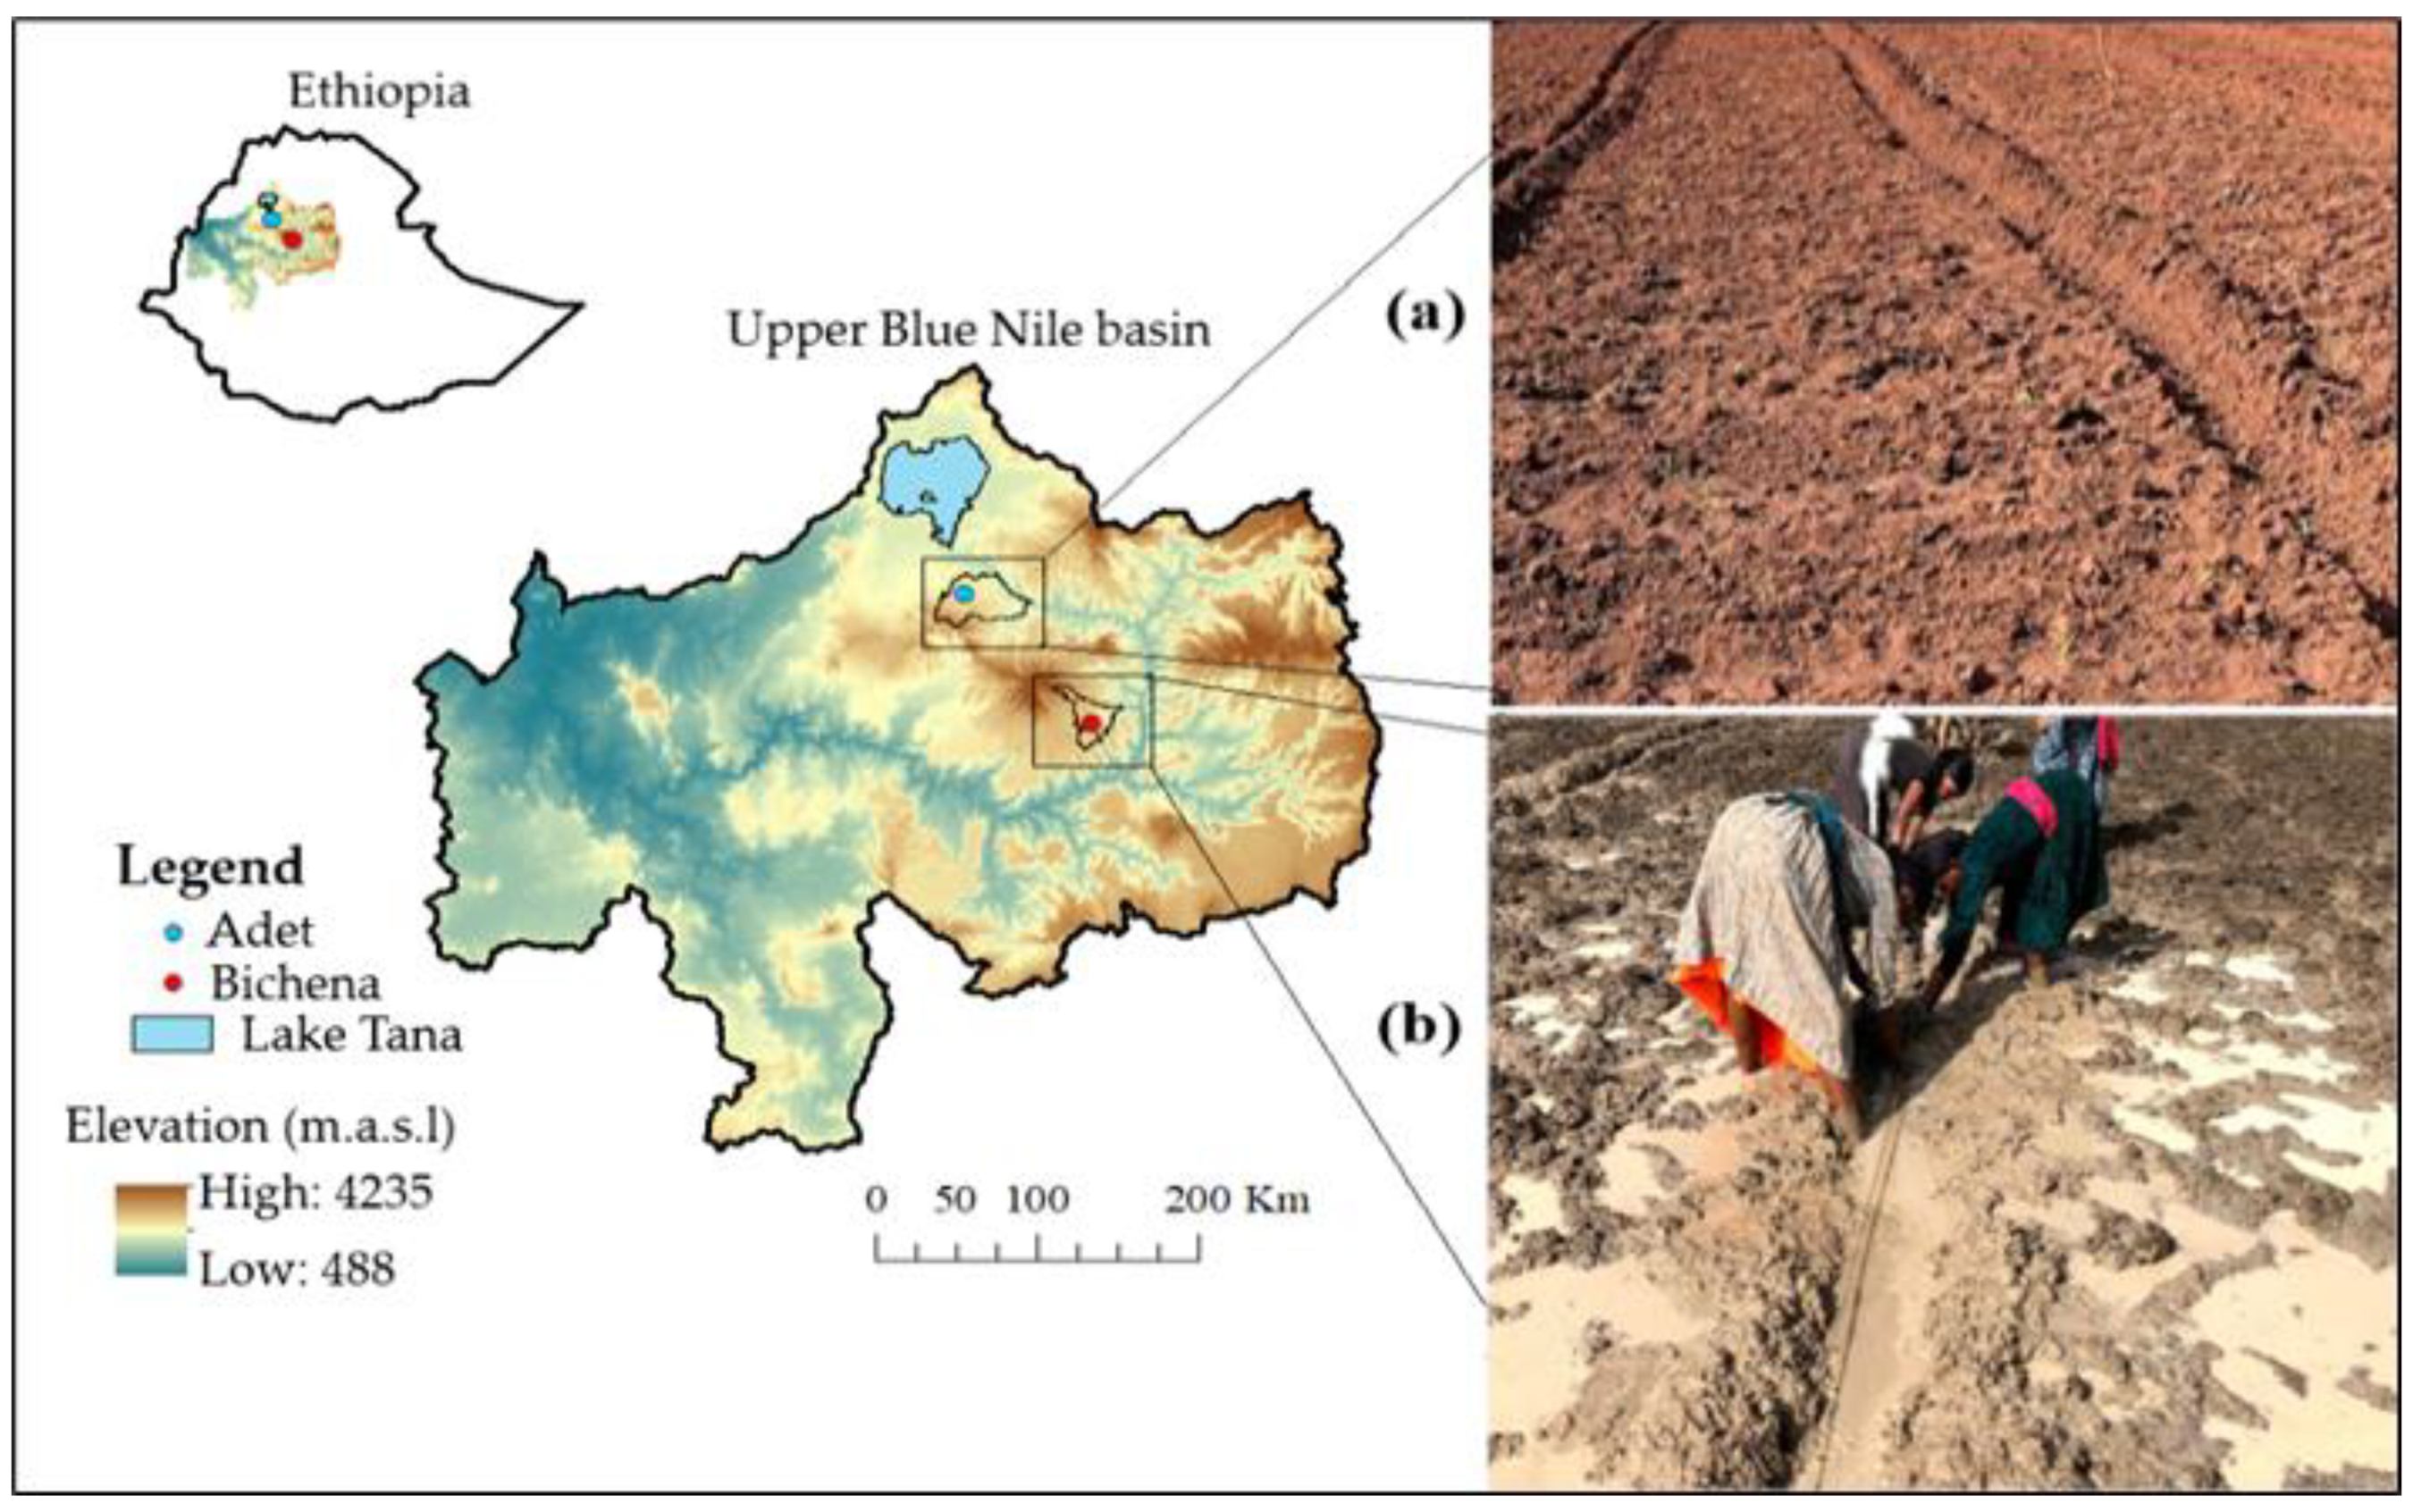
2.1. Description of Experimental Sites and Materials

Two separate experiments were carried out. A pot experiment—hereafter, intensive growing condition—which was conducted at Adet Agricultural Research Center, Ethiopia in a screenhouse with full irrigation, high fertilizer rate application, and lodging controlled by providing a string support during 2017/18 off-season (December 2017 to May 2018). The second, field experiment with conventional management—hereafter, field growing condition—was conducted at two representative teff growing locations of Ethiopia. The same 317 teff genotypes were used for both experiments except three improved cultivars added in the field experiment. The locations were Adet (11°28′ N, 37°48′ E; 2216 m above sea level) and Bichena (10°46′ N, 38°19′ E; 2541 m above sea level) during the 2018 and 2019 main cropping seasons. Adet represents the Nitosol teff production areas whereas Bichena represents poorly drained Vertisol production areas (Figure 1). Adet received about 1512 mm annual rainfall, whereas Bichena received about 1156 mm with 75% comes from June to September. The average minimum temperature which is about 11 °C was similar at both locations. The maximum average temperature was 26 °C and 24 °C at Adet and Bichena, respectively. The germplasm panel used in this study was composed of 312 landrace collections from different teff growing regions of Ethiopia with an altitude range of 1200 to 3000 m above sea level, 2 breeding lines, and 6 improved cultivars (Kora, Quncho, Etsube, Abola, Dega-Tef, and DZ-Cr-37). The genotypes were accessed from Adet Agricultural Research Center, Ethiopian Biodiversity Institute, and Debre Zeit Agricultural Research Center. Seeds of all the landrace accessions were derived from individual panicle selections with a subsequent purification so that true to types were maintained. The seeds of improved cultivars were taken from the breeder seed stocks of Adet Agricultural Research Center.

2.2. Experimental Set Up and Management

2.2.1. Intensive Growing Condition

Non-transparent pots of 22 cm surface diameter and 18 cm depth were filled with soil leaving the top 3 cm empty for proper watering. The soil from the same paddock of Adet experimental station taken from the forest area within the top 10 cm depth was mixed with chicken manure in a 10:1 ratio. In total, 317 teff genotypes (312 landrace collections, 2 breeding lines, and 3 improved cultivars) were used for this particular study. The genotypes were assigned to each pot following the randomized complete block design with two replications. Folded blocks were created with 50 pots aligned in one row. Prior to planting, the pots were watered three days and planting was done on the fourth day at a seeding rate of 10 kg/ha. NPKS fertilizers were applied in the rate of 194, 120, 46, and 22 kg/ha respectively. The whole P and S, one-fifth of the N, and half of the K were applied at planting, while the remaining K and two-fifths of the N were applied at early tillering stage and the last two-fifths of the N was applied at early flowering stage. After two weeks from emergence, thinning was carried out to keep only 10 seedlings per pot. Each pot was watered on a daily basis with roughly equal volume of tap water to avoid moisture stress throughout the growing period. To reduce the effect of lodging, string supports at four different heights spanning 30 cm following the growth stage of the crop were made.

2.2.2. Field Growing Condition

The same genotypes used in the intensive growing condition and three additional improved cultivars (Kora, DZ-Cr-37, and Dega-tef)—in total 320 teff genotypes—were planted in an 8 × 40 alpha lattice design with two replications. Each plot was 2 m long and 0.6 m wide and composed of three rows with 0.2 m spacing between rows. Following the local farming practice, teff sowing was done in mid-July at Adet station and in the first week of August at Bichena station in both experimental years. Teff seeds were sown in each row by hand drilling and three weeks after seedling emergence, thinning and transplanting were carried out to maintain 8 cm spacing between plants. N, P, and S fertilizers were applied in the form of urea (46% N) and NPS (19% N, 38% P, 7% S). N was applied at 64.5 kg/ha at Adet and 87.5 kg/ha at Bichena. Equal rates of P (60 kg/ha) and S (11 kg/ha) were applied at both stations. The whole P and S and half of the N were applied at planting, while the last half split of the N was applied at the tillering stage. All other field management practices were applied as per the recommendations of the crop.

2.3. Data Collection and Measurements

In both experiments, the heading date was taken when approximately 50% of the plants in the experimental units (plot/pot) had emerged heads, whereas the maturity date was determined when 90% of the plants in the plot reached physiological maturity or when the stem turns to golden yellow color. The plant height, panicle length, panicle weight, and peduncle length were measured on five representative plant samples. In both experiments, all plants in each experimental unit were harvested, threshed, and cleaned by hand. The grain yield per plot/pot was then converted into grain yield per plant according to the stand counts at harvest. The biomass yield was recorded after sufficient sun dying of the harvested samples.

2.4. Statistical Data Analysis

Single environment and combined over environments analysis of variance were computed following the Proc ANOVA (analysis of variance) model of the alpha lattice design for the field growing condition experiment data and Proc ANOVA model of the randomized complete block design for the intensive growing condition experiment using the Statistical Analysis System software program [28]. The genotypic, environmental, genotype by environment interaction, and residual variance components were determined using META-R software program of CIMMYT (CIMMYT, Mexico City, Mexico) using the residual maximum likelihood (REML) method [29]. Broad sense heritability (H) as a ratio of genotypic variance (σ2G) to phenotypic variance (σ2P) was computed using the same META-R software program with the best linear unbiased predictors (BLUP) procedure. The phenotypic variance under the intensive growing condition ( σ P i 2 ) and under the field growing conditions combined over environments ( σ P i j 2 ) were estimated using the formula in Equations (2) and (3), respectively, as outlined in [30,31]. The genotypic coefficient of variation (GCV), phenotypic coefficient of variation (PCV), and genetic advance as percent of mean (GA) assuming 5% selection intensity were calculated with the formula described in [32] as indicated in Equations (1), (4), and (5), respectively. Clustering of accessions based on grain yield and related traits was carried out using agglomerative hierarchical clustering procedure with square Euclidean distance as a measure of dissimilarity and incremental sum squares as a grouping strategy in the R software program.
  GCV = σ G 2 x ¯ × 100
σ P i 2 = σ G 2 + σ e 2 r
σ P i j 2 = σ G 2 + σ G E 2 l + σ e 2 r l
P C V = σ P 2 x ¯ × 100
G A = K × H × σ P 2 x ¯ × 100
where σ e 2 , σ G E 2 x ¯ , r, l represents the residual variance, variance due to genotype by environment interaction, grand mean of the trait, number of replications, and number of environments, respectively, and K is the selection differential having a value of 2.06 at 5% selection intensity.

3. Results

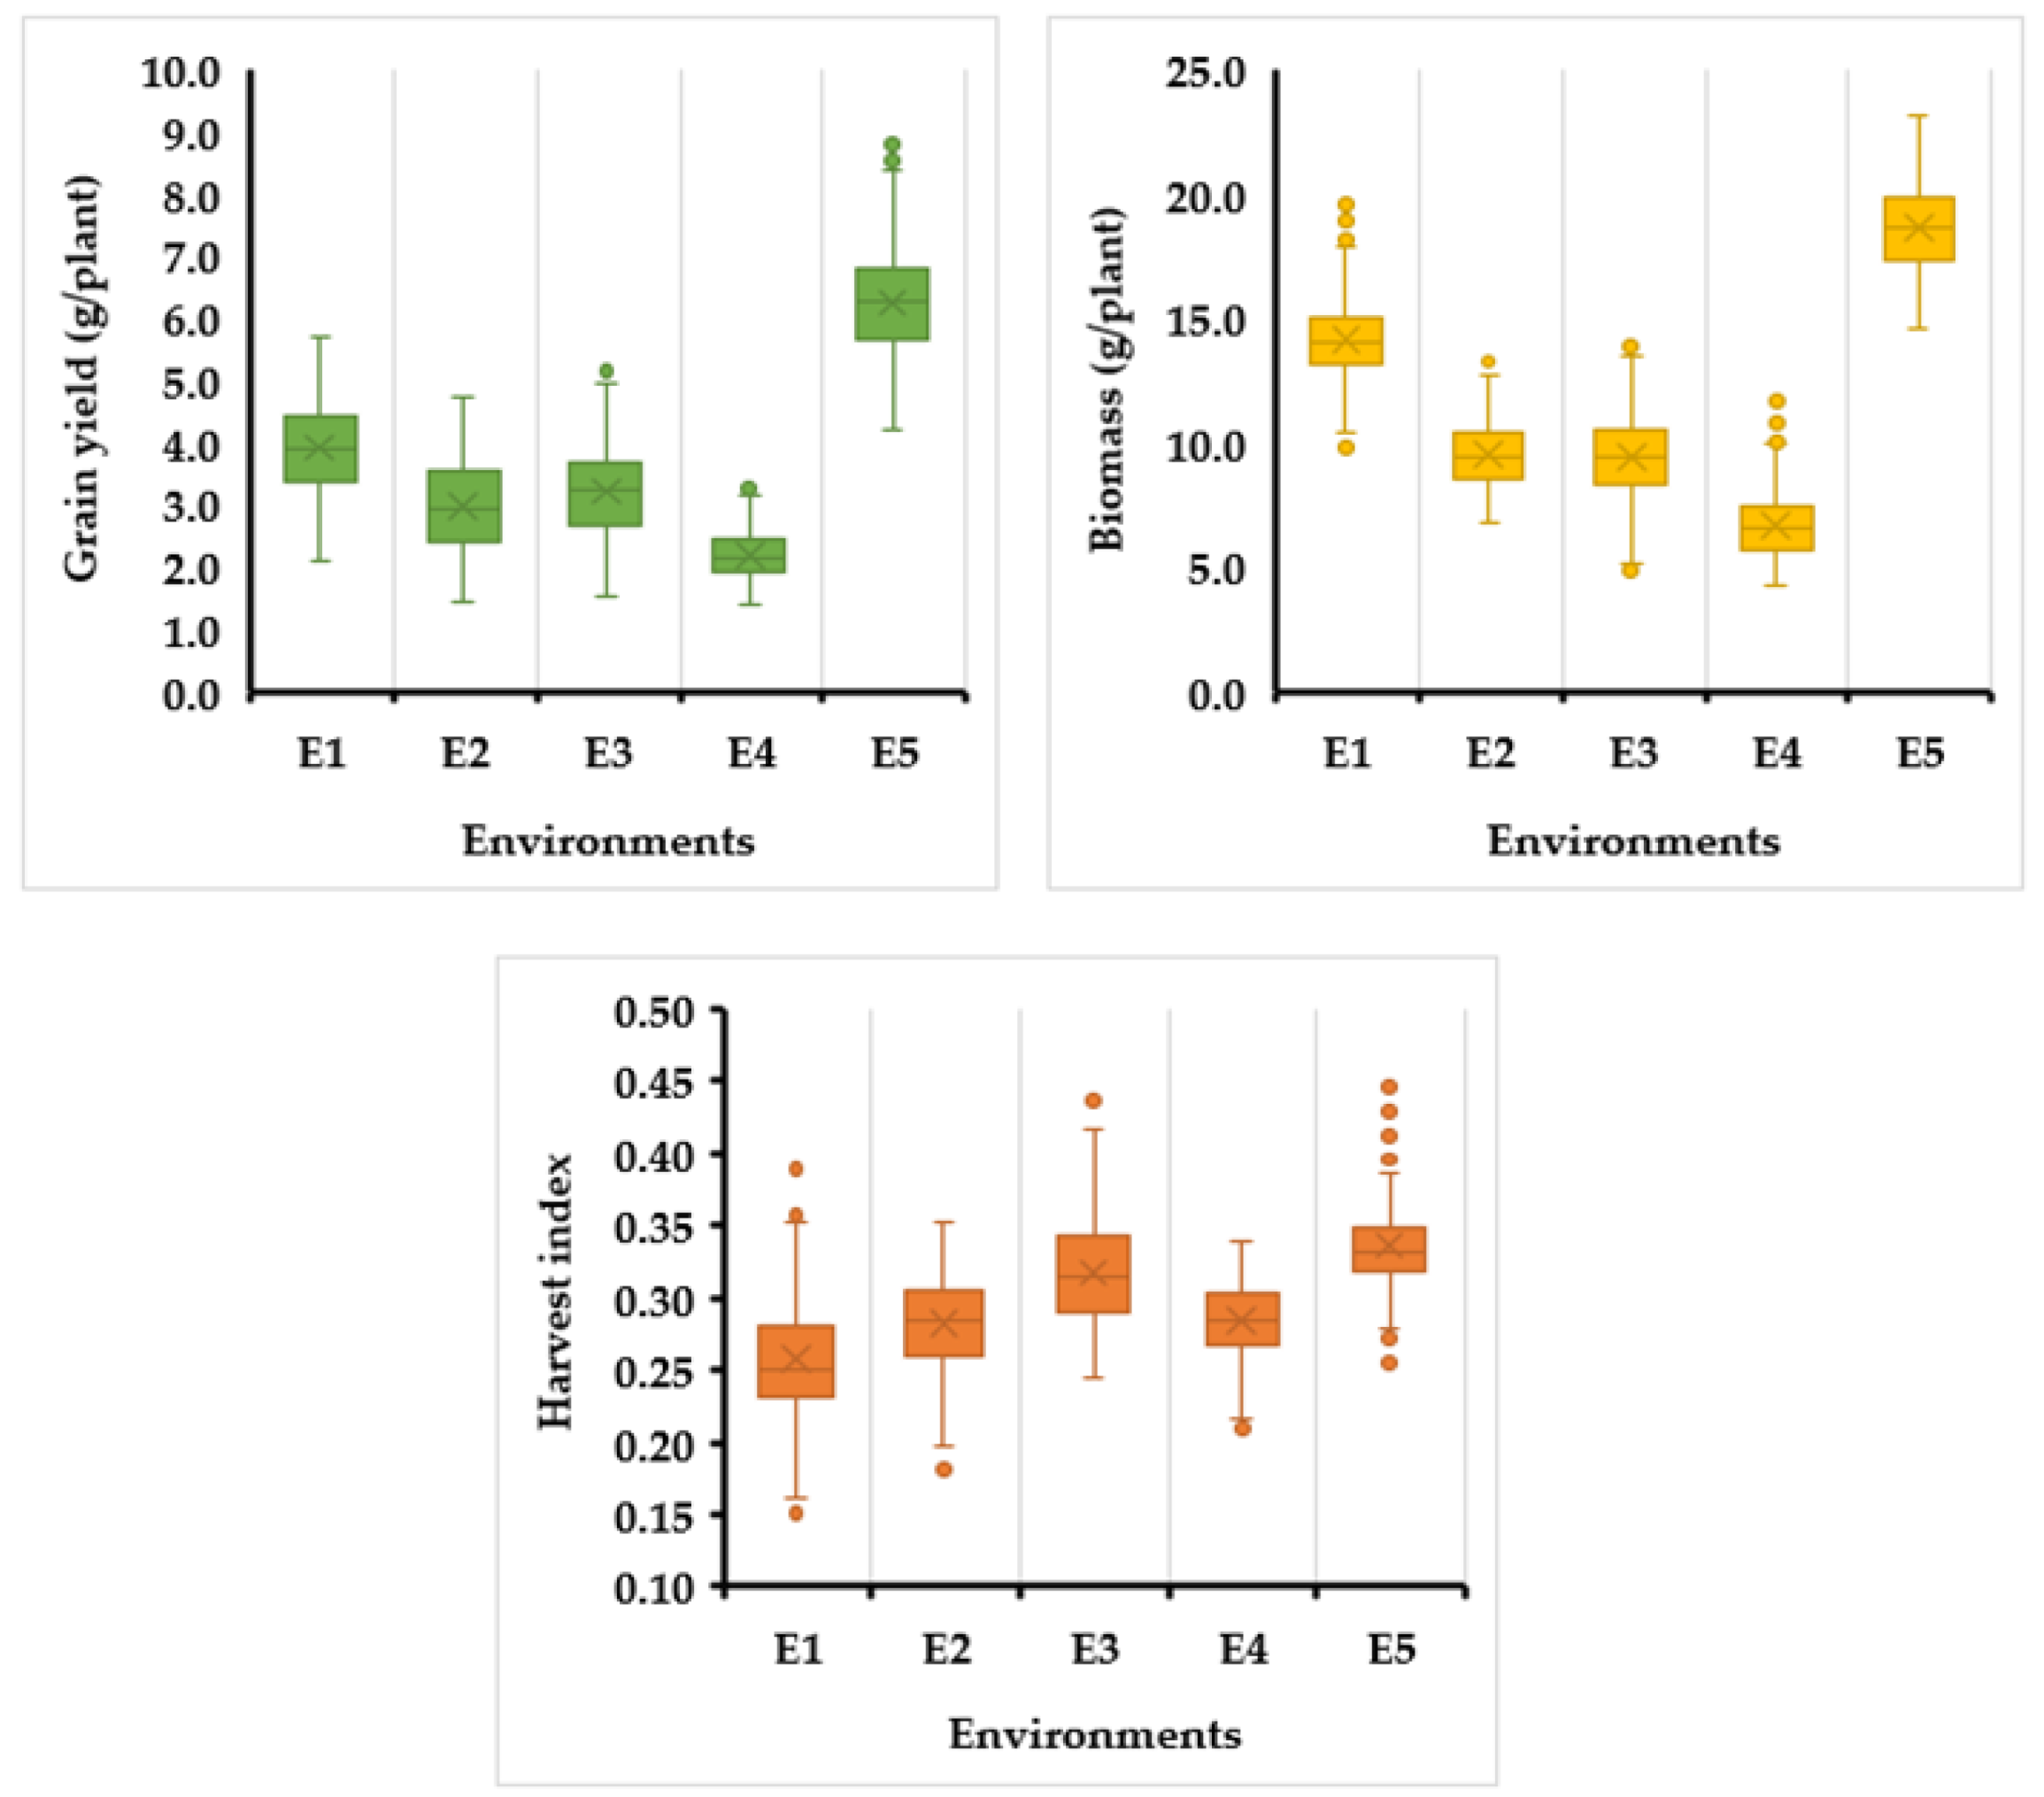
3.1. Grain Yield, Biomass, and Harvest Index

The analysis of variance results in the intensive growing condition revealed a highly significant difference (p < 0.01) among the test genotypes for grain yield, biomass, harvest index, and all other yield-related traits considered in this study. The performance of the top ten high yielding genotypes, cultivars, and the bottom three low yielding genotypes under the intensive growing condition are presented in Table 1. The grain yield performance of the test genotypes ranged from 4.2 to 8.8 g/plant with overall mean yield of 6.2 g/plant. Accession 242138-1, 236756-2, and 242200-1 were among the top yielding genotypes, whereas accession 55069-3, 239373-2, and 219850-1 were among the low yielding genotypes. Among the improved cultivars included in this study, Etsub recorded about 6.7 g/plant, while Quncho and Abola each gave about 6.4 g/plant grain yield which is equivalent to the overall mean grain yield. BLUP-adjusted mean grain yield also showed nearly 30% yield advantage of the high yielding genotypes over the best yielding cultivar. The above ground biomass yield ranged from 14.6 g/plant to 23.1 g/plant (Table S1). Accession 234431-1 and 229971-2 were the lowest in biomass yield while accession 204596-3 and 234430-1 were the highest in biomass. The harvest index ranged from 0.25 to 0.45 with a mean value of 0.34 (Table S1). Under the intensive growing condition, high yielding genotypes showed higher harvest index, tall plant stature, and relatively late maturing with high grain filling period.
In the field growing condition, single environment analysis of variance showed a highly significant variation (p < 0.01) among the genotypes for grain yield, biomass, and harvest index (data not presented). Similarly, the combined analysis of variance showed a highly significant difference among the genotypes for all the traits considered in this study. BLUP-adjusted mean genotype performance across the four environments indicated that accession 229971-3, and 236765-3 were the highest yielding genotypes with 10% yield advantage over the best yielding improved cultivar (Table 2). The grain yield performance of the genotypes combined over the four environments ranged from 1.8 g/plant to 4.3 g/plant with a mean value of 3.1 g/plant. Among the improved cultivars, the highest grain yield was recorded with the cultivar Estub about 3.9 g/plant with 12.8 g/plant biomass yield and 0.30 harvest index. Quncho, one of the most widely grown improved cultivar gave about 3.0 g/plant grain yield. The biomass yield was ranged from 7.4 g/plant to 13.5 g/plant with a mean value of 10.7 g/plant (Table S2). The harvest index ranged from 0.23 to 0.34 with an overall mean value of 0.29. Maximum grain yield about 5.7 g/plant was recorded at Adet during the 2018 season whereas the least, 1.4 g/plant, was at Bichena during 2019 season (Figure 2). Generally, the average grain yield of the two seasons at the Nitosol location (Adet) was higher (3.5 g/plant) than the Vertisol location (2.7 g/plant). However, the harvest index was higher in the Vertisol location (0.30) than the Nitosol location (0.27). The environmental and the genotype by environment interaction effect were also highly significant on the genotypes tested for grain yield, biomass, harvest index, and other yield related traits.

3.2. Phenology

The analysis of variance in both growing conditions showed a highly significant difference (p < 0.01) among the genotypes for days to heading, days to maturity, and grain filling period. Under the intensive growing condition, days to heading of the test genotypes ranged from 51 to 73 days with overall average of 60 days (Table S1). Accession 237709-2, 237572-1, and 234431-1 were among the early genotypes, whereas 212930-4, 212929-1, and 239373-2 were among the late heading genotypes. The maturity date ranged from 107 to 140 days with average value of 121 days. The grain filling period, the number of days from heading to maturity, ranged from 35 to 79 days (Table S1). Under the field growing condition, the early genotype took about 51 days to heading and 108 days to maturity with 53 days for grain filling (Table S2) whereas the late maturing genotypes took about 66 days to heading and 131 days to maturity. Accession 234431-1 and 204569-1 were early and 203008-5, 229766-5, and 234782-2 were late maturing genotypes. Despite the rank differences, most of the early genotypes performed consistently across the two growing conditions while considerable rank difference was noted among the late genotypes across the two growing conditions. It was also noted that most early genotypes were associated with short plant stature.

3.3. Variance Components, Heritability, and Genetic Advance

Estimates of genetic parameters and mean squares of the important traits in the intensive growing condition are summarized in Table 3. Among the traits, peduncle length and harvest index showed the lowest heritability, 0.59 and 0.67, respectively. Genetic advance generally ranged from moderate to high. The lowest genetic advance was observed for days to maturity and days to heading whereas the highest genetic advance was observed in grain filling period, grain yield, panicle length, and panicle weight. Grain filling period, grain yield, panicle length, and panicle weight also showed the highest coefficient of genetic variation, while the days to maturity and days to heading were the lowest in genetic coefficient of variation. The grain filling period which varied from 35 to 79 days showed the highest genetic coefficient of variation, and heritability with the highest genetic advance. On the other hand, the genetic coefficient of variation for the harvest index was small, 8.82% with a genetic advance of 15.2%.
Estimates of genetic parameters and mean squares of the combined analysis of variance in the field growing condition are summarized in Table 4. The variance component partitioning indicated that the environmental variance was consistently higher than the genotypic variance for all the traits considered (data not presented). Consequently, the phenotypic coefficient of variation surpassed the genotypic coefficient of variation. The phenological traits such as days to heading, days to maturity, and grain filling period showed the lowest genotypic coefficient of variation with higher heritability value. On the other hand, grain yield and panicle weight showed the highest coefficient of genetic variation. Therefore, the genetic advance under selection was higher for grain yield and panicle weight, but it was the lowest for phenological traits. Harvest index showed the least heritability compared to other traits with 13.9% genetic advance.

3.4. Phenotypic and Genotypic Correlations

The phenotypic and genotypic correlation coefficients of grain yield and related traits under the intensive growing condition are presented in Table 5. Days to maturity showed a highly significant positive phenotypic and genotypic correlation with grain yield, biomass, and harvest index. Except non-significant negative phenotypic correlation with biomass, days to heading generally showed a significant negative phenotypic and genotypic correlation with grain yield, biomass, and harvest index. Similarly, the grain filling period, plant height, panicle length, and panicle weight showed a highly significant positive phenotypic and genotypic correlation with grain yield, biomass, and harvest index. However, the correlation of harvest index with panicle length and panicle weight was significant at 0.05 p-value. Grain filling period also showed a highly significant negative genotypic and phenotypic correlation with days to heading, whereas positive and highly significant correlation with days to maturity. The genotypic correlation of harvest index with grain yield and biomass was positive and significant but negligible phenotypic correlation with biomass. The peduncle length showed a negligible correlation with most of the traits considered in this study, except a positive significant correlation with days to heading.
Correlation coefficients based on the combined data under the field growing condition are presented in Table 6. Days to heading showed negative significant phenotypic and genotypic correlation with grain yield and harvest index, whereas its correlation with the biomass yield was non-significant. Days to maturity showed a non-significant correlation with grain yield and harvest index, but a positive significant correlation with biomass yield. Days to maturity, on the other hand, showed a highly significant positive phenotypic and genotypic correlation with grain filling period. Although the magnitude is small, the grain filling period correlated positively and significantly with grain yield, biomass, and harvest index. Both plant height and panicle length showed a highly significant positive correlation with biomass yield, significant correlation with grain yield, but negative significant correlation with harvest index. Panicle weight showed a positive significant correlation with biomass and grain yield, but non-significant with harvest index. The correlation between biomass yield and harvest index was positive and significant. A significant negative phenotypic and genotypic correlation was observed between peduncle length and panicle length. Correlation coefficients based on individual location data are presented in Table S3. The phenotypic correlation between biomass and harvest index was significantly negative at Adet but significantly positive at Bichena. Plant height and panicle length showed a highly significant negative genotypic correlation with harvest index at Adet, but non-significant at Bichena. Similarly, the relationship between panicle weight and harvest index was highly significantly negative at Adet but significantly positive at Bichena.

3.5. Cluster Analysis

The hierarchical cluster analysis using Ward’s method in the intensive growing condition revealed 7 different groupings of the 317 teff genotypes with 16 to 89 member genotypes (dendrogram not presented). The cluster mean values of the 10 important traits under the intensive growing condition are summarized in Table 7, and cluster members are reported in Supplementary Table S4. Cluster-I particularly composed of teff genotypes with shorter peduncle length and moderate grain yield. Most members in cluster-II were characterized by high in biomass yield, longer grain filling period, and late to mature. Cluster-III consisted of higher grain yielding, higher harvest index, and late maturing member genotypes. Cluster-VII consisted of genotypes with shorter grain filling period due to late heading date of the member genotypes, and lower harvest index and grain yield. Similarly, cluster-V consisted of low yielding genotypes with early heading date and shorter grain filling period. Cluster-VI consisted of genotypes with longer peduncle length, moderate grain yield, and average harvest index.
Under the field growing condition, six clusters were identified with 27–109 member genotypes (data not presented). Cluster-I and cluster-VI were both characterized by shorter plant height, lower panicle weight, and lower grain yield (Table 8). However, cluster-VI was different from cluster-I having member genotypes with shorter panicle and relatively better harvest index. Cluster-II composed of higher grain yielding, tall plant stature, higher in panicle weight, longer panicle, and late maturing genotypes. Cluster-V included late heading genotypes with intermediate plant height, longer panicle length and shorter peduncle length. Whereas cluster-III consisted of genotypes with longer peduncle length with intermediate plant height. Among the improved cultivars, Etsub and Kora were grouped together with the high yielding genotypes under cluster-II. On the other hand, relatively older cultivars such as DZ-Cr-37 and Dega-tef were grouped under cluster-III where the second-high yielding and intermediate plant height genotypes included.

4. Discussion

Understanding the existing genetic potential which is highly influenced by the yielding ability of the cultivar could play an important role in designing appropriate use of genetic variations in the breeding program. Thus, assessment of the genetic potential of teff genotypes could improve the breeding efficiency and increase the yield gains of the subsequent selection [33]. For example, a strong positive correlation between grain yield in irrigated and non-irrigated growing conditions reported in [7] suggests yield potential itself determines the farm-gate yield that farmers could harvest. Similarly, our results showed positive correlation between the grain yield under intensive and field growing conditions (r = 0.17, p < 0.05). This positive correlation signifies the possibility of the presence of genotypes that perform consistently well under both growing conditions. The grain yield performance of genotypes was elevated from 3.1 g/plant under the field growing condition with conventional management to 6.2 g/plant in the intensive growing condition when lodging was artificially controlled. The mean grain yield performance of genotypes in the field growing condition of this study was higher than the previous reports [20,34]. Compared to the respective improved cultivars included, 30% yield advantage of the top yielding genotypes over the best yielding improved cultivar was observed in the intensive growing condition. However, this advantage has diminished to 10% in the field growing condition with conventional management. This clearly indicates that the actual yield is by far lower than the genetic potential due to poor management practices used and lodging susceptibility. Poor agronomic practices have been mentioned as the major factor that limits improved cultivars to express their maximum genetic ceiling and increased yield gaps in the developing countries [35]. The observed high genetic coefficient of variation, heritability, and the corresponding genetic advance for grain yield and important related traits such as panicle length and weight in this study witnessed the immense genetic diversity and the potentials for further improvement of teff through desirable trait recombination and selection.
Harvest index was higher in the intensive growing condition compared to the field experiment which is in agreement with previous results that prevail harvest index is generally higher in favorable growing environments [36]. Similarly, a relatively higher harvest index of teff has been reported when the supplemental irrigation frequency increased in the semi-arid areas of Ethiopia [37]. Contrary to the present results under field condition, [38] reported lower heritability for harvest index but equivalent genetic advance under selection as percent of the mean. On the other hand, [25] reported lower heritability but higher genetic advance for harvest index. This discrepancy might arise due to differences in the genotypes used. This further emphasizes the need of combined use of both higher heritability and genetic advance during decision making for selection as it is also outlined by [31]. The wider range and relative increase of harvest index under the intensive growing condition when lodging being controlled (0.25–0.45) over that of field growing condition with conventional management (0.23–0.34) might indicate the existing genetic potential to improve the harvest index of teff. However, its positive correlation with plant height might complicate the improvement of harvest index in teff due to lodging. In addition, the observed significant positive genotypic and phenotypic correlations of both panicle length and weight with harvest index under the intensive growing condition, but negative significant correlation of the harvest index with panicle length and a negligible correlation with panicle weight under the field growing condition indicates how improved crop management and lodging control options could alter the harvest index.
In a crop–livestock mixed farming system, particularly in the drylands of Ethiopia, crop residues played an important role as the livestock feed [39,40]. The teff straw is repeatedly reported as a well-known feed resource for animals [41,42] mainly during the dry season when the availability of pasture is limited and as a supplement during the rainy season when pasture is available [43]. Therefore, with respect to the livelihood of small-scale farmers in Ethiopia, straw yield is as important as grain yield. Despite that fact, however, straw yield is rarely considered a target trait for teff improvement. Taking this into account, our results demonstrated a wide genotypic variability for dry above ground biomass production and straw yield of teff with high heritability and moderate genetic advance. This finding, coupled with the modest but significant positive correlation between aboveground biomass and grain yield under the intensive growing condition, suggests the opportunity to improve both grain yield and straw yield to a certain extent. This is mainly due to the strong positive correlation of plant height with both grain yield and above ground biomass. Although [44] and [20] identified relatively better lodging tolerance in the tall plant stature teff genotypes, this kind of correlation might not be desirable in the practical point of view mainly because an increase in plant height could aggravate lodging severity in most cereal crops [45,46]. Previous reports [26,44] indicated improved teff cultivars are tall in plant height. This might be due to selection for higher grain yield alone without considering the harvest index as an important component of the selection tool kit favored tall genotypes.
Under the current and future unpredictable weather conditions combined with restricted adaptation range of cultivars, growing opportunities of the traditional cultivars of several crop species will be limited. Recently, [47] pointed out that the suitability of teff cultivation in Ethiopia will decrease due to elevated temperature, causing production to decline in the future. In this regard, adjusting the phenology of the new cultivars would reduce the risk and maximize the yield gain. The genotypic coefficient of variation for days to heading and maturity was relatively low compared to other traits under both the intensive management and field growing conditions. Similarly, lower genetic coefficient of variation for phenological traits have been reported in teff and white lupin [23,34,48]. However, the observed wide range and moderate expected genetic advance with high heritability of days to heading and maturity, and the highest genetic coefficient of variation and genetic advance in grain filling period under the intensive growing condition could suggest the presence of sufficient diversity to develop teff cultivars suitable to the prevailing weather variabilities of the target mega-environments. More specifically, this diversity in teff might enable the development of early maturing cultivars with better yield performance that could adapt better in the dryland areas where rain fall is erratic and unpredictable. In the Mediterranean environments for example, yield improvement in wheat and barley has been achieved through early cultivar development [49,50,51]. Early maturing cultivars could therefore be used to intensify the agricultural system by adopting double and relay cropping systems. It could also play a significant role in reducing the risk associated with failure of the main crop due to intermittent drought or other environmental hazards as both practices are common in Ethiopia [52]. The negative correlation between days to heading and harvest index indicates that shortening the vegetative growth period in teff increases the grain filling period which in turn creates a good opportunity to enhance the harvest index provided lodging being controlled. The strong positive correlation of the grain filling period with both grain yield and harvest index in the intensive growing condition implies grain yield of teff could be maximized by selecting early heading but late maturing genotypes in suitable environments where rainfall is sufficient or irrigation water is available.
The important features of conventional breeding are the identification, creation, and exploitation of heritable genetic variations for desirable traits. The common way of doing this is assessing the diversity within the landrace collections of a species. Multivariate analysis, such as clustering and principal component analysis, of a large number of genotypes could provide ample information about which genotypes to select as a potential parental line for recombination. The cluster analysis in this study grouped the teff genotypes into seven and six clusters under the intensive and field growing conditions, respectively. In both growing conditions, high yielding genotypes were tall in plant stature, late maturing, and had relatively higher harvest index. Similarly, [20] reported high yielding teff genotypes were associated with tall plant height and late maturity. The current results demonstrated the presence of wide genetic diversity in the yielding potential of teff.

5. Conclusions

The coefficient of genetic variation, heritability, and expected genetic advance for grain yield were the highest in both experiments. Among the phenological traits, the grain filling period in the intensive growing condition exceptionally showed the highest genetic coefficient of variation, heritability, and genetic advance. This signifies the presence of immense genotypic variation for important traits. The high grain yield performance and wider range of the harvest index observed under the intensive growing condition further indicates the extent of genetic potential available in the teff germplasm collections. However, its strong positive correlation with plant height could limit the selection efficiency of the conventional breeding approach. Thus, desirable trait recombination and selection for high grain yield together with higher harvest index could benefit the future breeding program. Therefore, to exploit the genetic potential and narrow the yield gaps, improving the harvest index of teff should come to the front page.

Supplementary Materials

The following are available online at https://www.mdpi.com/2073-4395/11/2/220/s1, Table S1: Descriptive statistics of grain yield and related traits of 317 teff genotypes under the intensive growing condition, Table S2: Descriptive statistics of grain yield and related traits of 320 teff genotypes under the field growing condition (combined across locations and years), Table S3: Individual location based genotypic (above diagonal) and phenotypic (below diagonal) correlation coefficients of important traits of 320 teff genotypes under the field growing condition, Table S4: Cluster members of the 317 teff genotypes under the intensive growing condition.

Author Contributions

Conceptualization, M.B., N.H., G.A., W.T., and A.T. (Asaminew Tassew); data curation, M.B. and F.A.; validation, A.T. (Atsushi Tsunekawa), N.H., and M.T.; methodology, M.B., G.A., T.M., W.T., and T.I.; formal analysis, M.B.; investigation, M.B.; resources, A.T. (Atsushi Tsunekawa), E.A., N.H., and M.T.; writing—original draft preparation, M.B.; writing—review and editing, A.T. (Atsushi Tsunekawa), N.H., G.A., M.T., T.I., and E.A.; supervision, A.T. (Atsushi Tsunekawa), N.H., T.M., and G.A.; project administration, A.T. (Atsushi Tsunekawa), E.A., N.H., and A.T. (Asaminew Tassew); funding acquisition, A.T. (Atsushi Tsunekawa), N.H., and E.A. All authors have read and agreed to the published version of the manuscript.

Funding

This research was funded by the Science and Technology Research Partnership for Sustainable Development (SATREPS), Grant Number JPMJSA1601, Japan Science and Technology Agency (JST)/Japan International Cooperation Agency (JICA).

Institutional Review Board Statement

Not applicable.

Informed Consent Statement

Not applicable.

Data Availability Statement

Data will be available without any reservations by the authors to qualified researchers.

Acknowledgments

We are indebted to acknowledge Adet and Debre-Zeit Agricultural Research Centers of Ethiopia for the kind provision of the germplasms. The members of the project management office, College of Agriculture and Environmental Sciences, of Bahir Dar University, and Adet Agricultural Research Center staff, thank you very much for coordinating the work and providing technical assistance. Special thanks to Amlaku Teshager and Atinkut Fentahun for their follow-up and technical assistance during the field work.

Conflicts of Interest

The authors declare no conflict of interest.

References

  1. Kurukulasuriya, P.; Rosenthal, S. Climate Change and Agriculture: A Review of Impacts and Adaptations; The World Bank: Washington, DC, USA, 2013. [Google Scholar]
  2. Cleland, E.E.; Chuine, I.; Menzel, A.; Mooney, H.A.; Schwartz, M.D. Shifting plant phenology in response to global change. Trends Ecol. Evol. 2007, 22, 357–365. [Google Scholar] [CrossRef]
  3. He, W.; Liu, Y.; Sun, H.; Taghizadeh-Hesary, F. How Does Climate Change Affect Rice Yield in China? Agriculture 2020, 10, 441. [Google Scholar] [CrossRef]
  4. Tadele, Z. Orphan crops: Their importance and the urgency of improvement. Planta 2019, 250, 677–694. [Google Scholar] [CrossRef] [PubMed] [Green Version]
  5. Foulkes, M.J.; Slafer, G.A.; Davies, W.J.; Berry, P.M.; Sylvester-Bradley, R.; Martre, P.; Calderini, D.F.; Griffiths, S.; Reynolds, M.P. Raising yield potential of wheat. III. Optimizing partitioning to grain while maintaining lodging resistance. J. Exp. Bot. 2011, 62, 469–486. [Google Scholar] [CrossRef] [PubMed] [Green Version]
  6. Alexandratos, N.; Bruinsma, J. World Agriculture towards 2030/2050: The 2012 Revision; FAO: Rome, Italy, 2012. [Google Scholar]
  7. Hawkesford, M.J.; Araus, J.-L.; Park, R.; Calderini, D.; Miralles, D.; Shen, T.; Zhang, J.; Parry, M.A.J. Prospects of doubling global wheat yields. Food Energy Secur. 2013, 2, 34–48. [Google Scholar] [CrossRef]
  8. Rose, T.; Kage, H. The Contribution of Functional Traits to the Breeding Progress of Central-European Winter Wheat Under Differing Crop Management Intensities. Front. Plant. Sci. 2019, 10, 1521. [Google Scholar] [CrossRef] [PubMed] [Green Version]
  9. Lin, M.; Huybers, P. Reckoning wheat yield trends. Environ. Res. Lett. 2012, 7. [Google Scholar] [CrossRef]
  10. Ray, D.K.; Mueller, N.D.; West, P.C.; Foley, J.A. Yield Trends Are Insufficient to Double Global Crop Production by 2050. PLoS ONE 2013, 8, e66428. [Google Scholar] [CrossRef] [Green Version]
  11. Austin, R.B.; Bingham, J.; Blackwell, R.D.; Evans, L.T.; Ford, M.A.; Morgan, C.L.; Taylor, M. Genetic improvements in winter wheat yields since 1900 and associated physiological changes. J. Agric. Sci. 1980, 94, 675–689. [Google Scholar] [CrossRef]
  12. Long, S.P. We need winners in the race to increase photosynthesis in rice, whether from conventional breeding, biotechnology or both. Plant Cell Environ. 2014, 37, 19–21. [Google Scholar] [CrossRef]
  13. Lee, H.; Teff, A. Rising Global Crop: Current Status of Teff Production and Value Chain. Open Agric. J. 2018, 12, 185–193. [Google Scholar] [CrossRef]
  14. Spaenij-Dekking, L.; Kooy-Winkelaar, Y.; Koning, F. The Ethiopian cereal tef in celiac disease. N. Engl. J. Med. 2005, 353, 1748–1749. [Google Scholar] [CrossRef] [PubMed]
  15. Cannarozzi, G.; Plaza-Wüthrich, S.; Esfeld, K.; Larti, S.; Wilson, Y.S.; Girma, D.; de Castro, E.; Chanyalew, S.; Blösch, R.; Farinelli, L. Genome and transcriptome sequencing identifies breeding targets in the orphan crop tef (Eragrostis tef). BMC Genom. 2014, 15, 581. [Google Scholar] [CrossRef] [PubMed] [Green Version]
  16. Zhu, F. Chemical composition and food uses of teff (Eragrostis tef). Food Chem. 2018, 239, 402–415. [Google Scholar] [CrossRef] [PubMed]
  17. Chanyalew, S.; Ferede, S.; Damte, T.; Fikre, T.; Genet, Y.; Kebede, W.; Tolossa, K.; Tadele, Z.; Assefa, K. Significance and prospects of an orphan crop tef. Planta 2019, 250, 753–767. [Google Scholar] [CrossRef] [PubMed] [Green Version]
  18. Assefa, K.; Cannarozzi, G.; Girma, D.; Kamies, R.; Chanyalew, S.; Plaza-Wuthrich, S.; Blosch, R.; Rindisbacher, A.; Rafudeen, S.; Tadele, Z. Genetic diversity in tef [Eragrostis tef (Zucc.) Trotter]. Front. Plant. Sci. 2015, 6, 177. [Google Scholar] [CrossRef] [PubMed] [Green Version]
  19. CSA. Agricultural Sample Survey: Report on Area and Production of Major Crops; Federal Democratic Republic of Ethiopia: Addis Ababa, Ethiopia, 2019. [Google Scholar]
  20. Abraha, M.T.; Shimelis, H.; Laing, M.; Assefa, K. Performance of Tef [Eragrostis tef (Zucc.) Trotter] Genotypes for Yield and Yield Components Under Drought-Stressed and Non-Stressed Conditions. Crop Sci. 2016, 56, 1799–1806. [Google Scholar] [CrossRef]
  21. Evans, L.; Fischer, R. Yield potential: Its definition, measurement, and significance. Crop Sci. 1999, 39, 1544–1551. [Google Scholar] [CrossRef]
  22. Senapati, N.; Semenov, M.A. Large genetic yield potential and genetic yield gap estimated for wheat in Europe. Glob. Food Sec. 2020, 24, 100340. [Google Scholar] [CrossRef]
  23. Abraha, M.T.; Hussein, S.; Laing, M.; Assefa, K. Genetic variation and trait association of tef (Eragrostis tef (Zucc.) Trotter) evaluated under optimal and moisture stressed environments. Aust. J. Crop Sci. 2017, 11, 241–247. [Google Scholar] [CrossRef]
  24. Assefa, K.; Tefera, H.; Merker, A.; Kefyalew, T.; Hundera, F. Variability, heritability and genetic advance in pheno-morphic and agronomic traits of tef [Eragrostis tef (Zucc.) Trotter] germplasm from eight regions of Ethiopia. Hereditas 2001, 134, 103–113. [Google Scholar] [CrossRef] [PubMed]
  25. Ayalew, H.; Genet, T.; Dessalegn, T.; Wondale, L. Multivariate diversity, heritability and genetic advance in tef landraces in Ethiopia. Afr. Crop Sci. J. 2011, 19, 201–212. [Google Scholar]
  26. Teklu, Y.; Tefera, H. Genetic improvement in grain yield potential and associated agronomic traits of tef (Eragrostis tef). Euphytica 2005, 141, 247–254. [Google Scholar] [CrossRef]
  27. Jifar, H.; Assefa, K.; Tadele, Z. Grain yield variation and association of major traits in brown-seeded genotypes of tef [Eragrostis tef (Zucc.) Trotter]. Agric. Food Secur. 2015, 4. [Google Scholar] [CrossRef] [Green Version]
  28. SAS. The SAS System for Windows, Ver. 9.0; SAS Institute Inc.: Cary, NC, USA, 2005. [Google Scholar]
  29. Alvarado, G.; Rodríguez, F.M.; Pacheco, A.; Burgueño, J.; Crossa, J.; Vargas, M.; Pérez-Rodríguez, P.; Lopez-Cruz, M.A. Meta-R: A software to analyze data from multi-environment plant breeding trials. Crop J. 2020, 8, 745–756. [Google Scholar] [CrossRef]
  30. Burton, G.W.; Devane, D.E. Estimating heritability in tall fescue (Festuca arundinacea) from replicated clonal material 1. Agron. J. 1953, 45, 478–481. [Google Scholar] [CrossRef]
  31. Johnson, H.W.; Robinson, H.; Comstock, R. Estimates of genetic and environmental variability in soybeans 1. Agron. J. 1955, 47, 314–318. [Google Scholar] [CrossRef]
  32. Singh, R.K.; Chaudhary, B.D. Biometrical Methods in Quantitative Genetic Analysis; Kalayani Publishers: New Delhi, India, 1985. [Google Scholar]
  33. Rajaram, S. Approaches for breaching yield stagnation in wheat. Genome 1999, 42, 629–634. [Google Scholar] [CrossRef]
  34. Assefa, K.; Ketema, S.; Tefera, H.; Nguyen, H.T.; Blum, A.; Ayele, M.; Bai, G.; Simane, B.; Kefyalew, T. Diversity among germplasm lines of the Ethiopian cereal tef [Eragrostis tef (Zucc.) Trotter]. Euphytica 1999, 106, 87–97. [Google Scholar] [CrossRef]
  35. George, T. Why crop yields in developing countries have not kept pace with advances in agronomy. Glob. Food Secur. 2014, 3, 49–58. [Google Scholar] [CrossRef]
  36. Hay, R. Harvest index: A review of its use in plant breeding and crop physiology. Ann. Appl. Biol. 1995, 126, 197–216. [Google Scholar] [CrossRef]
  37. Araya, A.; Keesstra, S.D.; Stroosnijder, L. Simulating yield response to water of Teff (Eragrostis tef) with FAO’s AquaCrop model. Field Crops Res. 2010, 116, 196–204. [Google Scholar] [CrossRef]
  38. Assefa, K.; Ketema, S.; Tefera, H.; Kefyalew, T.; Chundera, F. Trait diversity, heritability and genetic advance in selected germplasm lines of tef [Emgmstis tef (Zucc.) Trotter]. Hereditas 2000, 133, 29–37. [Google Scholar] [CrossRef] [PubMed]
  39. Funte, S.; Negesse, T.; Legesse, G. Feed resources and their management systems in Ethiopian highlands: The case of Umbulo Whaco watershed in Southern Ethiopia. Trop. Subtrop. Agroecosyst. 2009, 12, 47–56. [Google Scholar]
  40. Duncan, A.J.; Bachewe, F.; Mekonnen, K.; Valbuena, D.; Rachier, G.; Lule, D.; Bahta, M.; Erenstein, O. Crop residue allocation to livestock feed, soil improvement and other uses along a productivity gradient in Eastern Africa. Agric. Ecosyst. Environ. 2016, 228, 101–110. [Google Scholar] [CrossRef]
  41. Mottaleb, K.A.; Rahut, D.B. Household production and consumption patterns ofTeffin Ethiopia. Agribusiness 2018, 34, 668–684. [Google Scholar] [CrossRef]
  42. Mengistu, A. Comparative Supplemental Value of Noug (Guizotia abyssinica) Meal for Fattening Draught Oxen Fed Teff(Eragrostis teff) Straw. J. Appl. Anim. Res. 2003, 24, 85–88. [Google Scholar] [CrossRef]
  43. Gebremariam, T.; Belay, S. Livestock feed resources utilization practices in Tanqua-Abergelle district of Tigray, Northern Ethiopia. Trop. Anim. Health Prod. 2016, 48, 1183–1190. [Google Scholar] [CrossRef]
  44. Bayable, M.; Tsunekawa, A.; Haregeweyn, N.; Ishii, T.; Alemayehu, G.; Tsubo, M.; Adgo, E.; Tassew, A.; Tsuji, W.; Asaregew, F.; et al. Biomechanical Properties and Agro-Morphological Traits for Improved Lodging Resistance in Ethiopian Teff (Eragrostis tef (Zucc.) Trottor) Accessions. Agronomy 2020, 10, 1012. [Google Scholar] [CrossRef]
  45. Jost, M.; Esfeld, K.; Burian, A.; Cannarozzi, G.; Chanyalew, S.; Kuhlemeier, C.; Assefa, K.; Tadele, Z. Semi-dwarfism and lodging tolerance in tef (Eragrostis tef) is linked to a mutation in the alpha-Tubulin 1 gene. J. Exp. Bot. 2015, 66, 933–944. [Google Scholar] [CrossRef] [Green Version]
  46. Madić, M.; Knežević, D.; Paunović, A.; Đurović, D. Plant height and internode length as components of lodging resistance in barley. Acta Agric. Serb. 2016, 21, 99–106. [Google Scholar] [CrossRef]
  47. Woldeyohannes, A.B.; Accotto, C.; Desta, E.A.; Kidane, Y.G.; Fadda, C.; Pè, M.E.; Dell’Acqua, M. Current and projected eco-geographic adaptation and phenotypic diversity of Ethiopian teff (Eragrostis teff) across its cultivation range. Agric. Ecosyst. Environ. 2020, 300. [Google Scholar] [CrossRef]
  48. Atnaf, M.; Tesfaye, K.; Dagne, K.; Wegary, D. Genotype by trait biplot analysis to study associations and profiles of Ethiopian white lupin (Lupinus albus L.) landraces. Aust. J. Crop Sci. 2017, 11, 55–62. [Google Scholar] [CrossRef]
  49. Francia, E.; Tondelli, A.; Rizza, F.; Badeck, F.W.; Li Destri Nicosia, O.; Akar, T.; Grando, S.; Al-Yassin, A.; Benbelkacem, A.; Thomas, W.T.B.; et al. Determinants of barley grain yield in a wide range of Mediterranean environments. Field Crops Res. 2011, 120, 169–178. [Google Scholar] [CrossRef]
  50. Yang, C.; Fraga, H.; van Ieperen, W.; Trindade, H.; Santos, J.A. Effects of climate change and adaptation options on winter wheat yield under rainfed Mediterranean conditions in southern Portugal. Clim. Chang. 2019, 154, 159–178. [Google Scholar] [CrossRef] [Green Version]
  51. Giunta, F.; Motzo, R.; Pruneddu, G. Trends since 1900 in the yield potential of Italian-bred durum wheat cultivars. Eur. J. Agron. 2007, 27, 12–24. [Google Scholar] [CrossRef]
  52. Molla, A.; Muhie, K. Tef (Eragrostis tef) based cropping systems in the hot to warm moist valleys of North Shewa, Ethiopia. Sci. Res. Essays 2011, 6, 1411–1416. [Google Scholar]
Figure 1. Map of the study areas and pictures (a) and (b) showing the field conditions and land preparation at the two locations, Adet and Bichena, during teff planting time.
Agronomy 11 00220 g001
Figure 2. Genotype performance across the test environments for grain yield, biomass, and harvest index based on BLUP-adjusted mean values. E1 = Adet 2018, E2 = Adet 2019, E3 = Bichena 2018, and E4 = Bichena 2019. E5 refers the intensive growing condition and the data were analyzed separately.
Agronomy 11 00220 g002
Table 1. Best linear unbiased predictor (BLUP)-adjusted mean grain yield and yield-related traits of the top ten high yielding, cultivars, and the bottom three low yielding teff genotypes under the intensive growing condition.
GenotypesAccession NumberGYBMHIDHDMGFPPHPLPDLPW
Ten high yielding genotypes242138-18.818.70.456312967 128.135.726.61.9
236756-28.719.00.445913173 128.933.325.62.2
242200-18.521.60.386513066 136.030.728.21.8
235671-18.319.40.416312360 141.131.129.81.8
227786-48.217.80.456613065 130.932.925.31.9
229101-18.219.30.416012565 134.535.826.92.3
Abishlemne8.121.10.386312563 115.435.124.01.7
229971-38.120.30.405712366 139.531.024.41.8
244783-38.117.90.445813073 134.433.325.82.3
234430-18.123.10.345913072 128.332.424.72.2
CultivarsEtsub6.722.40.306013071 138.536.825.62.1
Quncho6.417.80.366012363128.532.727.91.8
Abola6.419.60.336312158144.242.121.92.3
Low yielding genotypes219850-14.316.70.276210846102.934.525.61.7
239373-24.318.00.256311148100.728.028.41.4
55069-34.216.10.286010949115.321.625.21.6
Grand mean6.218.40.346012160126.932.226.41.8
LSD0.94.00.16.7111215.06.16.00.4
GY = grain yield (g/plant), BM = above ground biomass (g/plant), HI = harvest index, DH = days to heading, DM = days to maturity, GFP = grain filling period, PH = plant height (cm), PL = panicle length (cm), PDL = peduncle length (cm), PW = panicle weight (g), LSD = least significant difference at 5% level of significance.
Table 2. BLUP-adjusted mean grain yield and yield related traits of the top ten high yielding, cultivars, and the bottom three low yielding teff genotypes under field growing condition with conventional management (combined over years and locations).
GenotypesAccession NumberGYBMHIDHDMGFPPHPLPDLPW
Ten high yielding genotypes229971-34.310.90.335512771107.731.522.71.5
236765-34.311.10.336212967109.732.124.01.5
234430-14.311.60.326012968104.833.225.81.5
236756-24.211.40.315912970113.635.226.51.5
DZ-01-35024.211.20.31581307194.131.021.81.3
RIL-2604.112.60.306113169128.642.225.11.8
203010-44.113.50.276113169125.038.726.21.5
202978-24.111.00.326212967108.733.824.51.3
238223-24.011.90.295812869104.130.125.11.0
235659-34.012.10.305912767110.132.325.91.2
CultivarsEtsub3.912.8 0.306012868110.234.823.41.4
Quncho3.010.60.285812365106.732.221.01.4
Abola3.412.80.276413066113.437.423.31.5
Low yielding genotypes229101-31.88.30.22621246293.031.425.20.9
234775-41.87.50.24621306597.732.622.90.9
219882-41.88.30.22641256294.133.024.30.9
Grand mean3.110.70.29 601266599.331.224.51.1
LSD0.52.00.12.74.35.08.34.33.00.2
GY = grain yield (g/plant), BM = above ground biomass (g/plant), HI = harvest index, DH = days to heading, DM = days to maturity, GFP = grain filling period, PH = plant height (cm), PL = panicle length (cm), PDL = peduncle length (cm), PW = panicle weight (g), LSD = least significant difference at 5% level of significance.
Table 3. Mean squares, variance components, and estimates of variability for important traits of 317 teff genotypes under the intensive growing condition.
TraitsMean SquareMeansVarianceGCV
(%)
PCV
(%)
HGA
(%)
Gσ2eσ2Gσ2P
DH40.46 **6.6960.3916.8820.236.807.450.8312.73
DM146.27 **30.25120.7758.0173.136.317.080.7911.52
GFP192.41 **34.7160.3778.8596.2114.7116.250.8227.44
PH307.11 **59.43126.90123.84153.568.779.770.8116.29
PL51.26 **9.5932.1920.8325.6314.1815.730.8126.24
PDL22.54 **9.2726.396.6311.279.7612.720.5915.46
PW0.12 **0.021.770.050.0612.8814.010.8424.24
GY2.24 **0.426.240.911.0215.2916.190.8127.01
BM10.54 **2.4018.624.074.7010.8311.640.7718.47
HI0.004 **0.0010.340.0010.0018.8211.000.6715.20
**, indicates significant difference at p < 0.01, G = genotype, σ2e = residual variance, DH = days to heading, DM = days to maturity, GFP = grain filling period, PH = plant height (cm), PL = panicle length (cm), PDL = peduncle length (cm), PW = panicle weight (g), GY = grain yield (g/plant), BM = above ground biomass (g/plant), HI = harvest index, GCV = genotypic coefficient of variation, PCV = phenotypic coefficient of variation, H = broad sense heritability, GA = genetic advance as percent of mean, σ2G = genotypic variance, and σ2P = phenotypic variance.
Table 4. Mean squares, variance components, and estimates of variability for important traits of 320 teff genotypes under field growing condition with conventional management (combined over environments).
TraitsMean SquareMeansVarianceGCV
(%)
PCV
(%)
HGA
(%)
GEG x Eσ2Gσ2P
DH69.82 **23941 **9.70 **60.277.408.584.514.860.868.61
DM165.7 **27092 **27.42 **125.6117.6020.843.343.630.846.29
GFP123.0 **9017 **29.6 **65.3412.2015.685.356.060.789.74
PH815 **58858 **27.4 **99.2693.6298.729.7510.010.9519.59
PL146.2 **35059 **39.5 **28.2013.0517.8711.5813.550.7322.50
PDL63.0 **3004.8 **8.85 **24.526.707.7910.5611.380.8620.17
PW0.44 **32.28 **0.08 **1.080.050.0519.6421.670.8236.60
GY3.07 **231.0 **0.45 **3.100.330.3820.722.360.8635.20
BM18.3 **6087.1 **6.08 **10.701.532.2512.4615.100.6819.64
HI0.009 **0.385 **0.004 **0.290.00070.0018.7911.820.5713.90
**, indicates significant difference at p < 0.01. G = genotype, E = environment, G x E = genotype by environment interaction, DH = days to heading, DM = days to maturity, GFP = grain filling period, PH = plant height (cm), PL = panicle length (cm), PDL = peduncle length (cm), PW = panicle weight (g), GY = grain yield (g/plant), BM = above ground biomass (g/plant), HI = harvest index, GCV = genotypic coefficient of variation, PCV = phenotypic coefficient of variation, H = broad sense heritability, GA = genetic advance as percent of mean, σ2G = genotypic variance, and σ2P = phenotypic variance.
Table 5. Genotypic (above diagonal) and phenotypic (below diagonal) correlation coefficients between the important traits of 317 teff genotypes under the intensive growing condition.
DHDMGFPPHPLPDLPWGYBMHI
DH −0.06−0.52 **−0.24 *−0.13 ns0.35 *−0.10 ns−0.22 *−0.15 *−0.22 *
DM−0.04 ns 0.89 ***0.61 **0.49 **−0.07 ns0.51 **0.77 ***0.71 ***0.54 **
GFP−0.49 ** 0.89 *** 0.64 **0.48 **−0.22 *0.48 **0.76 ***0.68 ***0.56 **
PH−0.19 * 0.65 ** 0.65 ** 0.63 **0.02 ns0.50 **0.69 ***0.70 ***0.44 **
PL−0.09 ns0.55 **0.52 **0.68 *** −0.14 * 0.45 ** 0.52 ** 0.63 **0.23 *
PDL0.20 *−0.02 ns−0.11 ns0.04 ns−0.08 ns 0.001 ns −0.03 ns−0.03 ns0.002 ns
PW−0.08 ns0.55 **0.51 **0.56 **0.51 **0.02 ns 0.53 **0.55 **0.33 *
GY−0.17 *0.78 ***0.76 ***0.74 ***0.60 **0.002 ns0.58 ** 0.81 ***0.82 ***
BM−0.11 ns0.59 **0.57 **0.58 **0.53 ** −0.01 ns0.47 ** 0.67 *** 0.33 *
HI−0.14 *0.51 **0.51 **0.48 **0.34 *0.02 ns0.37 * 0.74 ***−0.004 ns
*, **, ***, indicates significant correlation coefficients at a p values of 0.05, 0.01, and 0.001 respectively, ns = non-significant at p < 0.05. DH = days to heading, DM = days to maturity, GFP = grain filling period, PH = plant height (cm), PL = panicle length (cm), PDL = peduncle length (cm), PW = panicle weight (g), GY = grain yield (g/plant), BM = above ground biomass (g/plant), HI = harvest index.
Table 6. Genotypic (above diagonal) and phenotypic (below diagonal) correlation coefficients between the important traits of 320 teff genotypes under the field growing condition.
DHDMGFPPHPLPDLPWGYBMHI
DH 0.56 **−0.10 ns0.46 **0.34 *−0.18 *0.38 *−0.23 *−0.05 ns−0.45 **
DM0.51 ** 0.77 ***0.42 *0.31 *0.09 ns0.45 **0.10 ns0.15 *−0.03 ns
GFP−0.14 *0.78 *** 0.16 *0.12 *0.25 *0.25 *0.30 *0.21 *0.31 *
PH0.41 *0.36 *0.11 ns 0.96 ***−0.01 ns0.89 ***0.26 *0.60 **−0.25 *
PL0.30 *0.24 *0.06 ns0.83 *** −0.38 *0.89 ***0.36 *0.67 ***−0.14 *
PDL−0.17 *0.07 ns0.21 *−0.01 ns−0.36 * −0.06 ns−0.10 ns−0.16 *0.06 ns
PW0.34 *0.39 *0.20 *0.80 ***0.72 ***−0.04 ns 0.46 **0.69 ***0.05 ns
GY−0.22 *0.09 ns0.26 *0.23 *0.28 *−0.07 ns0.40 * 0.94 ***0.88 ***
BM−0.05 ns0.13 *0.18 *0.49 **0.49 **−0.10 ns0.55 **0.84 *** 0.66 **
HI−0.34 *−0.03 ns0.21 *−0.22 *−0.13 *0.05 ns0.02 ns0.71 ***0.24 *
*, **, ***, indicates significant correlation coefficients at a p values of 0.05, 0.01, and 0.001 respectively, ns = non-significant at 0.05. DH = days to heading, DM = days to maturity, GFP = grain filling period, PH = plant height (cm), PL = panicle length (cm), PDL = peduncle length (cm), PW = panicle weight (g), GY = grain yield (g/plant), BM = above ground biomass (g/plant), HI = harvest index.
Table 7. Cluster means of grain yield and yield-related traits of teff genotypes under the intensive growing condition.
ClusterDHDMGFPPHPLPDLPWGYBMHI
I58.60121.3562.73128.2133.7524.141.876.3819.320.33
II60.22128.3268.35136.5735.6026.501.916.9820.280.34
III61.34126.9065.78133.6033.0426.961.967.9218.710.41
IV63.78115.6251.73127.8731.3927.091.706.0118.530.33
V58.84114.3255.24117.2628.4826.161.605.2617.070.32
VI58.91119.8660.90126.1832.1227.241.766.1918.170.34
VII70.11114.5644.42109.8928.1227.141.595.3116.770.30
DH = days to heading, DM = days to maturity, GFP = grain filling period, PH = plant height (cm), PL = panicle length (cm), PDL = peduncle length (cm), PW = panicle weight (g), GY = grain yield (g/plant), BM = above ground biomass (g/plant), HI = harvest index.
Table 8. Cluster means of grain yield and yield-related traits of teff genotypes under the field growing condition.
ClusterDHDMGFPPHPLPDLPWGYBMHI
I60.91125.8064.9297.8431.3724.220.992.609.150.27
II60.11128.5267.93121.7335.3724.611.383.8111.610.29
III60.02126.6966.58101.8731.4525.311.153.3210.350.29
IV58.74118.1859.9295.6730.7923.341.012.989.970.29
V63.13128.6165.65106.2634.0621.601.212.8910.110.27
VI59.47125.3765.8887.2426.6125.870.862.688.950.29
DH = days to heading, DM = days to maturity, GFP = grain filling period, PH = plant height (cm), PL = panicle length (cm), PDL = peduncle length (cm), PW = panicle weight (g), GY = grain yield (g/plant), BM = above ground biomass (g/plant), HI = harvest index.
Publisher’s Note: MDPI stays neutral with regard to jurisdictional claims in published maps and institutional affiliations.

