
Profiling of Phenolic Compounds Composition, Morphological Traits, and Antioxidant Activity of Miscanthus sacchariflorus L. Accessions


Abstract
:1. Introduction
2. Materials and Methods
2.1. Chemicals
2.2. Field Trials and Morphological Data Collection
2.3. Evaluation of DPPH Radical Scavenging Assay
2.4. Evaluation of ABTS Radical Scavenging Assay
2.5. Determination of Total Phenolic Content
2.6. Determination of Total Flavonoid Content
2.7. Quantification of Phenolic Compounds by Liquid Chromatography-Mass Spectrometry/Mass Spectrometry (LC-MS/MS)
2.8. Statistical Analysis
3. Results
3.1. Morphological Trait Variation in M. sacchariflorus Accessions
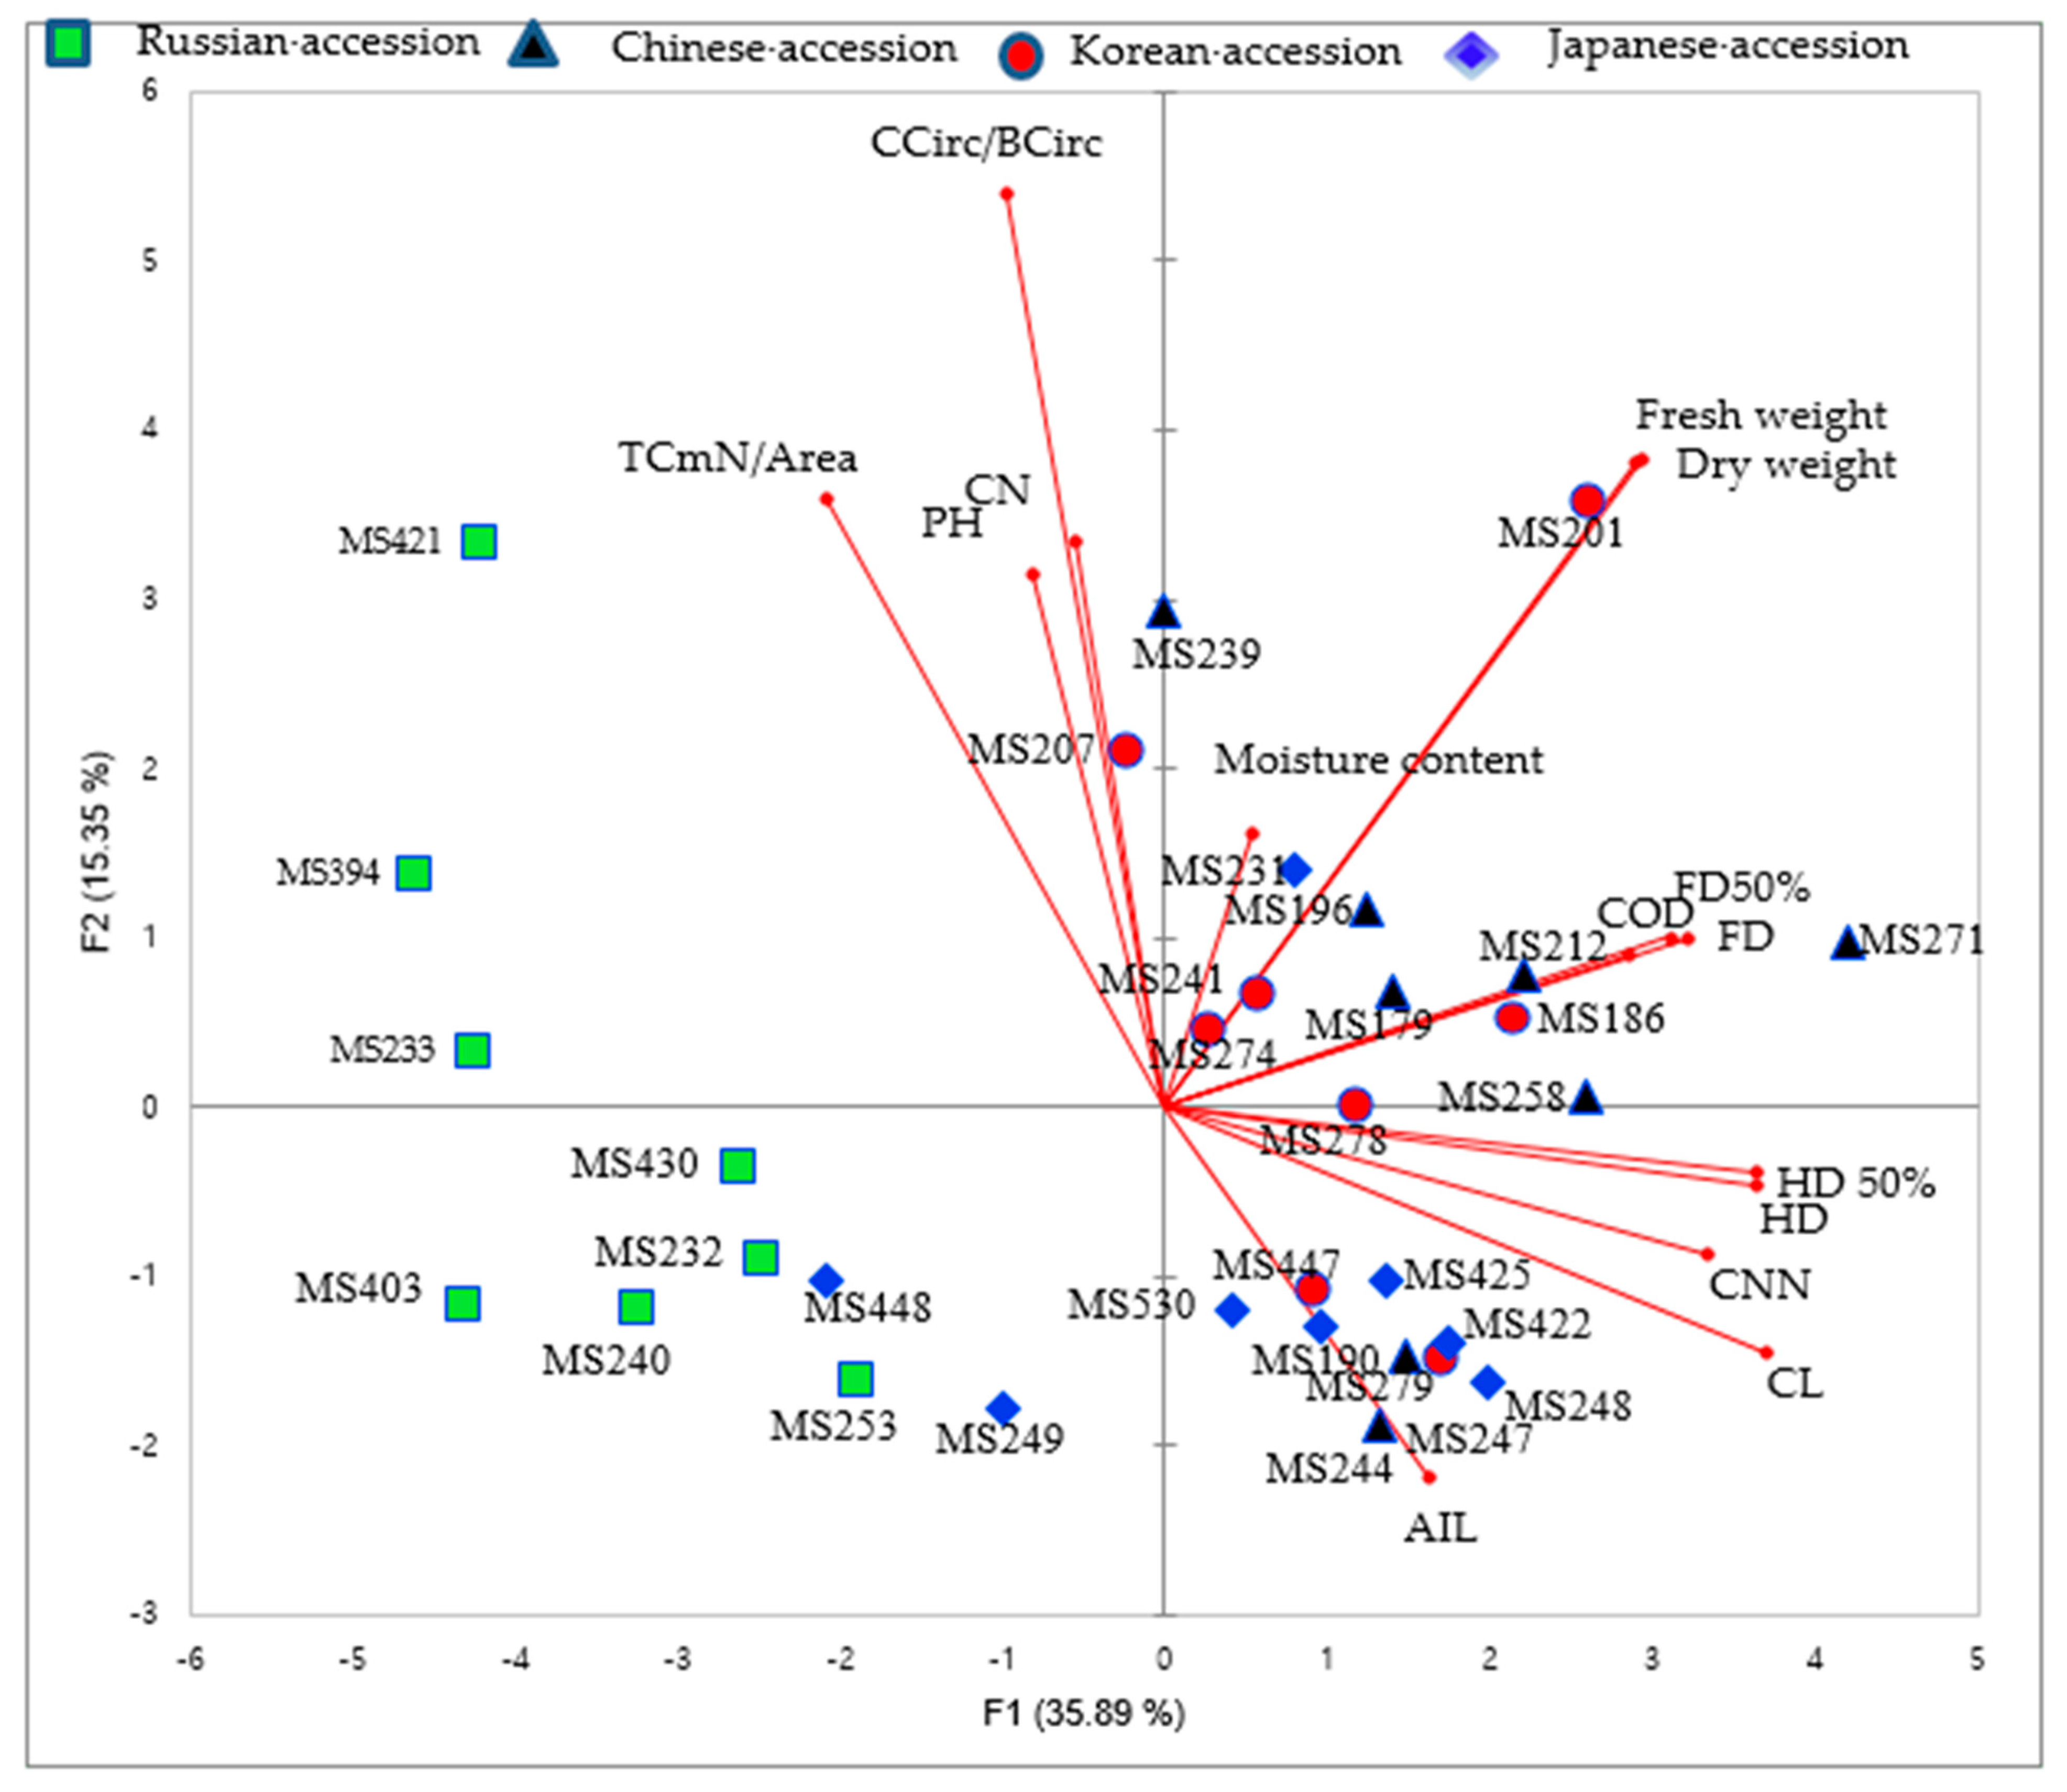
3.1.1. Principal Component Analysis (PCA)
3.1.2. Unweighted Pair Group Method with Arithmetic Mean (UPGMA) Cluster Analysis Using Morphological Traits
3.2. Screening of Total Phenolic Content, Total Flavonoid Content, and Antioxidant Potential in M. sacchariflorus Accessions
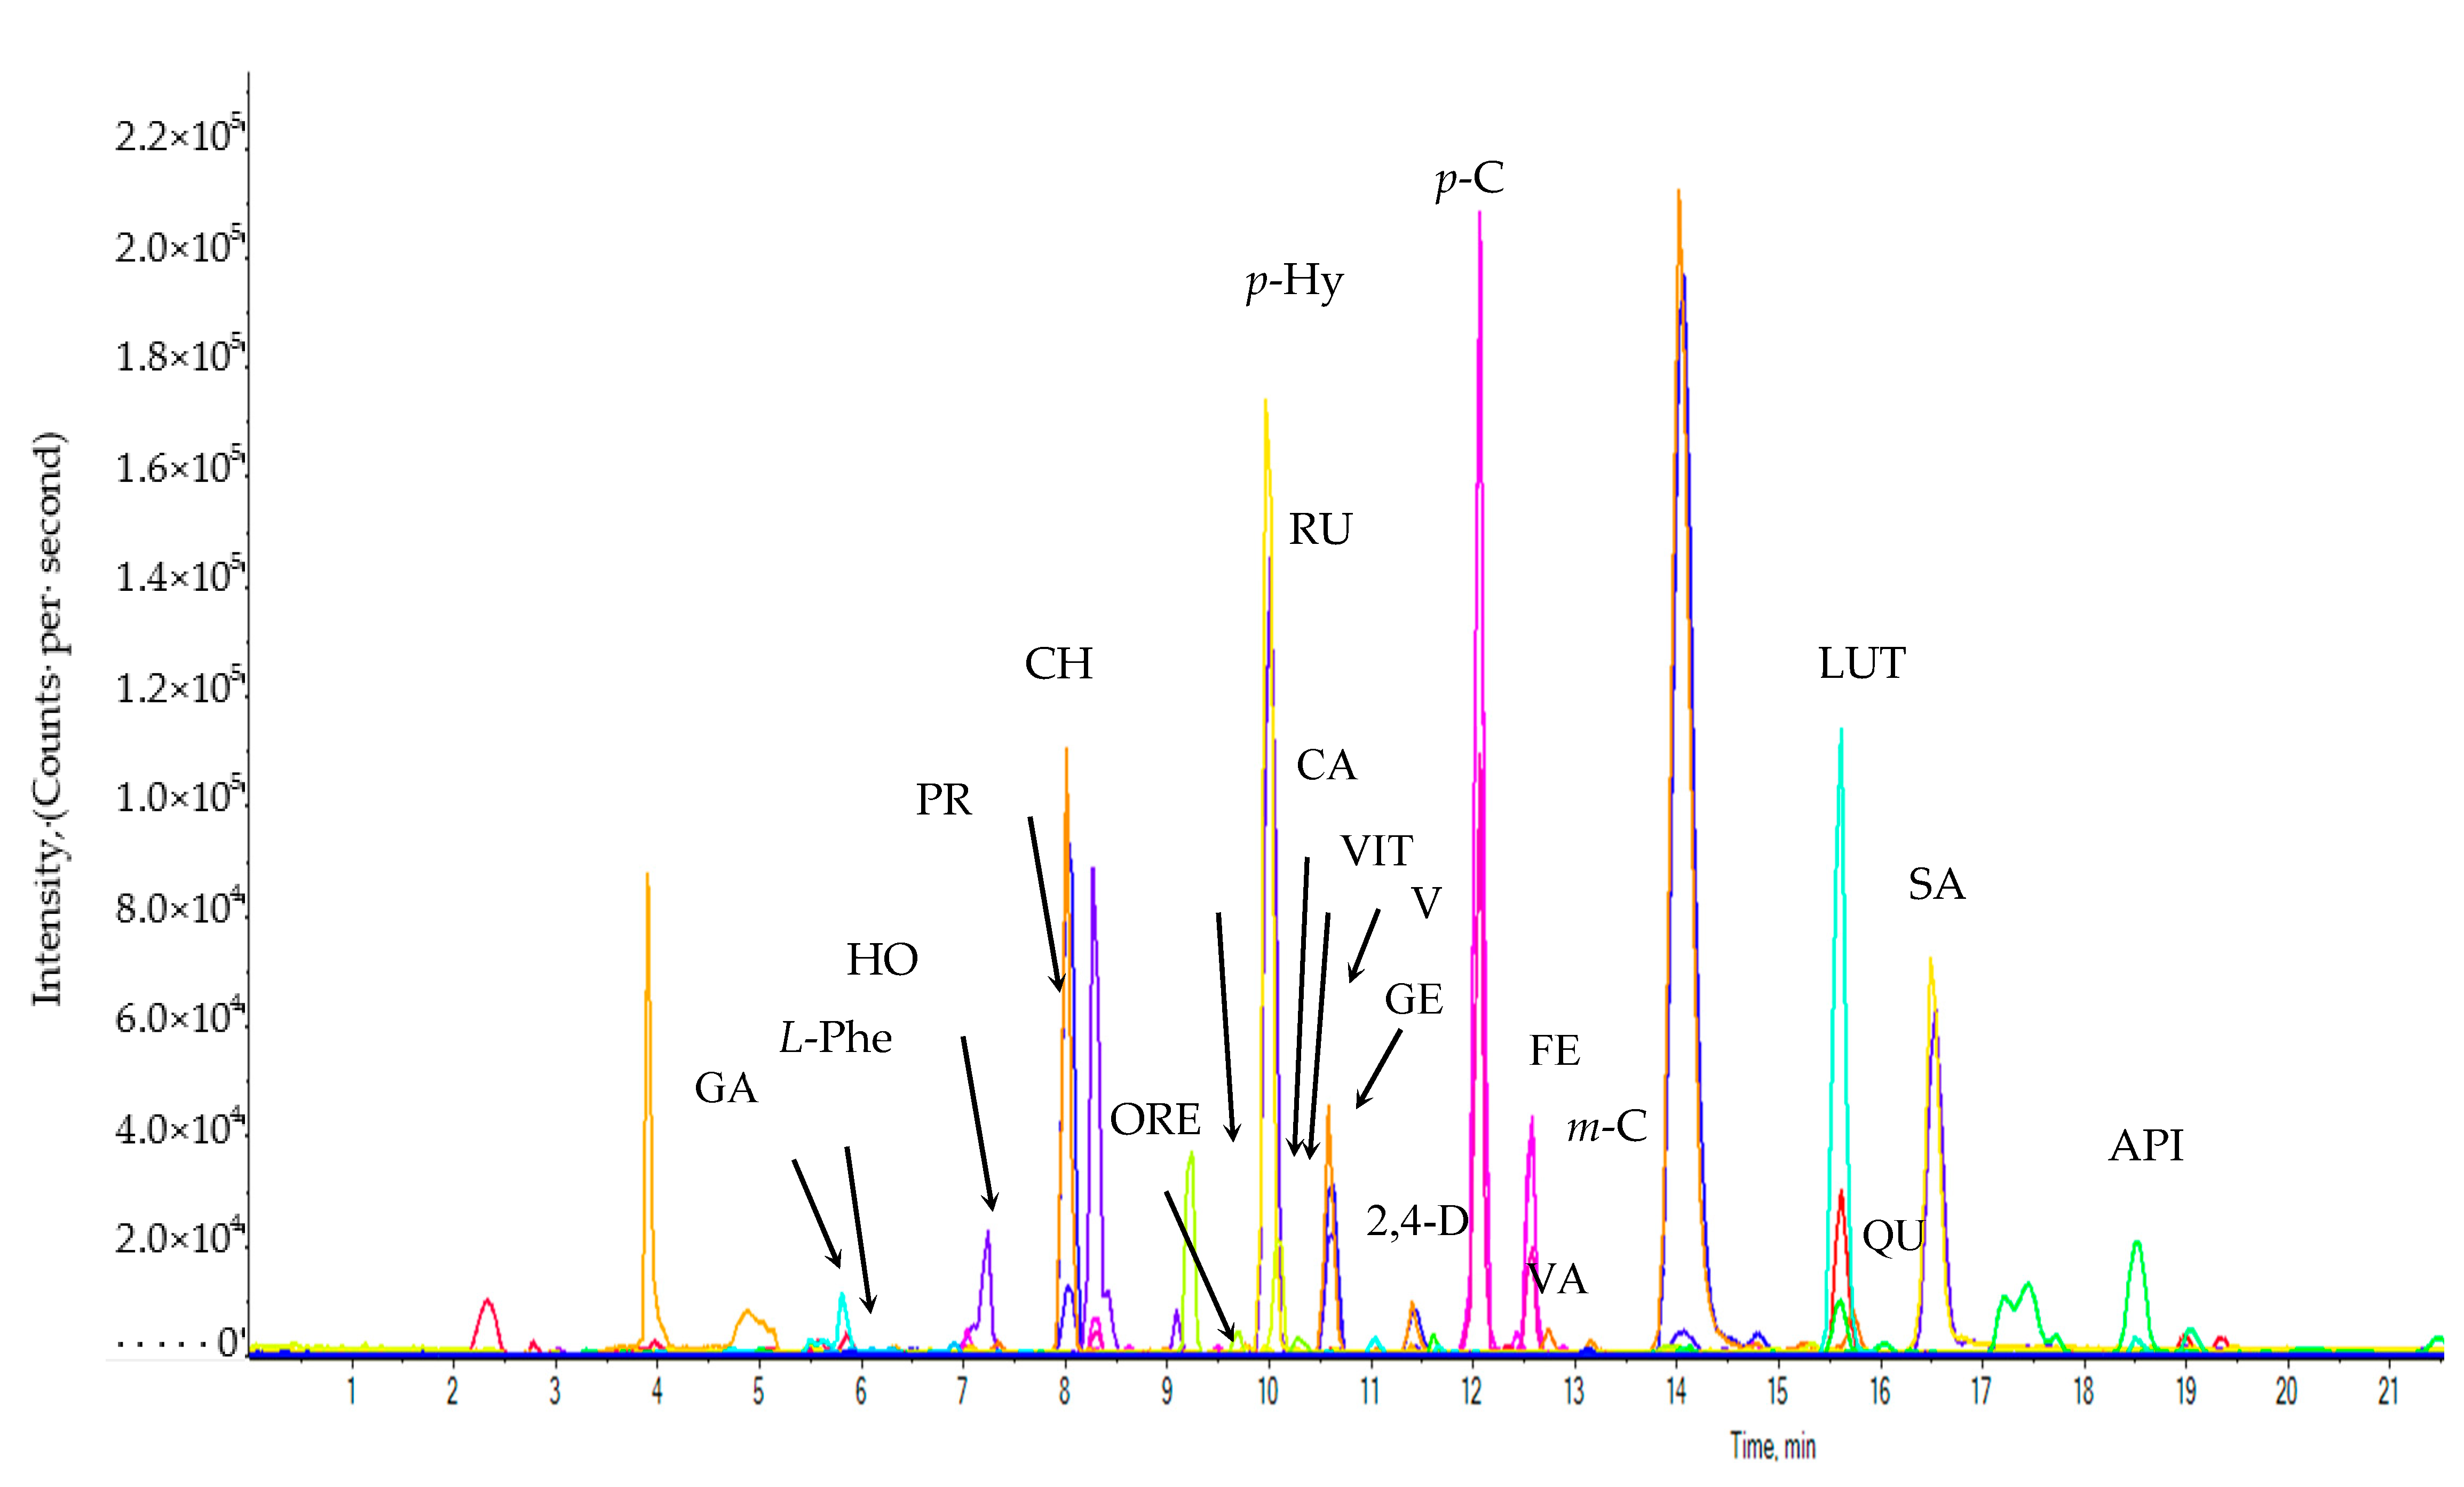
3.3. Identification and Quantification of Phenolic Compounds in M. sacchariflorus by LC-MS/MS Analysis
3.3.1. Pearson’s Correlation Analysis between Antioxidant Activities and Phenolic Compounds
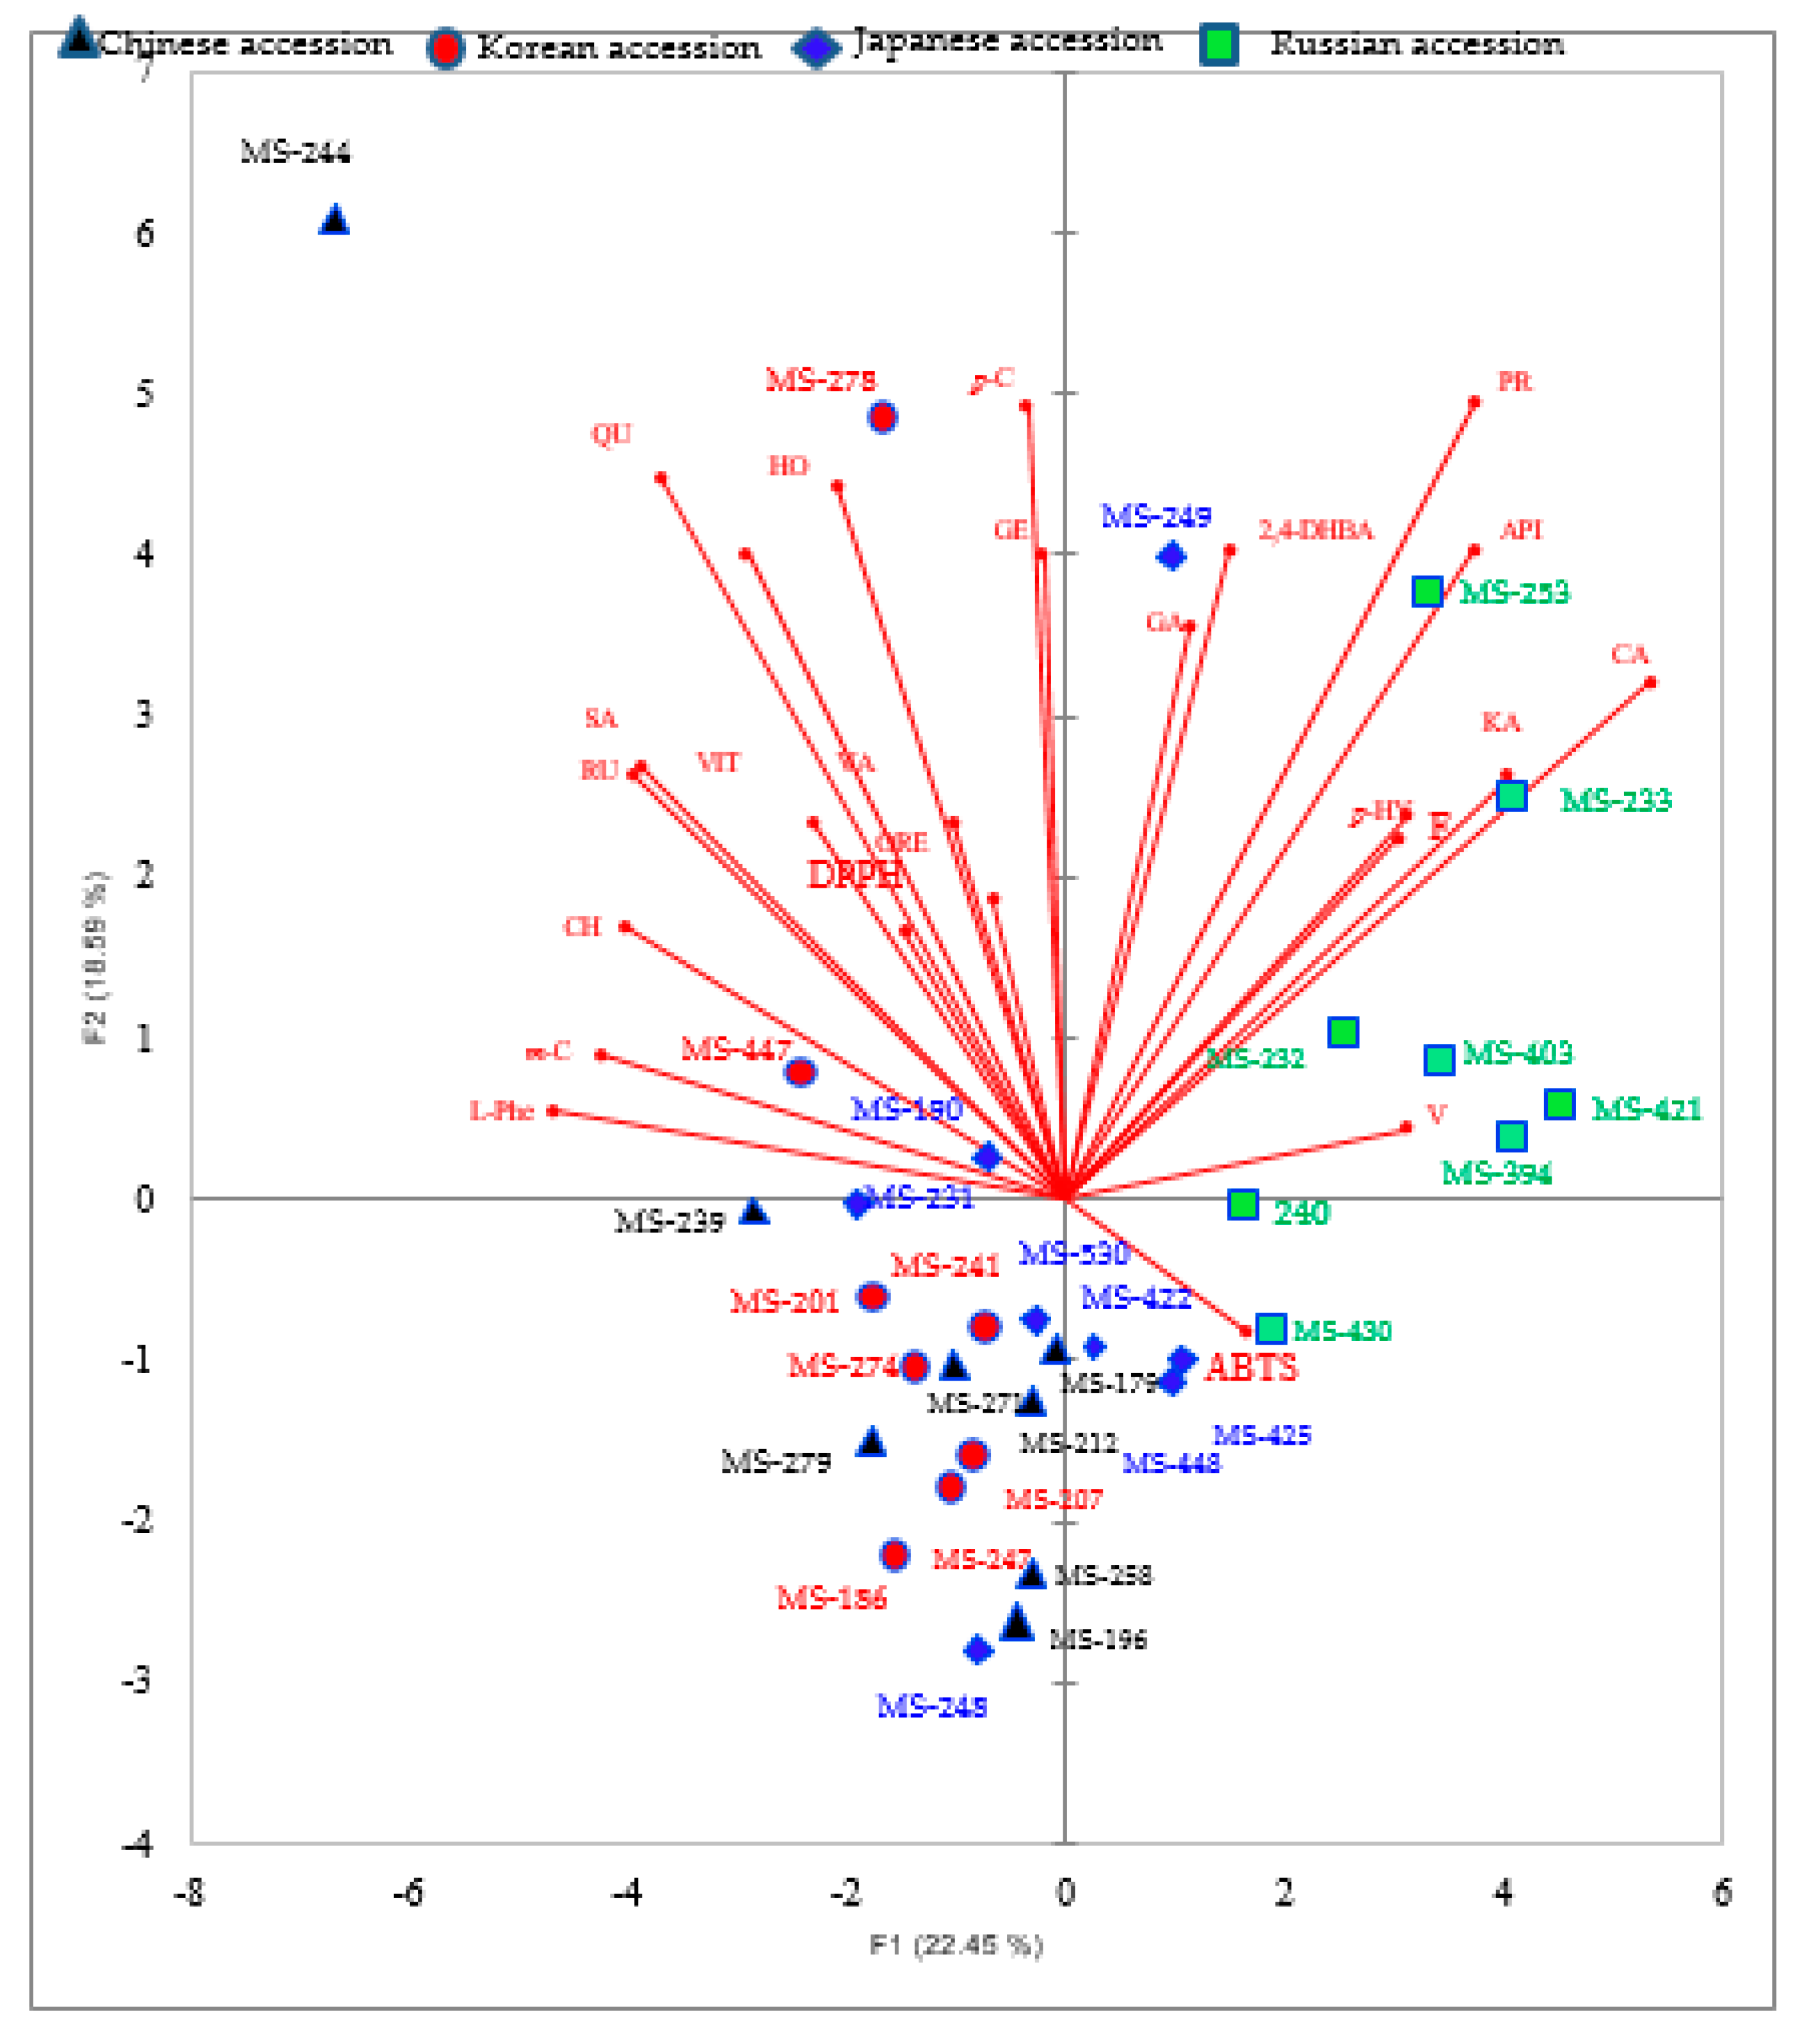
3.3.2. Principal Components Analysis (PCA) of Phenolic Compounds
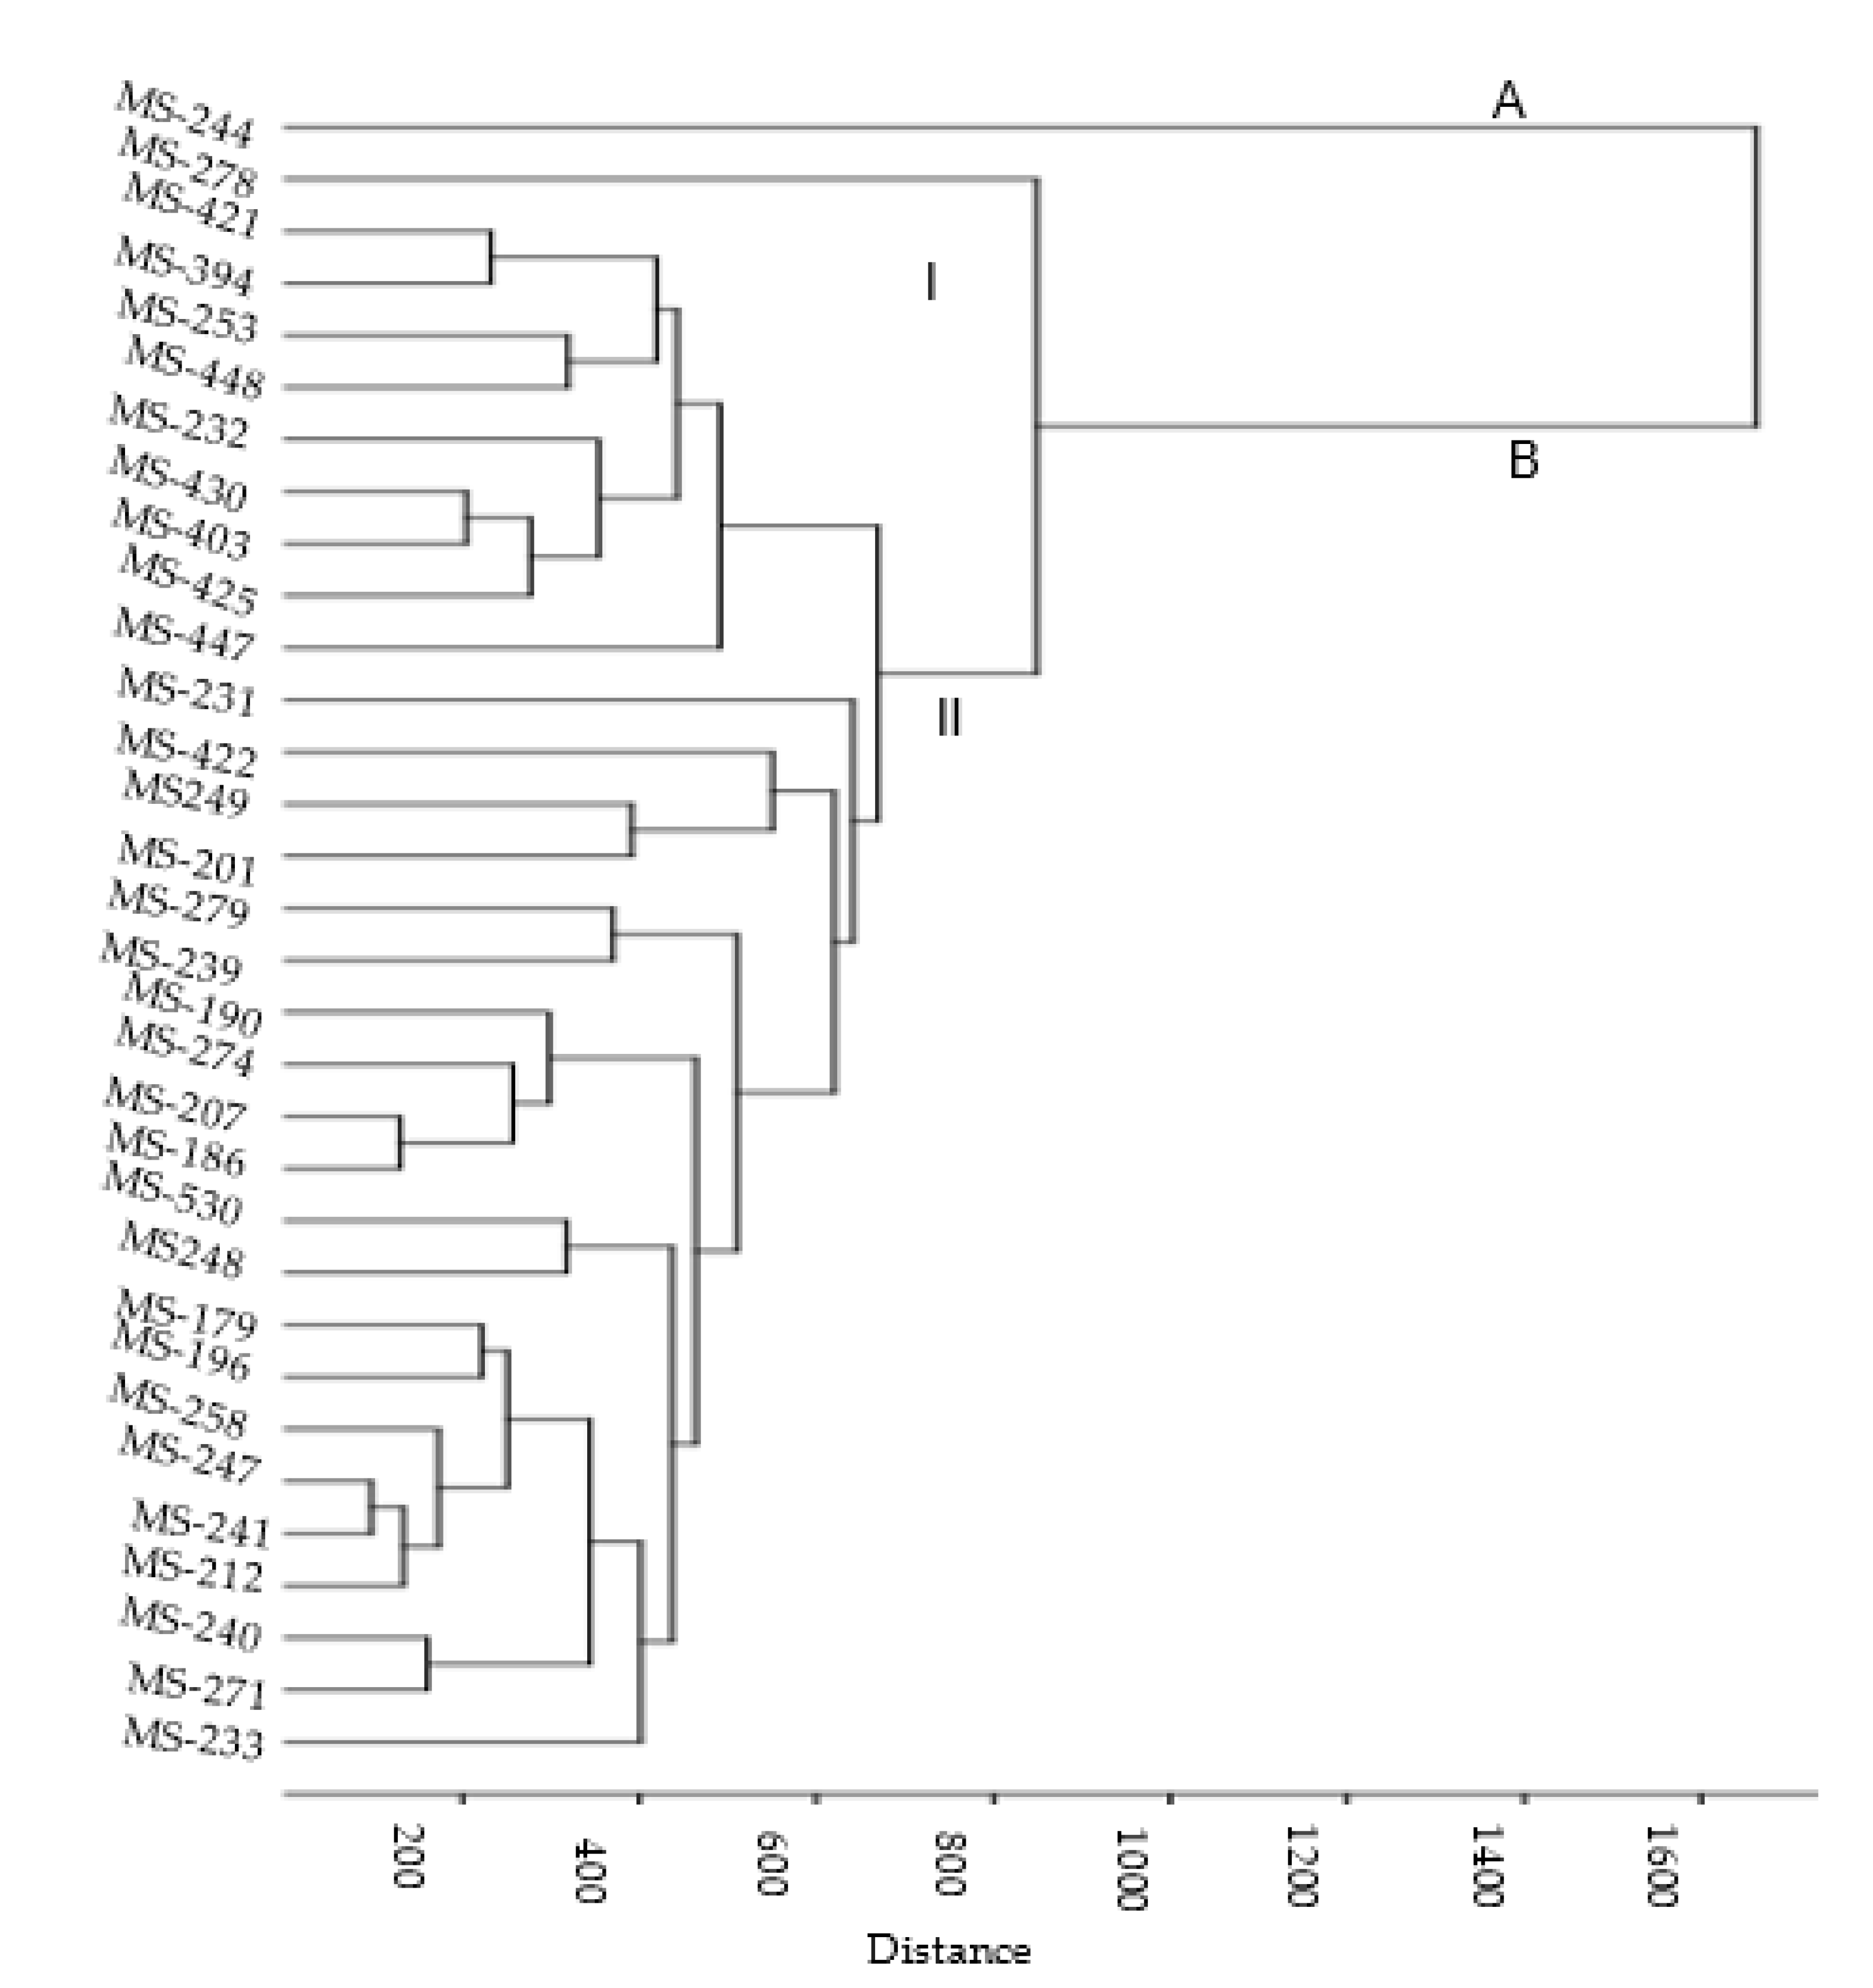
3.3.3. UPGMA Cluster Analysis Using Phytochemicals
4. Discussion
4.1. Morphological Traits in M. sacchariflorus Accessions
4.2. Identification and Quantification of Phenolic Compounds of M. sacchariflorus Accessions by LC-MS/MS Analysis
4.3. Screening of In Vitro Antioxidant Capacity in M. sacchariflorus Accessions
5. Conclusions
Supplementary Materials
Author Contributions
Funding
Institutional Review Board Statement
Informed Consent Statement
Data Availability Statement
Acknowledgments
Conflicts of Interest
References
- Clifton-Brown, J.C.; Lewandowski, I. Overwintering problems of newly established Miscanthus plantations can be overcome by identifying genotypes with improved rhizome cold tolerance. New Phytol. 2000, 148, 287–294. [Google Scholar] [CrossRef]
- Dwiyanti, M.S.; Stewart, J.R.; Yamada, T. Germplasm resources of Miscanthus and their application in breeding. In Bioenergy Feedstocks: Breeding and Genetics; Saha, M.C., Bhandari, H.S., Bouton, J.H., Eds.; John Wiley &Sons: Oxford, UK, 2013; pp. 49–66. [Google Scholar]
- Sacks, E.J.; Juvik, J.A.; Lin, Q.; Stewart, J.R.; Yamada, T. The gene pool of Miscanthus species and its improvement. In Genomics of the Saccharinae; Paterson, A.H., Ed.; Springer: New York, NY, USA, 2013; pp. 73–101. [Google Scholar]
- Atkinson, C. Establishing perennial grass energy crops in the UK: A review of current propagation options for Miscanthus. Biomass Bioenergy 2009, 33, 752–759. [Google Scholar] [CrossRef]
- Yook, M.J.; Lim, S.H.; Song, J.S.; Kim, J.W.; Zhang, C.J.; Lee, E.J.; Ibaragi, Y.; Lee, G.J.; Nah, G.; Kim, D.S. Assessment of genetic diversity of Korean Miscanthus using morphological traits and SSR markers. Biomass Bioenergy 2014, 66, 81–92. [Google Scholar] [CrossRef]
- Clark, L.V.; Dzyubenko, E.; Dzyubenko, N.; Bagmet, L.; Sabitov, A.; Chebukin, P.; Johnson, D.A.; Kjeldsen, J.B.; Petersen, K.K.; Jørgensen, U. Ecological characteristics and in situ genetic associations for yield-component traits of wild Miscanthus from eastern Russia. Ann. Bot. 2016, 118, 941–955. [Google Scholar] [CrossRef] [Green Version]
- Lewandowski, I.; Clifton-Brown, J.C.; Andersson, B.; Basch, G.; Christian, D.; Jørgensen, U.; Jones, M.; Riche, A.B.; Schwarz, K.U.; Tayebi, K.; et al. Environment and harvest time affects the combustion qualities of Miscanthus genotypes. Agron. J. 2003, 95, 1274–1280. [Google Scholar] [CrossRef] [Green Version]
- Clifton-Brown, J.C.; Chiang, Y.C.; Hodkinson, T.R. Miscanthus: Genetic resources and breeding potential to enhance bioenergy production. In Genetic Improvement of Bioenergy Crops; Vermerris, W., Ed.; Springer Science: New York, NY, USA, 2008; pp. 273–294. [Google Scholar]
- Lewandowski, I.; Clifton-Brown, J.C.; Scurlock, J.M.O.; Huisman, W. Miscanthus: European experience with a novel energy crop. Biomass Bioenergy 2000, 19, 209–227. [Google Scholar] [CrossRef]
- Clifton-Brown, J.C.; Lewandowski, I.; Andersson, B.; Basch, G.; Christian, D.G.; Kjeldsen, J.B.; Jørgensen, U.; Mortensen, J.V.; Riche, A.B.; Schwarz, K.U.; et al. Performance of 15 Miscanthus Genotypes at Five Sites in Europe. J. Agron. J. 2001, 93, 1013–1019. [Google Scholar] [CrossRef] [Green Version]
- Hirayoshi, I.; Nishikawa, K.; Kubono, M.; Murase, T. Cytogenetical studies on forage plants (VI). On the chromosome number of ogi (Miscanthus sacchariflorus). Res. Bull. Fac. Agric. Gifu Univ. 1957, 8, 8–13. [Google Scholar]
- Lee, Y. Taxonomic studies on the genus Miscanthus: Relationships among the section, subsection, and species, part 2: Enumeration of species and varieties. J. Jpn. Bot. 1964, 39, 257–265. [Google Scholar]
- Sun, Q.; Lin, Q.; Yi, Z.L.; Yang, Z.R.; Zhou, F.S. A taxonomic revision of Miscanthus s.l. (Poaceae) from China. Bot. J. Linn. Soc. 2010, 164, 178–220. [Google Scholar] [CrossRef] [Green Version]
- Young, R.A. Processing of agro-based resources into pulp and paper. In Paper and Composites from Agro-Based Resources; Rowell, R.M., Young, R.A., Rowell, J.K., Eds.; CRC Press/Lewis Publishers: New York, NY, USA, 1997; pp. 137–245. [Google Scholar]
- Visser, P.; Pignatelli, V.; Jørgensen, U.; Oliveira, J.F.S. Utilisation of Miscanthus. In Miscanthus–For Energy and Fibre; Jones, M.B., Walsh, M., Eds.; James & James: London, UK, 2001; pp. 109–154. [Google Scholar]
- Park, H.J.; Oh, S.W.; Wen, M.Y. Manufacture and properties of Miscanthus–wood particle composite boards. J. Wood Sci. 2012, 58, 459–464. [Google Scholar] [CrossRef]
- Liao, C.B.; Deng, Y.H.; Wang, X.Z.; Fan, X.L.; Yu, T.; Yang, Y. Manufacture and mechanical properties of biocomposite made of reed and silvergrass. Appl. Mech. Mater. 2013, 248, 237–242. [Google Scholar] [CrossRef]
- Trinklein, D. Ornamental Grasses. In Plants of Wisconsin; Robert W. Freckmann Herbarium at University of Wisconsin-Stevens Point: Stevens Point, WI, USA; University of Missouri-Extension: Columbia, MO, USA, 2013. [Google Scholar]
- Zub, H.W.; Brancourt-Hulmel, M. Agronomic and physiological performances of different species of Miscanthus a major energy crop. A review. Agron. Sustain. Dev. 2010, 30, 201–214. [Google Scholar] [CrossRef] [Green Version]
- Tayot, X.; Chartier, M.; Varlet-Grancher, C.; Lemaire, G. Potential above-ground dry matter production of Miscanthus in north-centre France compared to sweet sorghum. In Biomass for Energy, Environment, Agriculture and Industry; Charter, P., Beenackers, A., Grassi, G., Eds.; Oxford Elsevier: Oxford, UK, 1995; pp. 556–564. [Google Scholar]
- Heaton, E.A.; Dohleman, F.G.; Long, S.P. Meeting US bio-fuel goals with less land: The potential of Miscanthus. Glob. Chang. Biol. 2008, 14, 2000–2014. [Google Scholar] [CrossRef]
- Cerutti, P.A. Peroxidant states and tumor promotion. Science 1985, 227, 375–381. [Google Scholar] [CrossRef] [PubMed]
- Halliwell, B.; Gutteridge, J.C. Oxygen toxicity, radicals, transition metal and disease. Biochem. J. 1984, 319, 1–14. [Google Scholar] [CrossRef]
- Finkel, T.; Holbrook, N.J. Oxidants, oxidative stress and the biology of ageing. Nature 2000, 408, 239–247. [Google Scholar] [CrossRef] [PubMed]
- Young, I.S.; Woodside, J.V. Antioxidants in health and disease. J. Clin. Pathol. 2001, 54, 176–186. [Google Scholar] [CrossRef] [Green Version]
- Ou, B.; Hampsch-Woodill, M.; Flanagan, J.; Deemer, E.K.; Prior, R.L.; Huang, D. Novel fluorometric assay for hydroxyl radical prevention capacity using fluorescein as the probe. J. Agric. Food Chem. 2002, 50, 2772–2777. [Google Scholar] [CrossRef]
- Embuscado, M.E. Spices and herbs: Natural sources of antioxidants—A mini review. J. Funct. Foods 2015, 18, 811–819. [Google Scholar] [CrossRef]
- Taghvaei, M.; Jafari, S.M. Application and stability of natural antioxidants in edible oils in order to substitute synthetic additives. J. Food Sci. Technol. 2015, 52, 1272–1282. [Google Scholar] [CrossRef] [PubMed] [Green Version]
- Assefa, A.D.; Jeong, Y.J.; Kim, D.J.; Jeon, Y.A.; Lee, J.R.; Ko, H.C.; Baek, H.J.; Sung, J.S. Assessing phenolic content and antioxidant potential diversity in Allium plants using multivariate data analysis. Hortic. Environ. Biotechnol. 2018, 59, 759–773. [Google Scholar] [CrossRef]
- Mathew, S.; Abraham, E.T. Studies on the antioxidant activities of cinnamon (Cinnamonum verum) bank extracts, through various in vitro models. Food Chem. 2006, 94, 520–528. [Google Scholar] [CrossRef]
- Sikora, E.; Cieslik, E.; Topolska, K. The source of natural antioxidants. Acta Sci. Pol. Technol. Aliment. 2008, 7, 5–17. [Google Scholar]
- Yanishlieva-Maslarova, N.V.; Heinonen, I.M. Sources of natural antioxidants: Vegetables, fruits, herbs, spices and teas. In Antioxidants in Food, Practical Applications; Pokorny, J., Yanishlieva, N., Gordon, M., Eds.; Woodhead Publishing: Cambridge, UK, 2001; pp. 210–266. [Google Scholar]
- Khanizadeh, S.; Tsao, R.; Rekika, D.; Yang, R.; Charles, M.T.; Rupasinghe, H.V. Polyphenol composition and total antioxidant capacity of selected apple genotypes for processing. J. Food Compos. Anal. 2008, 21, 396–401. [Google Scholar] [CrossRef]
- Rebey, I.B.; Wannes, W.A.; Kaab, S.B.; Bourgou, S.; Tounsi, M.S.; Ksouri, R.; Fauconnier, M.L. Bioactive compounds and antioxidant activity of Pimpinella anisum L. accessions at different ripening stages. Sci. Hortic. 2019, 246, 453–461. [Google Scholar] [CrossRef]
- Klinke, H.B.; Thomsen, A.B.; Ahring, B.K. Inhibition of ethanol-producing yeast and bacteria by degradation products produced during pre-treatment of biomass. Appl. Microbiol. Biotechnol. 2004, 66, 10–26. [Google Scholar] [CrossRef] [PubMed]
- Scebba, F.; Sebustiani, L.; Vitagliano, C. Protective enzymes against activated oxygen species in wheat (Triticum aestivum L.) seedlings: Responses to cold acclimation. J. Plant Physiol. 1999, 155, 762–768. [Google Scholar]
- Shigeoka, S.; Ishikawa, T.; Tamoi, M.; Miyagawa, Y.; Takeda, T.; Yabuta, Y.; Yoshimura, K. Regulation and function of ascorbate peroxidase isoenzymes. J. Exp. Bot. 2002, 53, 1305–1319. [Google Scholar] [CrossRef] [PubMed]
- Gołębiowska, G.; Wędzony, M.; Płażek, A. The responses of pro and antioxidative systems to cold-hardening and pathogenesis differs in triticale (x Triticosecale Wittm) seedlings susceptible or resistant to pink snow mould (Microdochium nivale Fr., Samuels & Hallett). J. Phytopathol. 2011, 159, 19–27. [Google Scholar]
- Hanifei, M.; Dehghani, H.; Choukan, R. The role of antioxidant enzymes and phenolic compounds in disease resistance to Fusarium oxysporum f. sp. Melonis race 1.2. Int. J. Agron. Plant Prod. 2013, 4, 1985–1996. [Google Scholar]
- Ivanov, S.; Miteva, L.; Alexieva, V.; Karjin, H.; Karanov, E. Alterations in some oxidative parameters in susceptible and resistant wheat plants infected with Puccinia recondita f.sp. tritici. J. Plant Physiol. 2004, 162, 275–279. [Google Scholar] [CrossRef] [PubMed]
- Kiraly, L.; Barna, B.; Kiraly, Z. Plant resistance to pathogen infection: Forms and mechanisms of innate and acquired resistance. J. Phytopathol. 2007, 155, 385–396. [Google Scholar] [CrossRef]
- Kumar, M.; Yadav, V.; Tuteja, N.; Johri, A.K. Antioxidant enzyme activities in maize plants colonized with Piriformospora indica. Microbiology 2009, 155, 780–790. [Google Scholar] [CrossRef] [PubMed] [Green Version]
- Płażek, A.; Hura, K.; Żur, I.; Niemczyk, E. Relationship between frost tolerance and cold-induced resistance of spring barley, meadow fescue and winter oilseed rape to fungal pathogens. J. Agron. Crop. Sci. 2003, 189, 333–340. [Google Scholar] [CrossRef]
- Norman, P.E.; Tongoona, P.; Shanahan, P.E. Diversity of the morphological traits of yam (Dioscorea spp.) genotypes from Sierra Leone. J. Appl. Biosci. 2011, 45, 3045–3058. [Google Scholar]
- Tamiru, M.; Becker, H.C.; Maass, B.L. Comparative analysis of morphological and farmers cognitive diversity in yam landraces (Dioscorea spp) from Sothern Ethiopia. Trop. Agric. Dev. 2011, 55, 28–43. [Google Scholar]
- Kearsey, M.J.; Pooni, H.S. The Genetical Analysis of Quantitative Traits; Chapman and Hall: London, UK, 1996; pp. 1–17. [Google Scholar]
- Nybom, H. Comparison of different nuclear DNA markers for estimating intraspecific genetic diversity in plants. Mol. Ecol. 2004, 13, 1143–1155. [Google Scholar] [CrossRef]
- Smith, J.S.C.; Smith, O.S. Fingerprinting crop varieties. In Advances in Agronomy; Donald, L.S., Ed.; Elsevier: Amsterdam, The Netherlands, 1992; pp. 85–140. [Google Scholar]
- Ximenes, E.; Kim, Y.; Mosier, N.; Dien, B.; Ladisch, M. Inhibition of cellulases by phenols. Enzym. Microb. Technol. 2010, 46, 170–176. [Google Scholar] [CrossRef]
- González-Bautista, E.; Santana-Morales, J.C.; Ríos-Fránquez, F.J.; Poggi-Varaldo, H.M.; Ramos-Valdivia, A.C.; Cristiani-Urbina, E.; Ponce-Noyola, T. Phenolic compounds inhibit cellulase and xylanase activities of Cellulomonas flavigena PR-22. During saccharification of sugarcane bagasse. Fuel 2017, 196, 32–35. [Google Scholar] [CrossRef]
- Jeong, S.W.; Kwon, S.J.; Ryu, J.; Kim, J.B.; Ahn, J.W.; Kim, S.H.; Jo, Y.D.; Choi, H.I.; Im, S.B.; Kang, S.Y. Development of EST-SSR markers through de novo RNA sequencing and application for biomass productivity in kenaf (Hibiscus cannabinus L.). Genes Genom. 2017, 39, 1139–1156. [Google Scholar] [CrossRef]
- Ghimire, B.K.; Yu, C.Y.; Kim, S.H.; Chung, I.M. Assessment of Diversity in the Accessions of Setaria italica L. Based on Phytochemical and Morphological Traits and ISSR Markers. Molecules 2019, 24, 1486. [Google Scholar] [CrossRef] [PubMed] [Green Version]
- Chung, I.M.; Chelliah, R.; Oh, D.H.; Kim, S.H.; Yu, C.Y.; Ghimire, B.K. Tupistra nutans Wall. root extract, rich in phenolics, inhibits microbial growth and α‑glucosidase activity, while demonstrating strong antioxidant potential. Braz. J. Bot. 2019, 42, 383–397. [Google Scholar] [CrossRef]
- Thakur, A.K.; Singh, K.H.; Singh, L.; Nanjundan, J.; Khan, Y.J.; Singh, D. Patterns of subspecies genetic diversity among oilseed Brassica rapa as revealed by agro-morphological traits and SSR markers. J. Plant Biochem. Biotechnol. 2017, 26, 282–292. [Google Scholar] [CrossRef]
- Kaplan, F.; Kopka, J.; Haskell, D.W.; Zhao, W.; Schiller, K.C.; Gatzke, N.; Sung, D.Y.; Guy, C.L. Exploring the temperature-stress metabolome of Arabidopsis. Plant Physiol. 2004, 136, 4159–4168. [Google Scholar] [CrossRef] [Green Version]
- Wulff-Zottele, C.; Gatzke, N.; Kopka, J.; Orellana, A.; Hoefgen, R.; Fisahn, J.; Hesse, H. Photosynthesis and metabolism interact during acclimation of Arabidopsis thaliana to high irradiance and sulphur depletion. Plantcell Environ. 2010, 33, 1974–1988. [Google Scholar] [CrossRef]
- Jankanpaa, H.J.; Mishra, Y.; Schr€oder, W.P.; Jansson, S. Metabolic profiling reveals metabolic shifts in Arabidopsis plants grown under different light conditions. Plant Cell Environ. 2012, 35, 1824–1836. [Google Scholar] [CrossRef]
- Labra, M.; Miele, M.; Ledda, B.; Grassi, F.; Mazzei, M.; Sala, F. Morphological characterization, essential oil composition and DNA genotyping of Ocimum basilicum L. cultivars. Plant Sci. 2004, 167, 725–731. [Google Scholar] [CrossRef]
- Zhang, K.; Fan, G.; Zhang, X.; Zhao, F.; Wei, W.; Du, G.; Feng, X.; Wang, X.; Feng, W.F.; Song, G.; et al. Identification of QTLs for 14 agronomically important traits in Setaria italica based on SNPs generated from high-throughput sequencing. G3 Gene Genom Genet 2017, 7, 1587–1594. [Google Scholar] [CrossRef] [Green Version]
- Yan, J.; Chen, W.; Lou, F.; Ma, H.; Meng, A.; Liu, G.; Zhu, M.; Li, S.; Zhou, H.; Zhu, W.; et al. Variability and adaptability of Miscanthus species evaluated for energy crop domestication. GCB Bioenergy 2011, 4, 49–60. [Google Scholar] [CrossRef]
- Stewart, J.R.; Toma, Y.; Fernandez, F.G.; Nishiwaki, A.; Yamada, T.; Bollero, G. The ecology and agronomy of Miscanthus sinensis, a species important to bioenergy crop development, in its native range in Japan: A review. Glob. Chang. Biol. Bioenergy 2009, 1, 126–153. [Google Scholar] [CrossRef]
- Nishiwaki, A.; Mizuguti, A.; Kuwabara, S.; Toma, Y.; Ishigaki, G.; Miyashita, T.; Yamada, T.; Matuura, H.; Yamaguchi, S.; Rayburn, A.L.; et al. Discovery of natural Miscanthus (Poaceae) triploid plants in sympatric populations of Miscanthus sacchariflorus and Miscanthus sinensis in southern Japan. Am. J. Bot. 2011, 98, 154–159. [Google Scholar] [CrossRef] [PubMed]
- Christian, D.; Haase, E.; Clifton-Brown, J.; Cosentino, S. Agronomy of Miscanthus. In Miscanthus for Energy and Fibre; Jones, M.B., Walsh, M., Eds.; James & James: London, UK, 2000; pp. 21–45. [Google Scholar]
- Riche, A.; Christian, D. Estimates of rhizome weight of Miscanthus with time and rooting depth compared to switchgrass. Asp. Appl. Biol. 2001, 65, 147–152. [Google Scholar]
- Dalir, M.; Safarnejad, A. Morphological, Molecular and Phytochemical Variation in Some Thyme Genotypes. J. Med. Plants By-Prod. 2017, 1, 41–52. [Google Scholar]
- Dai, J.; Mumper, R.J. Plant phenolics: Extraction, analysis and their antioxidant and anticancer properties. Molecules 2010, 15, 7313–7352. [Google Scholar] [CrossRef]
- Lygin, A.; Upton, J.; Dohleman, F.G.; Juvik, O.J.; Olga, A.; Zabotina, O.A.; Widholm, J.M.; Lozovaya, V.V. Antioxidant activity and total phenolic compounds in extracts of selected grasses (Poaceae). Herba Pol. 2011, 55, 214–221. [Google Scholar]
- Schäfer, J.; Sattler, M.; Iqbal, Y.; Lewandowski, I.; Bunzel, M. Characterization of Miscanthus cell wall polymers. Gcb Bioenergy 2019, 11, 191–205. [Google Scholar] [CrossRef] [Green Version]
- Parveen, I.; Wilson, T.; Donnison, I.S.; Cookson, A.R.; Hauck, B.; Threadgill, M.D. Potential sources of high value chemicals from leaves, stems and flowers of Miscanthus sinensis ‘Goliath’ and Miscanthus Sacchariflorus. Phytochemistry 2013, 92, 160–167. [Google Scholar] [CrossRef] [Green Version]
- Donno, D.; Cerutti, A.K.; Prgomet, I.; Mellano, M.G.; Beccaro, G.L. Foodomics for mulberry fruit (Morus spp.): Analytical fingerprint as antioxidants’ and health properties’ determination tool. Food Res. Int. 2015, 69, 179–188. [Google Scholar] [CrossRef]
- Amarowicz, R.; Pegg, R.B.; Rahimi-Moghaddam, P.; Barl, B.; Weil, J.A. Free-radical scavenging capacity and antioxidant activity of selected plant species from the Canadian prairies. Food Chem. 2004, 84, 551–562. [Google Scholar] [CrossRef]
- Balasundram, N.; Sundram, K.; Samman, S. Phenolic compounds in plants and agri-industrial by-products: Antioxidant activity occurrence, and potential uses. Food Chem. 2006, 99, 191–203. [Google Scholar] [CrossRef]
- Zhang, H.Y.; Sun, Y.M.; Wang, X.L. Substituent effects on OH bond dissociation enthalpies and ionization potentials of catechols: A DFT study and its implications in the rational design of phenolic antioxidants and elucidation of structure–activity relationships for flavonoid antioxidants. Chem. Eur. 2003, 9, 502–508. [Google Scholar] [CrossRef] [PubMed]
- Moghaddam, M.; Mehdizadeh, L. Variability of total phenolic, flavonoid and rosmarinic acid content among Iranian basil accessions. LWT Food Sci. Technol. 2015, 63, 535–540. [Google Scholar] [CrossRef]
- Neuhouser, M.L. Flavonoids and cancer prevention: What is the evidence in humans? Pharm Biol. 2004, 42, 34–45. [Google Scholar] [CrossRef]
- Karimi, A.; Hadian, A.; Farzaneh, M.; Khadivi-Khub, A. Phenotypic diversity and volatile composition of Iranian Artemisia dracunculus. Indust. Crop. Prod. 2015, 65, 315–323. [Google Scholar] [CrossRef]
- Ghahremani-majd, H.; Dashti, F.; Dastan, D.; Mumivand, H.; Hadian, J.; Esna-Ashari, M. Antioxidant and antimicrobial activities of Iranian mooseer (Allium hirtifolium Boiss) populations. Hortic. Environ. Biotechnol. 2012, 53, 116–122. [Google Scholar] [CrossRef]
- Faudale, M.; Viladomat, F.; Bastida, J.; Poli, F.; Codina, C. Antioxidant activity and phenolic composition of wild, edible, and medicinal fennel from different Mediterranean countries. J. Agric. Food Chem. 2008, 56, 1912–1920. [Google Scholar] [CrossRef]
- Kamalakkannan, N.; Prince, P.S.M. Antihyperglycaemic and antioxidant effect of rutin, a polyphenolic flavonoid, in streptozotocin-induced diabetic wistar rats. Basic Clin. Pharmacol. Toxicol. 2006, 98, 97–103. [Google Scholar] [CrossRef]
- Kikuzaki, H.; Hisamoto, M.; Hirose, K.; Akiyama, K.; Taniguchi, H. Antioxidant properties of ferulic acid and its related compounds. J. Agric. Food Chem. 2002, 50, 2161–2168. [Google Scholar] [CrossRef]
- De Cássia Yukari Nishimura, F.; de Almeida, A.C.; Ratti, B.A.; Ueda-Nakamura, T.; Nakamura, C.V.; Ximenes, V.F.; de Oliveira Silva, S. Antioxidant Effects of Quercetin and Naringenin Are Associated with Impaired Neutrophil Microbicidal Activity. Evid.-Based Complement. Altern. Med. 2013, 2013, 795916. [Google Scholar] [CrossRef]
- Parhiz, H.; Roohbakhsh, A.; Soltani, F.; Rezaee, R.; Iranshahi, M. Antioxidant and anti-inflammatory properties of the citrus flavonoids hesperidin and hesperetin: An updated review of their molecular mechanisms and experimental models. Phytother. Res. 2015, 29, 323–331. [Google Scholar] [CrossRef] [PubMed]
- Graf, E. Antioxidant potential of ferulic acid. Free. Radic. Biol. Med. 1992, 13, 435–448. [Google Scholar] [CrossRef]
- Kanski, J.; Aksenova, M.; Stoyanova, A.; Butterfield, D.A. Ferulic acid antioxidant protection against hydroxyl and peroxyl radical oxidation in synaptosomal and neuronal cell culture systems in vitro: Structure-activity studies. J. Nutr. Biochem. 2002, 13, 273–281. [Google Scholar] [CrossRef]
- Lee, C.H.; Yang, L.; Xu, J.Z.; Yeung, S.Y.V.; Huang, Y.; Chen, Z.Y. Relative antioxidant activity of soybean isoflavones and their glycosides. Food Chem. 2005, 90, 735–741. [Google Scholar] [CrossRef]
- Davies, M.J. The oxidative environment and protein damage. Biochim. Biophys. Acta 2005, 1703, 93–109. [Google Scholar] [CrossRef]
- Karamac, M.; Kosinska, A.; Pegg, R.B. Comparison of radical-scavenging activities for selected phenolic acids. Pol. J. Food Nutr. Sci. 2005, 14, 165–170. [Google Scholar]
- Velika, B.; Kron, I. Antioxidant properties of benzoic acid derivatives against superoxide Radical. Free Radic. Antioxid. 2012, 2, 62–67. [Google Scholar] [CrossRef] [Green Version]
- Balcerek, M.; Rąk, I.; Majtkowska, G.; Majtkowski, W.; Blagojevic, D.P.; Grubor-Lajsic, G.N.; Spasic, M.B. Cold defence responses: The role of oxidative stress. Front. Biosci. 2011, 3, 416–427. [Google Scholar]
- García, A.; Toledano, A.; Andrés, M.A.; Labidi, J. Study of the antioxidant capacity of Miscanthus sinensis lignins. Process. Biochem. 2010, 45, 935–940. [Google Scholar] [CrossRef]
- Dorman, D.; Bachmayer, O.; Kosar, M.; Hiltunen, R. Antioxidant properties of aqueous extracts from selected lamiaceae species grown in Turkey. J. Agric. Food Chem. 2004, 52, 762–770. [Google Scholar] [CrossRef]
- Li, H.B.; Wong, C.C.; Cheng, K.W.; Chen, F. Antioxidant properties in vitro and total phenolic contents in methanol extracts from medicinal plants. Food Sci. Technol. 2008, 41, 385–390. [Google Scholar] [CrossRef]
- Petridis, A.; Therios, I.; Samouris, G. Genotypic variation of total phenol and oleuropein concentration and antioxidant activity of 11 Greek olive cultivars (Olea europaea L.). Hortscience 2012, 47, 339–342. [Google Scholar] [CrossRef] [Green Version]
- Ben Salah, M.; Abdelmelek, H.; Abderraba, M. Study of phenolic composition and biological activities assessment of olive leaves from different varieties grown in Tunisia. Med. Chem. 2012, 2, 107–111. [Google Scholar] [CrossRef] [Green Version]
- Fabbri, A.; Galaverna, G.; Ganino, T. Polyphenol composition of olive leaves with regard to cultivar, time of collection and shoot type. Acta Hortic. 2008, 791, 459–464. [Google Scholar] [CrossRef]
- Mokrani, A.; Madani, K. Effect of solvent, time and temperature on the extraction of phenolic compounds and antioxidant capacity of peach (Prunus persica L.) fruit. Sep. Purif. 2016, 162, 68–76. [Google Scholar] [CrossRef]
- Nakabayashi, R.; Yonekura-Sakakibara, K.; Urano, K.; Suzuki, M.; Yamada, Y.; Nishizawa, T.; Matsuda, F.; Kojima, M.; Sakakibara, H.; Shinozaki, K.; et al. Enhancement of oxidative and drought tolerance in Arabidopsis by over accumulation of antioxidant flavonoids. Plant J. 2014, 77, 367–379. [Google Scholar] [CrossRef]
- Winkel-Shirley, B. Biosynthesis of flavonoids and effects of stress. Curr. Opin. Plant Biol. 2002, 5, 218–223. [Google Scholar] [CrossRef]
- Becker, C.; Klaering, H.P.; Kroh, L.W.; Krumbein, A. Cool-cultivated red leaf lettuce accumulates cyanidin-3-O-(6″-O-malonyl)-glucoside and caffeoylmalic acid. Food Chem. 2014, 146, 404–411. [Google Scholar] [CrossRef] [Green Version]
- Bilger, W.; Rolland, M.; Nybakken, L. UV screening in higher plants induced by low temperature in the absence of UV-B radiation. Photochem. Photobiol. Sci. 2007, 6, 190–195. [Google Scholar] [CrossRef]
- Korn, M.; Peterek, S.; Mock, H.P.; Heyer, A.G.; Hincha, D.K. Heterosis in the freezing tolerance, and sugar and flavonoid contents of crosses between Arabidopsis thaliana accessions of widely varying freezing tolerance. Plant Cell Environ. 2008, 31, 813–827. [Google Scholar] [CrossRef] [Green Version]
- Schulz, E.; Tohge, T.; Zuther, E.; Fernie, A.R.; Hincha, D.K. Natural variation in flavonol and anthocyanin metabolism during cold acclimation in Arabidopsis thaliana accessions. Plant Cell Environ. 2015, 38, 1658–1672. [Google Scholar] [CrossRef] [PubMed]
- Griggio, M.A. Thermogenic mechanisms in cold-acclimated animals. Braz. J. Med. Biol. Res. 1988, 21, 171–176. [Google Scholar] [PubMed]
- Koehler, G.; Wilson, R.C.; Goodpaster, J.V.; Sønsteby, A.; Lai, X.; Witzmann, F.A.; You, J.-S.; Rohloff, J.; Randall, S.K.; Alsheikh, M. Proteomic study of low-temperature responses in strawberry cultivars (Fragaria x ananassa) that differ in cold tolerance. Plant Physiol. 2012, 59, 1787–1809. [Google Scholar] [CrossRef] [PubMed] [Green Version]
- Crifo, T.; Puglisis, I.; Petrone, G.; Recupero, G.R.; Lo Piero, A.R. Expression analysis in response to low temperature stress in blood oranges: Implication of the flavonoid biosynthetic pathway. Gene 2011, 476, 1–9. [Google Scholar] [CrossRef]
- Hannah, M.A.; Wiese, D.; Freund, S.; Fiehn, O.; Heyer, A.G.; Hincha, D.K. Natural genetic variation of freezing tolerance in Arabidopsis. Plant Physiol. 2006, 142, 98–112. [Google Scholar] [CrossRef] [Green Version]
- Kaplan, F.; Kopka, J.; Sung, D.Y.; Zhao, W.; Popp, M.; Porat, R.; Guy, C.L. Transcript and metabolite profiling during cold acclimation of Arabidopsis reveals an intricate relationship of cold-regulated gene expression with modifications in metabolite content. Plant J. 2007, 50, 967–981. [Google Scholar] [CrossRef]
- Wang, L.; Tu, Y.-C.; Lian, T.-W.; Hung, J.-T.; Yen, J.-H.; Wu, M.-J. Distinctive antioxidant and antiinflammatory effects of flavonols. J. Agric. Food Chem. 2006, 54, 9798–9804. [Google Scholar] [CrossRef]
- Agati, G.; Azzarello, E.; Pollastri, S.; Tattini, M. Flavonoids as antioxidants in plants: Location and functional significance. Plant Sci. 2012, 196, 67–76. [Google Scholar] [CrossRef]
- Steponkus, P.L. Role of the plasma membrane in freezing injury and cold acclimation. Annu. Rev. Plant Physiol. 1984, 35, 543–584. [Google Scholar] [CrossRef]
- Artus, N.N.; Uemura, M.; Steponkus, P.L.; Gilmour, S.J.; Lin, C.; Thomashow, M.F. Constitutive expression of the cold-regulated Arabidopsis thaliana COR15a gene affects both chloroplast and protoplast freezing tolerance. Proc. Natl. Acad. Sci. USA 1996, 93, 13404–13409. [Google Scholar] [CrossRef] [Green Version]
- Thalhammer, A.; Bryant, G.; Sulpice, R.; Hincha, D.K. Disordered Cold Regulated 15 proteins protect chloroplast membranes during freezing through binding and folding, but do not stabilize chloroplast enzymes in vivo. Plant Physiol. 2014, 166, 190–201. [Google Scholar] [CrossRef] [PubMed] [Green Version]
- Hamaguchi, T.; Ono, K.; Murase, A.; Yamada, M. Phenolic compounds prevent Alzheimer′s pathology through different effects on the amyloid-beta aggregation pathway. Am. J. Pathol. 2009, 175, 2557–2565. [Google Scholar] [CrossRef] [PubMed] [Green Version]
- Ono, K.; Li, L.; Takamura, Y.; Yoshiike, Y.; Zhu, L.; Han, F.; Mao, X.; Ikeda, T.; Takasaki, J.-I.; Nishijo, H.; et al. Phenolic compounds prevent amyloid β -protein oligomerization and synaptic dysfunction by site-specific binding. J. Biol. Chem. 2012, 287, 14631–14643. [Google Scholar] [CrossRef] [PubMed] [Green Version]
- Wang, J.; Ho, L.; Zhao, W.; Ono, K.; Rosensweig, C.; Chen, L.; Humala, N.; Teplow, D.B.; Pasinetti, G.M. Grape-derived polyphenolics prevent a β oligomerization and attenuate cognitive deterioration in a mouse model of Alzheimer’s disease. J. Neurosci. 2008, 28, 6388–6392. [Google Scholar] [CrossRef] [PubMed]
- Klochkova, T.A.; Kang, S.H.; Cho, G.Y.; Pueschel, C.M.; West, J.A.; Kim, G.H. Biology of a terrestrial green alga Chlorococcum sp. (Chlorococcales, Chlorophyta) collected from the Miruksazi stupa in Korea. Phycologia 2006, 45, 115–124. [Google Scholar] [CrossRef]
- Nagano, M.; Matsui, K.; Uemura, M. Klebsormidium flaccidum, a charophycean green alga, exhibits cold acclimation that is closely associated with compatible solute accumulation and ultrastructural changes. Plant Cell Environ. 2008, 31, 872–885. [Google Scholar] [CrossRef]
- Solecka, D.; Boudet, A.M.; Kacperska, A. Phenylpropanoid and anthocyanin changes in low-temperature treated winter oilseed rape leaves. Plant Physiol. Biochem. 1992, 37, 491–496. [Google Scholar] [CrossRef]
- Han, J.W.; Lee, K.P.; Yoon, M.; Kang, S.H.; Kim, G.H. Cold stress regulation of a bi-functional 3-dehydroquinate dehydratase/shikimate dehydrogenase (DHQ/SDH)-like gene in the freshwater green alga Spirogyra varians. Bot. Mar. 2009, 52, 178–185. [Google Scholar] [CrossRef]
- Zykova, V.V.; Grabel’nykh, O.I.; Turchaninova, V.V.; Antipina, A.I.; Koroleva, N.A.; Kolesnichenko, A.V.; Pobezhimova, T.P.; Konstantinov, Y.M.; Voinikov, V.K. The Effect of CSP310 on Lipid Peroxidation and Respiratory Activity in Winter Wheat Mitochondria. Russ. J. Plant Physiol. 2002, 49, 628–634. [Google Scholar] [CrossRef]
- Rice-Evans, C.A.; Miller, N.J.; Paganga, G. Antioxidant Properties of Phenolic Compounds. Trends Plant Sci. 1997, 2, 152–159. [Google Scholar] [CrossRef]
- Zhao, H.J.; Zou, Q. Protective Effects of Exogenous Antioxidants and Phenolic Compounds on Photosynthesis of Wheat Leaves under High Irradiance and Oxidative Stress. Photosynthetica 2002, 40, 523–527. [Google Scholar] [CrossRef]
- Lin, C.M.; Chen, C.T.; Lee, H.H.; Lin, J.K. Prevention of Cellular ROS Damage by Isovitexin and Related Flavonoids. Planta Med. 2002, 68, 365–367. [Google Scholar] [CrossRef] [PubMed]
- Pociecha, E.; Płażek, A.; Janowiak, F.; Zwierzykowski, Z. ABA level, proline and phenolic concentration, and PAL activity induced during cold acclimation in androgenic Festulolium forms with contrasting resistance to frost and pink snow mould (Microdochium nivale). Physiol. Mol. Plant Pathol. 2008, 73, 126–132. [Google Scholar] [CrossRef]
- Dubas, E.; Gołębiowska, G.; Żur, I.; Wędzony, M. Microdochium nivale (Fr., Samuels & Hallett): Cytological analysis of the infection process in triticale (x Triticosecale Wittm.). Acta Physiol. Plant. 2011, 33, 529–537. [Google Scholar]
- Żur, I.; Dubas, E.; Pociecha, E.; Dubert, F.; Kolasińska, I.; Płażek, A. Cytological analysis of infection process and the first defence responses induced in winter rye (Secale cereale L.) seedlings inoculated with Microdochium nivale. Physiol. Mol. Plant Pathol. 2011, 76, 189–196. [Google Scholar] [CrossRef]
- Janas, K.M.; Cvikrová, M.; Palagiewicz, A.; Szafranska, K.; Posmyk, M.M. Constitutive Elevated Accumulation of Phenylpropanoids in Soybean Roots at Low Temperature. Plant Sci. 2002, 163, 369–373. [Google Scholar] [CrossRef]
- Chalker-Scott, L. Environmental Significance of Anthocyanins in Plant Stress Responses. Photochem. Photobiol. 1999, 70, 1–9. [Google Scholar] [CrossRef]
- Gołębiowska‑Pikania, G.; Dziurka, M.; Iwona Wąsek, I.; Wajdzik, K.; Dyda, M.; Wędzony, M. Changes in phenolic acid abundance involved in low temperature and Microdochium nivale (Samuels and Hallett) cross-tolerance in winter triticale (x Triticosecale Wittmack). Acta Physiol. Plant. 2019, 41, 38. [Google Scholar] [CrossRef] [Green Version]
- Ghasemi, P.A.; Hashemi, M.; Taherian Ghahfarokhi, F. Essential oil and chemical compositions of wild and cultivated Thymus daenensis Celak and Thymus vulgaris L. Ind. Crops Prod. 2013, 48, 43–48. [Google Scholar] [CrossRef]
- Gasch, A.P.; Spellman, P.T.; Kao, C.M.; Carmel-Harel, O.; Eisen, M.B.; Storz, G.; Saitou, N.; Nei, M. The neighbor-joining method: A new method for reconstructing phylogenetic trees. Mol. Biol. Evol. 1987, 4, 406–425. [Google Scholar]
- Mediani, A.; Abas, F.; Khatib, A.; Ping, T.C.; Lajis, N.H. Influence of growth stage and season on the antioxidant constituents of Cosmos caudatus. Plant Food Hum. Nutr. 2012, 67, 344–350. [Google Scholar] [CrossRef] [PubMed]
- Jugran, A.K.; Bahukhandi, A.; Dhyani, P.; Bhatt, I.D.; Rawal, R.S.; Nandi, S.K. Impact of Altitudes and Habitats on Valerenic Acid, Total Phenolics, Flavonoids, Tannins, and Antioxidant Activity of Valeriana jatamansi. Appl. Biochem. Biotechnol. 2016, 179, 911–926. [Google Scholar] [CrossRef] [PubMed]


| Accession | Origin | Latitude | Longitude | Elevation (m) |
|---|---|---|---|---|
| MS-179 | China | 36.19179 | 120.38175 | −3 |
| MS-196 | China | 33.07787 | 118.1983 | 27 |
| MS-212 | China | 36.07295 | 120.36186 | 26 |
| MS-239 | China | 40.37234 | 123.59073 | 103 |
| MS-244 | China | 36.0758 | 120.33541 | 3 |
| MS-258 | China | 37.46181 | 118.40062 | 9 |
| MS-271 | China | 31.52864 | 118.46166 | 28 |
| MS-279 | China | 37.24615 | 121.45671 | −1 |
| MS-186 | Korea | 35.788876 | 127.083015 | 61 |
| MS-201 | Korea | 36.316388 | 128.554166 | 64 |
| MS-207 | Korea | 35.469166 | 129.215 | 57 |
| MS-241 | Korea | 36.232777 | 128.563611 | 83 |
| MS-247 | Korea | 37.196791 | 127.874303 | 236 |
| MS-274 | Korea | 36.451666 | 127.451944 | 37 |
| MS-278 | Korea | 37.778228 | 127.371022 | 142 |
| MS-447 | Korea | 35.695697 | 128.3224 | 16 |
| MS-248 | Japan | 35.63627 | 136.94965 | 123 |
| MS-249 | Japan | 34.93411 | 133.33 | 362 |
| MS-190 | Japan | 38.72429 | 139.85879 | 15.6 |
| MS-231 | Japan | 42.57628 | 140.79830 | 87 |
| MS-422 | Japan | 35.37239 | 136.77384 | 14.5 |
| MS-425 | Japan | 38.37632 | 140.31934 | 90.4 |
| MS-448 | Japan | 43.411547 | 144.52969 | 63.95 |
| MS-530 | Japan | 42.66314 | 141.759849 | 4 |
| MS-232 | Russia | 48.6669 | 132.982 | 69 |
| MS-233 | Russia | 48.6241 | 135.13425 | 28 |
| MS-253 | Russia | 43.75277 | 132.0803 | 59 |
| MS-240 | Russia | 49.0646 | 136.5176 | 21 |
| MS-394 | Russia | 48.36315 | 135.0705 | 67 |
| MS-403 | Russia | 48.5213 | 134.95441 | 35 |
| MS-421 | Russia | 46.865 | 134.269 | 86 |
| MS-430 | Russia | 44.69109 | 131.95929 | 113 |
| 2 Acc. No. | Plant Height (cm) | 1 HD (days) | HD50% (days) | FD (days) | FD 50% (days) | TC | CL (cm) |
|---|---|---|---|---|---|---|---|
| MS-179 | 52.50 ± 2.00 j | 172 | 187 | 194 | 201 | 248.50 ± 5.00 s | 182.10 ± 4.00 m |
| MS-196 | 115.00 ± 1.50 x | 142 | 158 | 184 | 201 | 386.50 ± 4.00 x | 214.50 ± 2.00 u |
| MS-212 | 61.00 ± 2.00 m | 142 | 158 | 184 | 201 | 222.10 ± 6.00 p | 271.30 ± 6.00 ee |
| MS-239 | 147.10 ± 3.00 z | 155 | 169 | 187 | 194 | 825. 50 ± 8.00 z | 172.50 ± 2.00 j |
| MS-244 | 56.50 ± 1.50 k | 172 | 187 | 194 | 211 | 71. 10 ± 2.00 c | 214.20 ± 3.00 u |
| MS-258 | 163.20 ± 4.00 bb | 172 | 187 | 194 | 211 | 176. 60 ± 5.00 k | 265.20 ± 5.00 dd |
| MS-271 | 61.10 ± 1.20 mn | 156 | 170 | 187 | 194 | 96.10 ± 2.00 f | 242.10 ± 9.00 z |
| MS-279 | 27.20 ± 1.10 c | 172 | 187 | 194 | 211 | 219.50 ± 5.50 o | 196.10 ± 5.00 o |
| MS-186 | 49.50 ± 1.70 h | 155 | 169 | 184 | 201 | 150.10 ± 3.00 j | 202.00 ± 2.00 p |
| MS-201 | 151.40 ± 3.00 aa | 155 | 169 | 184 | 201 | 299.50 ± 6.00 vw | 207.50 ± 7.00 s |
| MS-207 | 49.11 ± 2.00 h | 155 | 169 | 184 | 201 | 500.90 ± 7.00 y | 124.50 ± 6.00 f |
| MS-241 | 43.20 ± 1.50 g | 142 | 158 | 184 | 201 | 228.50 ± 4.00 r | 175.10 ± 2.00 k |
| MS-247 | 50.10 ± 1.50 i | 142 | 158 | 184 | 201 | 203.10 ± 2.00 l | 247.20 ± 6.00 bb |
| MS-274 | 103.00 ± 4.00 v | 135 | 142 | 158 | 170 | 94.60 ± 2.00 ef | 223.20 ± 7.00 x |
| MS-278 | 92.00 ± 2.00 t | 142 | 158 | 184 | 201 | 97.70 ± 3.00 fg | 232.50 ± 8.00 y |
| MS-447 | 57.50 ± 1.00 l | 135 | 142 | 158 | 168 | 297.50 ± 7.00 v | 260.20 ± 5.00 cc |
| MS-248 | 40.20 ± 1.50 e | 142 | 158 | 184 | 201 | 101.20 ± 4.00 g | 217.30 ± 6.00 v |
| MS-249 | 39.20 ± 1.00 d | 113 | 132 | 145 | 152 | 93.10 ± 2.00 e | 186.20 ± 5.00 n |
| MS-190 | 20.20 ± 1.30 b | 142 | 158 | 184 | 201 | 74.40 ± 1.00 d | 243.00 ± 2.00 aa |
| MS-231 | 98.20 ± 2.80 u | 185 | 201 | 0 | 0 | 222.20 ± 8.00 p | 203.50 ± 4.00 q |
| MS-422 | 41.11 ± 2.00 f | 156 | 170 | 187 | 194 | 46.30 ± 1.00 a | 206.50 ± 7.00 r |
| MS-425 | 62.20 ± 2.00 n | 156 | 170 | 187 | 194 | 68.20 ± 1.00 b | 222.80 ± 6.70 w |
| MS-448 | 18.10 ± 1.00 a | 113 | 132 | 145 | 152 | 213.20 ± 5.00 m | 110.80 ± 6.40 d |
| MS-530 | 67.10 ± 2.90 no | 156 | 170 | 187 | 194 | 110.20 ± 3.00 h | 178.10 ± 6.20 l |
| MS-232 | 74.50 ± 2.00 p | 106 | 111 | 132 | 142 | 324.30 ± 8.00 w | 147.20 ± 6.00 h |
| MS-233 | 71.00 ± 1.90 o | 88 | 106 | 121 | 132 | 69.50 ± 4.00 bc | 75.10 ± 2.00 a |
| MS-253 | 89.10 ± 2.00 s | 88 | 106 | 121 | 132 | 123.20 ± 3.00 i | 123.20 ± 6.00 e |
| MS-240 | 80.50 ± 2.00 r | 95 | 106 | 113 | 132 | 280.10 ± 6.00 u | 212.20 ± 5.00 t |
| MS-394 | 115.20 ± 2.00 x | 76 | 81 | 88 | 106 | 272.30 ± 8.00 t | 133.30 ± 2.00 g |
| MS-403 | 75.20 ± 3.00 q | 76 | 81 | 88 | 106 | 204.20 ± 3.00 lm | 93.20 ± 6.00 bc |
| MS-421 | 104.09 ± 3.00 w | 88 | 106 | 121 | 132 | 224.50 ± 4.00 q | 94.20 ± 6.00 c |
| MS-430 | 141.20 ± 2.00 y | 88 | 106 | 121 | 132 | 217.10 ± 5.00 n | 164.30 ± 6.00 i |
| Acc. No. | 1 COD (mm) | CNN | AIL (cm) | Fresh Weight (g) | Dry Weight (g) | Moisture Content (%) | CCirc/BCirc | TCmN/Area |
|---|---|---|---|---|---|---|---|---|
| MS-179 | 4.00 c | 16 | 11.38 ± 1.10 d | 2002.00 ± 15.01 k | 1210.00 ± 10.00 q | 39.50 | 0.30 | 0.0128 |
| MS-196 | 5.00 d | 14 | 15.29 ± 1.90 h | 2806.00 ± 17.02 o | 1750.00 ± 10.00 w | 37.50 | 0.20 | 0.0120 |
| MS-212 | 6.10 ef | 17 | 15.94 ± 1.50 h | 3100.00 ± 19.00 p | 1822.80 ± 12.00 x | 41.20 | 0.20 | 0.0283 |
| MS-239 | 4.12 c | 11 | 15.64 ± 1.30 h | 2104.00 ± 14.03 l | 1386.00 ± 90.00 s | 34.00 | 0.40 | 0.0268 |
| MS-244 | 8.11 h | 10 | 16.33 ± 2.00 i | 203.00 ± 10.00 e | 141.00 ± 4.00 h | 29.50 | 0.10 | 0.0133 |
| MS-258 | 6.13 ef | 18 | 15.38 ± 1.50 h | 2201.00 ± 18.00 m | 1507.00 ± 10.00 v | 31.50 | 0.10 | 0.0158 |
| MS-271 | 10.00 i | 21 | 14.72 ± 1.30 g | 5405.00 ± 20.01 t | 3429.00 ± 18.00 bb | 36.50 | 0.10 | 0.0110 |
| MS-279 | 4.11 c | 17 | 15.47 ± 1.70 h | 501.00 ± 11.00 g | 315.00 ± 7.00 j | 37.00 | 0.10 | 0.0142 |
| MS-186 | 6.00 ef | 15 | 13.47 ± 1.11 f | 3802.00 ± 20.01 q | 2584.00 ± 20.40 y | 32.00 | 0.20 | 0.0096 |
| MS-201 | 10.00 i | 16 | 12.94 ± 1.30 e | 4801.00 ± 18.00 r | 3225.60 ± 20.20 aa | 32.80 | 0.50 | 0.0178 |
| MS-207 | 5.00 d | 12 | 10.33 ± 1.00 c | 2103.00 ± 20.00 l | 1375.50 ± 10.00 r | 34.50 | 0.30 | 0.0489 |
| MS-241 | 5.11 d | 12 | 14.58 ± 1.20 g | 2402.00 ± 20.01 n | 1596.00 ± 9.00 v | 33.50 | 0.30 | 0.0236 |
| MS-247 | 6.00 ef | 16 | 21.40 ± 1.20 k | 1400.00 ± 14.01 j | 963.20 ± 10.00 p | 31.20 | 0.10 | 0.0189 |
| MS-274 | 5.22 d | 15 | 11.52 ± 1.10 d | 2202.00 ± 20.01 m | 1421.20 ± 10.00 u | 35.40 | 0.20 | 0.0248 |
| MS-278 | 4.00 c | 15 | 14.87 ± 2.00 g | 2205.00 ± 23.00 m | 1397.00 ± 20.00 t | 36.50 | 0.20 | 0.0148 |
| MS-447 | 7.00 g | 14 | 18.57 ± 1.90 j | 1402.00 ± 12.00 j | 952.00 ± 15.00 o | 32.00 | 0.10 | 0.0155 |
| MS-248 | 5.11 d | 18 | 15.44 ± 1.10 h | 500.00 ± 9.00 g | 320.00 ± 10.00 k | 36.00 | 0.20 | 0.0148 |
| MS-249 | 6.12 ef | 13 | 12.06 ± 1.19 e | 5000.00 ± 23.00 s | 2825.00 ± 7.00 z | 43.50 | 0.20 | 0.0093 |
| MS-190 | 10.00 i | 18 | 13.50 ± 1.20 f | 600.03 ± 14.00 h | 372.00 ± 10.00 l | 38.00 | 0.10 | 0.0050 |
| MS-231 | 7.00 g | 14 | 14.50 ± 1.50 g | 503.00 ± 10.00 g | 321.00 ± 7.00 k | 35.80 | 0.10 | 0.0048 |
| MS-422 | 6.12 ef | 24 | 10.44 ± 1.00 c | 904.00 ± 13.00 i | 589.50 ± 10.00 m | 34.50 | 0.10 | 0.0128 |
| MS-425 | 5.11 d | 16 | 13.88 ± 1.20 f | 1403.00 ± 12.00 j | 910.00 ± 20.00 n | 35.00 | 0.10 | 0.0150 |
| MS-448 | 4.33 c | 14 | 7.86 ± 1.00 a | 150.00 ± 7.00 c | 100.50 ± 4.02 d | 33.00 | 0.10 | 0.0197 |
| MS-530 | 5.23 d | 11 | 15.18 ± 1.50 h | 504.00 ± 10.00 g | 315.00 ± 10.00 j | 37.00 | 0.10 | 0.0136 |
| MS-232 | 2.00 b | 8 | 18.38 ± 2.00 j | 181.03 ± 12.00 d | 113.40 ± 4.00 f | 37.00 | 0.20 | 0.0065 |
| MS-233 | 2.11 b | 8 | 9.38 ± 1.00 b | 153.04 ± 11.00 c | 99.75 ± 3.00 c | 33.50 | 0.40 | 0.0293 |
| MS-253 | 1.01 a | 8 | 14.31 ± 1.13 g | 504.08 ± 19.00 g | 327.50 ± 10.00 j | 34.50 | 0.10 | 0.0069 |
| MS-240 | 4.11 c | 14 | 15.14 ± 1.10 h | 123.00 ± 11.00 a | 82.80 ± 3.00 a | 31.00 | 0.10 | 0.0084 |
| MS-394 | 4.12 c | 12 | 11.53 ± 1.00 d | 250.03 ± 14.00 f | 161.25 ± 4.00 i | 35.50 | 0.20 | 0.0911 |
| MS-403 | 4.10 c | 9 | 11.08 ± 0.90 d | 150.02 ± 11.00 c | 103.50 ± 5.02 e | 31.00 | 0.10 | 0.0239 |
| MS-421 | 6.17 ef | 9 | 10.33 ± 0.80 c | 200.00 ± 13.00 e | 126.00 ± 7.03 g | 37.00 | 0.80 | 0.0696 |
| MS-430 | 4.15 c | 11 | 14.91 ± 1.10 g | 146.00 ± 11.00 b | 93.44 ± 6.04 b | 36.00 | 0.20 | 0.0101 |
| PH | HD | HD 50% | FD | FD 50% | CN | CL | COD | CNN | AIL | Fresh Weight | Dry Weight | Moisture Content | 1 CCirc/BCirc | TCmN/Area | |
|---|---|---|---|---|---|---|---|---|---|---|---|---|---|---|---|
| PH | 1 | −0.122 | −0.135 | −0.218 | −0.206 | 0.391 * | −0.013 | −0.058 | −0.225 | 0.082 | 0.095 | 0.122 | −0.158 | 0.335 | 0.209 |
| HD | 1 | 0.993 ** | 0.505 ** | 0.469 ** | 0.036 | 0.628 ** | 0.492 ** | 0.568 ** | 0.277 | 0.362 * | 0.383 * | 0.019 | −0.161 | −0.388 * | |
| HD 50% | 1 | 0.513 ** | 0.475 ** | 0.013 | 0.607 ** | 0.487 ** | 0.564 ** | 0.251 | 0.368 * | 0.386 * | 0.050 | −0.127 | −0.404 * | ||
| FD | 1 | 0.994 ** | −0.002 | 0.457 ** | 0.255 | 0.445 * | 0.210 | 0.413 * | 0.428 * | 0.042 | 0.021 | −0.193 | |||
| FD 50% | 1 | 0.000 | 0.455 ** | 0.250 | 0.428 * | 0.221 | 0.398 * | 0.415 * | 0.007 | 0.020 | −0.162 | ||||
| CN | 1 | −0.163 | −0.164 | −0.267 | 0.123 | 0.064 | 0.080 | −0.081 | 0.328 | 0.252 | |||||
| CL | 1 | 0.566 ** | 0.699 ** | 0.600 ** | 0.419 * | 0.425 * | 0.068 | −0.374 * | −0.440 * | ||||||
| COD | 1 | 0.540 ** | 0.117 | 0.484 ** | 0.499 ** | −0.012 | 0.010 | −0.122 | |||||||
| CNN | 1 | 0.047 | 0.393 * | 0.400 * | 0.135 | −0.291 | −0.265 | ||||||||
| AIL | 1 | 0.031 | 0.043 | −0.114 | −0.311 | −0.376 * | |||||||||
| Fresh weight | 1 | 0.996 ** | 0.287 | 0.143 | −0.154 | ||||||||||
| Dry weight | 1 | 0.219 | 0.152 | −0.151 | |||||||||||
| Moisture content | 1 | 0.166 | 0.003 | ||||||||||||
| CCirc/BCirc | 1 | 0.509 ** | |||||||||||||
| TCmN/Area | 1 |
| Accessions | IC50 (µg mL−1) | TPC (mg GAE g−1) | TFC (mg QE g−1) | |
|---|---|---|---|---|
| 1 DPPH | ABTS | |||
| MS-179 | 51.36 ± 2.46 g | 48.84 ± 0.59 f | 70.00 ± 3.00 r | 32.28 ± 1.20 t |
| MS-196 | 88.75 ± 0.50 p | 72.94 ± 2.84 p | 32.58 ± 2.00 j | 18.86 ± 1.00 o |
| MS-212 | 67.31 ± 1.75 kl | 51.61 ± 1.30 g | 31.36 ± 2.00 i | 13.54 ± 1.11 jkl |
| MS-239 | 58.30 ± 3.07 ij | 50.71 ± 1.35 fg | 36.35 ± 2.01 l | 15.7 ± 1.01 mn |
| MS-244 | 50.23 ± 1.30 g | 63.22 ± 2.76 mn | 30.23 ± 1.01 h | 13.53 ± 1.00 jkl |
| MS-258 | 41.50 ± 3.12 e | 25.65 ± 2.06 a | 58.49 ± 2.90 p | 21.56 ± 1.50 p |
| MS-271 | 71.89 ± 2.07 m | 83.62 ± 2.02 q | 29.06 ± 1.01 g | 12.37 ± 1.00 hi |
| MS-279 | 31.55 ± 2.01 b | 56.27 ± 2.01 jkl | 59.97 ± 3.00 q | 24.24 ± 1.20 q |
| MS-186 | 85.29 ± 6.79 o | 65.96 ± 2.28 o | 37.27 ± 2.00 m | 15.37 ± 1.11 m |
| MS-201 | 49.60 ± 1.81 g | 53.63 ± 0.12 hi | 48.44 ± 2.80 n | 18.59 ± 1.10 o |
| MS-207 | 91.47 ± 3.06 q | 57.62 ± 1.39 kl | 32.49 ± 2.90 j | 12.96 ± 1.12 ij |
| MS-241 | 37.41 ± 1.78 d | 56.71 ± 1.40 jk | 34.53 ± 2.02 k | 16.22 ± 1.01 n |
| MS-247 | 45.32 ± 2.12 f | 26.48 ± 2.39 ab | 37.56 ± 2.50 m | 15.46 ± 1.13 mn |
| MS-274 | 31.52 ± 3.45 b | 52.94 ± 1.00 gh | 81.03 ± 4.02 s | 28.81 ± 1.50 s |
| MS-278 | 30.41 ± 0.61 b | 55.11 ± 0.96 hij | 48.52 ± 3.01 n | 21.65 ± 1.80 p |
| MS-447 | 28.85 ± 1.53 a | 51.31 ± 1.01 g | 52.87 ± 2.01 o | 25.39 ± 1.90 r |
| MS-248 | 99.25 ± 1.63 r | 62.88 ± 1.38 m | 29.25 ± 2.00 g | 11.67 ± 1.11 g |
| MS-249 | 57.06 ± 1.59 ij | 58.61 ± 1.35 l | 34.51 ± 1.40 k | 15.66 ± 1.01 mn |
| MS-190 | 59.28 ± 2.77 j | 36.82 ± 2.67 e | 28.69 ± 2.00 g | 14.14 ± 0.90 l |
| MS-231 | 44.38 ± 1.37 f | 26.51 ± 0.87 ab | 24.64 ± 2.00 f | 10.74 ± 0.90 f |
| MS-422 | 55.41 ± 0.63 h | 29.09 ± 1.32 bc | 21.65 ± 1.20 de | 13.02 ± 1.00 ijk |
| MS-425 | 55.36 ± 1.31 h | 28.17 ± 1.40 ab | 22.3 ± 1.20 e | 12.19 ± 1.00 ghi |
| MS-448 | 34.26 ± 0.94 c | 51.90 ± 0.65 g | 21.67 ± 2.10 de | 10.91 ± 0.70 fg |
| MS-530 | 69.37 ± 0.35 l | 56.02 ± 1.28 jkl | 9.97 ± 1.30 b | 5.1 ± 0.70 bc |
| MS-232 | 66.52 ± 3.91 k | 64.13 ± 1.27 mn | 6.58 ± 0.50 a | 2.57 ± 0.10 a |
| MS-233 | 77.31 ± 2.53 n | 72.84 ± 6.19 p | 11.98 ± 1.20 cd | 5.11 ± 0.10 bc |
| MS-253 | 41.99 ± 1.48 e | 31.24 ± 0.64 cd | 21.04 ± 1.01 e | 9.84 ± 1.00 e |
| MS-240 | 34.45 ± 0.80 cd | 52.52 ± 1.35 gh | 21.77 ± 2.03 de | 13.8 ± 1.10 kl |
| MS-394 | 56.48 ± 7.64 hi | 58.59 ± 0.81 l | 11.9 ± 1.00 cd | 6.64 ± 0.50 d |
| MS-403 | 71.83 ± 10.45 m | 31.75 ± 0.89 d | 12.49 ± 1.20 d | 5.73 ± 1.00 c |
| MS-421 | 90.06 ± 2.80 q | 35.69 ± 3.26 e | 11.3 ± 1.00 c | 4.06 ± 1.10 b |
| MS-430 | 54.53 ± 1.38 h | 28.37 ± 1.79 ab | 12.67 ± 1.10 d | 5.13 ± 1.00 bc |
| Compounds | 1 RT | Q1 (m/z) a | Q3(m/z) b | DP (V) c | EP (V) d | CEP (V) e | CE (eV) f | CXP (V) g |
|---|---|---|---|---|---|---|---|---|
| Gallic acid | 5.92 | 169.056 | 125.000 | −26.000 | −10.000 | −8.000 | −20.000 | −6.000 |
| Protocatechuic acid | 8.07 | 152.896 | 108.900 | −16.000 | −9.000 | −10.000 | −22.000 | −6.000 |
| Gentisic acid | 10.67 | 152.871 | 107.900 | −16.000 | −8.500 | −6.000 | −28.000 | −22.000 |
| p-hydroxybenzoic acid | 10.03 | 136.885 | 92.900 | −16.000 | −8.500 | −12.000 | −24.000 | −6.000 |
| Chlorogenic acid | 8.16 | 352.846 | 191.000 | −21.000 | −7.000 | −32.000 | −30.000 | −10.000 |
| p-coumaric acid | 11.81 | 162.866 | 118.900 | −11.000 | −7.000 | −14.000 | −20.000 | −6.000 |
| Ferulic acid | 12.47 | 192.881 | 133.900 | −11.000 | −10.000 | −12.000 | −22.000 | −8.000 |
| m-Coumaric acid | 13.04 | 162.886 | 118.900 | −21.000 | −9.000 | −8.000 | −22.000 | −4.000 |
| Rutin | 10.04 | 609.002 | 299.700 | −91.000 | −10.500 | −34.000 | −52.000 | −14.000 |
| Quercetin | 16.11 | 300.884 | 150.800 | −31.000 | −10.500 | −18.000 | −28.000 | −32.000 |
| Kaempferol | 19.46 | 284.826 | 65.000 | −81.000 | −8.500 | −20.000 | −72.000 | −12.000 |
| 2,4-dihydroxybenzoic acid | 11.54 | 152.900 | 108.900 | −21.000 | −4.500 | −10.000 | −18.000 | −6.000 |
| Homogentisic acid | 7.10 | 166.920 | 122.900 | −21.000 | −7.000 | −14.000 | −14.000 | −28.000 |
| Salicylic acid | 16.51 | 136.874 | 92.900 | −16.000 | −7.500 | −12.000 | −22.000 | −6.000 |
| Vanillic acid | 10.46 | 166.883 | 151.900 | −11.000 | −6.500 | −10.000 | −18.000 | −32.000 |
| Caffeic acid | 10.12 | 178.868 | 134.800 | −16.000 | −8.000 | −14.000 | −22.000 | −6.000 |
| Orientin | 9.76 | 447.092 | 327.000 | −61.000 | −11.000 | −20.000 | −22.000 | −54.000 |
| Vitexin | 10.28 | 430.826 | 310.800 | −56.000 | −9.000 | −28.000 | −22.000 | −50.000 |
| Apigenin | 18.59 | 268.948 | 117.000 | −46.000 | −10.000 | −20.000 | −56.000 | −8.000 |
| Luteolin | 15.73 | 284.966 | 133.200 | −66.000 | −10.000 | −16.000 | −46.000 | −30.000 |
| L-Phenylalanine | 5.92 | 163.888 | 146.8 | −41.000 | −10.500 | −12.000 | −18.000 | −10.000 |
| Veratric acid | 12.96 | 180.991 | 136.900 | −16.000 | −7.500 | −12.000 | −18.000 | −8.000 |
| (a) | |||||||||
| Acc. No. | GA | PR | GE | p-HY | CH | p-C | FE | ||
| MS-179 | <LOQ | 20.73 ± 0.64 d | 7.68 ± 0.39 l | 48.43 ± 1.75 l | 43.83 ± 1.00 e | 48.03 ± 2.79 k | 24.89 ± 1.31 g | ||
| MS-196 | <LOQ | 30.40 ± 1.74 l | 1.36 ± 0.06 a | 26.50 ± 1.20 f | 105.00 ± 2.00 u | 26.33 ± 0.86 b | 17.73 ± 2.21 c | ||
| MS-212 | 3.18 ± 0.43 c | 32.83 ± 0.72 m | 4.49 ± 0.19 f | 53.67 ± 0.64 o | 51.90 ± 1.74 i | 49.43 ± 1.36 l | 34.73 ± 0.64 k | ||
| MS-239 | 3.86 ± 0.56 e | 27.30 ± 1.64 i | 13.02 ± 0.36 q | 50.77 ± 0.90 m | 455.67 ± 8.15 ff | 74.47 ± 1.56 r | 48.36 ± 3.72 q | ||
| MS-244 | 3.77 ± 0.07 e | 76.533 ± 2.59 w | 12.16 ± 0.65 p | 54.07 ± 2.85 p | 326.33 ± 11.59 ee | 153.00 ± 18.52 y | 29.17 ± 1.67 hi | ||
| MS-258 | <LOQ | 16.13 ± 0.75 a | 5.36 ± 0.18 i | 34.27 ± 1.68 i | 85.50 ± 2.41 o | 34.07 ± 0.12 e | 16.13 ± 2.21 b | ||
| MS-271 | ND | 26.80 ± 0.72 h | 4.25 ± 0.38 f | 41.73 ± 0.85 k | 83.03 ± 4.60 n | 42.97 ± 2.40 h | 16.82 ± 3.29 b | ||
| MS-279 | <LOQ | 26.60 ± 0.50 h | 6.57 ± 0.15 j | 26.43 ± 0.45 f | 33.63 ± 0.55 a | 34.87 ± 0.29 f | 17.53 ± 0.87 c | ||
| MS-186 | <LOQ | 18.40 ± 0.56 b | 2.02 ± 0.09 b | 25.90 ± 1.39 e | 153.33 ± 4.16 z | 28.83 ± 1.24 c | 22.99 ± 2.44 e | ||
| MS-201 | ND | 21.80 ± 0.78 f | 9.47 ± 0.18 n | 71.50 ± 0.80 x | 65.10 ± 3.40 k | 49.23 ± 2.14 l | 21.90 ± 1.43 d | ||
| MS-207 | 4.17 ± 0.29 g | 37.37 ± 0.47 p | 3.51 ± 0.05 e | 41.53 ± 0.80 k | 98.00 ± 1.77 s | 44.30 ± 1.57 i | 34.64 ± 4.47 k | ||
| MS-241 | 3.76 ± 0.29 e | 39.13 ± 0.75 q | 7.13 ± 0.25 k | 51.33 ± 4.18 n | 115.33 ± 2.08 v | 45.80 ± 0.36 j | 33.91 ± 2.26 j | ||
| MS-247 | <LOQ | 37.20 ± 1.55 o | 4.87 ± 0.25 g | 36.07 ± 0.64 j | 141.67 ± 4.76 y | 57.17 ± 2.53 m | 29.99 ± 3.31 i | ||
| MS-274 | 2.59 ± 0.09 a | 29.23 ± 0.82 k | 3.79 ± 0.07 e | 14.13 ± 0.50 b | 161.00 ± 3.46 aa | 45.23 ± 2.35 j | 42.45 ± 3.54 n | ||
| MS-278 | 4.49 ± 0.44 h | 56.80 ± 4.60 s | 3.38 ± 0.09 e | 14.07 ± 0.25 b | 296.00 ± 1.00 dd | 58.07 ± 3.15 n | 42.93 ± 2.35 o | ||
| MS-447 | <LOQ | 21.67 ± 0.91 f | 10.80 ± 0.84 o | 6.19 ± 0.41 a | 138.00 ± 3.46 x | 20.40 ± 1.99 a | 21.44 ± 1.42 d | ||
| MS-248 | 8.39 ± 0.58 l | 60.20 ± 1.13 u | 9.28 ± 0.57 n | 63.47 ± 0.38 s | 282.00 ± 2.65 cc | 69.10 ± 2.02 o | 42.05 ± 2.48 n | ||
| MS-249 | <LOQ | 21.13 ± 0.85 e | 31.64 ± 1.28 t | 62.40 ± 1.51 r | 74.27 ± 3.03 m | 69.97 ± 0.74 p | 37.93 ± 0.39 l | ||
| MS-190 | <LOQ | 23.53 ± 0.06 g | 3.04 ± 0.12 d | 27.8001.06 h | 89.17 ± 1.27 q | 38.23 ± 0.72 g | 14.75 ± 1.03 a | ||
| MS-231 | 4.62 ± 0.28 i | 94.33 ± 2.78 aa | 22.00 ± 1.35 s | 85.93 ± 3.72 z | 101.67 ± 0.58 t | 96.13 ± 14.71 u | 58.50 ± 8.16 t | ||
| MS-422 | ND | 28.77 ± 1.40 j | 7.723 ± 0.31 k | 14.97 ± 0.49 c | 221.67 ± 7.23 bb | 31.10 ± 0.70 d | 28.30 ± 2.11 h | ||
| MS-425 | ND | 19.43 ± 1.02 c | 2.73 ± 0.10 c | 17.97 ± 0.97 d | 136.67 ± 4.16 w | 38.27 ± 1.46 g | 49.66 ± 1.26 r | ||
| MS-448 | <LOQ | 30.53 ± 1.80 l | 5.13 ± 0.26 hi | 27.33 ± 1.03 g | 41.43 ± 2.66 d | 72.77 ± 0.65 q | 43.37 ± 3.96 o | ||
| MS-530 | <LOQ | 34.93 ± 0.45 n | 3.02 ± 0.11 d | 64.63 ± 3.95 t | 51.37 ± 1.59 h | 88.33 ± 4.86 t | 23.48 ± 2.01 f | ||
| MS-232 | <LOQ | 57.37 ± 1.80 t | 9.02 ± 0.20 m | 171.33 ± 2.08 bb | 38.50 ± 1.41 b | 433.33 ± 17.67 aa | 77.56 ± 4.30 x | ||
| MS-233 | 3.89 ± 0.11 f | 91.57 ± 2.42 z | 14.10 ± 0.16 r | 111.00 ± 3.61 aa | 39.87 ± 1.51 c | 162.67 ± 6.43 z | 71.74 ± 3.87 w | ||
| MS-253 | <LOQ | 68.80 ± 1.74 v | 7.96 ± 0.58 l | 67.73 ± 1.27 u | 50.50 ± 1.91 g | 104.67 ± 4.73 v | 40.11 ± 1.36 m | ||
| MS-240 | 2.96 ± 0.20 b | 97.20 ± 1.51 bb | 33.59 ± 0.67 u | 62.03 ± 3.16 r | 44.73 ± 0.93 f | 70.07 ± 1.96 p | 60.18 ± 3.86 u | ||
| MS-394 | 5.56 ± 0.27 j | 105.67 ± 4.93 cc | 4.95 ± 0.26 gh | 70.40 ± 2.21 w | 56.20 ± 1.18 j | 82.27 ± 3.01 s | 69.78 ± 2.89 v | ||
| MS-403 | 3.36 ± 0.15 d | 87.43 ± 1.42 x | 6.39 ± 0.17 j | 69.60 ± 2.52 v | 71.87 ± 1.10 l | 149.00 ± 7.81 x | 80.39 ± 2.63 y | ||
| MS-421 | 5.88 ± 0.67 k | 88.27 ± 3.26 y | 6.52 ± 0.14 j | 60.93 ± 0.70 q | 43.37 ± 1.59 e | 106.33 ± 3.22 w | 86.43 ± 1.50 z | ||
| MS-430 | <LOQ | 52.20 ± 1.30 r | 1.91 ± 0.17 b | 84.50 ± 3.21 y | 93.97 ± 10.40 r | 69.23 ± 0.68 o | 46.32 ± 2.09 p | ||
| (b) | |||||||||
| Acc. No. | 2,4-DHBA | HO | SA | V | CA | m-C | RU | QU | KA |
| MS-179 | 2.53 ± 0.03 c | <LOQ 1 | 4.27 ± 0.07 l | ND 3 | 4.54 ± 0.25 h | 9.16 ± 0.35 h | 25.31 ± 0.95 g | <LOQ | 213.36 ± 14.03 p |
| MS-196 | <LOQ | <LOQ | 6.02 ± 0.12 o | ND | 0.95 ± 0.07 a | 5.12 ± 0.35 de | ND | ND | 71.89 ± 5.56 h |
| MS-212 | 3.02 ± 0.12 d | <LOQ | 3.62 ± 0.17 i | ND | 2.04 ± 0.10 c | 11.28 ± 0.39 i | 23.00 ± 0.30 f | <LOQ | 33.30 ± 1.84 de |
| MS-239 | 9.17 ± 0.28 n | <LOQ | 13.61 ± 0.44 w | ND | 8.92 ± 0.24 k | 21.79 ± 1.64 m | 56.43 ± 0.91 l | 4.84 ± 0.29 b | <LOD 3 |
| MS-244 | 16.48 ± 0.99 s | 4.17 ± 0.0 a | 24.63 ± 3.35 x | ND | 2.70 ± 0.45 e | 17.65 ± 2.43 l | 174.89 ± 6.88 m | 60.31 ± 6.39 d | <LOQ |
| MS-258 | 4.66 ± 0.18 g | <LOQ | 3.91 ± 0.10 k | ND | 4.08 ± 0.19 g | 6.99 ± 0.88 fg | 17.28 ± 0.71 bc | ND | 48.18 ± 4.31 f |
| MS-271 | 4.26 ± 0.17 f | <LOQ | 5.18 ± 0.34 m | ND | 3.32 ± 0.17 f | 7.99 ± 0.36 gh | 19.52 ± 0.15 d | ND | 110.35 ± 1.03 k |
| MS-279 | 4.81 ± 0.03 h | <LOQ | 3.29 ± 0.03 h | ND | <LOQ | 8.07 ± 0.61 gh | 20.99 ± 0.24 e | ND | < LOD |
| MS-186 | 1.25 ± 0.11 a | <LOQ | 8.44 ± 0.16 u | ND | 2.37 ± 0.11 cd | 6.97 ± 0.42 f | 25.48 ± 0.30 gh | 4.36 ± 0.23 c | ND |
| MS-201 | 2.93 ± 0.21 d | <LOQ | 7.26 ± 0.27 r | ND | 3.58 ± 0.19 f | 15.02 ± 0.57 k | 18.53 ± 0.45 d | ND | 21.99 ± 2.64 b |
| MS-207 | 1.60 ± 0.13 b | <LOQ | 6.53 ± 0.27 p | ND | 2.15 ± 0.28 c | 10.79 ± 0.62 i | 26.47 ± 0.67 gh | <LOQ | <LOQ |
| MS-241 | 5.81 ± 0.18 j | <LOQ | 5.59 ± 0.51 n | ND | 4.11 ± 0.33 g | 10.07 ± 0.57 i | 27.29 ± 0.35 ij | 4.914 ± 0.12 c | <LOQ |
| MS-247 | 5.08 ± 0.22 i | <LOQ | 6.54 ± 0.17 p | ND | 2.52 ± 0.14 d | 10.47 ± 0.59 i | 23.54 ± 0.53 f | <LOQ | <LOQ |
| MS-274 | 4.88 ± 0.36 h | <LOQ | 5.14 ± 0.13 m | ND | 7.12 ± 0.25 j | 10.95 ± 0.27 i | 23.01 ± 0.41 f | <LOQ | 34.54 ± 2.99 e |
| MS-278 | 11.89 ± 1.34 q | <LOQ | 1.24 ± 0.22d | ND | 11.96 ± 0.23 l | 5.27 ± 0.21 de | 27.53 ± 0.49 j | 5.19 ± 0.17 c | 133.30 ± 9.88 m |
| MS-447 | 10.45 ± 0.29 o | <LOQ | <LOQ | ND | 5.45 ± 0.13 i | 4.55 ± 3.81 abcd | 37.42 ± 0.58 k | <LOQ | ND |
| MS-248 | 6.73 ± 0.17 l | <LOQ | 3.67 ± 0.25 j | ND | 7.02 ± 0.37 j | 14.63 ± 0.49 jk | 18.14 ± 0.67 cd | <LOQ | 28.38 ± 4.99 c |
| MS-249 | 17.52 ± 0.06t | <LOQ | 13.22 ± 0.19 v | ND | 4.79 ± 0.28 h | 15.39 ± 0.89 k | 16.61 ± 0.24 b | ND | <LOD |
| MS-190 | 1.28 ± 0.07 a | <LOQ | 1.59 ± 0.12 e | ND | 1.54 ± 0.12 b | 8.481 ± 0.21 gh | ND | ND | ND |
| MS-231 | 8.78 ± 0.37 m | 4.10 ± 0.1 a | 7.85 ± 0.35 s | <LOQ | 22.31 ± 1.12 p | 13.98 ± 1.68 j | ND | ND | 60.04 ± 5.15 g |
| MS-422 | 11.23 ± 0.15 p | <LOQ | 0.79 ± 0.05 b | ND | 4.72 ± 0.04 h | 5.33 ± 0.66 de | ND | ND | < LOD |
| MS-425 | 11.88 ± 0.34 q | <LOQ | 0.49 ± 0.06 a | ND | 11.35 ± 0.68 l | 3.98 ± 0.12 abc | ND | ND | < LOD |
| MS-448 | 6.30 ± 0.32 k | <LOQ | 1.81 ± 0.17 f | <LOQ | 18.45 ± 0.62 n | 3.77 ± 0.19 ab | ND | ND | 61.02 ± 4.07 g |
| MS-530 | 6.22 ± 0.14 k | <LOQ | 8.39 ± 0.07 t | ND | 5.75 ± 0.02 i | 10.97 ± 0.62 i | ND | ND | 31.24 ± 1.78 d |
| MS-232 | 34.15 ± 0.53 u | <LOQ | 6.74 ± 0.16 q | <LOQ | 30.35 ± 1.34 q | 6.04 ± 0.11 e | ND | ND | 106.97 ± 3.13 j |
| MS-233 | 14.21 ± 0.23 r | <LOQ | 3.68 ± 0.18 j | <LOQ | 39.58 ± 0.30 r | 5.02 ± 0.21 cd | ND | ND | 234.51 ± 2.91 q |
| MS-253 | 4.58 ± 0.09 h | <LOQ | 2.48 ± 0.17 g | <LOQ | 17.17 ± 0.99 m | 8.09 ± 0.38 gh | 18.09 ± 0.62 cd | ND | 203.76 ± 17.13 o |
| MS-240 | 54.26 ± 0.80 v | <LOQ | 7.28 ± 0.11 r | <LOQ | 56.89 ± 2.32 w | 4.79 ± 0.25 bcd | ND | ND | 239.63 ± 2.71 r |
| MS-394 | 3.09 ± 0.13 d | <LOQ | 0.76 ± 0.07 b | 174.22 ± 13.0a | 52.03 ± 0.86 v | 3.64 ± 0.18 a | ND | ND | 46.72 ± 4.42 f |
| MS-403 | 5.71 ± 0.13 j | <LOQ | 1.81 ± 0.09 f | <LOQ | 43.47 ± 2.15 t | 4.14 ± 0.09 abc | ND | ND | 173.61 ± 10.66 n |
| MS-421 | 8.87 ± 0.24 m | <LOQ | 1.01 ± 0.05 c | 238.18 ± 24.0 b | 45.58 ± 1.53 u | 4.11 ± 0.13 abc | ND | ND | 129.55 ± 5.89 l |
| MS-430 | 3.65 ± 0.17 e | <LOQ | <LOQ | <LOQ | 20.50 ± 1.25 o | 3.64 ± 0.11 a | ND | ND | 91.49 ± 7.92 i |
| (c) | |||||||||
| Acc. No. | ORE | VIT | API | LUT | L-Phe | VA | Total (µg g−1 DW) | ||
| MS-179 | 316.99 ± 6.69 s | 125.15 ± 5.29 aa | 4.55 ± 0.27 k | 175.33 ± 5.03 o | 481.42 ± 12.03 k | <LOQ | 1342.84 k | ||
| MS-196 | 317.36 ± 15.95 s | 57.84 ± 0.76 r | <LOD | 41.57 ± 1.45 a | 447.07 ± 24.73 h | <LOQ | 1083.25 e | ||
| MS-212 | 240.88 ± 6.76 o | 50.63 ± 0.63 q | 4.37 ± 0.40 j | 230.67 ± 0.58 u | 440.78 ± 33.31 g | <LOQ | 1240.52 i | ||
| MS-239 | 116.99 ± 1.23 e | 61.49 ± 1.61 t | ND | 75.27 ± 0.74 d | 586.06 ± 32.18 p | <LOQ | 1628.02 o | ||
| MS-244 | 227.74 ± 13.62 m | 228.24 ± 6.06 cc | 3.55 ± 0.69 g | 734.67 ± 22.18 ee | 1890.68 ± 70.59 y | 374.47 ± 52.78 i | 4415.21 u | ||
| MS-258 | 164.19 ± 2.33 j | 47.87 ± 1.92 m | 2.67 ± 0.19 a | 91.80 ± 5.22 g | 530.51 ± 18.82 m | <LOQ | 1065.42 de | ||
| MS-271 | 496.43 ± 26.49 t | 226.45 ± 13.92 bb | 2.90 ± 0.17 c | 94.70 ± 2.61 h | 572.32 ± 29.69 o | <LOQ | 1648.67 o | ||
| MS-279 | 129.98 ± 4.48 g | 22.29 ± 1.83 c | <LOD | 84.27 ± 3.41 f | 349.20 ± 31.66 f | 272.09 ± 11.64 b | 1040.62 d | ||
| MS-186 | 91.47 ± 3.13 a | 45.02 ± 1.07 l | 2.87 ± 0.14 b | 192.33 ± 11.54 q | 917.37 ± 67.51 w | <LOQ | 1549.40 m | ||
| MS-201 | 134.78 ± 3.77 h | 25.00 ± 0.49 e | 3.92 ± 0.23 i | 569.67 ± 29.37 ee | 868.22 ± 15.32 u | 269.94 ± 20.78 a | 2157.85 t | ||
| MS-207 | 107.66 ± 1.10 d | 42.13 ± 0.76 k | 3.14 ± 0.17 d | 126.00 ± 4.00 l | 828.89 ± 7.02 t | <LOQ | 1418.88 l | ||
| MS-241 | 118.72 ± 4.36 f | 30.38 ± 2.17 g | 3.92 ± 0.16 i | 240.00 ± 15.62 w | 476.88 ± 68.41 j | <LOQ | 1224.074 i | ||
| MS-247 | 193.25 ± 3.26 l | 60.93 ± 1.57 t | <LOQ | 199.33 ± 2.08 s | 469.53 ± 12.79 i | <LOQ | 1278.16 j | ||
| MS-274 | 270.63 ± 14.59 r | 23.22 ± 0.78 d | <LOQ | 197.33 ± 3.51 r | 705.46 ± 4.83 r | <LOQ | 1546.16 m | ||
| MS-278 | 512.71 ± 3.09 u | 96.10 ± 0.31 z | 10.79 ± 0.23 x | 409.33 ± 3.32 cc | <LOQ | 384.38 ± 5.14 k | 1952.13 r | ||
| MS-447 | 130.34 ± 7.25 g | 34.99 ± 0.87 h | 3.44 ± 0.26 f | 239.00 ± 3.00 v | <LOQ | <LOQ | 684.14 a | ||
| MS-248 | 119.24 ± 3.78 f | 26.49 ± 1.14 f | 3.17 ± 0.09 e | 375.33 ± 6.03 bb | 743.37 ± 38.07 s | <LOQ | 1852.28 q | ||
| MS-249 | 192.60 ± 10.56 l | 34.51 ± 1.05 h | <LOQ | 98.67 ± 1.53 i | 985.37 ± 23.54 x | 406.22 ± 25.08 l | 2082.24 s | ||
| MS-190 | <LOQ | 48.08 ± 1.96 n | <LOQ | 119.67 ± 5.51 k | 655.35 ± 51.96 q | 277.02 ± 7.49 c | 1309.53 jk | ||
| MS-231 | 94.89 ± 4.06 b | 22.49 ± 1.62 b | 11.17 ± 0.56 y | 506.67 ± 18.82 dd | 544.95 ± 25.62 n | 382.43 ± 41.49 j | 2082.80 s | ||
| MS-422 | <LOQ | 67.47 ± 1.08 u | 5.61 ± 0.21 l | 323.67 ± 8.39 z | 284.15 ± 17.81 e | 471.81 ± 7.72 m | 1507.31 m | ||
| MS-425 | 170.58 ± 7.16 k | 90.69 ± 4.32 y | 6.74 ± 0.29 r | 289.33 ± 4.51 y | <LOQ | 283.69 ± 12.55 e | 1133.46 fgh | ||
| MS-448 | 139.18 ± 5.64 j | 19.75 ± 0.79 a | 6.71 ± 0.29 q | 343.33 ± 6.66 aa | <LOQ | <LOQ | 759.86 b | ||
| MS-530 | 234.28 ± 8.07 n | 39.19 ± 0.95 j | 7.78 ± 0.58 v | 225.67 ± 6.67 t | 490.27 ± 12.20 l | 306.59 ± 11.88 g | 1600.87 n | ||
| MS-232 | 134.19 ± 5.02 h | 84.16 ± 3.67 w | 6.94 ± 0.26 t | 76.07 ± 0.76 e | 257.36 ± 2.97 d | 350.34 ± 30.59 h | 1773.45 p | ||
| MS-233 | 136.52 ± 6.26 i | 34.55 ± 0.41 h | 17.57 ± 0.49 z | 158.00 ± 1.00 n | 255.34 ± 31.66 c | <LOQ | 1159.31 ghi | ||
| MS-253 | 263.30 ± 13.26 p | 49.57 ± 0.71 o | 6.40 ± 0.42 o | 176.00 ± 7.94 p | 240.25 ± 27.52 b | <LOQ | 1125.70 fg | ||
| MS-240 | 354.55 ± 15.81 t | 86.63 ± 5.04 x | 6.44 ± 0.18 p | 249.67 ± 4.16 x | <LOQ | <LOQ | 1191.27 i | ||
| MS-394 | 104.16 ± 3.46 c | 30.15 ± 0.88 g | 6.19 ± 0.15 n | 52.43 ± 0.90 c | <LOQ | <LOQ | 821.50 c | ||
| MS-403 | 120.17 ± 6.81 g | 36.13 ± 0.63 i | 7.21 ± 0.11 u | 105.33 ± 3.22 j | <LOQ | 282.27 ± 7.08 d | 1074.28 e | ||
| MS-421 | 133.100 ± 1.465 h | 26.89 ± 0.69 f | 6.89 ± 0.26 s | 47.53 ± 0.90 b | 201.40 ± 13.09 a | <LOQ | 1111.29 ef | ||
| MS-430 | 266.31 ± 11.99 q | 74.69 ± 4.30 v | 5.88 ± 0.16 m | 148.67 ± 2.89 m | <LOQ | 298.97 ± 6.56 f | 1170.44 ghi | ||
| Accessions | Variables | DPPH | ABTS | TPC | TFC |
|---|---|---|---|---|---|
| Chinese accessions | DPPH | 1 | 0.416 | 0.907 ** | 0.485 |
| ABTS | 1 | 0.258 | 0.895 ** | ||
| TPC | 1 | 0.457 | |||
| TFC | 1 | ||||
| Korean accessions | DPPH | 1 | 0.061 | 0.612 | 0.817 * |
| ABTS | 1 | −0.123 | −0.153 | ||
| TPC | 1 | 0.929 ** | |||
| TFC | 1 | ||||
| Japanese accessions | DPPH | 1 | 0.254 | 0.605 | 0.774 * |
| ABTS | 1 | −0.072 | 0.269 | ||
| TPC | 1 | 0.921 ** | |||
| TFC | 0. | 1 | |||
| Russian accessions | DPPH | 1 | 0.046 | 0.848 ** | 0.915 ** |
| ABTS | 1 | 0.256 | 0.027 | ||
| TPC | 1 | 0.945 ** | |||
| TFC | 1 |
Publisher’s Note: MDPI stays neutral with regard to jurisdictional claims in published maps and institutional affiliations. |
© 2021 by the authors. Licensee MDPI, Basel, Switzerland. This article is an open access article distributed under the terms and conditions of the Creative Commons Attribution (CC BY) license (http://creativecommons.org/licenses/by/4.0/).
Share and Cite
Ghimire, B.K.; Sacks, E.J.; Kim, S.H.; Yu, C.Y.; Chung, I.M. Profiling of Phenolic Compounds Composition, Morphological Traits, and Antioxidant Activity of Miscanthus sacchariflorus L. Accessions. Agronomy 2021, 11, 243. https://doi.org/10.3390/agronomy11020243
Ghimire BK, Sacks EJ, Kim SH, Yu CY, Chung IM. Profiling of Phenolic Compounds Composition, Morphological Traits, and Antioxidant Activity of Miscanthus sacchariflorus L. Accessions. Agronomy. 2021; 11(2):243. https://doi.org/10.3390/agronomy11020243
Chicago/Turabian StyleGhimire, Bimal Kumar, Erik J. Sacks, Seung Hyun Kim, Chang Yeon Yu, and Ill Min Chung. 2021. "Profiling of Phenolic Compounds Composition, Morphological Traits, and Antioxidant Activity of Miscanthus sacchariflorus L. Accessions" Agronomy 11, no. 2: 243. https://doi.org/10.3390/agronomy11020243