1. Introduction
Agriculture represents an essential sector of the global economy. This activity was adapted along years to fulfil the needs of the world’s population, which has duplicated in the last 50 years [
1]. Water plays a central role in farming processes and must be tightly controlled to support healthy crops. Precision agriculture and agricultural robotics have been exploiting the potential usage of Variable Rate Technologies (VRT) to control the rate of agronomic inputs, such as water, based on features as plant status and location. Traditional VRT systems consider information from agro-data cloud systems to estimate the correct amount of agronomic inputs. However, these systems do not have access to real-time feedback about the requirements of a plant.
A standard method for water content estimation in individual plants consists of intrusive methods to measure sap flow. There are various types of sap flow measurement based on different principles (e.g., thermodynamic, electric, and magneto-hydrodynamic) with the sensor placed directly into the plant’s stem. The most common is the sensor based on thermodynamics, widely used on forest and orchards [
2]. These solutions present some drawbacks, as they are invasive, not adequate for plants with thin stems, and not very reliable for more than one season crop.
The non-invasive real-time available solutions comprise mostly radar scatterometers or optical-based systems, typically using satellites or aerial vehicles. These systems can monitor vegetation phenology, including water content of vast planting regions. However, such approaches cannot measure water content or sap levels at a single or even at individual leaves (i.e., precision agriculture applications). Moreover, satellite radar systems are strongly affected by the interference of other elements, such as soil moisture, terrain topology, cultivation techniques, and atmospheric transmission characteristics [
3]. Optical methods can also be used for water sensing by analyzing the reflected electromagnetic signal by vegetation canopies. This reflectance is mostly affected by biological properties, such as the amount of water in the leaves [
4]. Nevertheless, the accuracy is negatively affected by atmospheric conditions. Moreover, optical-based methods are limited to superficial layers of plants as only reflected information is used.
The frequency dependency of the water absorption ratio with high radar frequencies (i.e., >8 GHz), provides the best sensitivity on detecting water content in vegetation [
5]. This paper presents a device for measuring water content in plants using radiofrequency attenuation for real-time water sensing. This is a previously validated concept that consists of a radio frequency emitter and a receiver, with the element being analyzed in between [
6]. This method had demonstrated promising results in the perception of water content of individual leaves. However, it required the development of specific hardware. This work experiments a possible replacement of this hardware by a off-the-shelf ground-based radar solution (EVM AWR1843BOOST). This is a cost-effective and easily available solution. Our goal is to verify its reliability for measure water content/sap flow in plants stems and leaves.
Section 2 presents a bibliographic revision on radar technologies applied to agriculture.
Section 3 describes the methodology used for the pre-validated method and the proposed radar approach.
Section 4 shows the results of the presented approaches.
Section 5 presents the conclusions of this work.
2. Related Work
Methods to measure the sap flow in plants have been studied for decades. The most common technique is based on thermodynamics [
2], with works retrieving from the 1950s to measure sap flow by heat transport [
7]. Typically, these are intrusive sensors composed of needles, like the sensor presented by Vandegehuchte et al. [
8]. The authors propose a four-needle method to measure sap flux density and water content, validating the system on stems segments of the European beech tree. Pearsall et al. [
9] studied a novel sensor combining heat-pulse and a single set of probes to measure volumetric water user over a range of sap flows in grapevines. Baek et al. [
10] monitored water transportation in plant stem with micro-needle sap flow sensor, for fragile hydroponics cultures (i.e., tomatoes and bell peppers). Siqueira et al. [
11] presented the Biot-Granier sensor, a strategy to measure sap flow in trees with a new thermal dissipation-based methodology. The sensor was tested with olive trees in a greenhouse, two vineyards and was compared to a commercial solution. The trial with olive trees showed that their sensors showed better results than the commercial one.
Non-invasive techniques for inputs perception in agriculture are mostly based on radar technologies, which have been widely addressed to agriculture purpose for several decades. It is possible to retrieve early works from the 1970s with the application of radar to measure soil moisture content [
12]. The radar sensitivity to vegetation originates different volumes of biological matter which affect the wave-plant-soil interaction mechanisms, opening up several possibilities for monitoring crops [
13]. Backscatter is the reflection of waves back to the same direction of the transmitted wave. In the application of radar backscatter to agriculture, Susan et al. [
14] states that higher frequencies contain more information on vegetation dynamics and lower frequencies minimize the influence of vegetation on backscatter from the soil. Synthetic Aperture Radar (SAR) and Ground Penetrating Radar (GPR) represent two analysis techniques with radar commonly used in agriculture.
SAR is an imaging system that transmits electromagnetic waves with a range of frequencies between 200 MHz to 300 GHz and receives the backscattered signals. The purpose of SAR is to create an image of the area being analyzed. This radar is typically installed on a moving platform, like aircraft, satellites or truck and tower systems, using the motion to scan a particular place [
5,
15]. In agriculture, SAR data can be used to analyze soil moisture, crop monitoring and crop classification. Several works use SAR images to infer soil moisture condition, based on the different dielectric constant of soil and water at low frequencies (below 10 GHz) [
12,
16]. Pascale et al. [
17] worked with imaging radars to measure soil moisture until 10 cm of depth, considering a frequency range of 1.5 GHz to 11 GHz from air-born (AIRSAR) and space-borne (SIR-C) data. Moran et al. [
18] investigated the sensitivity of C-Band SAR (5.5 GHz) to surface soil moisture (5 cm depth) in a semiarid rage-land with sparse vegetation cover and tested a data fusion approach with optical data (Landsat TM) and radar data (ERS-2 SAR). The study concluded that the sensitivity of the C-Band SAR to soil moisture was relatively low. However, the authors obtained positive results that encouraged the use of multi-temporal SAR and SAR/optical fusion for monitoring semiarid range conditions. Later, MacNairn et al. [
19] performed a review about the application of C-band SAR for agriculture with emphasis on RADARSAT-2 system. The authors concluded that radar has a significant advantage over optical sensors because of its weather independence. However, when limited to a single frequency, multi-temporal radar observation will achieve the same level of information ad optical sensor that operates in several channels. As well, the capabilities of microwaves with agricultural targets results in a backscatter signal in function of both soil and crop attribute, which complicates the information extraction process. The usage of linear co-polarized or cross-polarized ratios for estimating soil moisture showed good results with vegetation greater than 15 cm tall. Recently, Safa et al. [
20] studied the potential of optical and radar Sentinel sensors (Sentinel-1 (S-1) and Sentinel-2 (S-2)) to retrieve soil moisture at regional scale. First, the authors analyzed C-Band radar data from S-1 to measure soil moisture, soil roughness and Leaf Area Index (LAI) over bare soils and cereal fields. Then, the Water Cloud Model was calibrated using the Normalized Difference Vegetation Index (NDVI) retrieved from S-2 images [
13].
Remote sensing data from SAR images and scatterometer systems are used to extract useful crop information for monitoring and classification. Burini et al. investigated the sensitivity of backscattering to grape development within space-born multi-temporal SAR images (ERS2-SAR). They constructed a simple linear model to describe the dependency of the backscattering coefficient on several vegetation variables. The conclusions indicate an increase of backscattering in correspondence of ploughing in March/April, which points out the sensitivity of SAR to some cultivation practizes. Moreover, it was noticed an increase of backscattering during summer months, followed by a decrease in the fall, denoting the sensitivity of SAR to the growth of the grapes. Later, Burini et al. [
13] performed a multi-temporal L-band SAR (1 GHz to 2 GHz) observation of wine-producing landscape with an air-born system. These observations were later studied to analyze the sensitivity of L-band SAR to grapes in vineyards, where the results hint at a sensitivity of L-band backscattering to grape biomass per unit area [
3]. Mcnairn et al.’s [
21] research examined a Compact Polarimetric SAR to determine whether SAR data might be used to track crop development similarly to widely adopted optical methods as NDVI. This study used data acquired during six weeks in crops of corn, wheat, and soybeans. The authors found a high coefficient on the correlation between the CP SAR data and the NDVI data for corn and wheat crops. However, the overall coefficient of correlation was 0.56, so, they concluded that further research is merited to integrate SAR-Based index with optical-NDVI. Boryan et al. [
22] performed a study to verify the effectiveness of C-band Sentinel-1 SAR data for agricultural flood monitoring. The authors were able to effectively detect and estimate the extent of cropland inundated shortly after Hurricane Harvey in 2017 with 95% accuracy. The study concluded that Sentinel-1 is accurate, affordable, and efficient for this purpose.
So, far, the literature shows that the majority of the radar applications are based on satellite systems. However, for precision agriculture, ground-based approaches can achieve much higher resolution. Kim et al. [
23] recurred to a ground-based multi-frequency scatterometer to evaluate the Radar Vegetation Index (RVI) as a tool to estimate Vegetation Water Content (VWC). The system provides L, C, and X (8 GHz to 12 GHz) bands. The experiment was done in rice fields and soybean crops for approximately 20 weeks. The conclusions indicated backscattering increase in the L-band throughout the growing season and a decrease after harvesting. Martin et al. [
24] studied the dielectric response of corn leaves to water stress, as the leaf water content can change during the day, and this affects the radar backscatter significantly. The dielectric response measurements were performed with a micro-strip line resonator with two Teflon blocks placed under and on top of the leaf, with different ranges of frequency, varying between 2 and 4 GHz. The authors concluded that the leaf dielectric properties response to plant growth and water stress depends on the height and age of the leaf. Gao et al. [
25] developed a sensor for the detection of the stem water content of woody plants based on standing wave ratio. Windt et al. explored a Nuclear Magnetic Resonance (NMR) to measure the amount of water in living stems of fruits.
To the best of our knowledge, very High-frequency radars (around 80 GHz) were never considered to measure sap flow/water content in plants. Our experiment intends to study the potential of commercial ground-based radar solutions used in the automotive industry to precision agriculture.
3. Concept and Methodology
The concept comes from a previously validated method [
6], which states that at high frequencies, namely around 20 GHz, the attenuation of a radio-frequency electromagnetic signal is mostly affected by the water content of a plant being irradiated by the beam. This approach was validated with two high gain antennas, an emitter and a receiver, with a leaf between them, as shown in
Figure 1.
According to
Figure 2, there is a peak of attenuation around 20 GHz, and the available equipment maximum frequency was 40 GHz. However, at higher frequencies power loss in even greater.
Given this proven concept, we will apply a similar approach to the commercial radar solution, EVM AWR1843BOOST from Texas Instruments (
Figure 3). This evaluation board radar is relatively cost-effective, works at higher frequencies (around 80 GHz), and does not require extra hardware. This board contains a Frequency-Modulated Continuous Wave (FMCW) radar sensor, which works with the reflected signal, expecting the back-scattered wave to suffer attenuation according to the water content present in plants leaves/stems.
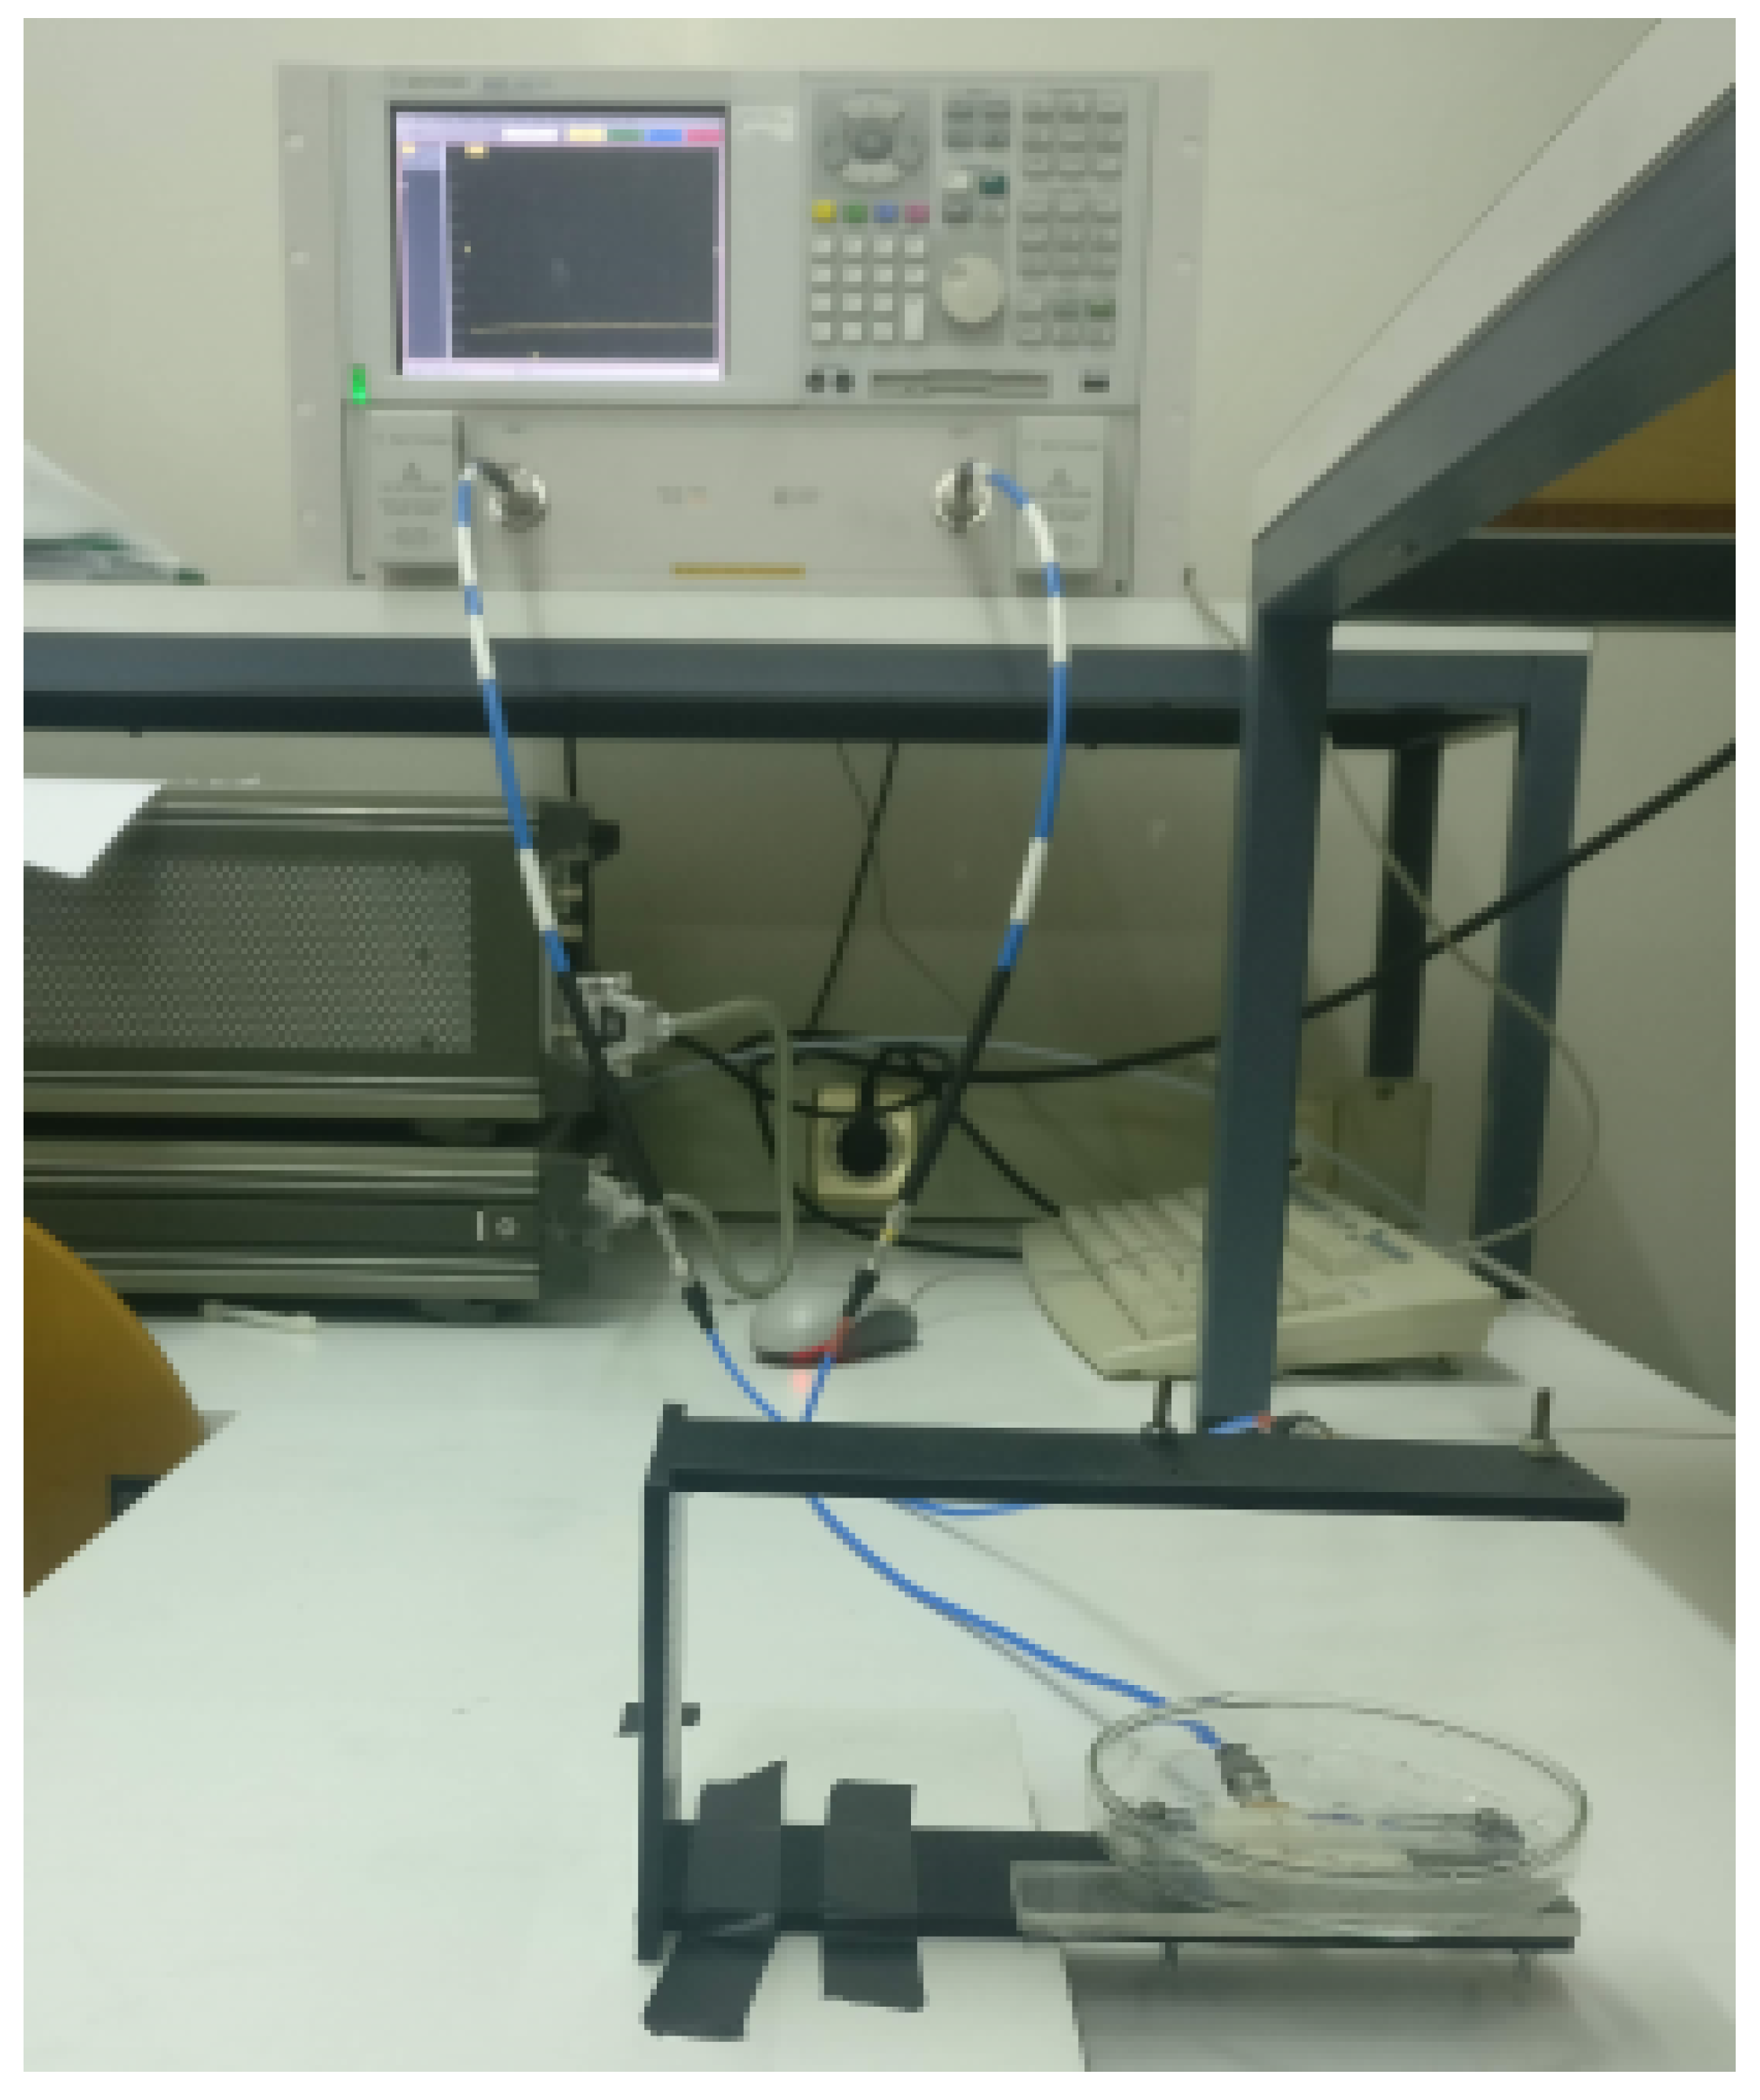
3.1. Previous Validation Methodology
The two high gain antennas represented in
Figure 1 were placed on a robotic arm, which allowed a high precision scanning of the object to be measured. The pair of antennas were connected to the Vector Network Analyzer (VNA) E8363B PNA Series Network Analyzer (10 MHz to 40 GHz) by KMM24 coaxial cables from Thorlabs. The range of these antennas was between 19.5 GHz and 20.6 GHz, so for all the tests, the measured frequency range was from 19.5 GHz to 20 GHz.
Figure 4 shows one of the antennas used during the tests.
For each test, an element was placed between the antenna pair to be scanned. The maximum scanning area was 20 cm by 20 cm, due to physical limitations of the robotic arm. The maximum resolution of the manipulator was 3 mm, which limited the scan step to this value. So, at every scan step, the VNA measured the intensity of the signal transmitted by the emitter antenna on the receiver antenna. Initially, the antennas were placed at a distance of 20 cm, being later positioned at a distance of 9 cm.
Figure 5 shows the setup of the antennas without the robotic manipulator used to test sensibility to different water thickness. The antennas installed in the robotic manipulator mounted on top of a robotic platform are represented in
Figure 6.
3.2. Commercial Radar Methodology
The Evaluation board EVM AWR1843BOOST from Texas Instruments contains seven antennas, where four are receivers, and three are emitters. The board communicates via serial port and can be powered by a simple 5V USB port. So, it only requires a computer compatible with serial communication. The antenna peak gain is >10.5 dBi across the frequency band of 76 to 81 GHz. There are some configurable parameters expressed in
Table 1.
Texas Instruments offers a tool, “mmWave Demo Visualizer” [
26], for the radar configuration and data visualization. The main plots available are: a scatter plot, a Doppler-range plot, and a range profile for zero Doppler plot. The focus was in the range profile plot, which indicates the power of the signal according to the distance (range). However, this tool only allows to record data in a binary format, which has to be decoded later, without the help of any official tool. Although we managed to decode the information correctly, this operation is time-consuming, as the decoding takes at least the same time as the recording data. So, we used a Robot Operating System (ROS) driver publicly available, “TI mmWave ROS Package” [
27]. The recording and manipulation of information are way simpler with ROS, and enables a possible future integration with robotic systems. This ROS driver was not completed by the original authors, leaving some functions not implemented, as the extraction of a range profile plot. So, we wrote the missing code and have performed a request to the original authors to merge their software implementation.
For most of the performed tests, default values from the manufacturer were the main choice:
4 receivers antennas and 3 emitters (4Rx,3Tx),
beam width of 15º,
frequency band from 77 GHz to 81 GHz,
frame rate of 20 fps,
range resolution of 4.4 cm,
maximum range of 9.02 m,
maximum radio velocity of 1 m/s, and
radial velocity resolution of 0.13 m/s.
Here, the only non-default setting was the frame rate, which was changed from 10 fps to 20 fps to increase the precision in the detection of possible water content.
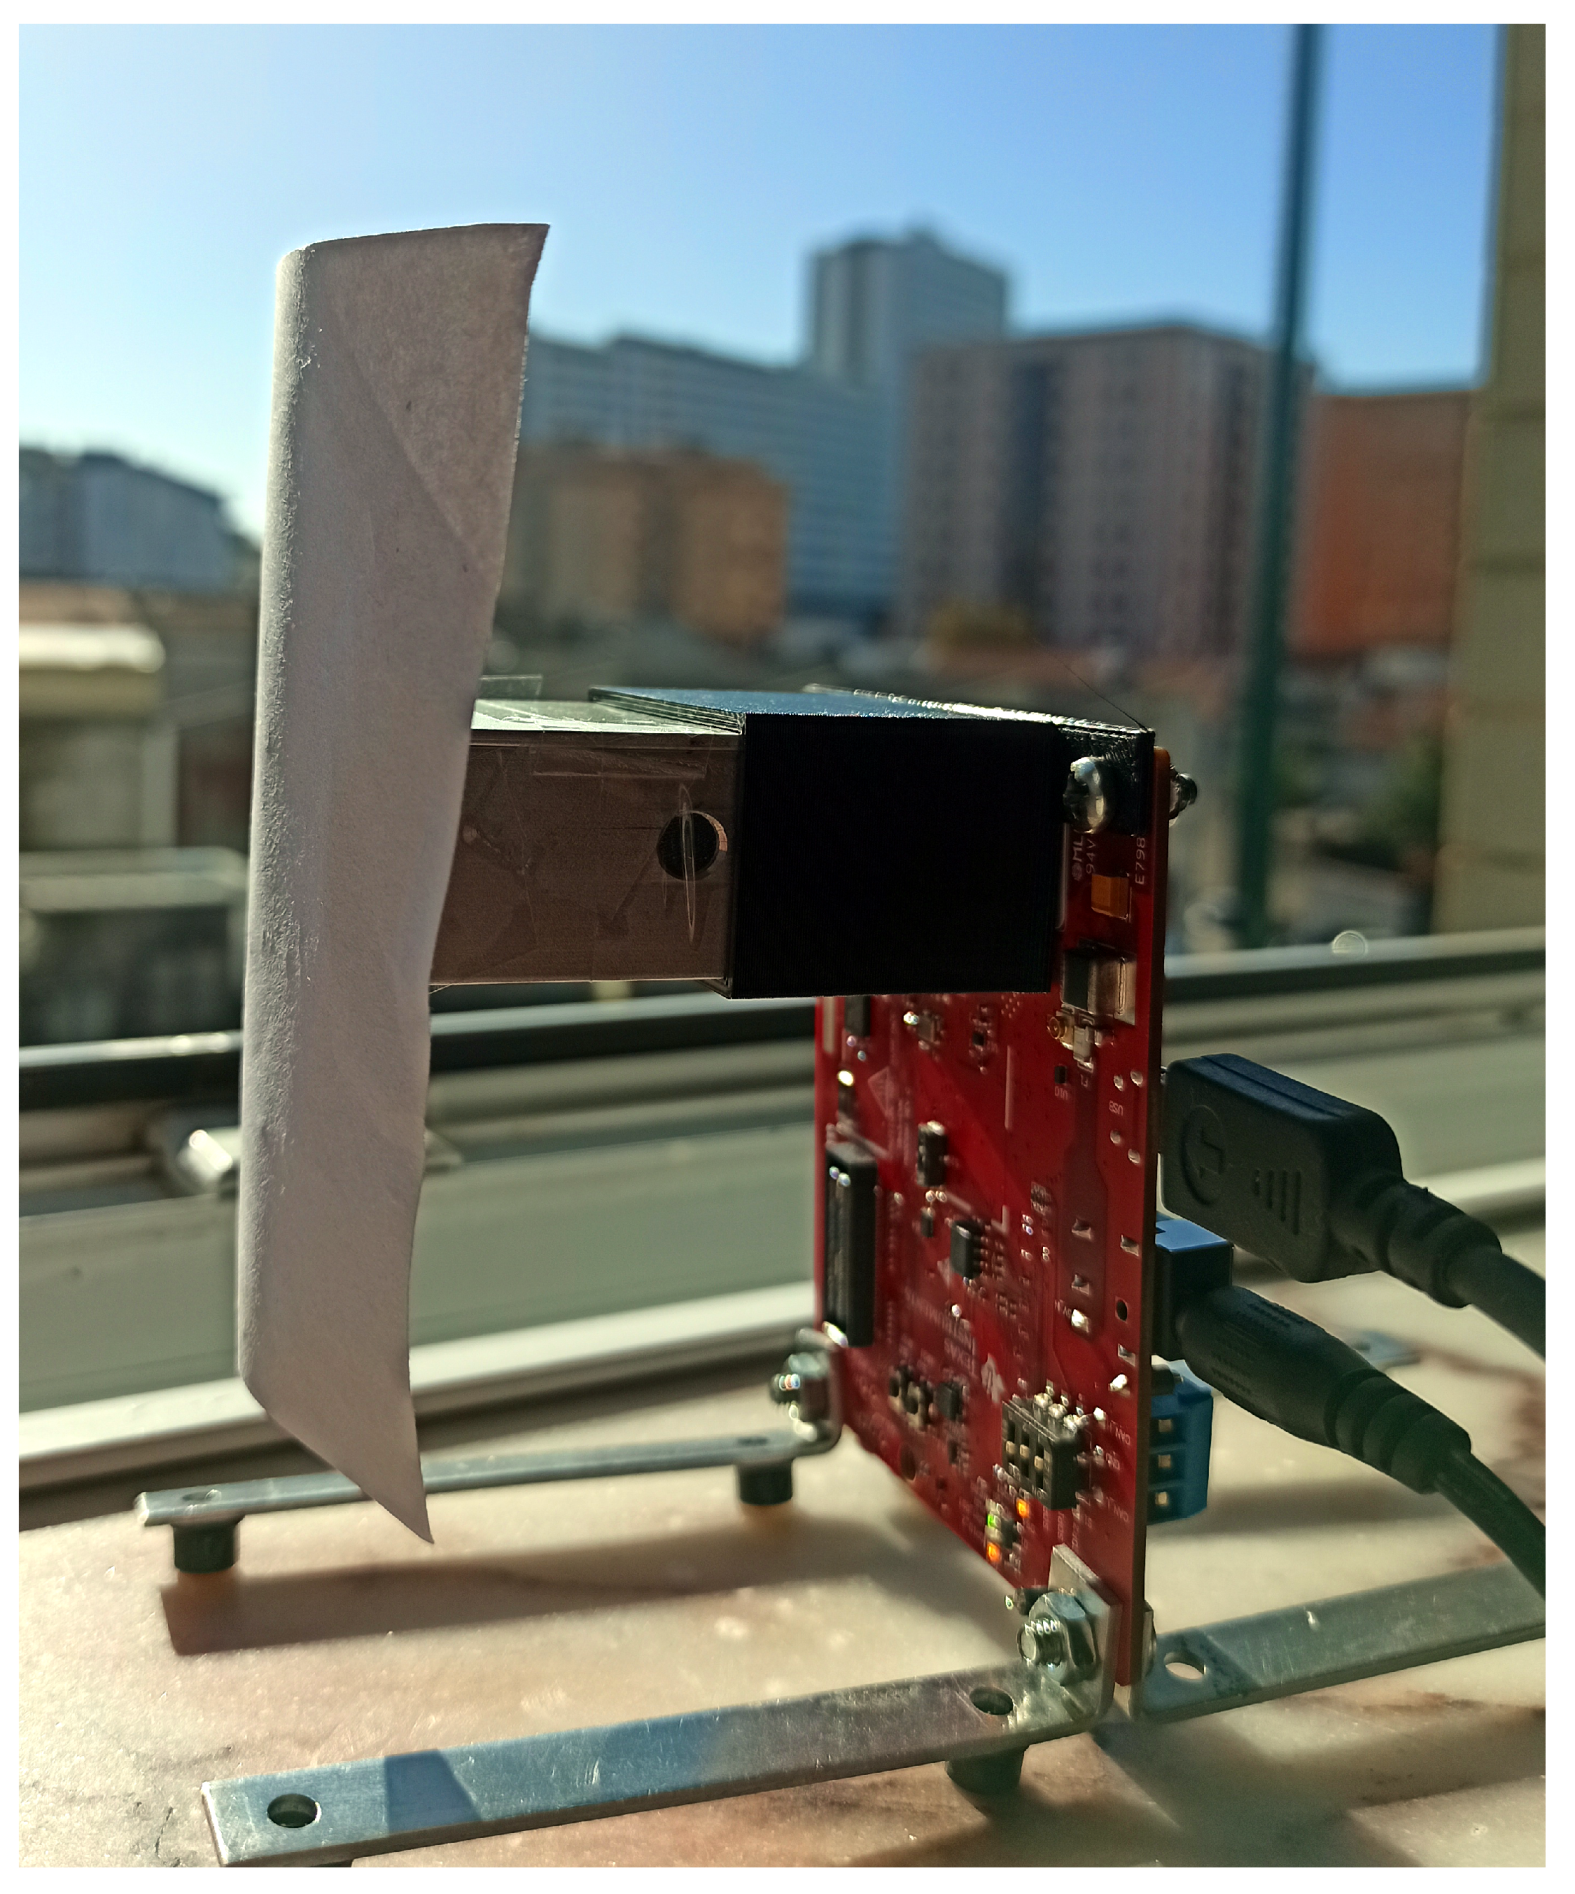
An aluminium case was placed around the radar antennas to concentrate the signal and increase the sensitivity of the back-scatter to water content. The first test consisted of the validation of the concept that this radar is sensitive to moisture present in plants. So,
Figure 7 shows a picture of a white piece of paper sprayed with water in front of the radar.
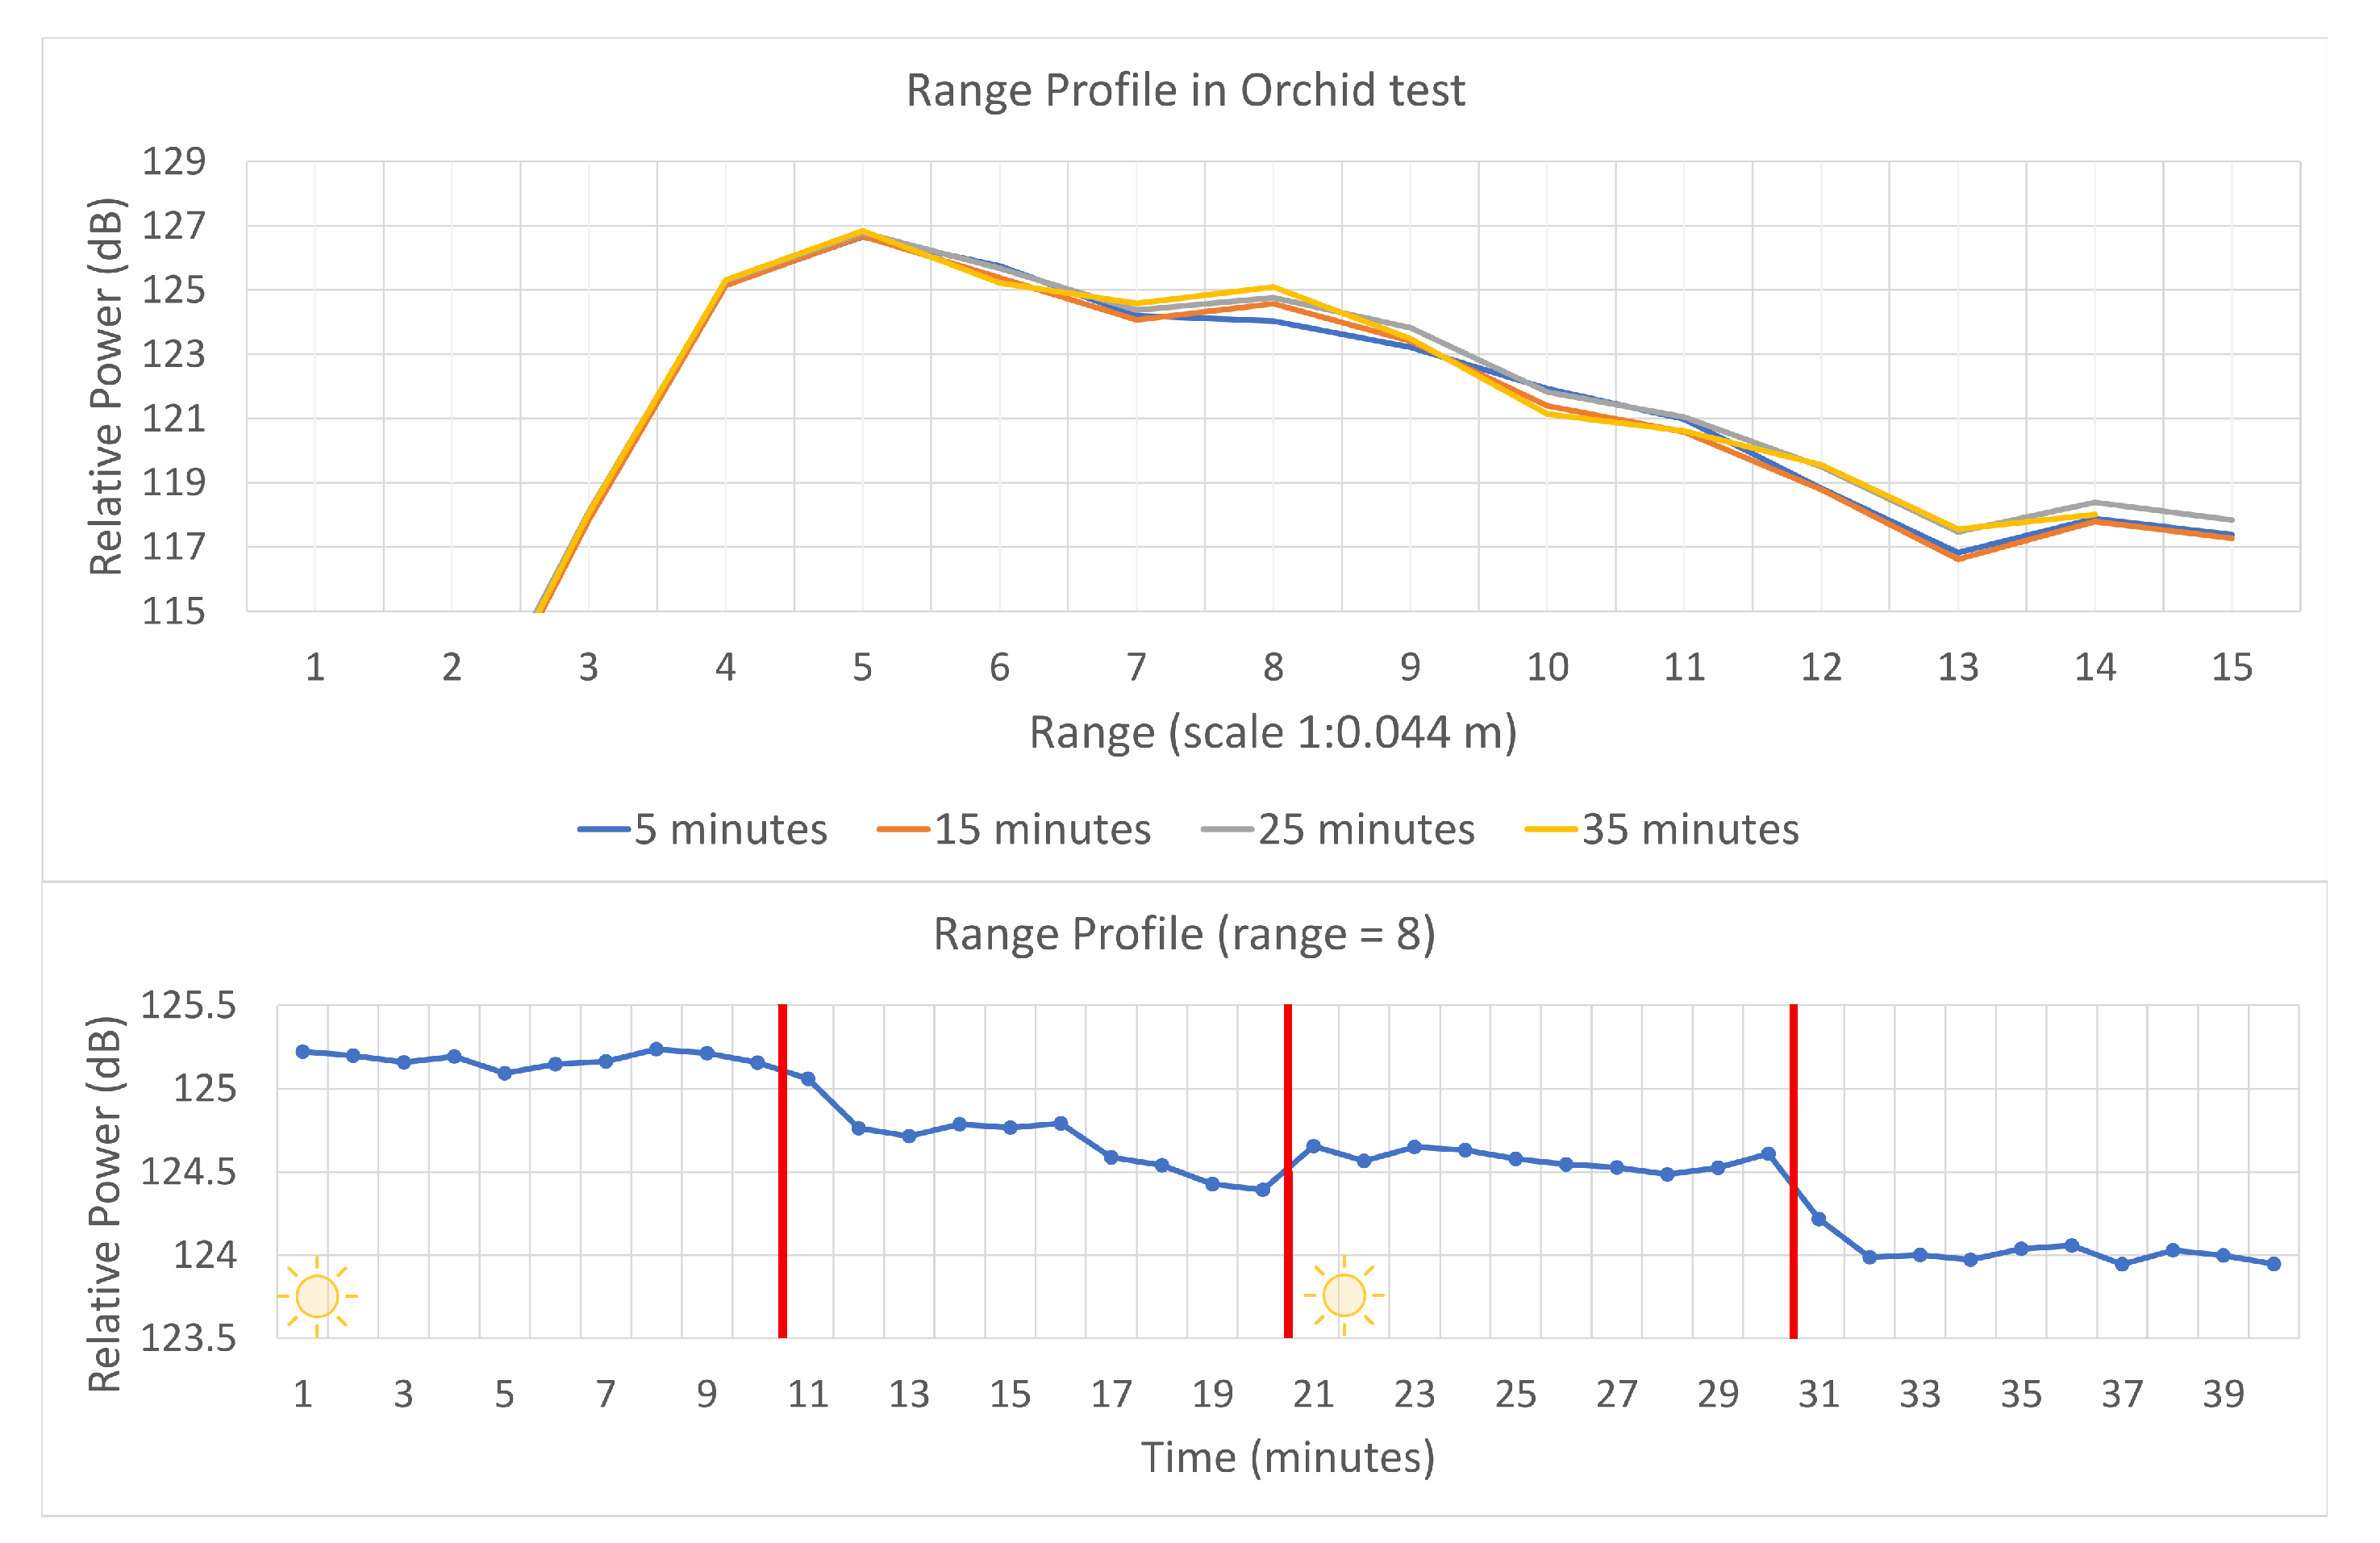
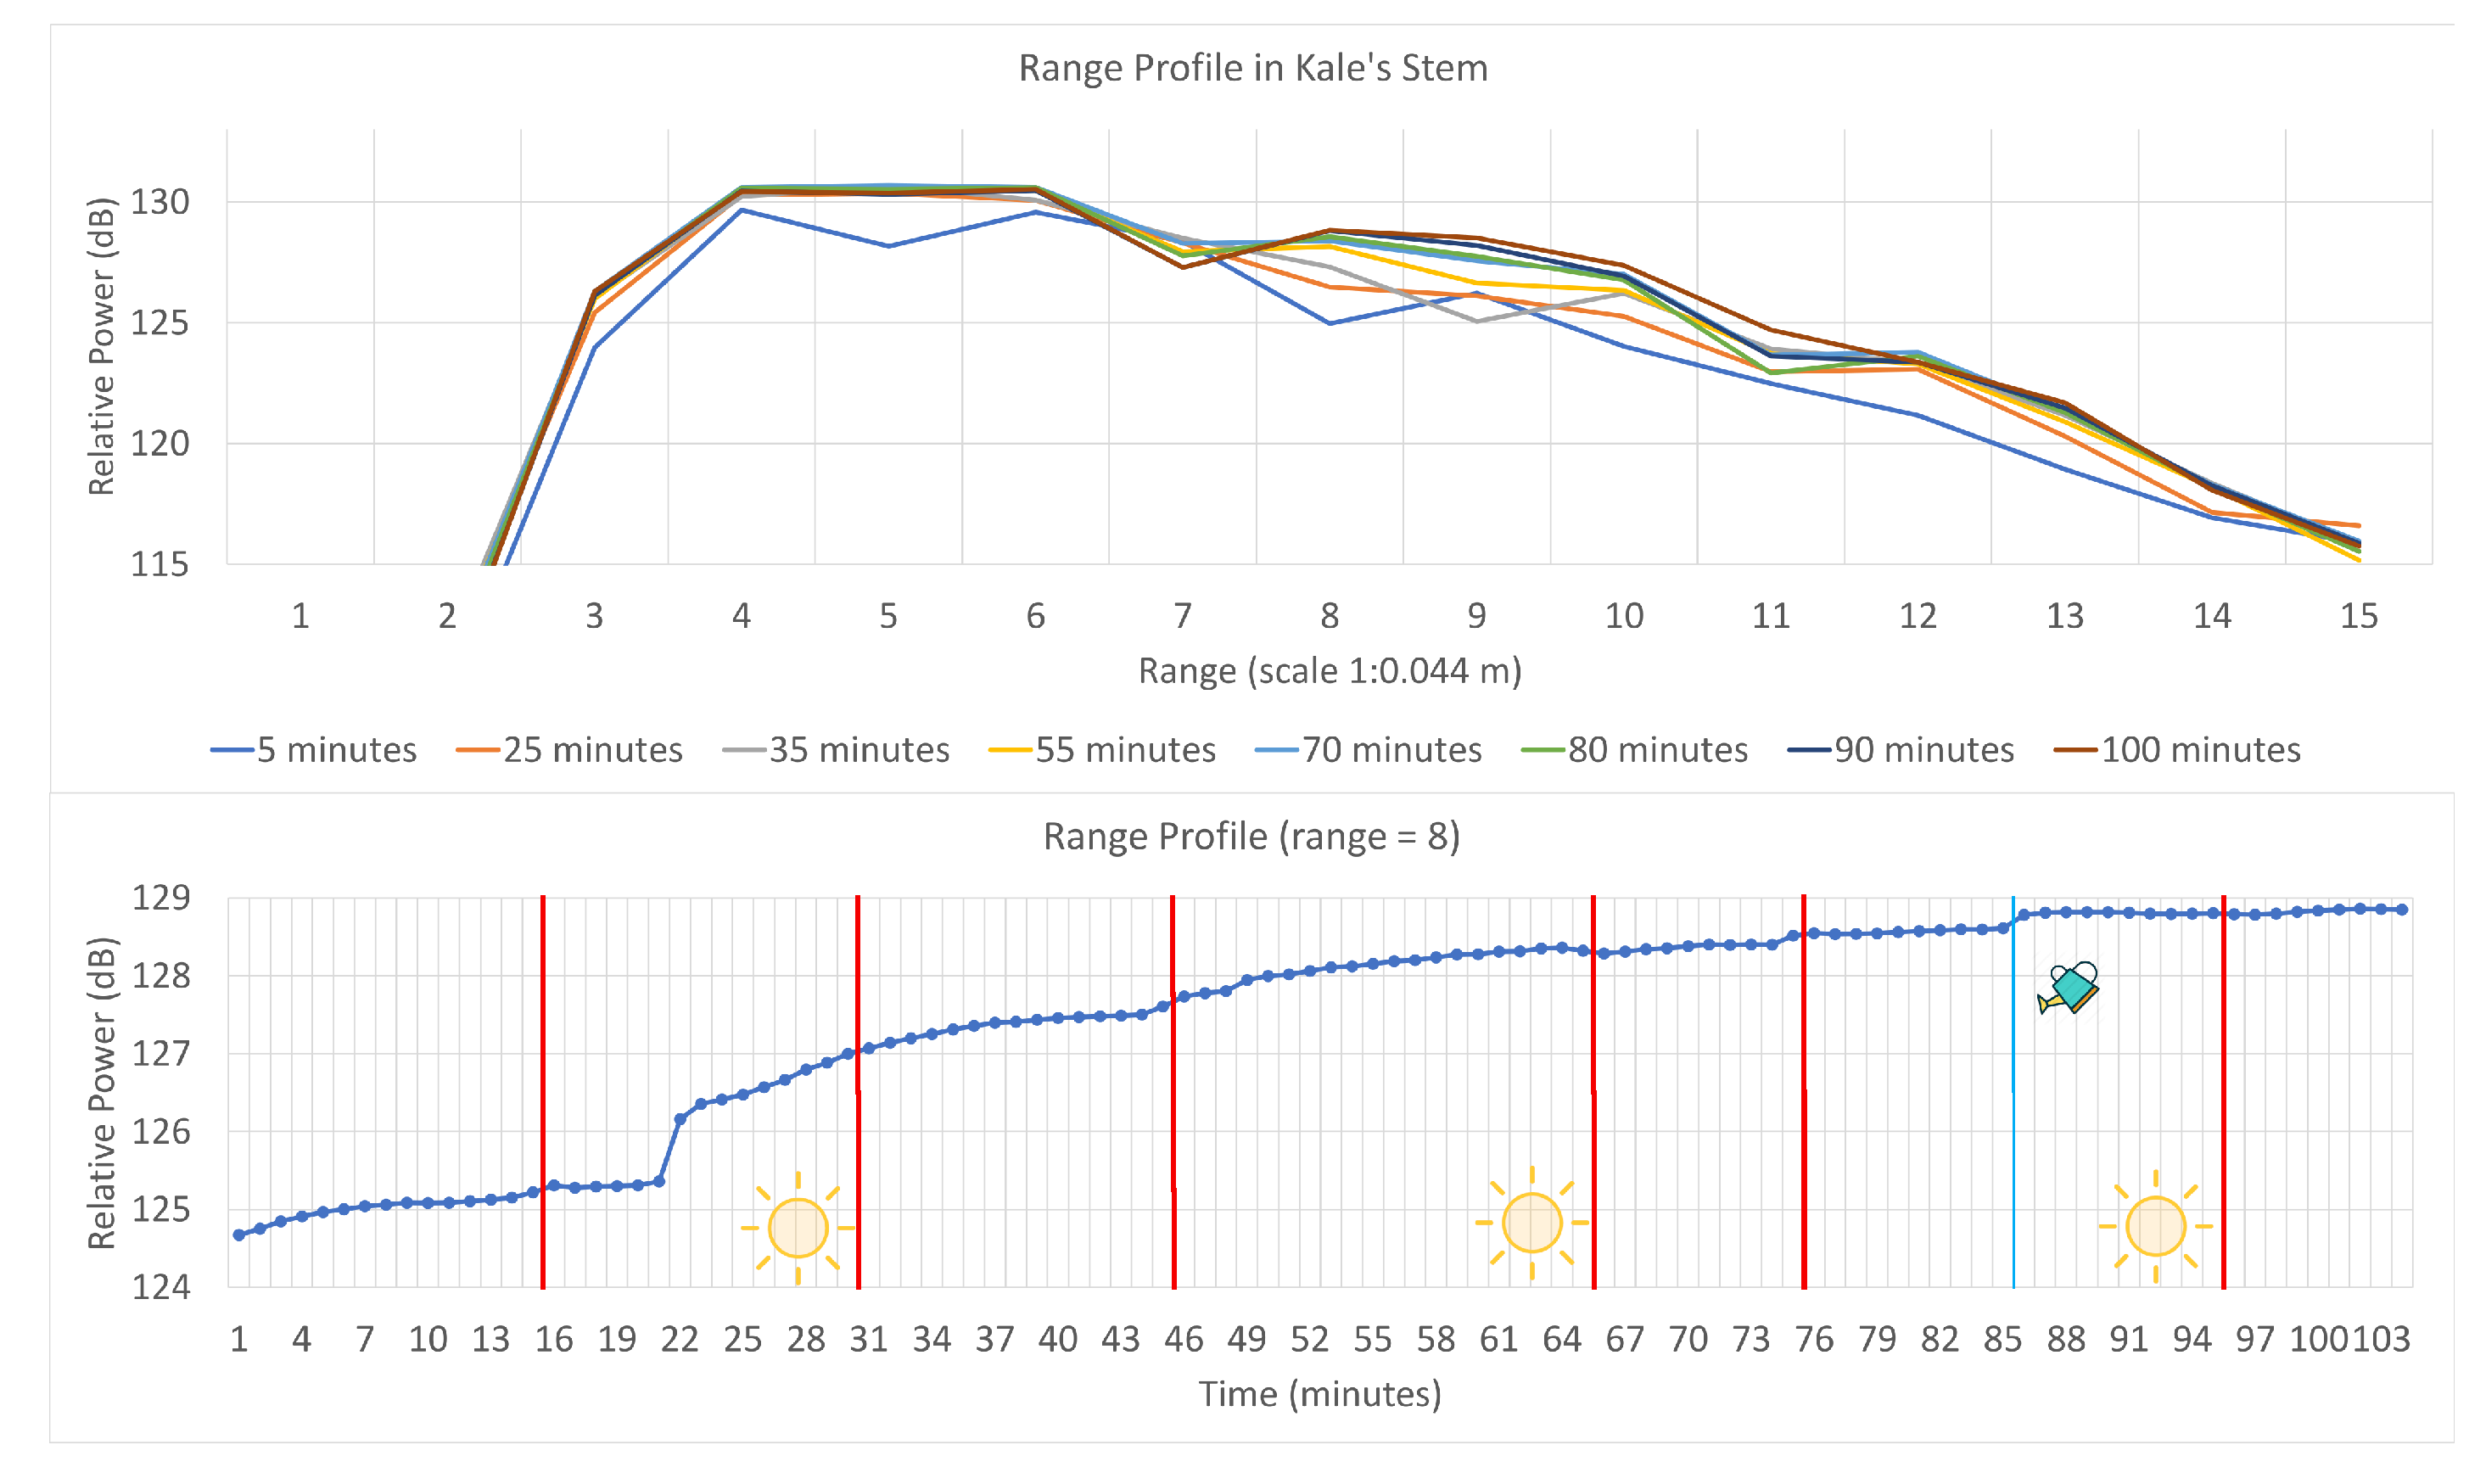
To perform the remaining tests, the radar antennas were headed to a plant’s leaf or stem. Two types of tests were considered: one approach consisted of collecting data for several hours. In the other method, while recording data from the radar, the plant was placed in a zone with direct solar exposition. Then, after a few minutes, we block the sunlight and remove this block after some time. The goal is to force a variation in the sap flow of the plant and verify the radar’s sensitivity to this change. The tests were performed on a kale’s stem and an Orchid leaf, as shown in
Figure 8.
5. Conclusions
The current paper presented a non-invasive method to detect water content present in plants. The first method presented here was previously validated [
6]. It places an element (leaf) in between two high gain antennas and measures the signal’s attenuation caused by the water content in the element. This system resorts to a robotic arm to scan the entire leaf and create a grey level image according to the signal attenuation. So, the whiter this image, the more water content is present in the element. This method required the use of coaxial cables and a VNA machine which was limited to a maximum of 40 GHz frequencies.
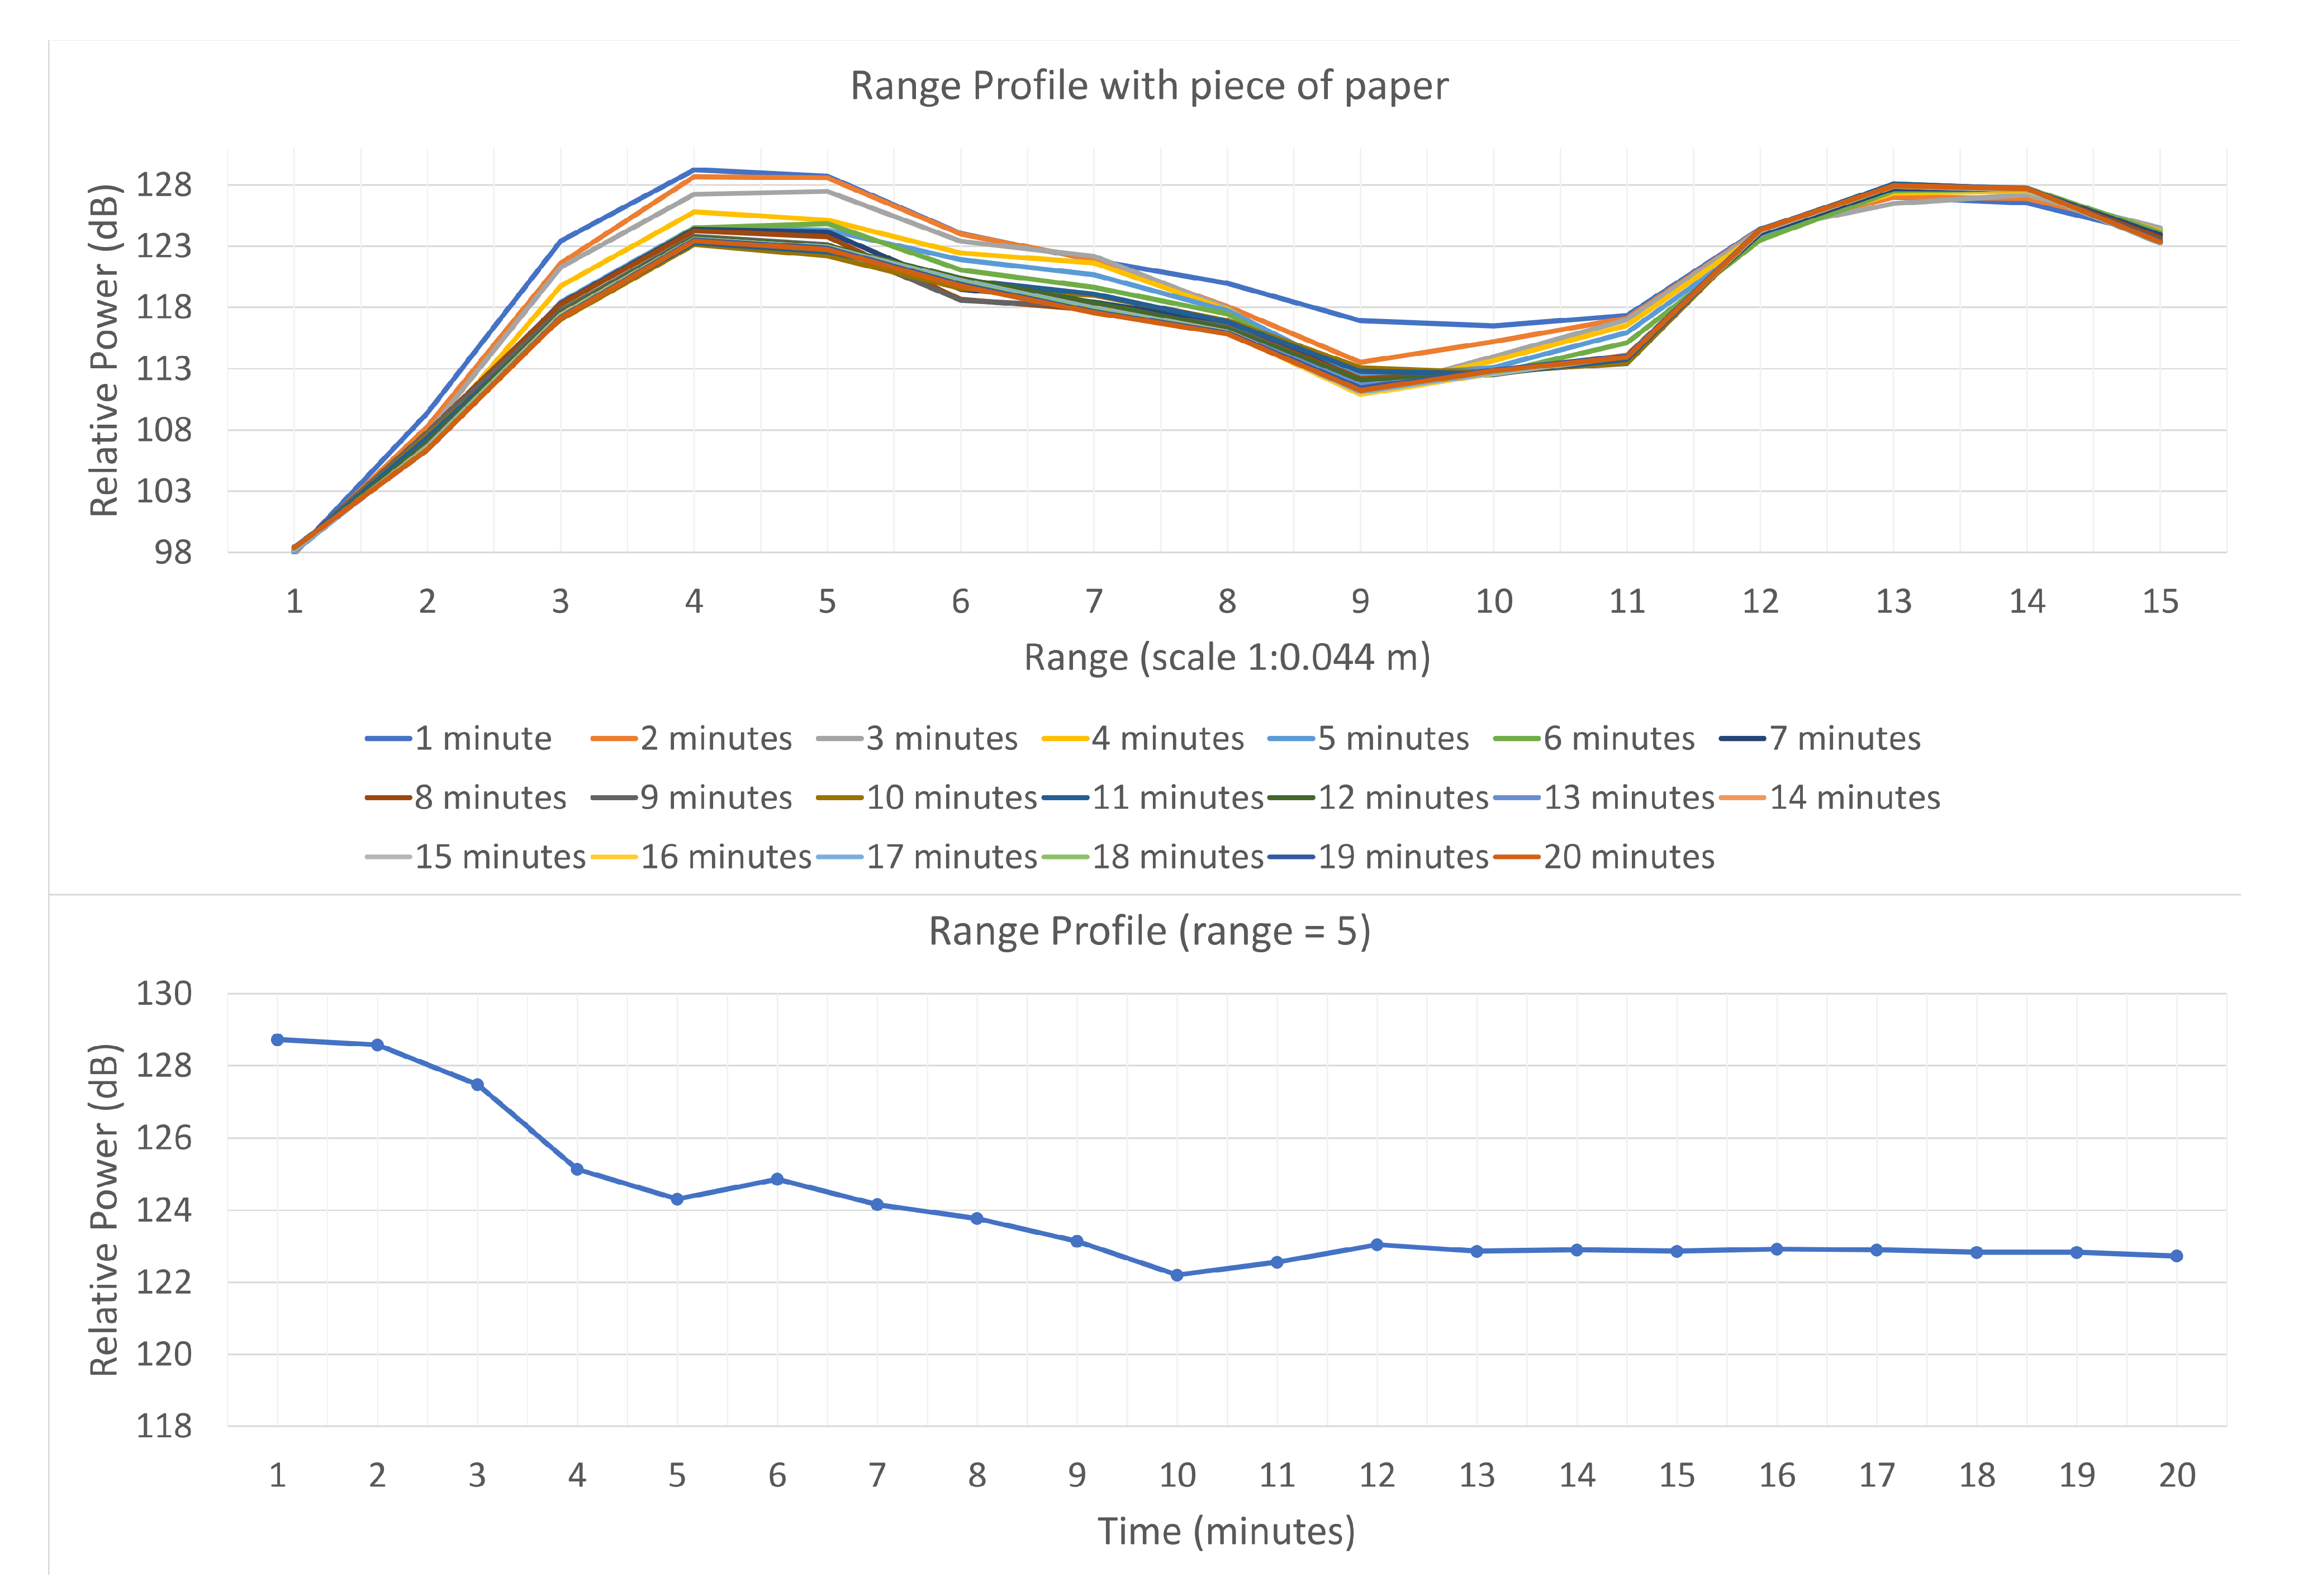
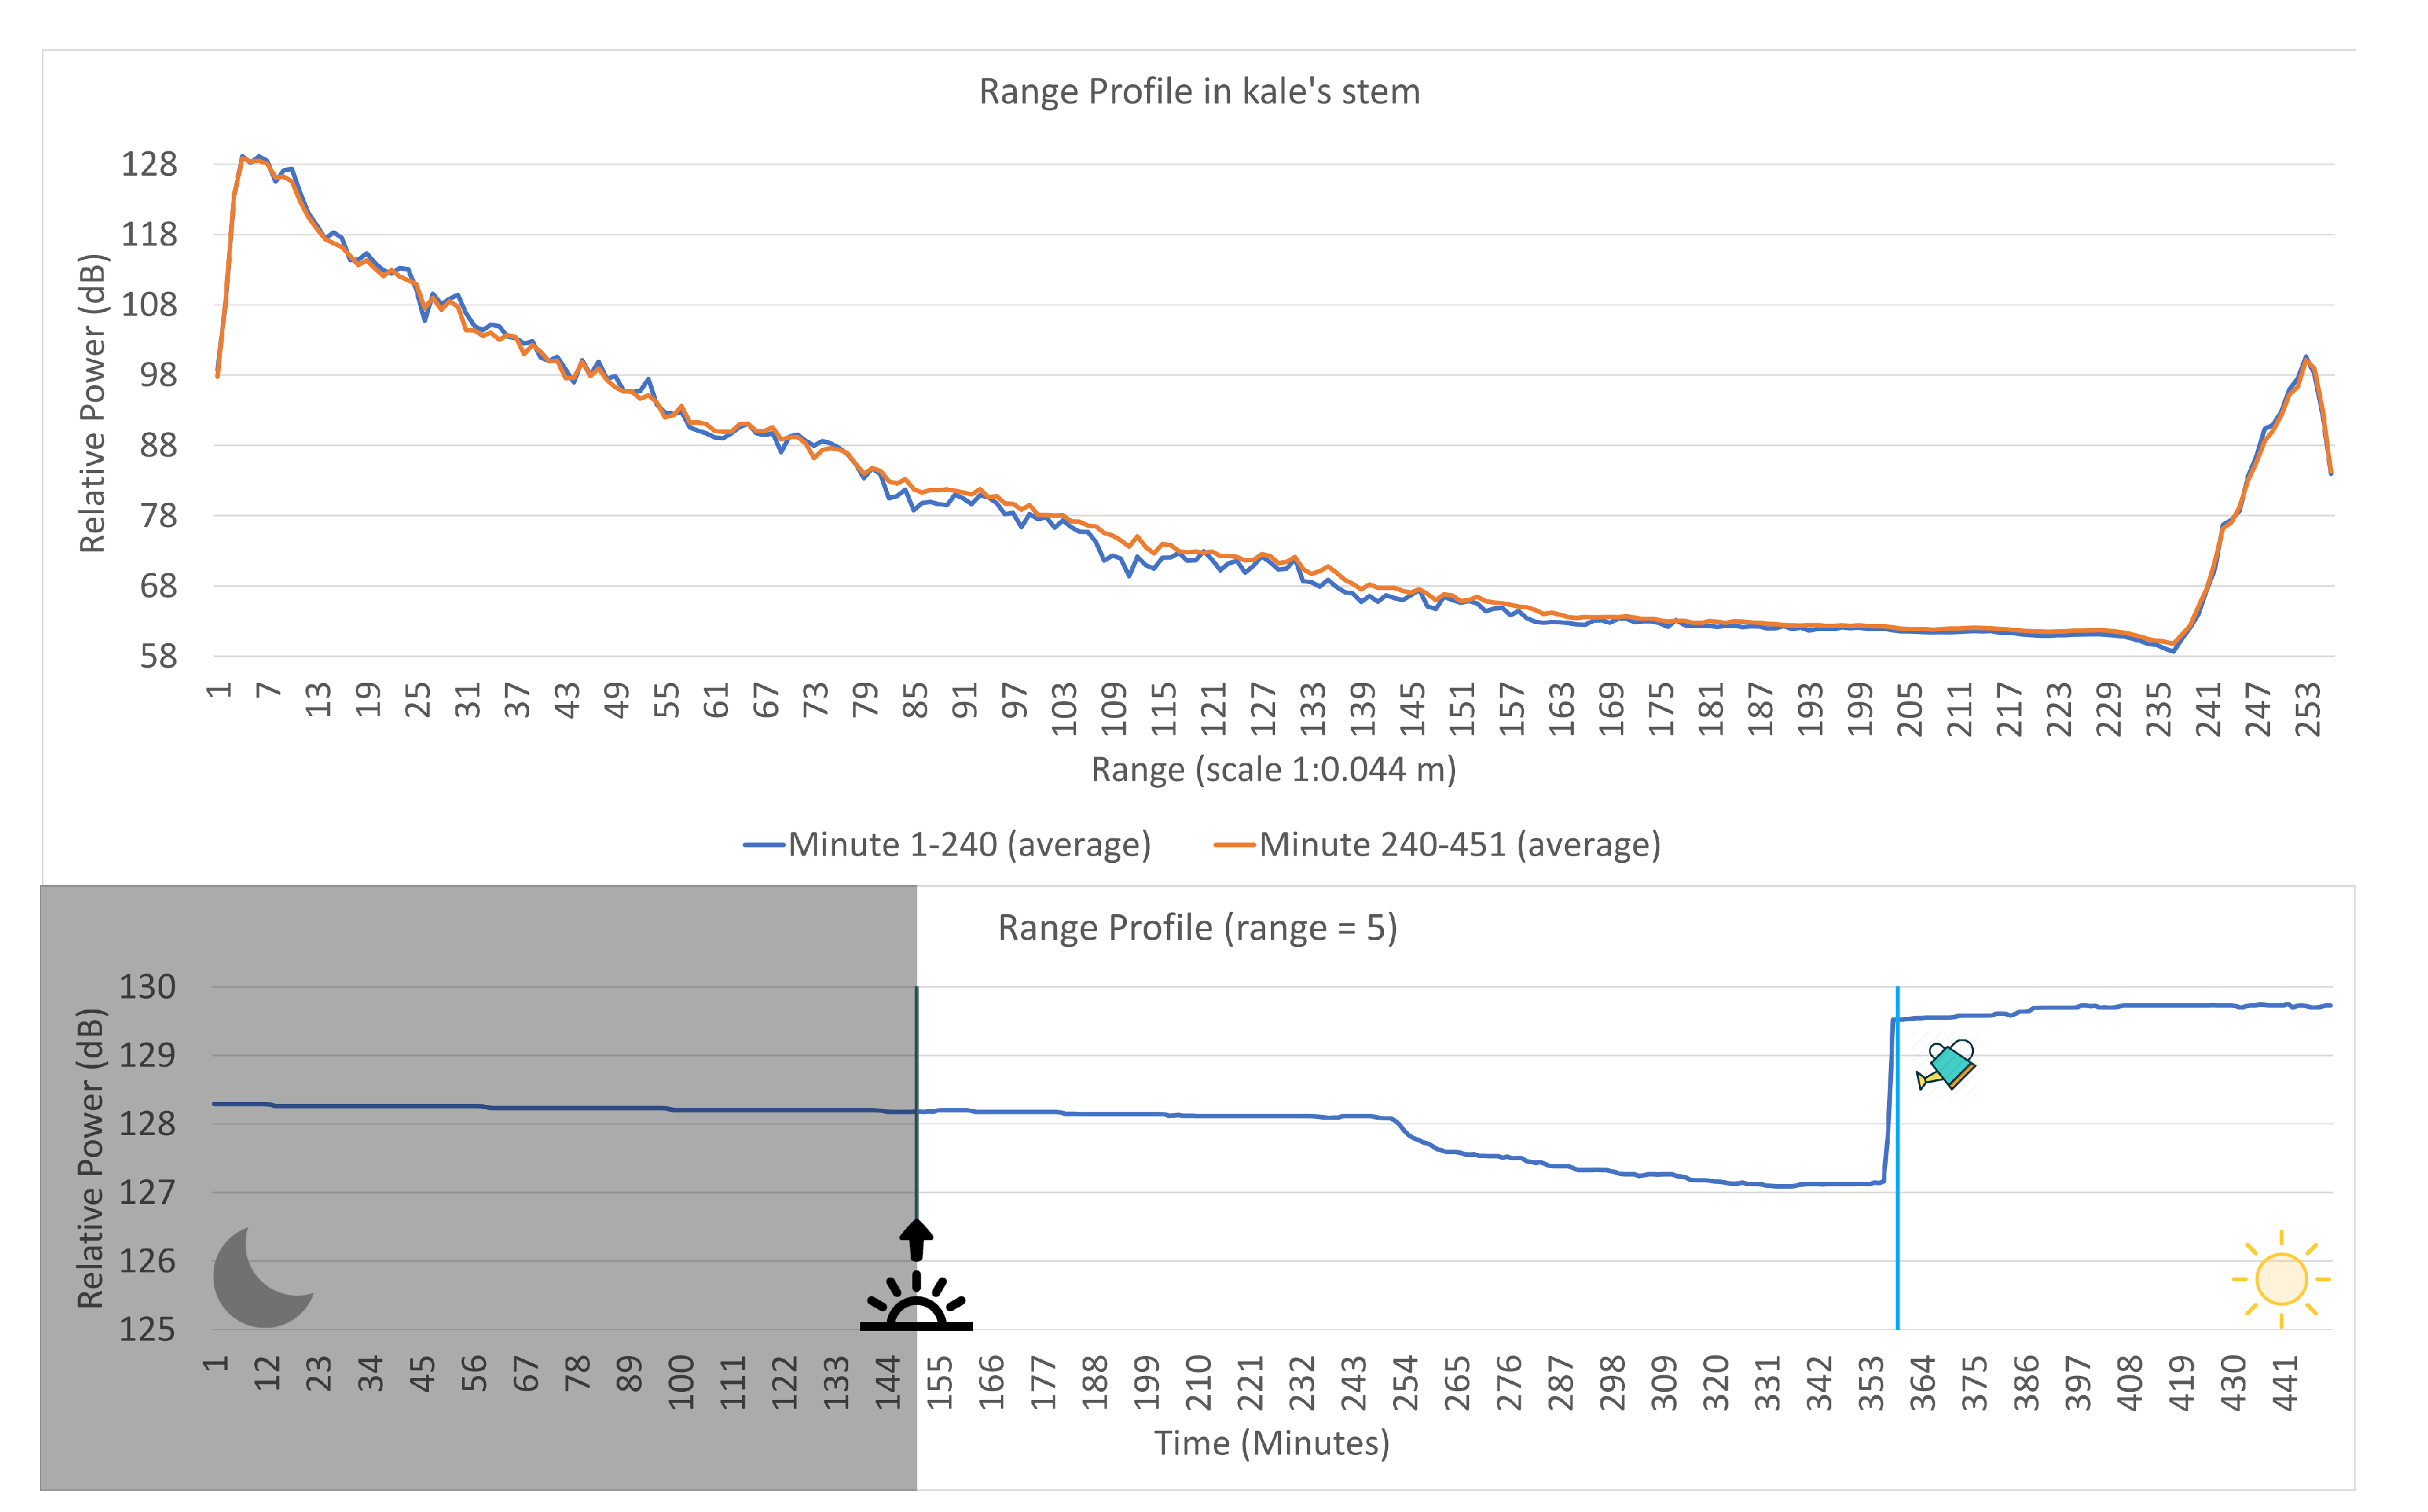
The second method consisted of the study of the commercial radar solution, EVM AWR1843BOOST from Texas Instruments, to detect variations in the water content/sap flow in plants. This solution works with frequencies around 80 GHz and only requires a regular computer for setup and data collection. We modified a non-official python script to decoded data recorded with the official tool of Texas Instruments, which was not compatible with our board. However, we performed all tests using an ROS driver, that was modified, as well in order to process information about the radar range profile (not implemented by the original developer). The performed tests showed a direct relation of the range profile data with the water content. During the test with a water sprayed piece of paper, the signal’s relative power decreased as the paper sheet dried. In the tests with plants (kale and orchid), we started by forcing variation in the sap flow by intermittently blocking the sunlight, and verified a decrease in the intensity of the signal when the plant did not have direct solar exposition. On the other hand, the power tended to increase with direct sun exposure. The plant was watered in one of the experiments, which caused a rise in the signal’s power. The findings indicate a more expressive variation with the kale, which is expected as orchids are plants known for their low water consumption.
When measuring during long periods of time, it was observed that, along an afternoon, the radar signal’s power decreases as solar exposition reduces. This fall is more abrupt around sunset. In our last experiment, a negative variation in the range profile relative power was detected after sunrise. This was an indicator of water stress, as the values suffered an abrupt rise after watering.
This phenomena, which also occurred when the kale was watered during the tests with intermittent sunlight blocks, proves that the changes in the signal occur due to variations in water content and not other factors, like possible variations of temperature.
To conclude, this commercial solution has a potential application for precision agriculture purposes, namely measuring variations in water content or sap flow in individual plants. With the results of this work, we can clearly associate variation in the signal’s intensity with sap flow changes. Positive variation indicates an increase of the water content, while negative variation points out the opposite. The greater the variation, the bigger the change in the sap flow. Nevertheless, at this stage, it is not possible to quantify water levels present in plants yet, as our data consistency is on the intensity variation and not precisely its value.
As future work, we will realize more measuring tests with other plants/trees (e.g., vine trees), and modify radar parameters, like resolution, antennas configuration, and maximum range. The variation will be mathematically associated with a specific amount of water content, and the radar module will be integrated with an embedded system (e.g., raspberry pi). Alternative and traditional methods may be considered to measure ground-truth values. Additional boards may be used to enable additional functionality. For example, DCA1000EVM from Texas Instruments enables access to the sensor’s raw data, which could improve our results. There is even the possibility of modifying the hardware in order to change the antennas localization. With this, we could place the plant in between the antennas, and the system would be more similar to the previously validated method. Notwithstanding, this would not be a direct application of a commercial solution.


