Article

An Index for User-Friendly Proximal Detection of Water Requirements to Optimized Irrigation Management in Vineyards

by
Ana Fernandes de Oliveira
1,*,
Massimiliano Giuseppe Mameli
1,
Mauro Lo Cascio
2,3,
Costantino Sirca
2,3 and
Daniela Satta
1
1
AGRIS, Agricultural Research Agency of Sardinia, Loc. Bonassai S.S. 291 Sassari-Fertilia—Km. 18600, 07100 Sassari, Italy
2
Department of Agriculture, University of Sassari, Viale Italia 39, 07100 Sassari, Italy
3
CMCC—Centro Euro-Mediterraneo sui Cambiamenti Climatici Foundation, IAFES Division, Via De Nicola, 9, 07100 Sassari, Italy
*
Author to whom correspondence should be addressed.
Agronomy 2021, 11(2), 323; https://doi.org/10.3390/agronomy11020323
Submission received: 21 December 2020 / Revised: 5 February 2021 / Accepted: 8 February 2021 / Published: 12 February 2021

Abstract

:
We propose an index for proximal detection of water requirements to optimize the use of water resources in arid and semi-arid wine growing regions. To test the accuracy and representativeness of the proposed irrigation need index (IIN), plant water status and physiological performances were monitored during seasons 2019 and 2020 in two grapevine varieties with different anisohydric degree (Vermentino and Cannonau) grown in 3 sites in Sardinia (Italy). Daily leaf gas exchange curves and stem water potential were recorded. Canopy temperature was monitored, using both thermistor sensors (Tc) and infrared thermometry (IR). Meteorological data, including dry and wet bulb temperatures were collected to compute and parametrize IIN, based on energy balance equation. Vineyard water balance, thermal time and irrigation water productivity were characterized. Linear regression analysis allowed to validate IIN for both varieties and to establish target thresholds for mild, moderate and severe water deficit to optimize irrigation for high yield and quality objectives. IIN well represents plant water status, using either Tc or IR, and allows rapid and easy detection of water and heat stress condition, even when a stricter stomatal control determines slighter variation and lower response of stem water potential, as in plants with low anisohydric degree.

1. Introduction

A common challenge for viticultural systems is the need of implementing global warming adaptive and mitigation strategies, striving towards a more sustainable management, highly efficient on the use of natural resources, and able to guarantee elevated yield and top-quality standards [1]. The need to adapt cultivation practices to the climate change c and to implement methods and technologies to support growers, at farm-scale level, is particularly crucial in regions that are experiencing more frequently severe environmental stresses, such as heat waves, frost and prolonged drought [2]. In fact, recent studies highlighted an increased vulnerability of the wine sector to climate change due to both reductions in yield and quality standards of many different terroirs [3].
In the last decades, remote and proximal sensing technologies [4] supported the development of precision agriculture tools that allow to improving water use efficiency and carbon balance in the vineyard [5,6,7]. Among these tools, thermography has been widely used to detect water stress and to develop crop water stress indexes that help implementing water saving irrigation strategies [8,9,10,11] to cope with water scarcity [12], especially in large enterprises [13].
The crop water stress index (CWSI) is one of the most widely used stress indexes for irrigation management in vineyards. This index uses normalized leaf to air temperature differences to represent the changes in meteorological conditions over time [14]. For accurate determinations of the normalized temperatures, leaves may be sprayed with water for Twet (corresponding to maximum transpiration rate) and covered with vaseline to induce stomata closure for Tdry (non-transpiring leaves). Wet and dry paper or cotton may also be used for thermal image data collection that simultaneously include actual, and reference temperatures [15,16]. The CWSI is inversely well correlated to leaf water potential and thus it is accurate for vineyard irrigation management. The use of both non-water stressed plants and plants kept under drought for reference temperatures is particularly useful on remote sensing imaging for managing deficit irrigation in vineyards [17]. Similarly based on the energy balance equation [14], the thermal index of relative stomatal conductance (Ig) uses the same references of CWSI but is directly proportional to leaf water potential and linearly correlated with stomatal conductance under a wide range of plant water status and atmospheric conditions [8].
However, an important effort is needed to develop automatable and user-friendly decision supporting systems for a sustainable management of vineyards in Mediterranean environments [18,19]. For instance, a real time detection of plant water status, directly managed by the winegrower, in an automated (remote or proximal) way would allow accurate and opportune adjustments of irrigation to the site-specific characteristics, according to yield and quality objectives [20]. Yet, main solutions for optimized irrigation management systems require an important economic investment on plant proximal sensing platforms or non-invasive methods [9,11,15], not suitable for small and medium-sized farms which represent an important part of the wine making sector in many wine growing regions like those of the Mediterranean basin [19].
Besides, a great deal of variability concerning physiological performances and metabolic behaviors can be found across European wine grape cultivars: this leads to different growth responses, yield and quality results under diverse climate conditions and abiotic stresses [21,22,23,24]. Genetic variability proved to be a powerful means for adapting viticulture to changes in climate [25,26] and helps understanding the resilience of the crop and the plasticity of several varieties to variegated pedo-climatic conditions in arid and semi-arid areas [27]. Several differences in functional and metabolic characteristics of grapevine varieties have been observed under drought [28,29]. Varieties may show different stomatal control over transpiration under drought and high temperatures [21,30,31]. Varieties with high anisohydric degree tend to keep higher stomata aperture and to decrease more rapidly plant water potential. The leaves of the anisohydric varieties have a greater stomatal conductance and therefore may have a greater CO2 assimilation, but also a lower photosynthetic and photorespiratory efficiency [32]. However, in conditions of severe and/or prolonged water deficit, varieties with lower anisohydric degree have higher stress tolerance, increased intrinsic water use efficiency [33], a greater stomatal sensitivity to vapor pressure deficit [34] and a lower vulnerability to cavitation due to lower hydraulic conductance [21,35,36]. The stomatal behavior of a variety may vary according to the progression of stress conditions and to the level of water stress sensed [24,37]. Grapevines may also exhibit different adaptive responses to heat and long-term water stresses [38,39] depending upon the cultivar x rootstock combination, the pedoclimatic environment and the agronomic practices [40,41,42]. For instance, the rootstock-scion combination and seasonal root growth, play an important role on drought perception and tolerance along the seasons, as well as on plant hydraulic and stomata conductances [43].
For these reasons, the accurate use of an easy method to support farmer irrigation decisions should include a validation procedure that guaranties high effectiveness on reproducing on-time plant water requirements and high accuracy on representing the crop physiological performances at specific atmospheric evaporative demand [44,45,46]. To better suit the on-farm management, the method must be simple, repeatable and intuitive, and at the same time should allow for automation at a low cost.
The aim of this work was to search for a simple, repeatable, and automatable method for a non-invasive, rapid and easy evaluation of irrigation needs to support and optimize, at the farm scale, the irrigation decisions in vineyard and to accurately fine tune the irrigation schedules at a low cost. We tested and validated an index, the irrigation need index (IIN) that enables opportune, economic and use-friendly proximal detection of vineyard water requirements for irrigation scheduling to meet high quality production objectives under different terroirs. Two wine grape varieties grown in Sardinia (Italy) were chosen: Vermentino, which exhibits anisohydric behavior under water stress; and Cannonau, which tends to present low anisohydric degree.

2. Materials and Methods

2.1. Experimental Design and Sites

The study was conducted on Vermentino and Cannonau vineyards grown in 3 different areas of Sardinia: Romangia (40°50′11″ N, 8°37′37″ E, 120 m.a.s.l.) in the north-west; Gallura (41°03′22″ N, 9°20′28″ E, 120 m.a.s.l.), in the north-east; and Parteolla (39°21′53″ N, 9°06′01″ E, 140 m.a.s.l.), in the south of the island. In each area, the trials were carried out on 2 contiguous vineyards of Vermentino and Cannonau, both grafted on 1103 Paulsen rootstock, trained to a single curtain vertical trellis system. In all of the vineyards, plants are drip irrigated with a single dripline attached to the trellis lower wire. The Vermentino vines are pruned to a single Guyot and the Cannonau vines are spur pruned, to a single cordon in Romangia and Gallura sites and to a goblet in Parteolla site. The Vermentino and Cannonau vineyards are northeast–southwest orientated in Parteolla, northwest–southeast oriented in Romangia and north–south in Gallura. These varieties were planted, respectively: in 2006 and 2015 in Romangia site, with a planting distance between and within row of 2.3 m × 1.15 m; in 2006 and 2003 in Gallura site with a planting distance of 2.50 m × 1.00 m; and in 2008 and 2011 in Parteolla site, spaced 2.30 m × 1.00 m in Vermentino and 2.30 m × 0.80 m in Cannonau. Besides the climate, main differences among sites concern soil characteristics: in Romangia the soil is clay loam, calcareous with low organic matter content but high water holding capacity; in Gallura the soil is sandy loam with neutral pH and medium organic matter content and low water retention capacity; and in Parteolla, the soil is clay loam and alkaline with medium level of calcareous and low organic matter. Soil samples were collected at the first a 0.5 m of depth, during the growing season 2019, in order to determine the differences among sites concerning soil physical and chemical fertility as well as the water retention curves. The soil characteristics are presented in Table A1.
Similar deficit irrigation strategies, imposing mild and moderate water stress were followed during berry growth and development stages until ripening (BBCH 71 to 83). In Table 1 the specific midday stem water potential (mΨs) thresholds for each phenological stage are reported. Irrigation was supplied when mΨs fell below these limits. In order to achieve regulated deficit irrigation and to meet high quality productions, from fruit set until veraison re-watering was supplied when mΨs fell below moderate water stress threshold [47,48]. Thereafter, the threshold was decreased to a value closer to severe water stress condition [20,49]. The experimental trial followed a randomized block design and, in each vineyard, 2 adjacent rows per treatment were considered. In each row, plots of 10 plants, distributed in a length of 80 plant, were monitored. In order to increase the range of vine water status and the dataset for the validation of the irrigation index in both varieties, during season 2019, at the Romangia site, an un-watered (UW) treatment was imposed on 2 adjacent vine rows, keeping the plants unirrigated from cluster closer (BBCH 79) onward. In this case, the first row was considered as border row, while the measurements were taken on 4 plots distributed along the second row, as indicated above. This treatment was compared to the re-watered one (WW), managed as described previously.

2.2. Thermal Time for Phenological Succession

The contribution of season thermal conditions for the phenological succession was accounted for computing the accumulated normal heat hours [50]. The accumulated thermal time for each phenological stage expressed by the normal heat hours model represent air temperature efficiency for the succession of grapevine phenology, taking into account an active temperature response curve that ranges from a minimum critical temperature of 10 °C to a maximum of 35 °C and reaches the highest activity at about 25 °C [51].

2.3. Vine Water Relations and Physiological Performances

Speaking plant approaches to monitor vineyard physiological status are required to evaluate the efficiency of the non-invasive method for optimized irrigation scheduling according to specific yield and quality objectives [20,47,48,52]. Plant water potential is currently the most representative, widely used, physiological indicator to optimize irrigation in vineyards [53]. Therefore, from fruit set to harvest, mΨs was measured weekly on adult leaves from the middle height of the canopy, using a portable pressure chamber (Pump up, PMS Instruments, Albany, OR, USA), in order to monitor vineyard water stress and to comparatively evaluate the response of IIN with the actual plant water status. In 2019, 2 leaves per plant and 4 plots (n = 8) were monitored and in 2020, each replicate was performed on different plants, distributed in 5 plots for each row (n = 10), to extent the sample randomization. The leaves were enclosed on aluminum foil-coated plastic bags 1 h before the measurement, to balance leaf water status with that of the shoot, thus approximating the water potential estimation to the actual plant water status. The stem water potential was chosen because it gives a good indication of the whole plant water uptake and transpiration status [47]. It represents the hydraulic conductivity in the plant and not short time environmental fluctuations that may occur in the surrounding atmospheric (due for instance to irregular cloud cover) [53]. When measured at midday it also typifies the daily maximum atmospheric demand and water stress condition. For these reasons, it is considered a robust indicator of early water deficit and rewatering needs.
Leaf gas exchanges were monitored using a portable infrared gas analyzer (CIRAS-3, PP systems, Amesbury, MA, USA) assembled to a Parkinson leaf chamber for measurements on single leaf (n = 8). Net assimilation rate (Pn, µmol CO2 m−2 s−1), stomatal conductance (gs, mmol H2O m−2 s−1), transpiration rate (E, mmol H2O m−2 s−1), intrinsic water use efficiency (µmol/mmol) and leaf temperature were measured on fully expanded, well-exposed leaves, keeping the reference air with a CO2 reference concentration of 390 μmol mol−1 and 50% relative humidity. A standard photosynthetic photon flux density of 1000 μmol m−2 s−1 was imposed coupling a LED light unit to the leaf chamber.
During the irrigation season 2019, daily curves of leaf gas exchange and mΨs were measured at the Romangia site and the daily assimilated carbon (C) and instantaneous water use efficiency were estimated by calculating the daily integrals of photosynthesis and transpiration.
Furthermore, mid-morning and midday photosynthetic activity, air evaporative demand and Ψs were monitored in Gallura and in Parteolla sites, on consecutive days in each site, at 3 key phenological stages: berries pea sized, veraison and ripening, respectively at BBCH stage 75, 83 and 89.
During the irrigation season 2020, leaf gas exchange and mΨs were monitored at BBCH stages 75, 83 and 89 only in the Gallura site. Also, weekly measurements of mΨs were carried out by the farmer, following the previously indicated procedure.

2.4. Vineyard Water Balance, Atmospheric Evaporative Demand

Meteorological data were collected for the whole duration of grape growing season. In Gallura and Parteolla, data were gathered from the weather stations of the Meteoclimatic Department of ARPA Sardinia (Agenzia regionale per la protezione dell’ambiente della Sardegna). At the Romangia site a new weather station (ATMOS 41, Meter Group, Inc., Pullman, WA, USA), was installed. Evaporative demand (ETo) at each site was determined based on Penman-Monteith method. Then, cultural evapotranspiration (ETc) was estimated applying different cultural coefficients according to the crop growth stage: 0.5 for the initial stages, 0.7 for the mid-season, 0.6 from mid-ripening until harvest and 0.4 from harvest until leaf fall [54]. Soil water availability variation and actual evaporation rate were calculated taking into consideration precipitation and re-watering supplies. The yield data from each site, reported in Table 2, concern the production harvested in the whole vineyard.

2.5. Canopy Thermal Regime

Canopy thermal regime was monitored during the whole irrigation season 2019 at Romangia and at Gallura sites during 2020, using two different methodologies: (1) installing thermistor sensors (GMR strumenti, IT) coupled with datalogger (zeta tech.) for continuous recording of canopy temperature; (2) using an infrared thermometer (VT04 visual IR thermometer, Fluke corporation, Everett, WA, USA) for proximal canopy temperature punctual measurements. In each irrigation treatment, twelve thermistors were placed at the abaxial leaf blade, fixed with politetrafluoroetilene tape (PTFE with 0.075 mm thickness). These sensors were located both in west and east sides of the canopy wall, in leaves of the upper and the lower canopy height. The IR thermometer was used for far canopy temperature data collection during mΨs measurements (from 13.00 to 14.00), keeping the thermometer at 1 m of horizontal distance from the vine row and replicating the measurement along vine rows, in both east and west canopy sides (n = 10).
During season 2020, canopy temperature data were collected only in the Gallura site, at the same time of the leaf gas exchange and mΨs measurements using both the thermistors and the IR thermometer. The IR temperature of the canopy was recorded using different data collection modes: far, placing the IR thermometer at 1 m of horizontal distance from the vine row; and near, for single leaf temperature data from the upper and basal parts of the canopy, keeping 5 cm from the upper leaf blade. The replicates were performed in 5 plots, and records were made both in west sun exposed and east shaded canopy sides (n = 10 in far mode and n = 20 in near mode).

2.6. Index for Optimized Irrigation Management

Rapid determination of leaf or canopy temperature with the non-invasive devices was used to detect crop stress conditions, and to develop a stress index, able to represent crop physiological status and therefore manage irrigation to optimize crop performances, the irrigation need index (IIN). The IIN was computed based on the assumption that canopy to air temperature differences represents the potential plant water loss in watered plants and it is linearly related to the air vapor pressure deficit during most part of the daytime [55].
Since the thermal index Ig directly represents gs under different environmental conditions [56], we applied this approach to depict leaf to air temperature differences, using both canopy temperature (Tcanopy) and air temperature data, to represent both plant water requirements and atmospheric demand. To compute IIN, we normalized the difference using dry (Tdry air) and wet bulb air temperature (Twet air) as references. This allows to account for the environmental variability caused by factors that determine atmosphere evaporative demand (wind speed, net radiation, and vapor pressure deficit) in each field conditions in each site and phenological stage. Tdry air is the average air temperature collected from the local weather station. Twet air was calculated based the psychrometric equation, as a function of Tdry air and relative humidity, as proposed by Stull [57]. To reach high accuracy, we used the average values of Tdry air and Twet air and average Tcanopy (at both east and west sides) recorded along the duration of the mΨs measurements (1 h). Furthermore, to represent the variation in water transport along the shoot, due to the increasing degree of main shoot lignification across the phenological stages, we added a constant of 0.5 to the index Equation (1), during the stages of maximum main shoot development and until fruit growth as started (BBCH 70), and subtracted 0.5 to the IIN equation from mid-ripening (BBCH 85) onward.
I I N = T d r y   a i r T c a n o p y T c a n o p y T w e t   a i r
IIN was tested for both Vermentino and Cannonau vineyards of Romangia and Gallura wine grape growing areas, where deficit irrigation was applied by the farmer according to the mΨs thresholds indicated in Table 1, in order to keep mild and moderate water stress during fruit set and veraison. Prior to the validation of IIN, the accuracy and the representativeness of mΨs thresholds for managing irrigation on the both varieties were evaluated in the 3 grape growing areas, according to the leaf gas exchange performances and the re-watering supplies of the season 2019.

2.7. Statistical Analysis

One-way ANOVA and least significant difference (LSD) test were carried out to compare means of leaf gas exchange, mΨs and IIN data, at a p-value of 0.05, for each site and cultivar using SPSS 25.0 (SPSS Inc., Chicago, IL, USA). Linear regression was performed in order to validate IIN models in the two varieties and to examine the accuracy of each model in representing plant water status for the range of pedoclimatic conditions analyzed over the two growing seasons. To evaluate model goodness-of-fit and predictive capacity the mean absolute error (MAE); mean absolute percentage error (MA%E), root mean square error (RMSE); and the Nash Sutcliffe model efficiency coefficient (ENS) were calculated. The residual errors of the regression models were test for normality, t-test coefficients were used to determine single variables explanatory power and the proportion of observed variance in plant water potential that could be explained by IIN.

3. Results and Discussion

3.1. Vineyard Thermal Regime, Water Balance and Productivity

The season 2019 was characterized by a cold spring, with low air temperatures compared to the last 30-year series all over the region [58]. The low air temperatures during first growing stages caused frost damages in young shoots and inflorescences and lead to reductions in yield of 20–30% and over 50% in some areas of the north, as Romangia and Gallura. During the summer, minimum and maximum air temperatures were about 1.5 times higher than the average, especially at the beginning of July, when maximum values of 43 °C were recorded in Parteolla. Precipitation was higher than the average in the whole island, and cumulated values in May nearly doubled the average in Romangia and Gallura areas [58]. Conversely, the month of June was extremely dry compared to the average values of the historical series. The rain events of mid-July in the northern parts of Sardinia were higher than the historical average for this period reaching about 20 mm in the Romangia site and 24 mm in the Gallura site (Table 2), Meanwhile, in the southern area precipitation was very low and no precipitation events were recorded in the Parteolla site from BBCH 70 to 83 (Table 2). In season 2020, the minimum air temperatures remained stable according to the average values of the last climatic series, while maximum air temperatures of April and July were slightly higher. August was hooter than the average, with about 1.5 °C to 2 °C higher maximum values in the 3 sites. July and August were dry all-over the island and only an important rain event occurred by 29–31 August (about 21 to 25 mm in the three study areas) [59]. During the summer 2019, evapotranspiration was higher than the average of the 30 years, in all sites (Table 2), while in 2020 the ETo varied close to the 30-year average in the whole territory.
In the northern areas of Romangia and Gallura, the thermal regime, represented in Table 2 by the accumulated normal heat hours, was less effective for the early phenological stages, due to a higher frequency of temperatures below 10 °C. The low temperatures during the first growing stages caused frost damages in young shoots and inflorescences and lead to reductions in yield of 20–30% and over 50% in some areas of the north, as Romangia and Gallura. Conversely, during the summer, the air temperatures recorded in the North part of the island had a greater effect on the rate of phenological development than in the southern area. In fact, the active temperatures accumulated for the achievement of the various phenological stages were higher in Romangia and Gallura and this was evident for veraison and ripening. At these stages, the greater permanence of high temperatures (above 35 °C) in the Parteolla resulted in a phenological slowdown in both years, compared to the north of Sardinia.
Due to the higher summer evaporative demand and the lower water holding capacity of the soils in Gallura, irrigation requirement and frequency were higher, particularly in 2019. In season 2020, the precipitation events recorded in Romangia, together with the reduced evapotranspiration during veraison and ripening, led to a significant irrigation water saving (up to 60% of the volume of water replenished in 2019), and the winegrower only carried out two fertigation operations from BBCH stages 70 to 83, both in Vermentino and in Cannonau. In the vineyards of Parteolla, ETo was very similar in the two seasons of study and therefore the irrigation supplies were unchanged. The different meteorological patterns of the two seasons led to a much lower irrigation requirement in 2020, particularly at the Romangia site.
The lower soil fertility in Gallura resulted in a lower yield level compared to the other areas, and together with the high crop evapotranspiration, it also strongly affected irrigation water productivity. Conversely, the greater fertility of the soil in Parteolla site, resulted in a higher yield of Cannonau even though the high evapotranspiration did not allow for irrigation savings as high as those achieved in Romangia. In fact, in this last area, the fertility of the soil and the milder climatic conditions contributed to high water saving and high irrigation water productivity, both on Vermentino and Cannonau.
In Romangia, irrigation was applied 3 times in Vermentino, in 2019: at veraison and at the beginning of ripening, for a total amount of 24 mm, while in Cannonau, the farmer applied a 21.6 mm, distributed in 4 irrigation supplies, from cluster closure until ripening (Table 2). In 2020, only fertigation supplies were needed in Romangia site, for a total amount 9 mm in both varieties. In 2020, at the Gallura site, the Vermentino vineyard was irrigated 7 times from pea sized berries until the beginning of ripening, while the Cannonau vines were irrigated only 4 times and with nearly half of the total volume applied to Vermentino (respectively, 31 mm and 70 mm). In this site, the irrigation volume applied in Vermentino in 2019 and 2020 was, respectively, 2.5 and 7.7 times higher compared to that of Romangia but similar to the volume supplied in Parteolla for the same variety, while for Cannonau the water supplied by irrigation in Gallura was 1.4 and 3.4 times higher than that of Romangia in 2019 and 2020, but was half of the water volume needed in Parteolla site (Table 2). These differences among varieties and sites concerning the irrigation water requirements, highlight the different degree of anisohydric behavior among the two varieties, and that the crop water use efficiency may vary deeply. The magnitude of the varietal differences may be strongly influenced by the evaporative demand and the soil water holding capacity [6,39]. In fact, irrigation water productivity, ranged from only 6.7 g L−1 in Vermentino of Gallura in 2019 to 155.6 g L−1 in Vermentino of Romangia in 2020. Also, Cannonau reached high values of irrigation water productivity in Romangia site in season 2020 (about 100 g L−1) but the range of variation was lower than that of Vermentino, the lowest values being recorded in Parteolla season 2019 (ca. 8.5 g L−1).

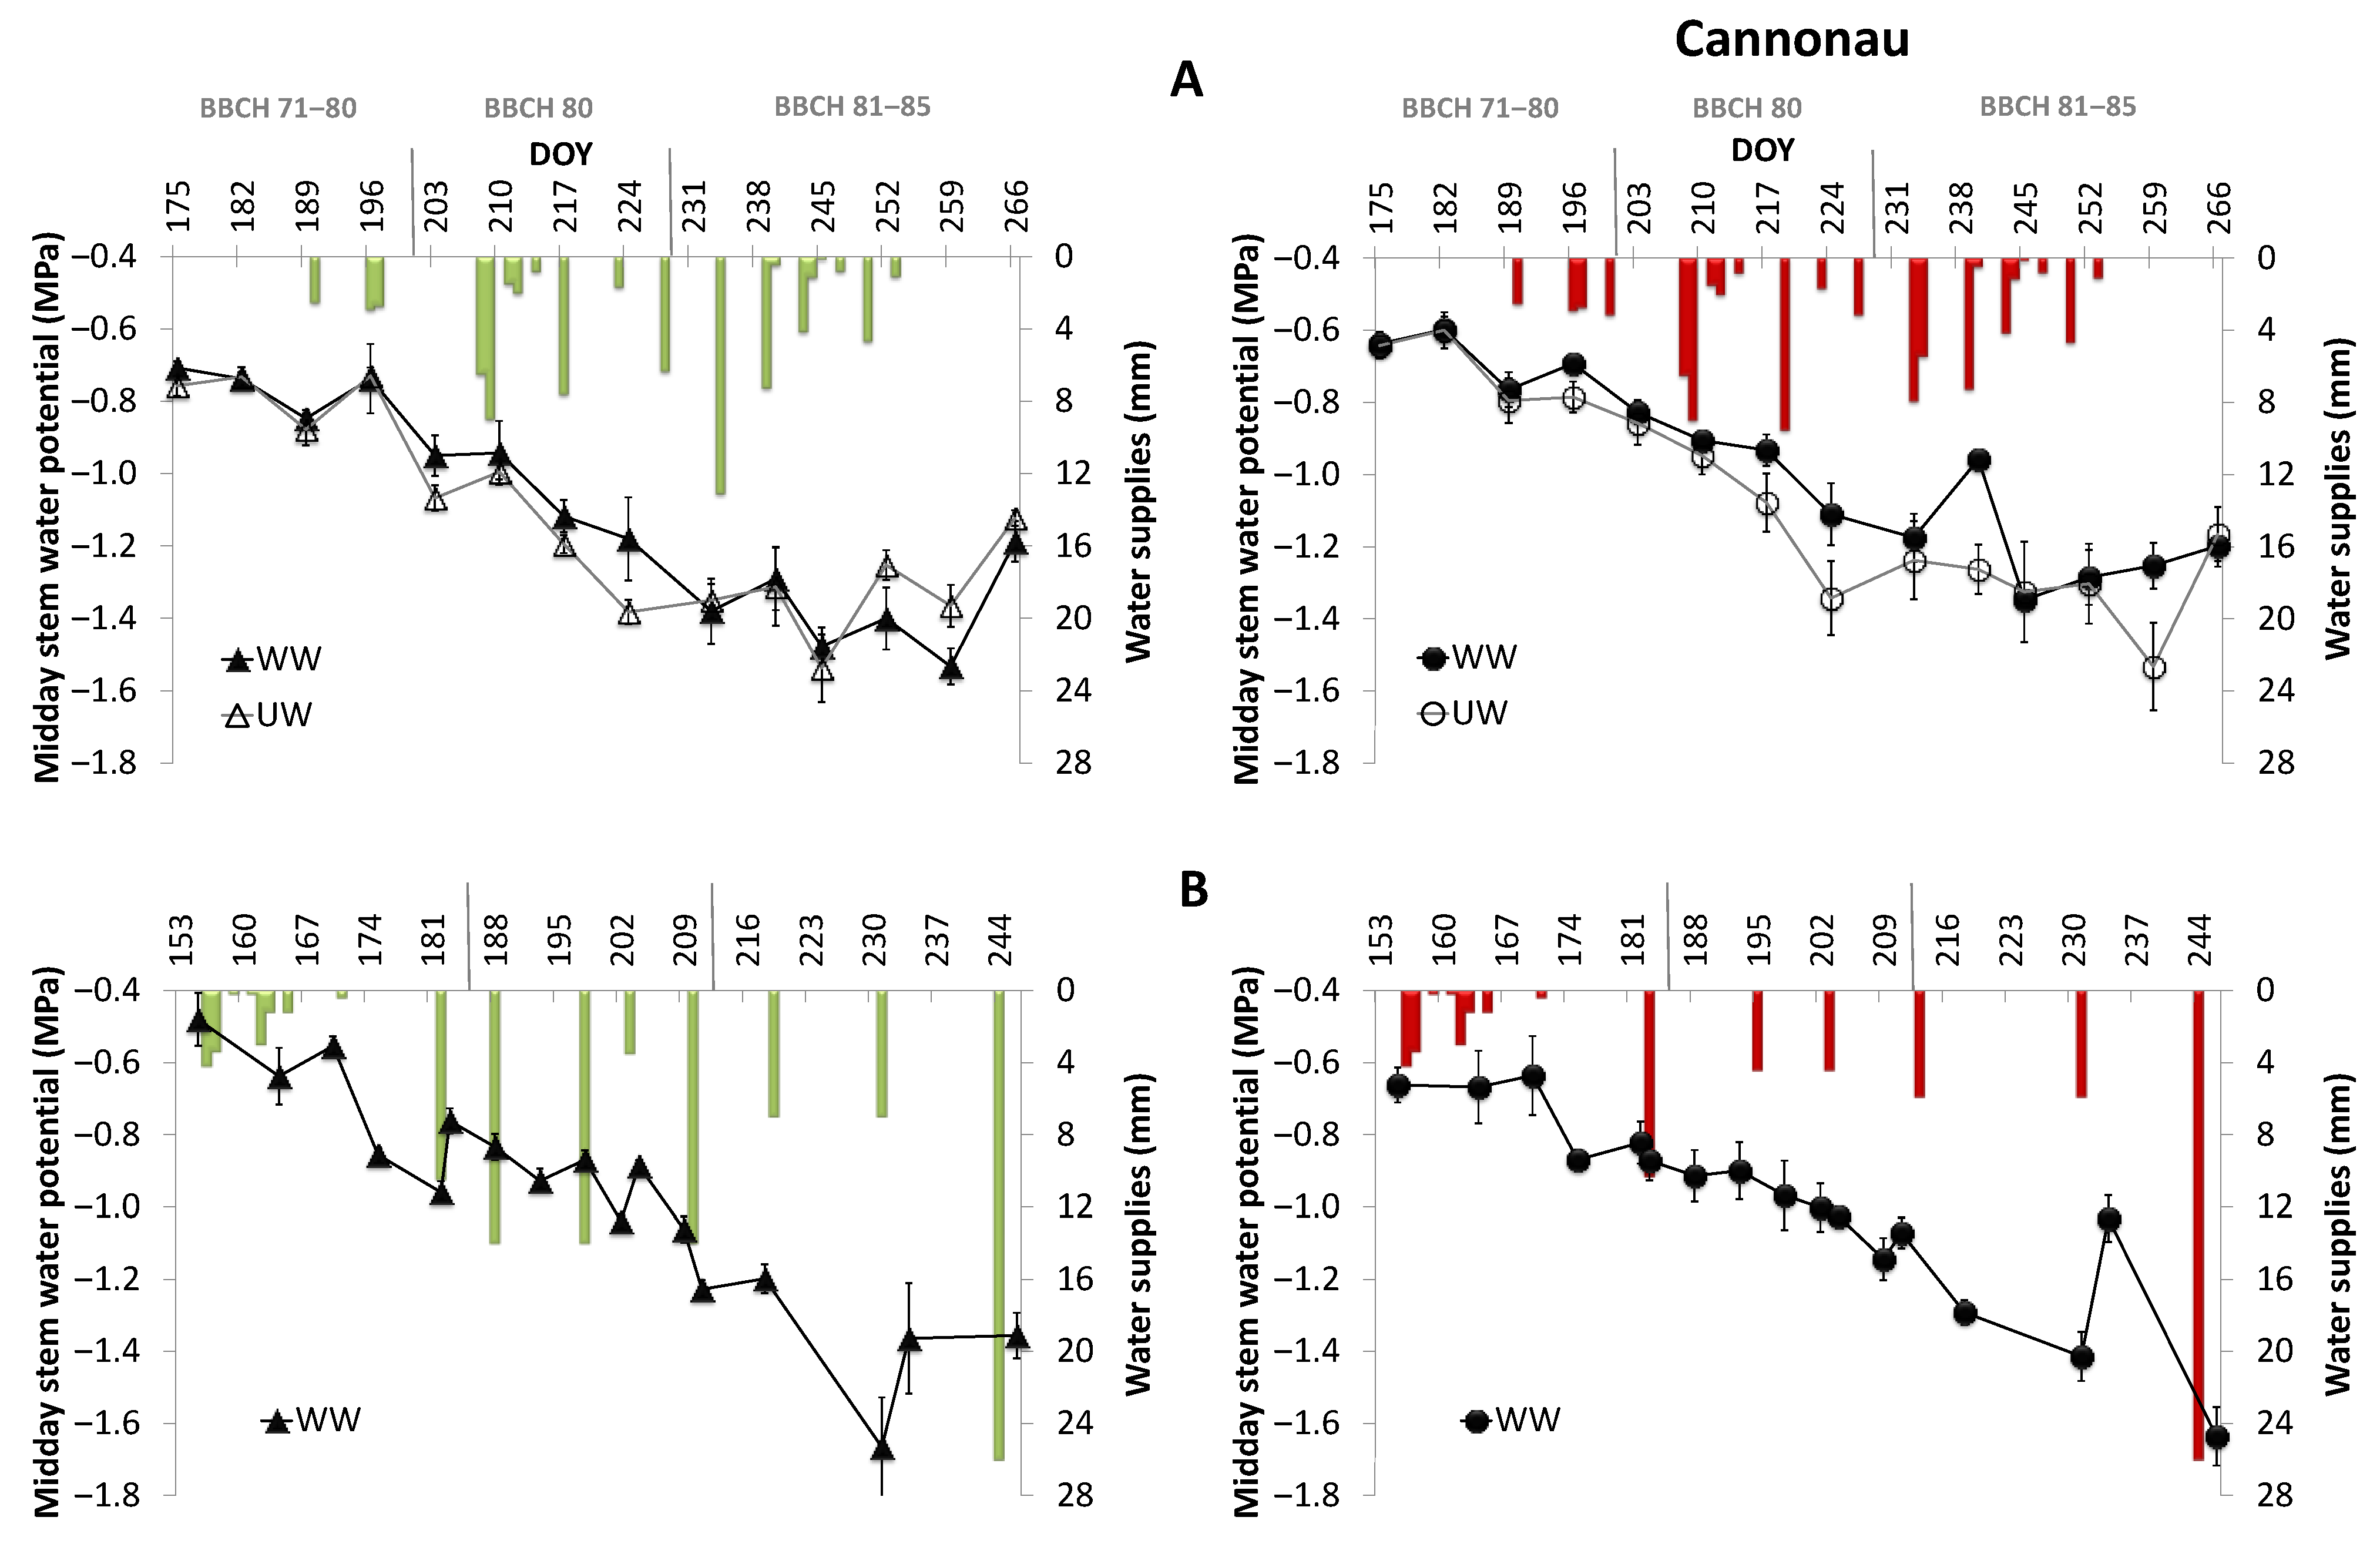
3.2. Accuracy and Representativeness of Midday Stem Water Potential for Vine Water Status and Irrigation Opportunity Evaluation

For both the invasive mΨs and non-invasive IIN indicators for an optimized irrigation management, the methodology of assessment must be: (1) accurate in determining the water status of vineyard; (2) representative for the variety, pedoclimatic and farming conditions; and (3) precise in identifying the opportunity for irrigation in given wine-growing contexts.
The accuracy of stem water potential thresholds for irrigation opportunity evaluation was assessed by comparing the pattern of mΨs, water supplies and leaf gas exchanges performances in each variety. Figure 1 shows the mΨs decreasing patterns and the water supplies over season 2019 in the two treatments, re-watered (WW) and un-watered (UW) at the Romangia site and along the season 2020 in the irrigated Vermentino and Cannonau vineyards of Gallura. The mΨs well reflected the water supplies and highlighted the change of plant water status during the seasons, proving to be precise and accurate for the evaluation of water requirements in both varieties. The suitability of mΨs as reference physiological indicator to test the accuracy of thermographic indexes for the estimation of plant water status and to discriminate irrigation treatments was also confirmed by other works in Moscato and Merlot vineyards of Veneto region [60].
The slight differences in mΨs among varieties at Gallura site (Table 2), despite the much lower water volume restituted to the plants, well reflect the higher stomatal control over transpiration and thus the lower needs for irrigation in Cannonau (Figure 1).

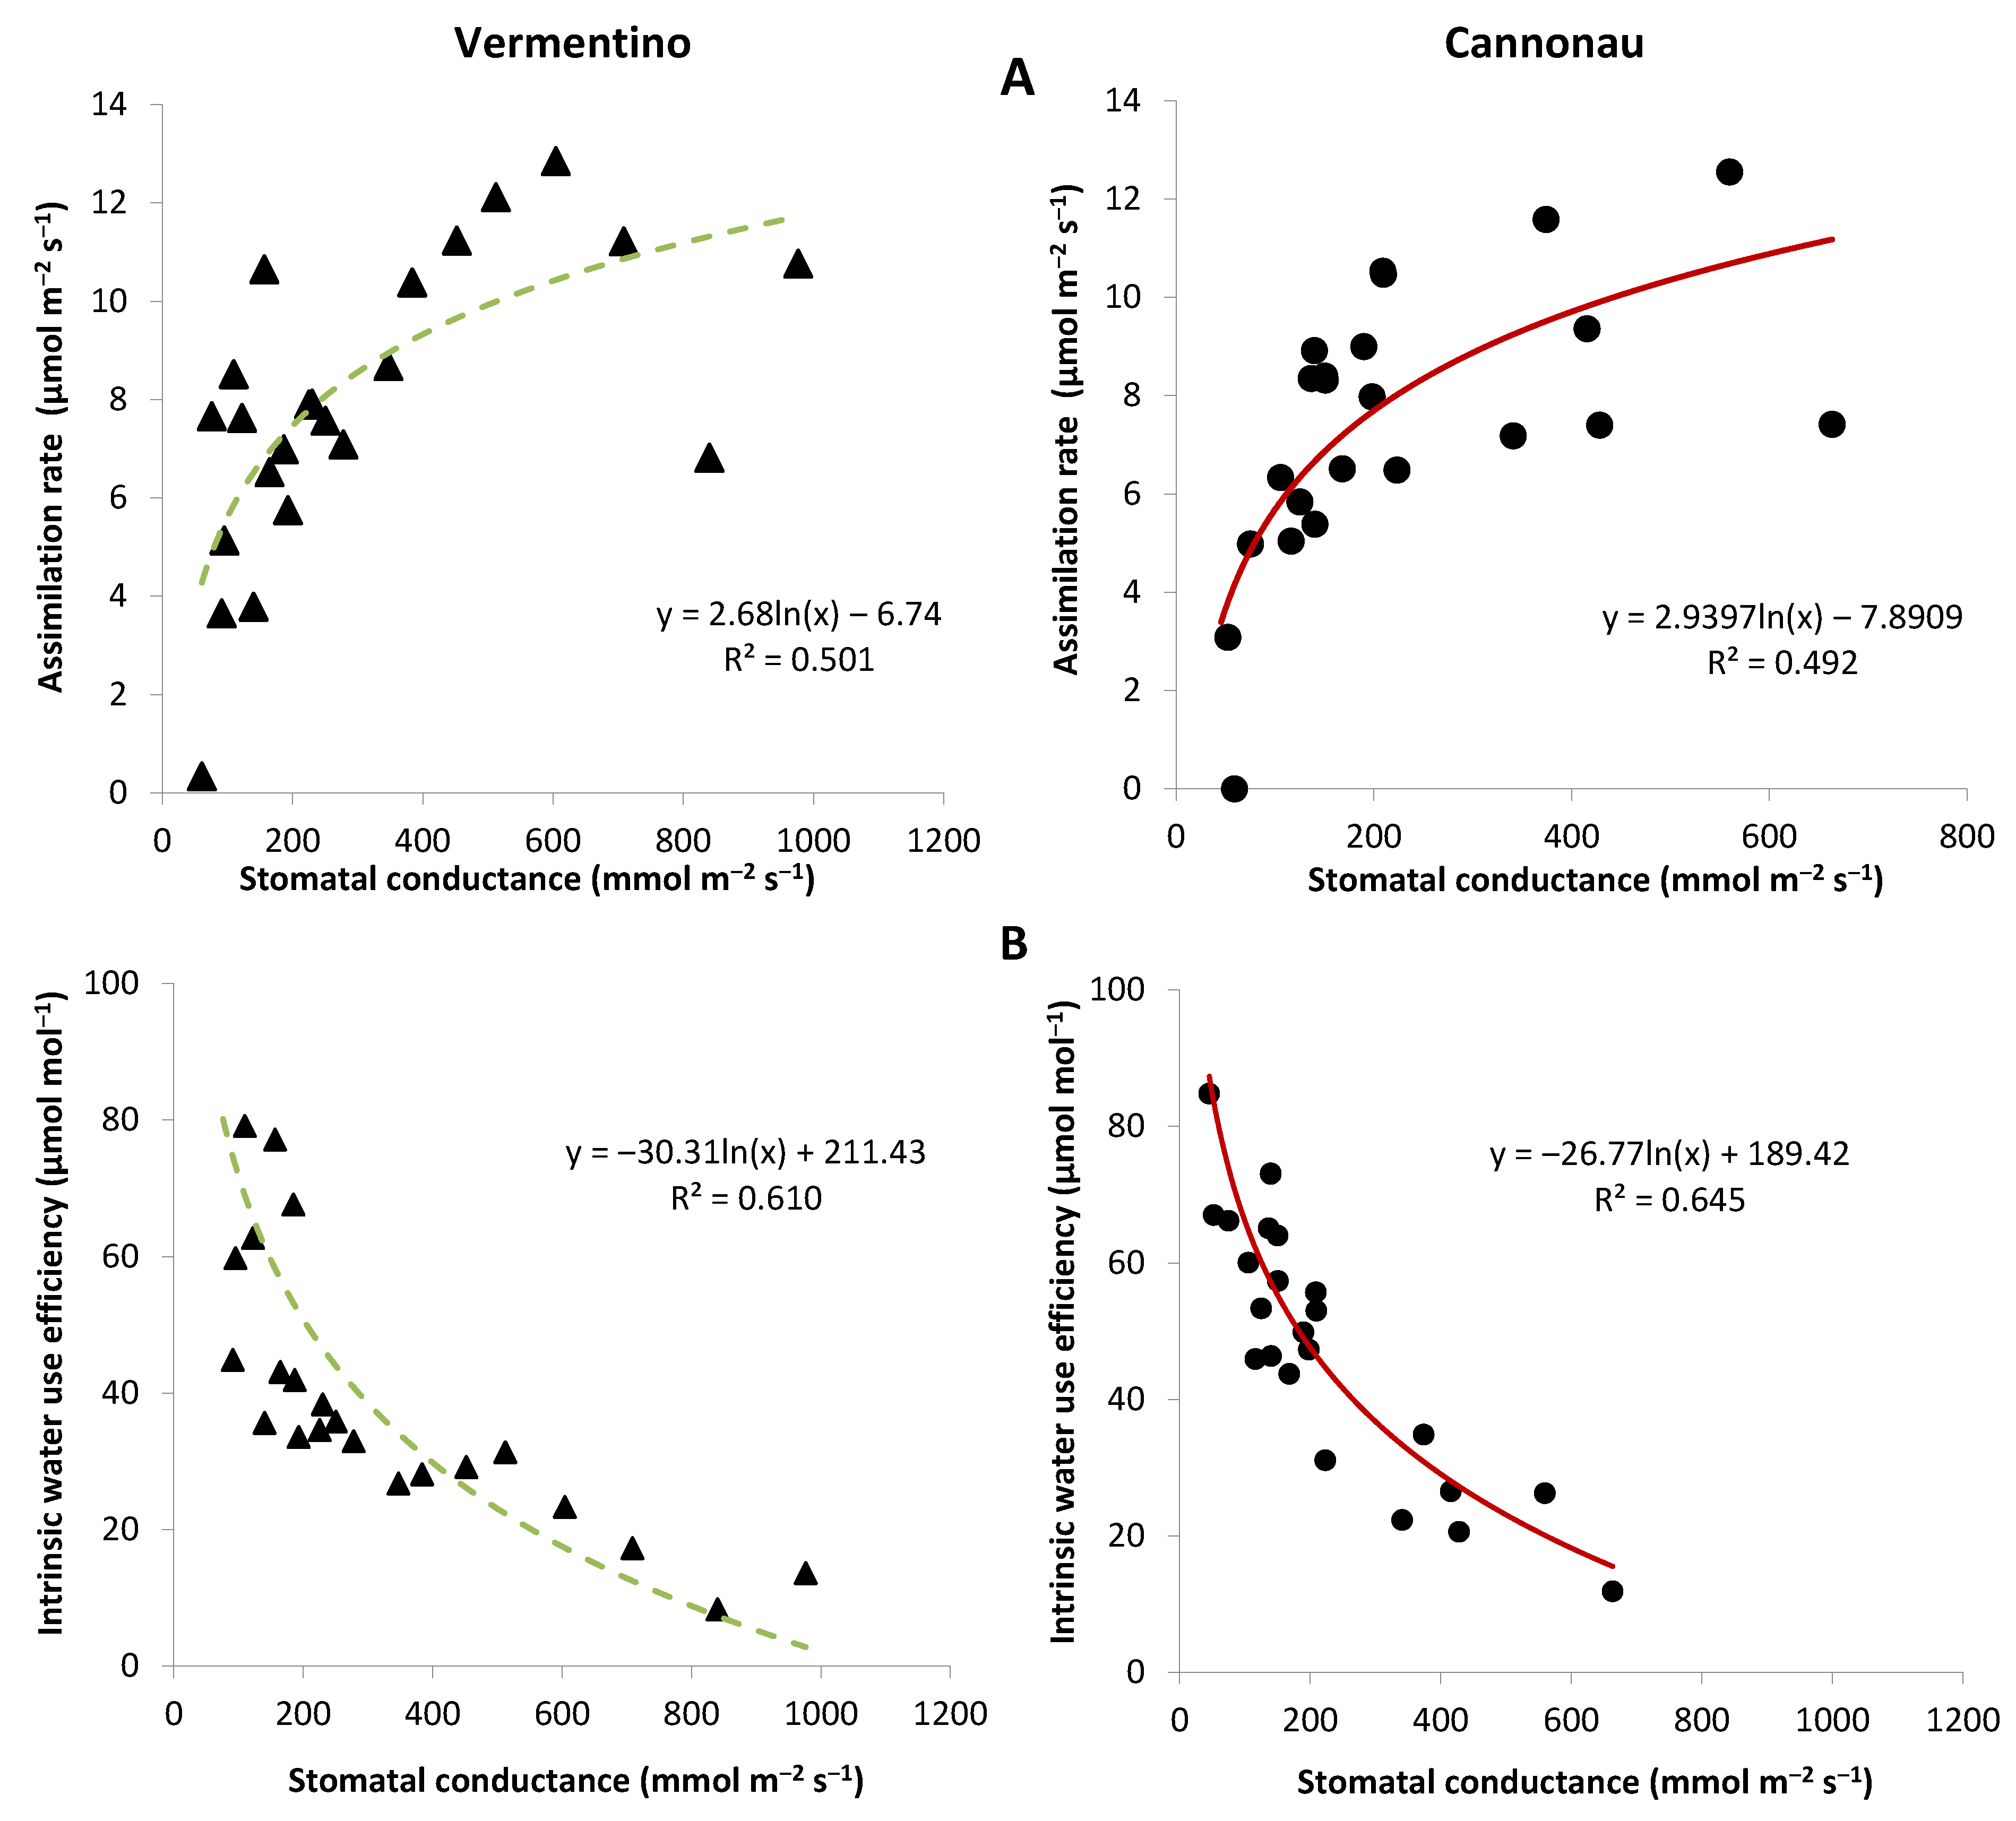
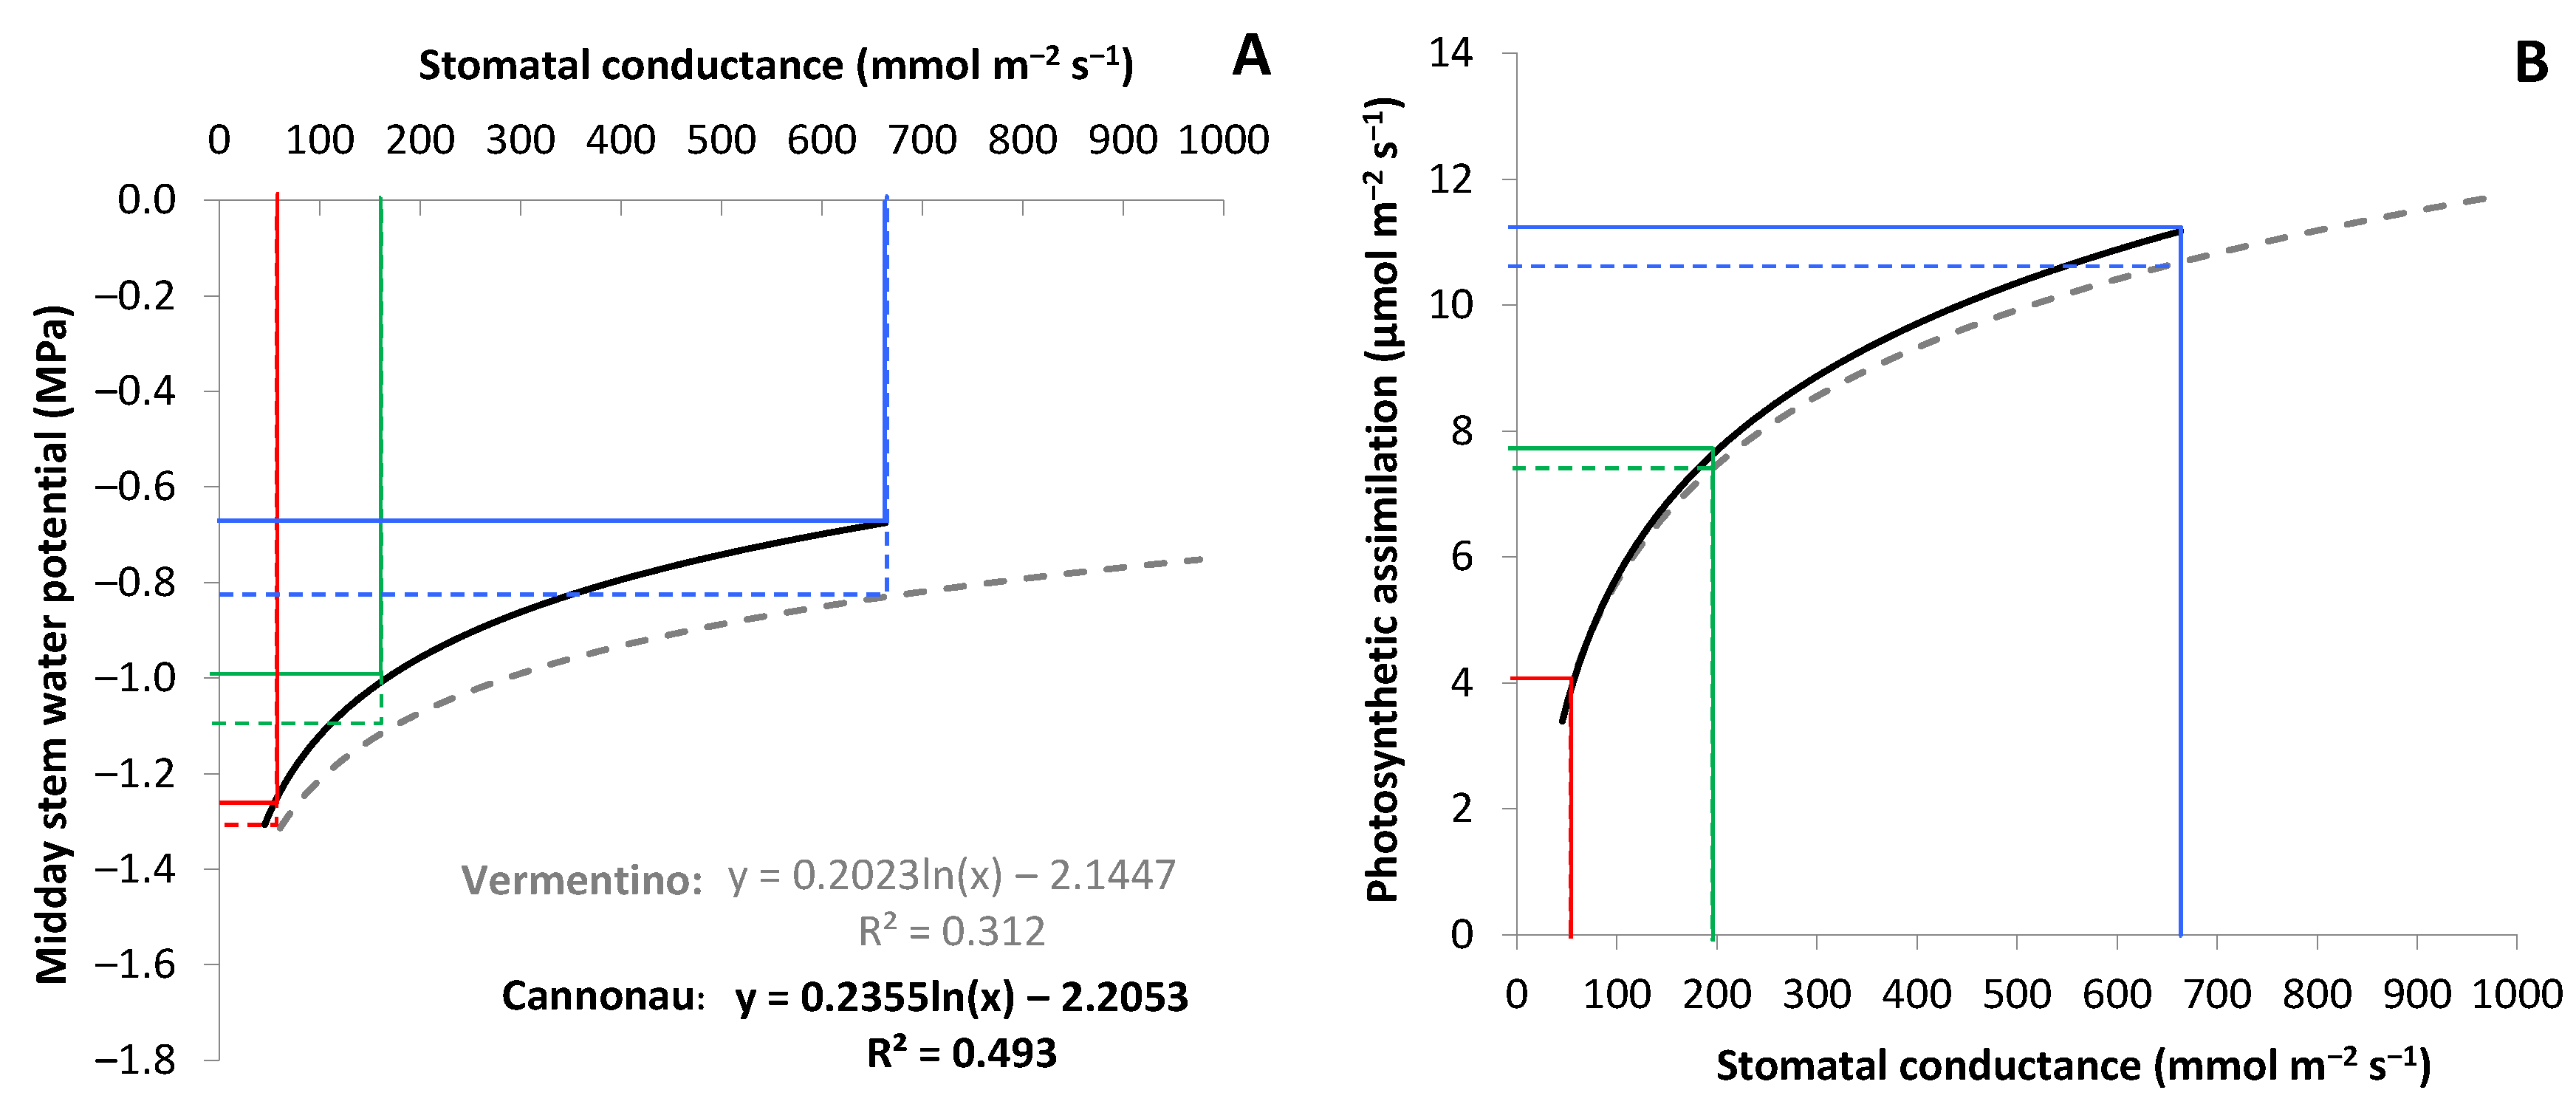
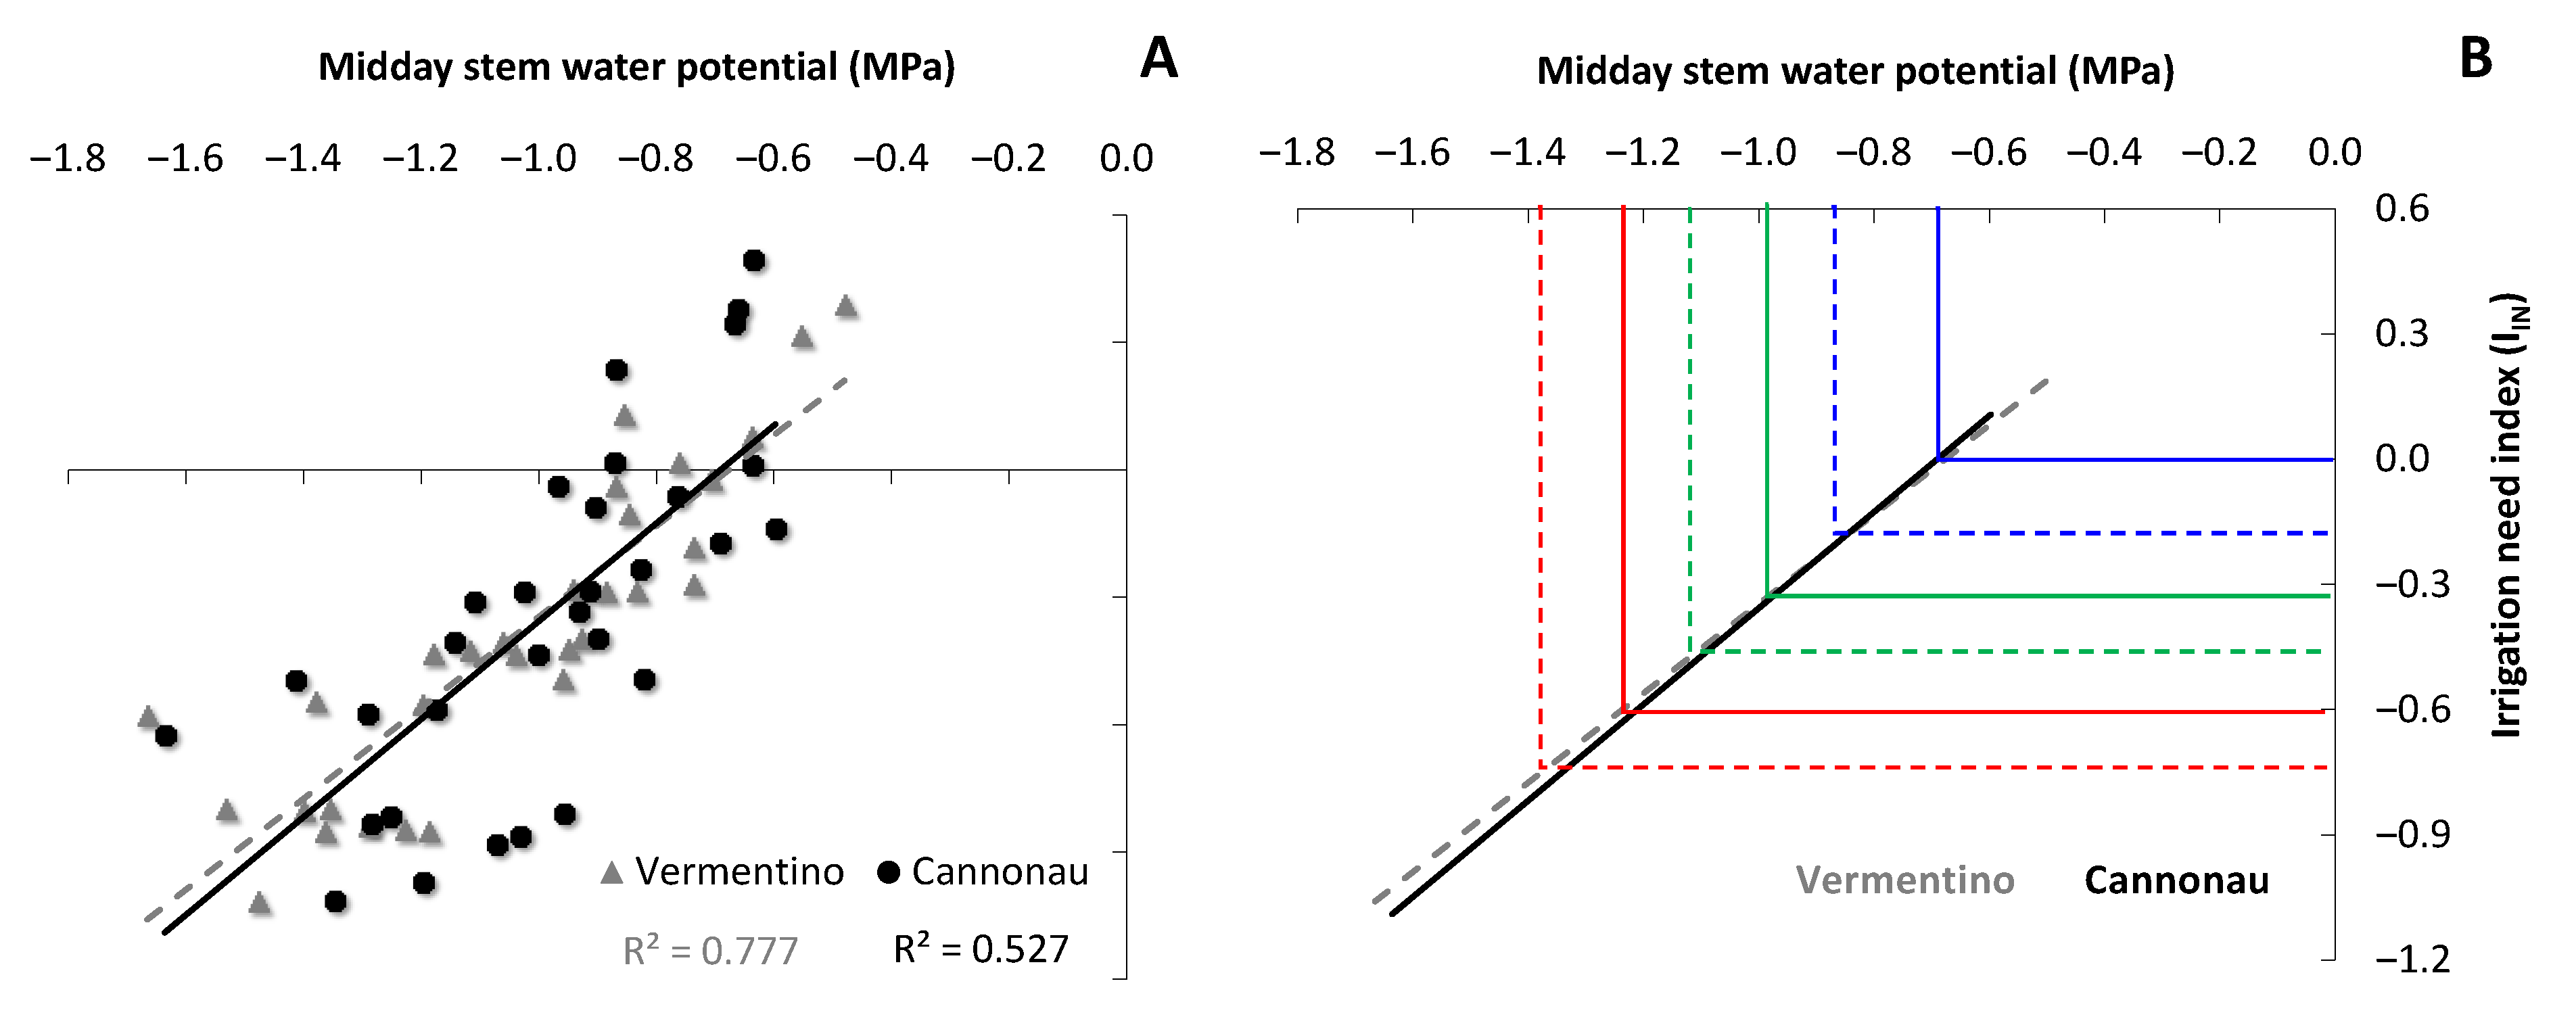
3.3. Representativeness of the Midday Stem Water Potential for Vermentino and Cannonau Varieties and Validation of Variety-Specific Thresholds

The comparison of photosynthetic intensity, stomatal conductance and intrinsic water use efficiency data, collected in the three areas of study, highlighted that leaf gas exchanges and water use in the photosynthetic process follow a similar pattern in both varieties. The main difference being the fact that Vermentino leaves achieve low levels of water use efficiency with a larger stomatal opening (Figure 2). Under hydric comfort conditions, i.e., with full soil water availability, grapevines can exhibit high photo-assimilative performances, with maximum values of gs, Pn and E. When soil moisture decreases, the strong stomatal control in Cannonau leaves tends to balance more the plant water content with respect to that availability in the soil. The tighter stomatal closure in these plants tends to determine greater efficiency of water use compared to plants with much a higher degree of anisohydric behavior, such as Vermentino. For the latter cultivar, the higher stomatal aperture allows greater loss of water by transpiration and the water potential decreases [23,31].
Though maintaining a less conservative water balance, highly anisohydric varieties may recover quickly following a drought event, due to greater resistance to cavitation under severe stress conditions [61]. This behavior may therefore determine a higher photosynthetic activity in conditions of mild to moderate water stress. However, when moderate to severe stress is protracted, gs and E are markedly reduced, a multiple–water and heat–stress condition is established, with increased leaf temperature. If the duration of the stress is prolonged and/or the stress arises rapidly, photo-inhibition phenomena and irreversible photo-oxidation damage on the leaf wall may occur [23,52]. This may lead to quite intense sunburn and early defoliation events, depending upon the duration of the stress and the anisohydric degree of the variety [32]. Strongly anisohydric varieties, as Vermentino, are more sensitive to such damage to the photosynthetic apparatus, while those with lower anisohydric character are less affected. In fact, when thermal and water stress increase, near-isohydric varieties present a higher water-splitting efficiency, a faster recovery of the photosystem reaction centers and a more efficient primary photochemistry and photorespiration [62]. It is therefore licit to define the mΨs thresholds according to the physiological performance of the varieties and for specific pedoclimatic contexts, in order to ensure optimal irrigation management and maximum water savings. Moreover, several studies have suggested that grapevines can change behavior depending on soil water potential, thus, for a correct characterization of the genotype effect, the influence of the environment should be considered [24,37,43].
In Figure 3, the red, green and blue lines represent the gs values to which mild, moderate and severe water stress thresholds are achieved. By comparing the stomata aperture values with those of mΨs, we observed that for the same gs, Vermentino presents lower mΨs. For our thresholds of interest for irrigation in pre- and post-veraison, it is shown that by maintaining a slightly lower potential in Vermentino no marked decrease in photosynthetic productivity occurs. Furthermore, for a higher vineyard water use efficiency during the stages of greater vegetative development, mΨs values higher than −0.7 MPa should be prevented in order to avoid water luxury consumption. At this stages, high soil water availability tends to produce larger increase in gs than in net assimilation and therefore an excessive consumption of water due to transpiration, more evidently when soil fertility and water holding capacity are high. Our results also showed that to the gs threshold 200 mmol m−2 s−1 (Figure 3), does not correspond a marked decrease in photosynthetic activity among varieties.
On the other hand, under soil water comfort conditions (above gs threshold 700 mmol m−2 s−1), a luxury consumption of water may occur, without involving a marked increase in photosynthetic activity, but rather high transpiration, mainly in Vermentino. Moreover, our results are in accordance to those observed by [11], who reported different increments in Pn, gs, mΨs and CWSI among varieties, with Vermentino presenting significantly higher increments of Pn, gs and CWSI compared to Cagnulari, as the vineyard water status changed from a moderate to a severe water stress status.

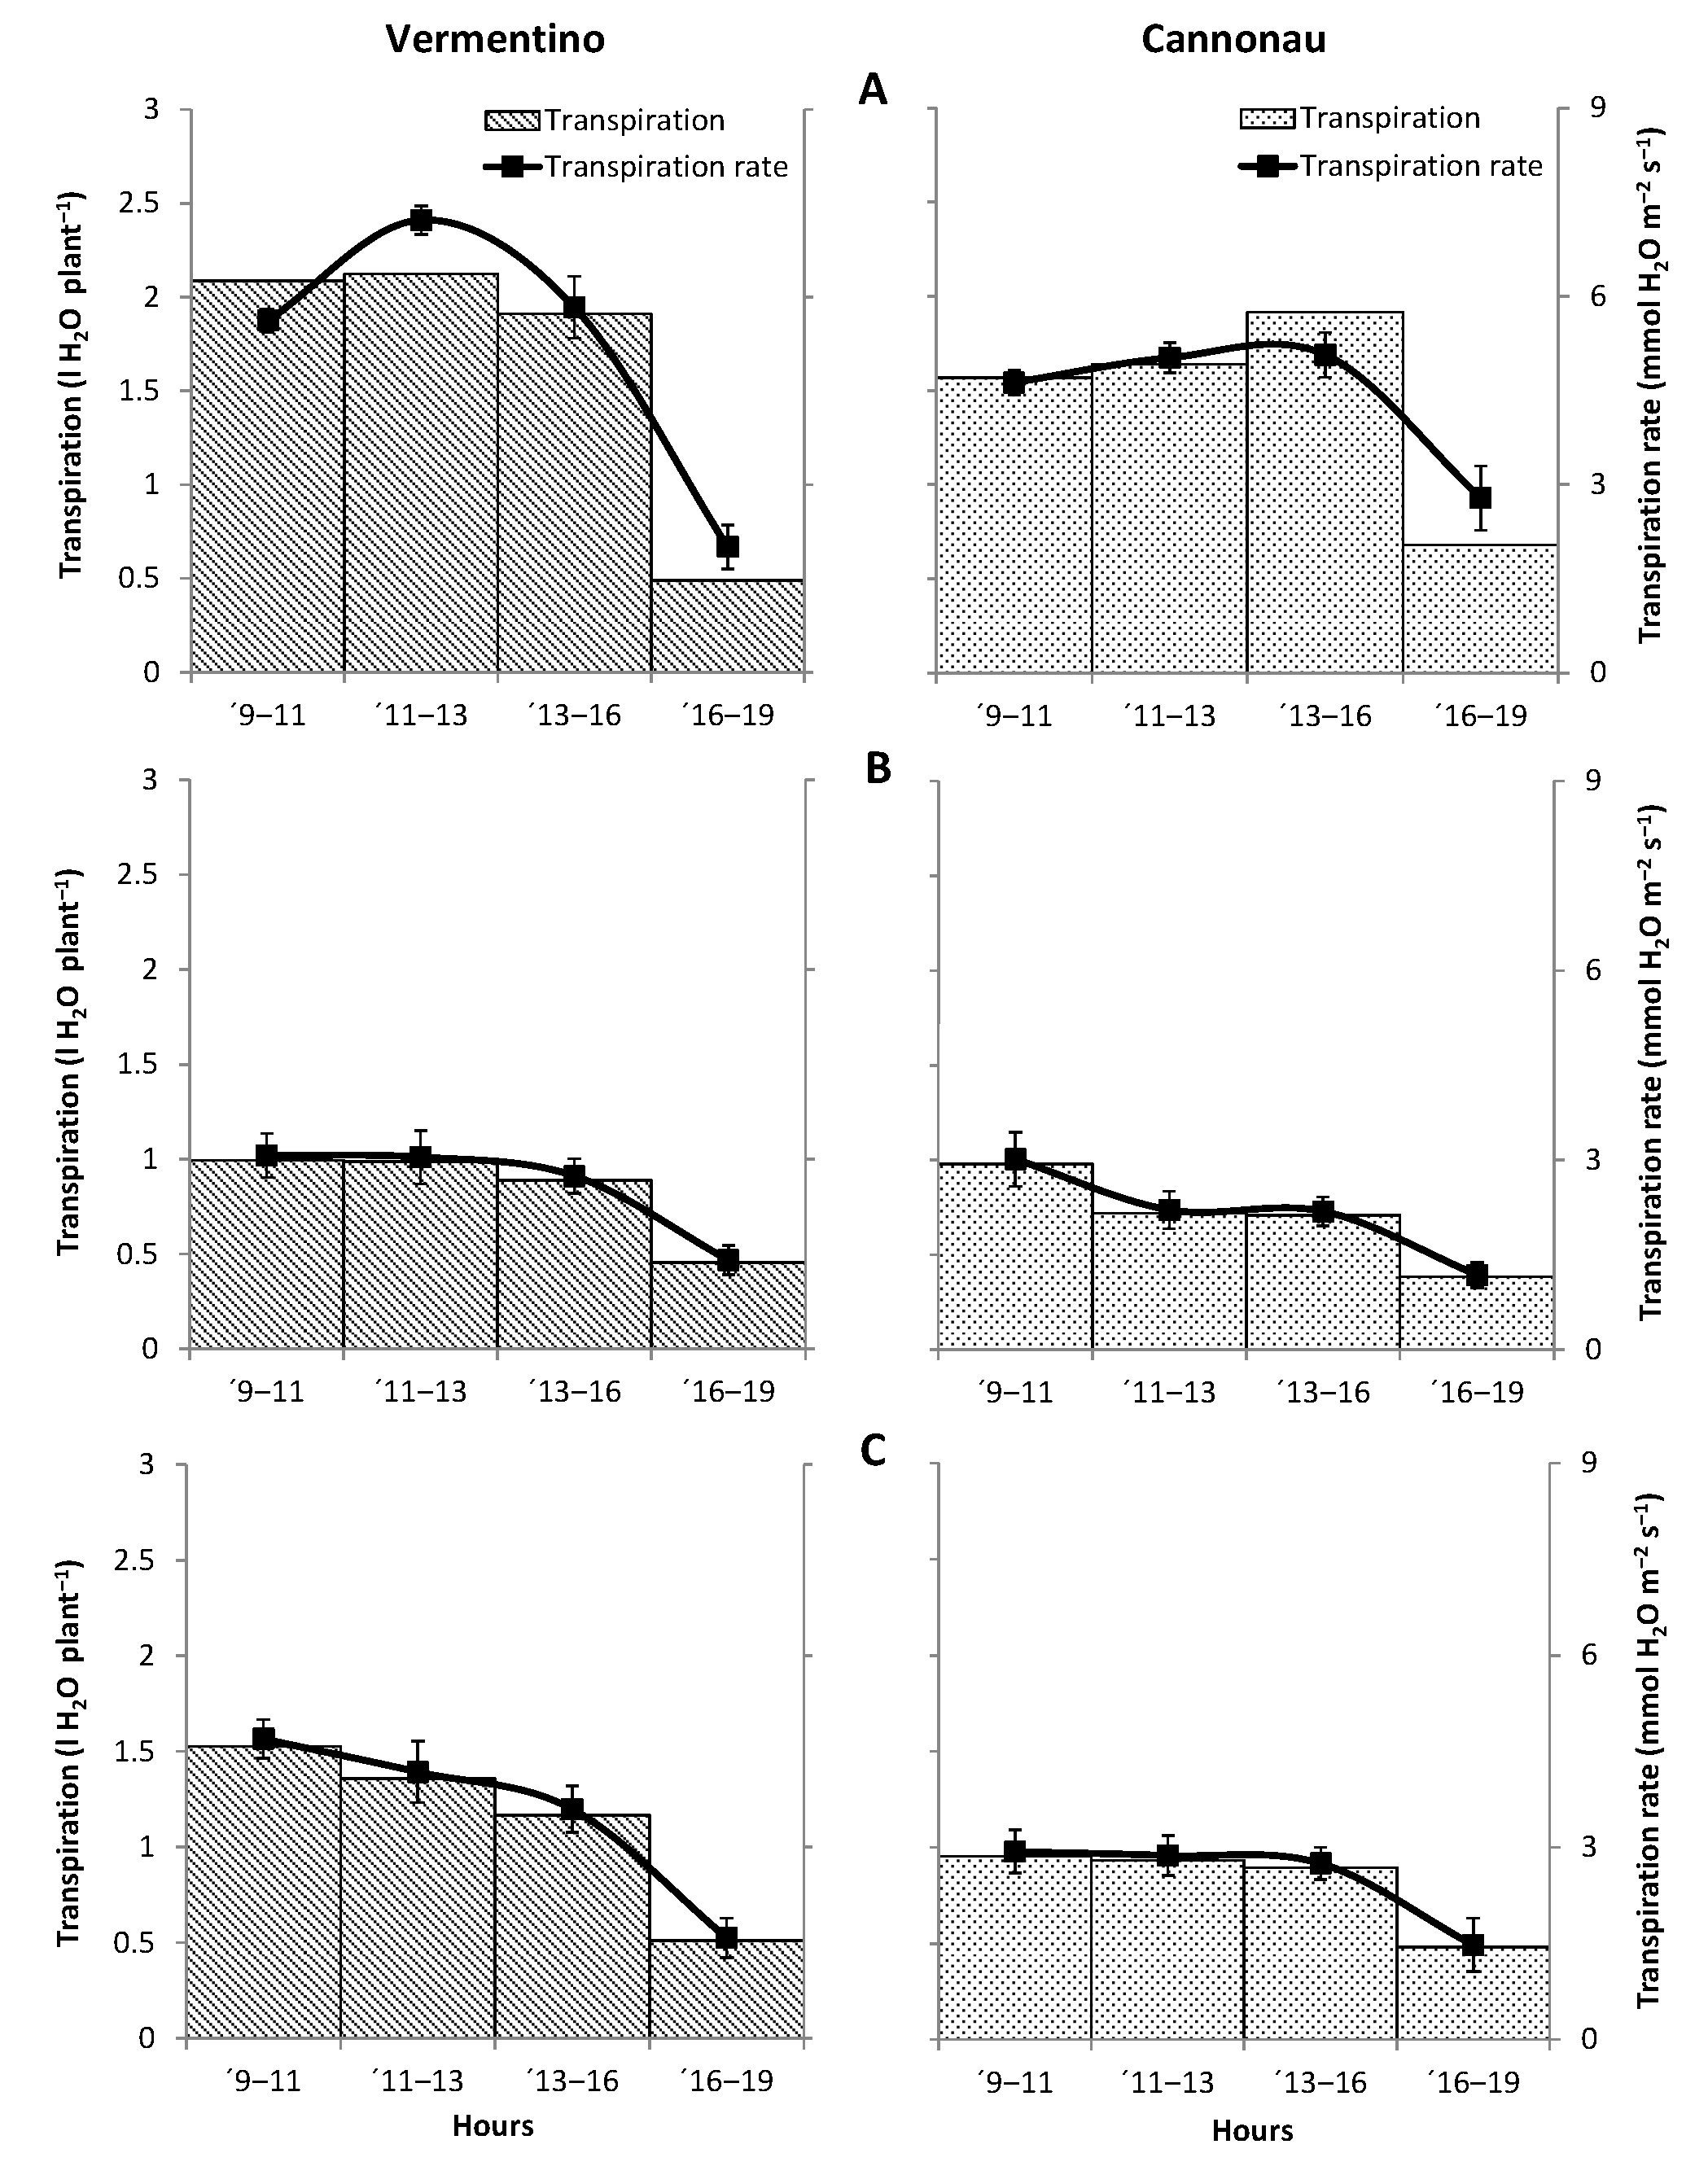
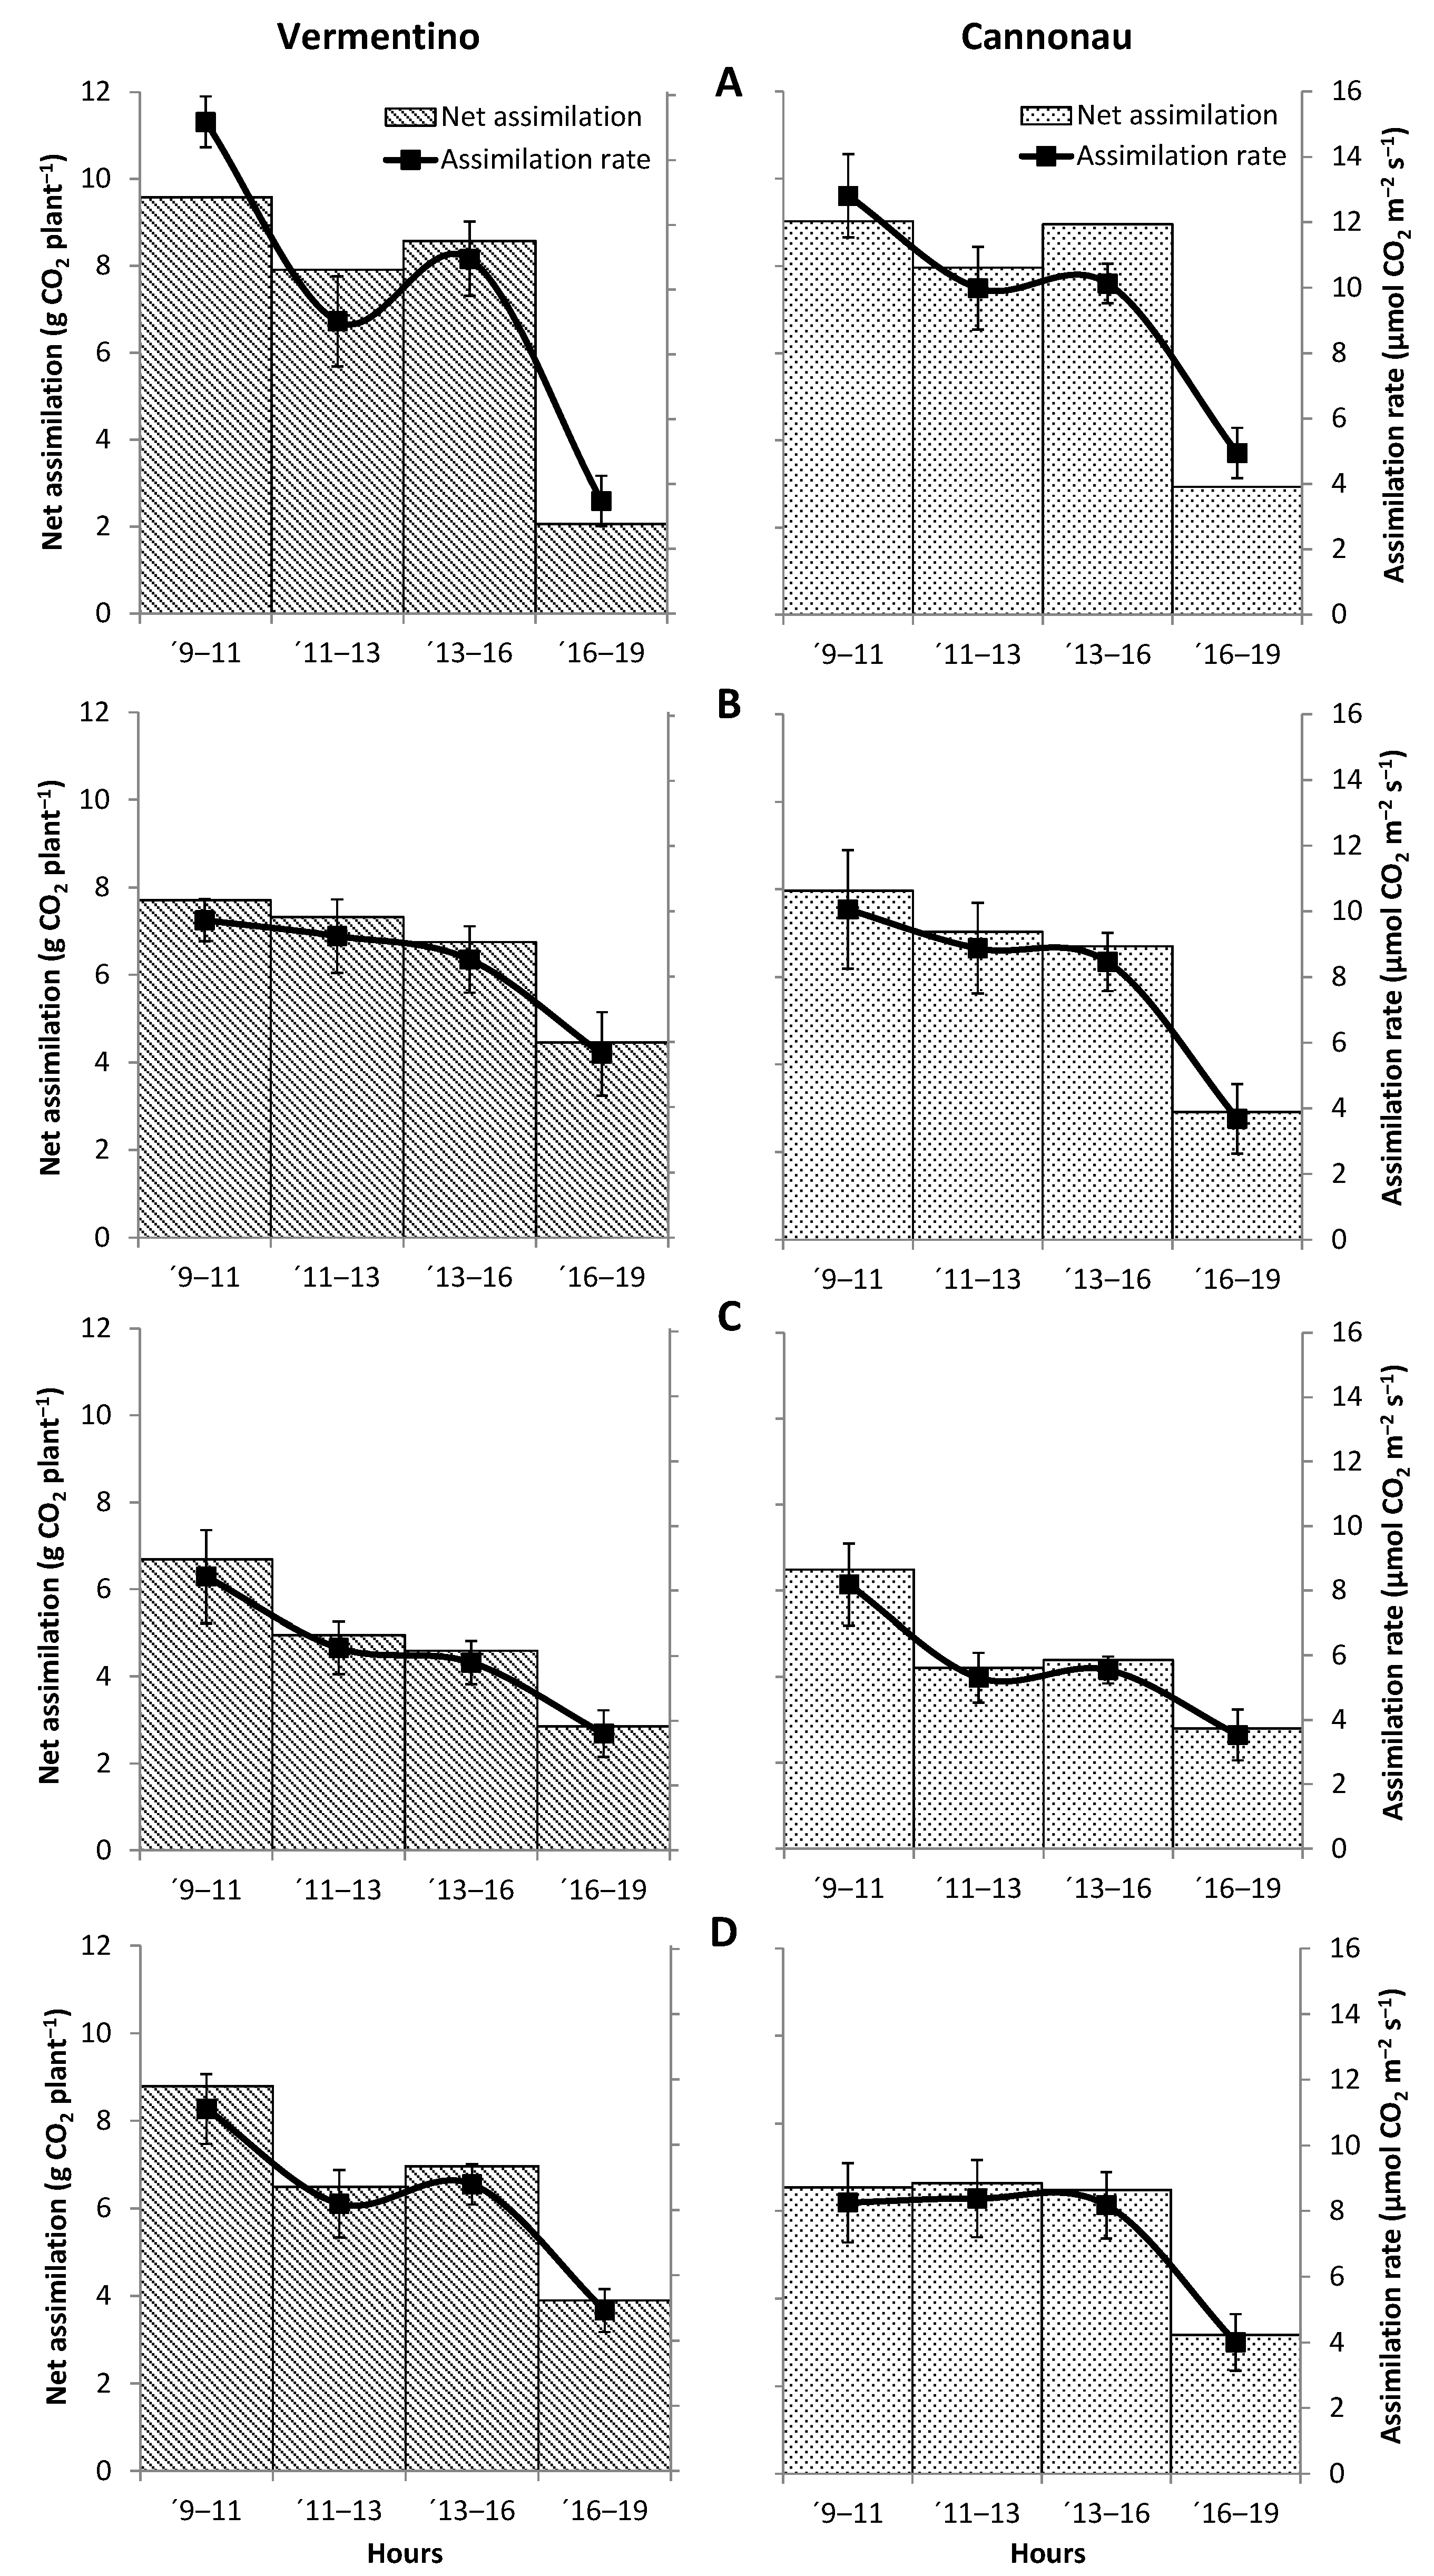
3.4. Evaluation of Photosynthetic and Transpiration Performances of Vermentino and Cannonau Grapevines in Three Different Viticultural Contexts

The maximum and the minimum photosynthetic performances were estimated, respectively, as a function of the average maximum Pn, measured at mid-morning and the average minimum Pn, recorded at midday in the 3 grape growing areas and in 3 different phenological stages (Figure 4). In the Gallura area were recorded the highest values of maximum Pn of Vermentino (16.4 μmol m−2 s−1), during berry growth (BBCH 71) but they not significantly lower compared to the Romangia and Parteolla sites (15.1 and 15.6 μmol m−2 s−1). However, during cluster closure (BBCH 80) higher maximum and minimum values of Pn were observed in the vineyards located in Parteolla and Romangia areas (respectively, 13.1 and 11.8 compared to 5.1 μmol m−2 s−1 in Gallura). At these sites the air temperature reached lower values compared to Gallura (respectively, 30 °C and 28 °C compared to 32 °C), and the soil water holding capacity is much higher (Table A1). The seasonal trends in photosynthetic activity percentage were similar in Cannonau, which showed a high assimilation performance in the Romangia and Parteolla areas during the BBCH stages 71 (respectively, 12.8 and 12.1 μmol m−2 s−1) and 80 (11.3 and 10.7 μmol m−2 s−1) compared to Gallura (10.4 μmol m−2 s−1 at BBCH 71 and 2.9 μmol m−2 s−1 at BBCH 80). This variety showed a greater sensitivity to high temperatures (over 35 °C) with a marked stomatal closure at midday during veraison, although the mΨs values were indicative of moderate but not severe water stress. These performances highlight the importance of evaluating the seasonal thermal trend for a more careful management of irrigation needs in both varieties. When the average air temperature exceeded 35 °C, there was a strong reduction in photosynthetic activity at midday not only in Vermentino but also in Cannonau.
The estimates of daily carbon assimilation and of water volume transpired per plant were carried out by calculating daily integrated variations of net assimilation [61], considering the daily leaf gas exchange measurements at the Romangia site (Figure 5).
For this estimate, an exposed leaf area of 2.5 m2 per plant was considered for both varieties. As expected, the highest volumes of assimilated C and transpired water during a sunny day were observed at BBCH stage 71, when soil moisture availability was not limited, and maximum canopy development was achieved. At this stage, only slight differences between varieties regarding the assimilated C were observed (approximately 28.1 g plant−1 day−1 in Vermentino and 28.9 g plant−1 day−1 in Cannonau). At full veraison (BBCH 83) daily carbon gain decreased nearly 32% in Vermention and 3% in Cannonau (to about 19.1 g and 17.9 g plant−1 day−1, respectively). After, during mid-ripening, Vermentino plants were able to reach higher daily carbon assimilation again, only 7% lower than the average values recorded at the BBCH stage 71 (26.8 g plant−1 day−1). Meanwhile, Cannonau still presented a 20% lower net C assimilation compared to that measured at pea size stage (about 22.8 g plant−1 day−1). These differences among varieties confirm the high anysohidric behavior of Vermentino compared to other varieties, like for instance Cabernet Sauvingon and Cannonau [11,62]. Throughout the seasons, the greater differences between varieties were recorded during both the periods of maximum and of minimum soil water availability and evaporative demand, which matched cluster closer and mid-ripening stages.
During the stages of berry growth, veraison and mid-ripening, the Vermentino canopies lost, on sunny days, about 6.6, 3.3 and 4.6 L H2O plant−1 by transpiration, while the Cannonau plants transpired smaller volumes of water (respectively, 5.8, 2.8 and 3.3 L plant−1 day−1) but kept higher water use efficiency during photosynthesis compared to Vermentino (about 0.7 g C/L H2O plant−1 day−1 at the beginning of the irrigation season and reaching +1.3 g C/L H2O, during the stages monitored (Figure 1A). As water deficit increases along the season, the reductions of gs tend to reduce water losses. Yet, transpiration responds also to the increases in leaf-to-air vapor pressure deficit due to reduced stomata aperture, which tends to counterbalance the effects of lower the gs on water loss [63]. For this reason, the lower difference among varieties concerning plant instantaneous water use are mainly explained by differences in carbon assimilation. The results also reflect the marked difference in gs and transpiration between varieties with high and low anisohydric degree [6,62]. Nevertheless, it is important to bear in mind that the higher water use efficiency estimated based on leaf gas exchange measurements may not correspond to whole plant scale water use efficiency, has demonstrated by Medrano et al. [64]. In effect, several factors contribute to the whole plant water use and great discrepancies may be found among the values determined at leaf and whole canopy scales. For instance, the effects of sunlight exposure of the different leaf layers and the rates of transpiration and respiratory losses during the night should not be neglected when analyzing the genetical variability in daily carbon balance and water use efficiency of a woody plant.

3.5. Validation and Accuracy of the Index for Irrigation Automation in Vermentino and Cannonau Vineyards

In both seasons, the patterns of IIN, calculated based on air and canopy temperature, using the thermistor sensors or the IR thermometer, showed an accurate response of the index to the variation of current plant water status estimated with mΨs (Figure 6). As expected, the results indicate that a high representativeness of IIN determined with the IR thermometer requires the analysis of a larger size sample as compared to the measurements with thermistors (Figure 6A,B), as leaf temperature varies across the canopy. In our trials, IR temperature varied about 3.0 °C in near and 2.6 °C in far mode in Vermentino and about 2.4 °C in near and 2.0 °C in far mode in Cannonau. Since, an important component of plant heat exchange is convective heat transfer between the canopy surface and the surrounding atmosphere, as the distance from target leaf or canopy increases, the correspondence among temperature measurements and the actual leaf temperature decreases, due to varying leaf boundary layer conductance, which is affected by changes in vapor pressure deficit, wind speed and atmosphere composition and also by the stomata sensibility to these changes [65]. This should be taken into consideration when determining water and/or heat stress in near-isohydric varieties (Figure 6B–F). For varieties with high anisohydric degree both IIN Tc and IIN IR showed slightly higher sensitivity to different stress conditions as compared to mΨs (Figure 6).
However, the IIN IR proved to be an accurate measurement when keeping a short distance between the instrument and the canopy. Similarly, the determination of canopy temperature using thermistors at close contact with the leaf abaxial side allowed for reducing the variability of the recorded temperatures and showed higher sensitivity in determining different stress status between irrigated and non-irrigated plants in both varieties. This higher accuracy becomes particularly relevant when, other than a moderate water stress, a thermal stress condition takes place, causes by a stricter or longer stomatal closure, as in non-irrigated or scarcely irrigated plants (Figure 6B,D). Compared to the measurement on the adaxial side of the leaf, when the temperature of the canopy is detected at the abaxial leaf side, convective heat losses and thermal variations due to radiation are much smaller, due to a lower heat transfer between the leaf and the surrounding atmosphere. This way, a greater correspondence can be achieved between the thermal condition of the plant as a whole and its water status (Figure 6C).
The IIN also allowed to distinguish the irrigation treatments, even though the differences in irrigation input were very small. This result indicates a high accuracy of this index for the definition of irrigation strategies and that it is useful and applicable to different viticultural regions. A recent work [11] concerning the usefulness of thermal imaging for remote and proximal sensing of vineyard to optimize and manage precision irrigation schedules, conducted in Cabernet Suavignon, Cagnulari and Vermentino, also demonstrated a good accuracy of the thermal indexes CWSI and Ig to represent plant water status and photosynthetic performances.
Furthermore, since the IIN takes into account both the temperature of the canopy and the atmospheric evaporative demand, it can be a valuable tool for proximal sensing under different pedo-climatic situations. The IIN can be used to detect and manage multiple abiotic constrains, namely water and thermal stresses, which may require immediate irrigation, overhead instead of drip irrigation. In fact, water stress detection by thermal imaging is highly influenced by site environmental conditions and atmospheric demand during the measurements and an heat stress effect may result in an increased index value as compared to the effect of vineyard water regime as observed by [11] working in Vermentino di Gallura regions. The IIN showed high accuracy in determining the irrigation requirement, even when plants self-regulating mechanisms tend to reduce the variations of mΨs hence, to distinguish different moderate and severe stress conditions, when soil water deficit and air evaporative demand start and continue to increase. This aspect is particularly evident in varieties with low anisohydric degree, like Cannonau, which stomatal control often tends to quickly reduce transpiration and increase leaf temperature.
The validity of the index for irrigation automation in vineyard was tested and calibrated in relation to mΨs, according to the water potential thresholds previously tested for an optimal irrigation management in Vermentino and Cannonau vineyards [11,20,42]. In Table 3 are reported the main results of the linear regression analysis, including the regression estimates and performances of the two models tested for Vermentino and Cannonau, respectively. The linearity of the relation between IIN and mΨs is evidenced in Figure 6 and was previously demonstrated for water stress indices that are based on normalized leaf to air temperature differences [11,17,66].
Both models were highly significant (regression significance < 0.001) and showed a very good fitting, though the Cannonau model presented lower correlation and determination coefficients (respectively, 0.761 and 0.527) compared to the model for Vermentino (respectively, 0.881 and 0.771). A lower correspondence between the tomographic indexes and plant water potential estimated by mΨs in varieties with low anisohydric degree was also observed by Belfiore et al. [58]. Yet, the regression analysis performed in this work, indicates that the IIN highly significantly represented plant water status in the two varieties (variable p-value < 0.001) and the values of Durbin Watson statistics, for both Vermentino and Cannonau models (2 and close to 2, respectively), indicate that no autocorrelation issues were detected in the samples. Also, the mean absolute percentage error was lower than 10% in IIN model for Vermentino but somewhat higher in Cannonau model. The Nash-Sutcliffe efficiency coefficients indicate good agreement of the observed versus predicted values and MAE, MA%E and RMSE show a good fit of the residuals of the regression analysis to the 1:1 line. It is important to highlight that a weaker relation among mΨs and IIN variations during the last ripening stages and after harvest depend mostly upon the decreasing water conductance of the stems, that progressively increase the lignification process that lead vines to gradually become cold hardy and acclimated to the upcoming cold weather. At this stages, mΨs measurement in leaves become less responsive to actual vineyard water requirements, since mature internodes have reduced hydraulic conductance as compared to green shoots [52,67]. In mature stems, extensive reductions in hydraulic conductance lead to decoupling of water transport capacity from and to the leaves, leading to cavitation and low water conductance [68]. The important role of hydraulic conductance on stomata regulation and water use efficiency, especially in the Grenache family of varieties, in which Cannonau is included, has been demonstrated previously [69]. Besides this, the lower Ens and R2 values of the Cannonau model are most probably related to a stricter control of plant water content, typical of this variety under reduced soil water availability and high evaporative demand, hence to a lower sensibility of plant water potential to variations in air vapor pressure deficit, rather than to a lower accuracy of IIN. Indeed, as shown previously, IIN demonstrated very high sensibility to both water and heat stresses, particularly when the Cannonau plants were exposed to longer soil water deficit. In such condition, mΨs tended to a higher stability, as the evaporative demand increased. Yet, for semiarid and arid environments both abiotic factors may affect net assimilation and respiration simultaneously, and for a quite long period, during berry growth and developmental stages, limiting leaf and fruit metabolism [70]. Therefore, when the aim of irrigation is to contrast the impact of such multiple stress conditions affecting crop performances, the use of a temperature-based indicator such as IIN thresholds would provide higher guarantee of good physiological performances, yield and berry quality levels for a specific terroir-variety combination. This can be particularly useful for maintaining or improving yield and berry composition of cultivars with elevated sensibility to water and heat stress, as Cannonau [71,72]. The wide range of conditions in which midday mΨs and IIN were tested allowed to validate both methodologies for quality irrigation proposes in varieties with low and high degree of anisohydric behavior, respectively Cannonau and Vermentino, and to define specific thresholds for mild, moderate and severe stresses for the two indicators (Figure 7). The scatter plot of the two variables in Figure 7, highlights the similarity of the relationship among them for both cultivars. Consistently with the relationships previously described when analyzing gs, Pn and mΨs, specific thresholds were established for Vermentino and Cannonau IIN values, ranging from: 0–0.25; 0.30–0.45; and 0.6–0.75, respectively, for physiological performances characterizing a mild, moderate and severe stress conditions, as indicated by the blue, green and red lines (Figure 7). As demonstrated previously by Grant et al. [17] for similar thermal indexes, the IIN can be a useful tool to distinguish different stress conditions and to evaluate stress levels according to the deficit irrigation strategies.

4. Conclusions

In this study we tested and validated the mΨs thresholds and the accuracy of an irrigation need index (IIN) for proximal detection of water requirements to optimized irrigation management in vineyards, for a wide set of pedo-climatic conditions, in two varieties with different degrees of anisohydric behavior. Maximum and minimum photosynthetic performances monitoring allowed to determine the plant water status ranges among which optimal, critical or maximized canopy photosynthetic performances and irrigation water saving can be reached, in order to manage the use of irrigation to meet high yield and quality in different wine grape productions. For the pedo-climatic conditions of the studied wine regions, severe water stress thresholds were −1.3 MPa for Vermentino and −1.25 MPa for Cannonau. To these critical water deficit thresholds correspond an average stomatal conductance of 50 mmol m−2 s−1 and an average photosynthetic assimilation of only 4 μmol m−2 s−1, in both varieties. Under moderate water deficit, mΨs can vary close to −1.0 MPa in Vermentino and to −1.1 MPa in Cannonau, in order to reach optimal leaf gas exchange performances (about 7.5 μmol m−2 s−1 of Pn and 200 mmol m−2 s−1 of gs). When keeping mild water deficit conditions, mΨs should be −0.7 MPa in Cannonau and should not be higher than −0.8 MPa in Vermentino, to allow maximum photosynthetic performances (respectively, Pn of about 11.5 and 11.0 μmol m−2 s−1), while avoiding excessive water losses by transpiration (when gs > 200 mmol m−2 s−1), particularly in the variety with high anisohydric degree. Based on air temperature, air humidity and canopy temperature data, easily available at relatively low cost, a simple and automatable agrometeorological index for the irrigation management of the vineyard was established. The methodology used in this study evidenced the high performance and sensitivity of the index in properly determining the need for irrigation, as well as in identifying and representing varietal differences in irrigation requirements, under variable meteorological and environmental contexts throughout the irrigation seasons. In fact, the seasonal trends of IIN correctly reflect the pattern of plant water status, particularly, when conditions of moderate to severe water stress are imposed.
The correlation analysis between the observed mΨs data and the calculated IIN data highlighted great temporal and spatial accuracy of this index in representing vineyard water status under mild, moderate and severe water deficit. The significance of the IIN model on estimating plant water status was very high for both varieties. The linearity of the correlation pattern between mΨs and IIN indicates the adequacy of the index in determining multiple abiotic stress conditions (water and heat) under a wide range of soil water availability.
The methodology followed for canopy temperature data collection, using thermistors, ensured high accuracy to the calculation of IIN and to account for the meteorological conditions at each site. Finally, it is also possible to use IR thermometers to monitor the thermal conditions of the canopy, and therefore calculate the IIN. The accuracy of canopy temperature measurement with IR thermography can be increased by means of proximal detection, in order to reduce the influence of the factors (i.e., wind, humidity, sunlight and shade) that affect the temperature of the canopy boundary layer. To perform a high quality and water saving irrigation management, the IIN thresholds characterizing critical, optimal and maximum mΨs levels and related photosynthetic efficiency in Vermentino and Cannonau are, respectively: 0.75 and 0.6; 0.45 and 0.3; 0.25 and 0.

Author Contributions

Conceptualization, A.F.d.O., M.G.M., and D.S.; Data curation, A.F.d.O., M.G.M., M.L.C. and D.S.; Formal analysis, A.F.d.O. and M.G.M.; Investigation, A.F.d.O., M.G.M. and D.S.; Methodology, A.F.d.O., M.G.M., M.L.C., C.S. and D.S.; Software, A.F.d.O., M.G.M. and M.L.C.; Data and statistical analysis, A.F.d.O. and M.G.M.; Supervision, D.S. and M.G.M.; Writing—original draft preparation, A.F.d.O.; Writing—review & editing, A.F.d.O., M.G.M., M.L.C., C.S. and D.S. All authors have read and agreed to the published version of the manuscript.

Funding

This research was funded by Regione Autonoma della Sardegna, Sardegna Ricerche Project GA-VINO Metodi e tecnologie per una gestione innovativa e sostenibile della risorsa idrica nel vigneto)—POR FESR SARDEGNA 2014–2020 Asse prioritario 1 “Ricerca scientifica, Sviluppo tecnologico e Innovazione. Azione 1.1.4. Progetto Cluster Top Down.

Data Availability Statement

The data presented in this study are available from the corresponding author on reasonable request.

Acknowledgments

The authors thank the enterprises and wineries involved in the project and particularly the farm Cuccaru of the winery Viticoltori della Romangia Soc. Coop., the wineries SURRAU SRL—Società Agricola, and Azienda Vitivinicola Ferruccio Deiana. We also thank Filippo Rossi for device technical assistance, Giandomenico Scanu and Gianfranco Becugna for support in data collection.

Conflicts of Interest

The authors declare no conflict of interest.

Appendix A

Table A1. Soil physical and chemical analysis and hydraulic constants.
SiteCVTextureρ
(g cm−3)
pHO.M.
(%)
CaCO3
(%)
CEC
(cmol kg−1)
Salinity
(dS m−1)
FC
(g 100 g−1)
WP
(g 100 g−1)
AW
(mm m−1)
RomangiaVMTClay loam1.28.61.14278.50.1634.2816.54213.29
CNNClay loam1.218.61.64016.10.0533.8116.28211.49
GalluraVMTSandy loam1.476.83.9-27.40.1212.555.55102.94
CNNSandy loam1.476.11.8-16.10.0512.355.46101.6
ParteollaVMTClay loam1.38.41.317.223.70.0926.3412.57179.54
CNNClay loam1.38.51.426.326.10.1126.7812.76181.73
CV—cultivar, VMT—Vermentino; CNN—Cannonau; ρ—bulk density; O.M.—organic matter; CaCO3—total calcareous; CEC—cation exchange capacity; FC—field capacity; WP—wilting point; AW—available water.
Figure A1. Daily transpiration volume per plant and transpiration rate over a sunny day at BBCH stages 71 (A), 83 (B) and 85 (C) in Vermentino (left) and Cannonau (right), at the Romangia site, during season 2019. Values are the mean ± standard error.
Agronomy 11 00323 g0a1

References

  1. Schultz, H.R. Issues to be considered for strategic adaptation to climate evolution—Is atmospheric evaporative demand changing? OENO One 2017, 51, 107–114. [Google Scholar] [CrossRef]
  2. Mosedale, J.R.; Wilson, R.J.; Maclean, I.M.D. Climate change and crop exposure to adverse weather: Changes to frost risk and grapevine flowering conditions. PLoS ONE 2015, 10, e0141218. [Google Scholar] [CrossRef] [Green Version]
  3. Nicholas, K.A. Will we still enjoy Pinot noir? Sci. Am. 2015, 312, 60–67. [Google Scholar] [CrossRef] [PubMed]
  4. Jones, H.G.; Grant, O. Remote sensing and other imaging technologies to monitor grapevine performance. In Grapevine under Environmental Stress: From Ecophysiology to Molecular Mechanisms; Gerós, H., Chaves, M.M., Medrano, H., Delrot, S., Eds.; Wiley-Blackwell: Hoboken, NJ, USA, 2015; pp. 179–201. [Google Scholar] [CrossRef]
  5. Douthe, C.; Medrano, H.; Tortosa, I.; Escalona, J.M.; Hernández-Montes, E.; Pou, A. Whole-plant water use in field grown grapevine: Seasonal and environmental effects on water and carbon balance. Front. Plant Sci. 2018, 1540. [Google Scholar] [CrossRef]
  6. Medrano, H.; Tomás, M.; Martorell, S.; Escalona, J.M.; Pou, A.; Fuentes, S.; Flexas, J.; Bota, J. Improving water use efficiency of vineyards in semi-arid regions. A review. Agron. Sustain. Dev. 2015, 35, 499–517. [Google Scholar] [CrossRef] [Green Version]
  7. Mozell, M.R.; Thach, L. The impact of climate change on the global wine industry: Challenges & solutions. J. Wine Econ. 2014, 3, 81–89. [Google Scholar] [CrossRef] [Green Version]
  8. Costa, J.M.; Grant, O.M.; Chaves, M.M. Thermography to explore plant–environment interactions. J. Exp. Bot. 2013, 64, 3937–3949. [Google Scholar] [CrossRef]
  9. Pou, A.; Diago, M.P.; Medrano, H.; Baluja, J.; Tardaguila, J. Validation of thermal indices for water status identification in grapevine. Agric. Water Manag. 2014, 134, 60–72. [Google Scholar] [CrossRef]
  10. Zarrouk, O.; Costa, M.; Francisco, R.; Lopes, C.; Chaves, M.M. Drought and water management in Mediterranean vineyards. In Grapevine under Environmental Stress: From Ecophysiology to Molecular Mechanisms; Gerós, H., Chaves, M.M., Medrano, H., Delrot, S., Eds.; Wiley-Blackwell: Hoboken, NJ, USA, 2015; pp. 38–67. [Google Scholar] [CrossRef]
  11. Matese, A.; Baraldi, R.; Berton, A.; Cesaraccio, C.; Di Gennaro, S.; & Duce, P.; Facini, O.; Mameli, M.; Piga, A.; Zaldei, A. Estimation of water stress in grapevines using proximal and remote sensing methods. Remote Sens. 2018, 10, 114. [Google Scholar] [CrossRef] [Green Version]
  12. van Leeuwen, C.; Destrac, A. Modified grape composition under climate change conditions requires adaptations in the vineyard. OENO One 2017, 51, 147–154. [Google Scholar] [CrossRef]
  13. Costa, J.M.; Egipto, R.; Sánchez-Virosta, A.; Lopes, C.M.; Chaves, M.M. Canopy and soil thermal patterns to support water and heat stress management in vineyards. Agric. Water Manag. 2019, 216, 484–496. [Google Scholar] [CrossRef]
  14. Jones, H.G. Use of infrared thermometry for estimation of stomatal conductance in irrigation scheduling. Agr. For. Meteorol. 1999, 95, 139–149. [Google Scholar] [CrossRef]
  15. Jones, H.; Stoll, M.; Santos, T.; Souza, C.; Chaves, M.M.; Grant, O. Use of infrared thermography for monitoring stomatal closure in the field: Application to grapevine. J. Exp. Bot. 2002, 378, 2249–2260. [Google Scholar] [CrossRef]
  16. Loveys, B.R.; Jones, H.G.; Theobald, J.C.; McCarthy, M.-G. An assessment of plant-based measures of grapevine performance as irrigation scheduling tools. Acta Hortic. 2008, 792, 421–427. [Google Scholar] [CrossRef]
  17. Grant, O.M.; Tronina, L.; Jones, H.G.; Chaves, M.M. Exploring thermal imaging variables for the detection of stress responses in grapevine under different irrigation regimes. J. Exp. Bot. 2007, 58, 815–825. [Google Scholar] [CrossRef] [PubMed]
  18. Nicholas, K.; Durham, W. Farm-scale adaptation and vulnerability to environmental stresses: Insights from winegrowing in Northern California. Glob. Environ. Chang. 2012, 22, 483–494. [Google Scholar] [CrossRef]
  19. Costa, J.M.; Marques da Silva, J.; Pinheiro, C.; Barón, M.; Mylona, P.; Centritto, M.; Haworth, M.; Loreto, F.; Uzilday, B.; Turkan, I.; et al. Opportunities and limitations of crop phenotyping in Southern European countries. Front. Plant Sci. 2019, 10, 1125. [Google Scholar] [CrossRef] [PubMed] [Green Version]
  20. Ojeda, H. Irrigation qualitative de précision de la vigne. PAV 2007, 7, 133–141. [Google Scholar]
  21. Schultz, H.R. Differences in hydraulic architecture account for near-isohydric and anisohydric behaviour of two field-grown Vitis vinifera L. cultivars during drought. Plant Cell Environ. 2003, 26, 1393–1405. [Google Scholar] [CrossRef]
  22. Jones, G.V. Climate change: Observations, projections and general implications for viticulture and wine production. In Work Paper No 7, Economics Department Whitman College; Essick, E., Griffin, P., Keefer, B., Miller, S., Storchmann, K., Eds.; Whitman College: Walla Walla, DC, USA, 2007; pp. 1–15. [Google Scholar]
  23. Chaves, M.M.; Zarrouk, O.; Francisco, R.; Costa, M.; Santos, T.; Regalado, A.; Rodrigues, M.; Lopes, C. Grapevine under deficit irrigation: Hints from physiological and molecular data. Ann. Bot. 2010, 105, 661–676. [Google Scholar] [CrossRef] [Green Version]
  24. Lovisolo, C.; Lavoie-Lamoureux, A.; Tramontini, S.; Ferrandino, A. Grapevine adaptations to water stress: New perspectives about soil/plant interactions. Theor. Exp. Plant Physiol. 2016, 28, 53–66. [Google Scholar] [CrossRef]
  25. Duchêne, E. How can grapevine genetics contribute to the adaptation to climate change? OENO One 2016, 50, 113–124. [Google Scholar] [CrossRef] [Green Version]
  26. IPCC. Global warming of 1.5 °C. In An IPCC Special Report on the Impacts of Global Warming of 1.5 °C above Pre-Industrial Levels and Related Global Greenhouse Gas Emission Pathways, in the Context of Strengthening the Global Response to the Threat of Climate Change, Sustainable development, and Efforts to Eradicate Poverty; Masson-Delmotte, V., Zhai, P., Pörtner, H.O., Roberts, D., Skea, J., Shukla, P.R., Pirani, A., Moufouma-Okia, W., Péan, C., Pidcock, R., et al., Eds.; World Meteorological Organization: Geneva, Switzerland, 2018; p. 616. [Google Scholar]
  27. Martínez de Toda, F.; Ramos, M.C. Variability in grape composition and phenology of Tempranillo variety in zones located at different elevations and with differences in the climatic conditions. Vitis 2019, 58, 131–139. [Google Scholar] [CrossRef]
  28. Gambetta, G.A.; Herrera, J.C.; Dayer, S.; Feng, Q.; Hochberg, U.; Castellarin, S.D. The physiology of drought stress in grapevine: Towards an integrative definition of drought tolerance. J. Exp. Bot. 2020, 71, 4658–4676. [Google Scholar] [CrossRef]
  29. Florez-Sarasa, I.; Clemente-Moreno, M.J.; Cifre, J.; Capó, M.; Llompart, M.; Fernie, A.R.; Bota, J. Differences in Metabolic and Physiological Responses between Local and Widespread Grapevine Cultivars under Water Deficit Stress. Agronomy 2020, 10, 1052. [Google Scholar] [CrossRef]
  30. Gerzon, E.; Biton, I.; Yaniv, Y.; Zemach, H.; Netzer, Y.; Schwartz, A.; Fait, A.; Ben-Ari, G. Grapevine anatomy as a possible determinant of isohydric or anisohydric behavior. Am. J. Enol. Vitic. 2015, 66, 340–347. [Google Scholar] [CrossRef]
  31. Tombesi, S.; Poni, S.; Palliotti, A. Stress idrico in Vitis vinifera: Variabilità delle risposte fisiologiche intraspecifiche e loro potenziale sfruttamento nella mitigazione degli effetti dei cambiamenti climatici. Italus Hortus 2016, 23, 45–53. [Google Scholar]
  32. Hochberg, U.; Degu, A.; Fait, A.; Rachmilevitch, S. Near isohydric grapevine cultivar displays higher photosynthetic efficiency and photorespiration rates under drought stress as compared with near anisohydric grapevine cultivar. Physiol. Plant. 2013, 147, 443–452. [Google Scholar] [CrossRef] [PubMed]
  33. Poni, S.; Bernizzoni, F.; Civardi, S. Response of “Sangiovese” grapevines to partial root-zone drying: Gas-exchange, growth and grape composition. Sci. Hortic. 2007, 114, 96–103. [Google Scholar] [CrossRef]
  34. Soar, C.J.; Speirs, J.; Maffei, S.M.; Penrose, A.B.; Mccarthy, M.G.; Loveys, B.R. Grapevine varieties Shiraz and Grenache differ in their stomatal response to VPD: Apparent links with ABA physiology and gene expression in leaf tissue. Aust. J. Grape Wine Res. 2006, 12, 2–12. [Google Scholar] [CrossRef]
  35. Vandeleur, R.K.; Mayo, G.; Shelden, M.C.; Gilliham, M.; Kaiser, B.N.; Tyerman, S.D. The role of plasma membrane intrinsic protein aquaporins in water transport through roots: Diurnal and drought stress responses reveal different strategies between isohydric and anisohydric cultivars of grapevine. Plant Physiol. 2009, 149, 445–460. [Google Scholar] [CrossRef] [Green Version]
  36. Tombesi, S.; Nardini, A.; Frioni, T.; Soccolini, M.; Zadra, C.; Farinelli, D.; Poni, S.; Palliotti, A. Stomatal closure is induced by hydraulic signals and maintained by ABA in drought-stressed grapevine. Sci. Rep. 2015, 5, 12449. [Google Scholar] [CrossRef] [PubMed]
  37. Hochberg, U.; Rockwell, F.E.; Holbrook, N.M.; Cochard, H. Iso/anisohydry: A plant-environment interaction rather than a simple hydraulic trait. Trends Plant Sci. 2018, 23, 112–120. [Google Scholar] [CrossRef] [PubMed]
  38. Ollat, N.; Cookson, S.J.; Destrac-Irvine, A.; Lauvergeat, V.; Ouaked-Lecourieux, F.; Marguerit, E.; Barrieu, F.; Dai, Z.; Duchêne, E.; Gambetta, G.A.; et al. Grapevine adaptation to abiotic stress: An overview. Acta Hortic. 2019, 1248, 497–512. [Google Scholar] [CrossRef]
  39. Medrano, H.; Tortosa, I.; Montes, E.; Pou, A.; Balda, P.; Bota, J.; Escalona, J.M. Genetic improvement of grapevine (Vitis vinifera L.) water use efficiency. In Water Scarcity and Sustainable Agriculture in Semiarid Environment: Tools, Strategies, and Challenges for Woody Crops; Tejero, I.F.C., Zuazo, V.H.D., Eds.; Academic Press: London, UK; San Diego, CA, USA; Cambridge, UK; Kidlington, UK, 2018; pp. 377–401. [Google Scholar] [CrossRef]
  40. Tramontini, S.; Döring, J.; Vitali, M.; Ferrandino, A.; Stoll, M.; Lovisolo, C. Soil water-holding capacity mediates hydraulic and hormonal signals of near-isohydric and near-anisohydric Vitis cultivars in potted grapevines. Funct. Plant Biol. 2014, 41, 1119–1128. [Google Scholar] [CrossRef]
  41. Fernandes de Oliveira, A.; Mameli, M.G.; De Pau, L.; Satta, D.; Nieddu, G. Deficit irrigation strategies in Vitis vinifera L. cv. Cannonau under Mediterranean climate. Part I—Physiological responses, growth-yield balance and berry composition. S. Afr. J. Enol. Vitic. 2013, 34, 170–183. [Google Scholar] [CrossRef] [Green Version]
  42. Fernandes de Oliveira, A.; Mercenaro, L.; Azzena, M.; Nieddu, G. Effects of pre and post-veraison water deficit on Vermentino cluster microclimate and berry composition. In BIO Web of Conferences; EDP Sciences: Ulis, France, 2019; Volume 13, p. 04015. [Google Scholar] [CrossRef]
  43. Alsina, M.M.; Smart, D.R.; Bauerle, T.; de Herralde, F.; Biel, C.; Stockert, C.; Negron, C.; Save, R. Seasonal changes of whole root system conductance by a drought-tolerant grape root system. J. Exp. Bot. 2011, 62, 99–109. [Google Scholar] [CrossRef] [Green Version]
  44. Intrigliolo, D.S.; Castel, J.R. Evaluation of grapevine water status from trunk diameter variations. Irrig. Sci. 2007, 26, 49–59. [Google Scholar] [CrossRef] [Green Version]
  45. Lovisolo, C.; Perrone, I.; Carra, A.; Ferrandino, A.; Flexas, J.; Medrano, H.; Schubert, A. Drought-induced changes in development and function of grapevine (Vitis spp.) organs and in their hydraulic and non-hydraulic interactions at the whole-plant level: A physiological and molecular update. Funct. Plant. Biol. 2010, 37, 98–116. [Google Scholar] [CrossRef]
  46. Santos, J.A.; Fraga, H.; Malheiro, A.C.; Moutinho-Pereira, J.; Dinis, L.-T.; Correia, C.; Moriondo, M.; Leolini, L.; Dibari, C.; Costafreda-Aumedes, S.; et al. A review of the potential climate change impacts and adaptation options for European viticulture. Appl. Sci. 2020, 10, 3092. [Google Scholar] [CrossRef]
  47. Choné, X.; Van Leeuwen, C.; Dubourdieu, D.; Gaudillères, J.-P. Stem water potential is a sensitive indicator of grapevine water status. Ann. Bot. 2001, 87, 477–483. [Google Scholar] [CrossRef] [Green Version]
  48. Myburgh, P.A. Responses of Vitis vinifera L. cv. Merlot to low frequency deficit irrigation and partial root zone drying in western Cape Coast region—Part, I. Soil and plant water status. S. Afr. J. Enol. Vitic. 2011, 32, 89–103. [Google Scholar] [CrossRef] [Green Version]
  49. Acevedo-Opazo, C.; Ortega-Farias, S.; Fuentes, S. Effects of grapevine (Vitis vinifera L.) water status on water consumption, vegetative growth and grape quality: An irrigation scheduling application to achieve regulated deficit irrigation. Agric. Water Manag. 2010, 97, 956–964. [Google Scholar] [CrossRef]
  50. Cola, G.; Failla, O.; Maghradze, D.; Meghrelidze, L.; Mariani, L. Grapevine phenology and climate change in Georgia. Int. J. Biometeorol. 2017, 61, 761–773. [Google Scholar] [CrossRef] [PubMed]
  51. Mariani, L.; Alilla, R.; Cola, G.; Dal Monte, G.; Epifani, C.; Puppi, G.; Failla, O. IPHEN—A real-time network for phenological monitoring and modelling in Italy. Int. J. Biometeorol. 2013, 57, 881–893. [Google Scholar] [CrossRef] [PubMed]
  52. Simonneau, T.; Lebon, E.; Coupel-Ledru, A.; Marguerit, E.; Rossdeutsch, L.; Ollat, N. Adapting plant material to face water stress in vineyards: Which physiological targets for an optimal control of plant water status? OENO One 2017, 51, 167–179. [Google Scholar] [CrossRef]
  53. Jones, H.G. Irrigation scheduling: Advantages and pitfalls of plant-based methods. J. Exp. Bot. 2004, 55, 2427–2436. [Google Scholar] [CrossRef] [Green Version]
  54. Allen, R.G.; Pereira, L.S.; Raes, D.; Smith, M. Crop evapotranspiration—guidelines for computing crop water requirements. In FAO Irrigation and Drainage Paper 56; Food and Agriculture Organization: Rome, Italy, 1998. [Google Scholar]
  55. Idso, S.B.; Jackson, R.D.; Pinter, P.J.; Reginato, R.J.; Hatfield, J.L. Normalizing the stress degree day parameter for environmental variability. Agric. Meteorol. 1981, 24, 45–55. [Google Scholar] [CrossRef]
  56. Maes, W.H.; Steppe, K. Estimating evapotranspiration and drought stress with ground-based thermal remote sensing in agriculture: A review. J. Exp. Bot. 2012, 63, 4671–4712. [Google Scholar] [CrossRef] [Green Version]
  57. Stull, R. Wet-Bulb temperature from relative humidity and air temperature. J. Appl. Meteorol. Climatol. 2011, 50, 2267–2269. [Google Scholar] [CrossRef] [Green Version]
  58. ARPAS. Riepilogo Mensile Meteorologico e Agrometeorologico. Aprile-Ottobre 2019. Agenzia Regionale per la Protezione Dell’ambiente Della Sardegna Dipartimento Meteoclimatico. Available online: http://www.sar.sardegna.it/pubblicazioni/riepiloghimensili/mensili.asp (accessed on 1 October 2020).
  59. ARPAS. Riepilogo Mensile Meteorologico e Agrometeorologico. Aprile-Ottobre 2020. Agenzia Regionale per la Protezione Dell’ambiente Della Sardegna Dipartimento Meteoclimatico. Available online: http://www.sar.sardegna.it/pubblicazioni/riepiloghimensili/mensili.asp (accessed on 1 October 2020).
  60. Belfiore, N.; Vinti, R.; Lovat, L.; Chitarra, W.; Tomasi, D.; de Bei, R.; Meggio, F.; Gaiotti, F. Infrared thermography to estimate vine water status: Optimizing canopy measurements and thermal indices for the varieties Merlot and Moscato in northern Italy. Agronomy 2019, 9, 821. [Google Scholar] [CrossRef] [Green Version]
  61. Alsina, M.M.; Herralde, F.D.; Aranda, X.; Savé, R.; Biel, C. Water relations and vulnerability to embolism are not related: Experiments with eight grapevine cultivars. Vitis 2007, 46, 1–6. [Google Scholar] [CrossRef]
  62. Fernandes de Oliveira, A.; Rais, F.; Dettori, I.; Azzena, M.; Nieddu, G. UV light acclimation capacity of leaf photosynthetic and photochemical behaviour in near-isohydric and anisohydric grapevines in hot and dry environments. S. Afr. J. Enol. Vitic. 2019, 40, 188–205. [Google Scholar] [CrossRef] [Green Version]
  63. Medrano, H.; Pou, A.; Tomás, M.; Martorell, S.; Gulias, J.; Flexas, J.; Escalona, J.M. Average daily light interception determines leaf water use efficiency among different canopy locations in grapevine. Agric. Water Manag. 2012, 114, 4–10. [Google Scholar] [CrossRef] [Green Version]
  64. Medrano, H.; Magdalena, T.; Martorell, S.; Flexas, J.; Hernández, E.; Rosselló, J.; Pou, A.; Escalona, J.M.; Bota, J. From leaf to whole-plant water use efficiency (WUE) in complex canopies: Limitations of leaf WUE as a selection target. Crop J. 2015, 3, 220–228. [Google Scholar] [CrossRef] [Green Version]
  65. Albrecht, H.; Fiorani, F.; Pieruschka, R.; Müller-Linow, M.; Jedmowski, C.; Schreiber, L.; Schurr, U.; Rascher, U. Quantitative estimation of leaf heat transfer coefficients by active thermography at varying boundary layer conditions. Front. Plant Sci. 2020, 10, 1684. [Google Scholar] [CrossRef] [Green Version]
  66. Poblete-Echeverría, C.; Espinace, D.; Sepúlveda-Reyes, D.; Zúñiga, M.; Sanchez, M. Analysis of crop water stress index (CWSI) for estimating stem water potential in grapevines: Comparison between natural reference and baseline approaches. Acta Hortic. 2017, 1150, 189–193. [Google Scholar] [CrossRef]
  67. Hochberg, U.; Bonel, A.G.; David-Schwartz, R.; Degu, A.; Fait, A.; Cochard, H.; Peterlunger, E.; Herrera, J.C. Grapevine acclimation to water deficit: The adjustment of stomatal and hydraulic conductance differs from petiole embolism vulnerability. Planta 2017, 245, 1091–1104. [Google Scholar] [CrossRef] [PubMed]
  68. Schultz, H.R.; Matthews, M.A. Xylem development and hydraulic conductance in sun and shade shoots of grapevine (Vitis vinifera L.): Evidence that low light uncouples water transport capacity from leaf area. Planta 1993, 190, 393–406. [Google Scholar] [CrossRef]
  69. Martorell, S.; Medrano, H.; Tomàs, M.; Escalona, J.M.; Flexas, J.; Diaz-Espejo, A. Plasticity of vulnerability to leaf hydraulic dysfunction during acclimation to drought in grapevines: An osmotic-mediated process. Physiol. Plant. 2015, 153, 381–391. [Google Scholar] [CrossRef] [PubMed] [Green Version]
  70. Bernardo, S.; Dinis, L.T.; Machado, N.; Moutinho Pereira, J. Grapevine abiotic stress assessment and search for sustainable adaptation strategies in Mediterranean-like climates. A review. Agron. Sustain. Dev. 2018, 38, 66. [Google Scholar] [CrossRef] [Green Version]
  71. Fernandes de Oliveira, A.; Nieddu, G. Deficit irrigation strategies in Vitis vinifera L. cv. Cannonau under Mediterranean climate. Part II—Cluster microclimate and anthocyanin accumulation patterns. S. Afr. J. Enol. Vitic. 2013, 34, 184–195. [Google Scholar] [CrossRef]
  72. Fernandes de Oliveira, A.; Mercenaro, L.; Nieddu, G. Assessing thermal efficiency for berry anthocyanin accumulation in four different sites and field-growing conditions. Acta Hortic. 2017, 1188, 181–188. [Google Scholar] [CrossRef]
Figure 1. Weekly pattern of midday stem water potential (mean values ± standard error and daily water supplies from precipitation and irrigation, from BBCH stage 75 until 89, in the re-watered (WW) and un-watered (UW) Vermentino and Cannonau vineyards of the Romangia site, during 2019 (A); and in the re-watered vineyards (WW) of the Gallura site in 2020 (B). The histograms represent water supplies and the lines represent mΨs.
Agronomy 11 00323 g001
Figure 2. Correlations between observed midday net assimilation rate and stomatal conductance in Vermentino (green dashed line) and Cannonau (red solid line) leaves (A); and between leaf stomatal conductance and intrinsic water use efficiency (B), in the 3 sites.
Agronomy 11 00323 g002
Figure 3. Correlations between (A) average stem water potential and stomatal conductance and between (B) average photosynthetic assimilation and stomatal conductance at midday in Vermentino (dashed line) and in Cannonau (solid line), in the 3 sites and related ranges for mild (blue lines), moderate (green lines) and severe (red lines) water stress conditions. For Vermentino and Cannonau the mΨs thresholds for target Pn and gs performances are respectively: maximum 11.0, 670, −0.8/11.5, 670, −0.7; medium 7.5, 200, −1.1/7.5, 200, −1.0; minimum 4, 50, −1.25/4, 50, −1.3; luxury water consumption above: −0.7, 12 and 700.
Agronomy 11 00323 g003
Figure 4. Daily maximum and minimum assimilation rates (histograms) and air temperature (red rhombus) at mid-morning and midday respectively, in Vermentino (A) and Cannonau (B), during pea sized berries (BBCH 71), cluster closure (BBCH 80) and mid-ripening (BBCH 85) stages 2019, in each site under clear sky condition. Values are the mean ± standard error.
Agronomy 11 00323 g004
Figure 5. Daily net carbon assimilation per plant and net assimilation rate over a sunny day at BBCH stages 71 (A), 80 (B) 83 (C), and 85 (D) in Vermentino (left) and Cannonau (right), at the Romangia site, during season 2019. Values are the mean ± standard error.
Agronomy 11 00323 g005
Figure 6. Weekly pattern of mΨ and of IIN, in re-watered (WW) and un-watered (UW) treatments, in Vermentino and Cannonau vineyards from Romangia in 2019 (A,B); and Gallura in 2020 (C). IIN calculated on the basis of leaf temperatures estimated by thermistors, IIN Tc (A); and on the basis of canopy temperature measured with IR thermometer, IIN IR (B); Values are mean ± standard error.
Agronomy 11 00323 g006
Figure 7. Linear correlation between the mΨs and IIN values in Vermentino (dashed lines) and Cannonau (solid lines) under different water status (A); pattern of the correlation model between midday stem water potential and IIN and related ranges for mild (blue lines), moderate (green lines) and severe (red lines) water stress conditions (B).
Agronomy 11 00323 g007
Table 1. Midday stem water potential (MPa) thresholds for the irrigation season.
Fruit GrowthFruit Ripening
Flowering/Fruit SetFruit Set/Cluster ClosureBeginning of VeraisonVeraisonMid-Ripening/Harvest
Vermentino (MPa)−0.7−0.9−0.9−1.2−1.4
Cannonau (MPa)−0.7−0.9−1.2−1.2−1.4
BBCH stage65/7071/79808385/89
Table 2. Accumulated thermal time at specific phenological stages (from BBCH 10 until BBCH 95), vineyard water balance variables, yield, irrigation volume and irrigation water productivity for the two growing seasons.
BBCH StagesNHHc (Hours)P (mm)ETo (mm)ETc
(mm Day−1)
SWAV (mm Day−1 CV Irrigation (mm) ETa (mm)
(Ks)
Yield
(t ha1)
IWP (g L−1)
S1 S2 S1 S2 S1 S2 S1 S2 S1 S2 S1 S2 S1 S2 S1 S2 S1 S2
Romangia
10–656298781211092632243.22.87.58.0 VMT 24 9 354 (6.4)233 (3.7) 9.3 14.0 38.9 155.6
70–80143316244122761774.83.10.00.1
81–83224423672002631704.73.00.00.0 CNN 21.6 9 356 (5.7)233 (3.7) 8.5 9.0 39.3 100
85–8930543100131011861172.91.80.08.0
90–9535423447806495531.50.917.051.8
Gallura
10–656358431221852632943.23.65.740.0 VMT 60 70 318 (15.9)328 (17.6) 4.0 8.1 6.7 11.6
70–80131015740142762854.85.00.00.0
81–83201022322402632834.75.10.10.0 CNN 30 31 348 (7.9)367 (7.8) 5.2 7.1 17.3 22.9
85–89277529411221221861992.93.15.28.3
90–953263330453595911.51.56.913.4
Parteolla
10–65652859871912612743.23.42.831.2 VMT 6060292 (17.2)279 (17.7)6.414.810.624.7
70–80140715680182552394.54.20.00.1
81–8320802259042422464.34.40.00.0 CNN 6060292 (17.2)279 (17.7)5.110.68.517.7
85–89281929571501011621682.52.614.28.0
90–9533173317532079731.31.238.45.9
HHc—accumulated normal heat hours, P—precipitation, ETo—potential evapotranspiration, ETc—daily average cultural evapotranspiration, SWAV—daily average soil water availability variation, ETa—actual evapotranspiration, Ks—stress coefficient, IWP—irrigation water productivity; S1—season 1, S2—season 2, CV—cultivar, VMT—Vermentino; CNN—Cannonau.
Table 3. Validation of the linear regression model (mΨs = α + ß × IIN) between midday stem water potential (mΨs) and the irrigation need index (IIN) in vineyard.
Descriptive Statistics
df1df2 Regression Significance R R2 Adj. R2
Vermentino129 0 0.881 0.777 0.769
Cannonau12900.7260.5270.511
Model Performances
Predictors Unstandardized Coefficients Variables Sig. Durbin WatsonMAEMA%ERMSEENS
α ß Std. Error
VermentinoIntercept −0.757 0.038 0.000 2.0030.1−9.650.140.78
IIN 0.7250.0000.000
CannonauIntercept−0.831 0.0420.0001.8930.13−13.680.170.53
IIN 0.4570.080.000
df—degrees of freedom; MAE—mean absolute error; MA%E—mean absolute percentage error; RMSE—Root Mean Square Error; ENS—Nash Sutcliffe model efficiency coefficient.
Publisher’s Note: MDPI stays neutral with regard to jurisdictional claims in published maps and institutional affiliations.

