Abstract
Biofilters are an effective air pollution control technology to break down gaseous contaminants and produce innocuous end products. This laboratory study aimed to evaluate a biofilter media, mainly composed by tomato waste, as packing material to reduce NH3, N2O, CO2 and CH4 losses from stored pig slurry. Three mixtures of packing materials, with and without oxalic acid, were arranged in treatments, namely: mixture of tomato waste, pine bark and agricultural compost; mixture of tomato waste and rice husk; tomato waste only. A control treatment (no biofilter) was also included. The experiments were conducted using a system of laboratory scale biofilters connected to jars filled with pig slurry and under a constant airflow rate. The gas concentrations were measured for 14 days and the physicochemical of the packing materials were assessed. Results showed that biofilter media mixtures had a potential for NH3 retention ranging from 51 to 77% and the addition of oxalic acid to these biofilters increased NH3 retention to 72–79%. Additionally, the biofilter media mixtures with and without oxalic acid showed a potential retention for CH4 (29–69%) but not for N2O, yet with no impact on the global warming potential. It can be concluded that tomato based biofilters had the potential to reduce gaseous emissions from slurry.
1. Introduction
Intensive animal production is a significant source of ammonia (NH3), nitrous oxide (N2O), carbon dioxide (CO2) and methane (CH4) emissions, all with important impacts on climate change, acid rain and ozone formation in the troposphere [1,2]. The Integrated Pollution Prevention and Control (IPPC) Directive (96/61/EC) requires the implementation of best available techniques at large livestock production facilities tin order to comply with environmental protection and the National Emissions Ceiling (NEC) Directive (2016/2284), which sets emission reduction commitments for five main air pollutants by 2030, including NH3.
Ammonia comes principally from the urine, which contains most of the volatile N excreted. Ammonium (NH4+) is in equilibrium with the NH3 that will be lost by volatilisation, leading also to CO2 emissions. Nitrous oxide is emitted by the nitrification and denitrification processes [3]. The anaerobic decomposition of organic matter by bacteria and methanogenic Archaea leads to CH4 and CO2 emissions [1]. Carbon dioxide is also produced via aerobic processes. The production and emissions of these gases is influenced by the manure characteristics such as concentration of total ammoniacal N and dry matter content [4].
Biofiltration is recommended as best available technique for the treatment of exhaust air from mechanically ventilated animal houses, with a removal efficiency of about 50% for NH3 [5]. Biofiltration is a biological air pollution control in which gases are treated by passage through a biologically active porous medium [6]. In a biofilter, a contaminated/odorous gas stream passes through a biologically enriched layer of a filter material, followed by biodegradation of the absorbed/adsorbed pollutant. However, N2O might be produced in the biofilter as a by-product from both nitrification and denitrification [7]. The by-products of microbial oxidation are primarily CO2, water, mineral salts, some volatile organic compounds and microbial biomass [8]. Several important variables affect the performance of a biofilter such as optimal microbial environment (nutrients, pH, humidity and temperature), large specific surface area, structural integrity, high humidity retention, high porosity and low bulk density [6,9].
Biofiltration has been regarded as a promising technology for the treatment of exhaust air of livestock production facilities, but information on its effectiveness is scarce [10,11]. Many different media materials have been tested as suitable biofilters. In order to be easily implemented at farm scale, any biofilter must be simple, cheap, robust, as compact as possible and efficient, with quick-response and low-cost maintenance [11]. The media materials for biofilters should be locally available because the construction costs are a major consideration when adapting biofilters to animal housing. The most widely considered media in agriculture are organic materials such as soil, compost, wood chips, peat, bark mulch and mixtures of these [12], but more studies are needed to assess the proper biofilters base mixtures for each region.
The aim of this laboratory study was to evaluate biofilter media, mainly composed by tomato waste as packing material, to reduce NH3 and greenhouse gas (N2O, CO2 and CH4) losses.
2. Materials and Methods
2.1. Biofilter Packing Materials
The tomato waste and rice husk used in the present study were collected from agricultural crops located in central Portugal and the pine bark and agricultural compost were purchased from GEOLIA (Leroy Merlin, Viseu, Portugal). The particles of the wastes were cut by hand to a size <5 mm. The agricultural wastes were sampled and analyzed by standard laboratory methods [13,14,15,16] to assess the following parameters: pH value by EN 13037; dry matter content by gravimetric method (24 h at 105 °C); total carbon by the Dumas method; total nitrogen by the Kjeldahl method by EN 13654-1; NH4+ and NO3− by absorption spectrophotometry; bulk density and porosity by the volumetric method. Briefly, the bulk density was determined from the mass and volume of a circular container, that was filled with a known volume of a waste sample, whereas the porosity was calculated from Equation (1):
where, POR was the porosity (%), Ms was the mass (kg) of the sample 24 h after being saturated with deionised water, Md was the mass (kg) of the sample 24 h after being oven-dried at 105 °C, VOL was the volume of the circular container (m−3). The physical and chemical characteristics of the wastes used as packing materials were summarized in Table 1.

Table 1.
Physicochemical characteristics of the agricultural wastes and pig slurry used in the experiment (n = 15).
The packing materials tested to reduce NH3 gas losses from pig slurry, were mainly composed by tomato waste at a rate that ranged from 75 to 100%, compared in lab-scale biofilters as treatments. The following three mixtures of packing materials, combined with and without oxalic acid at a rate of 4.5%, were arranged in treatments with three replicates, namely: tomato + pine, mixture of tomato waste, pine bark and agricultural compost; tomato + rice, mixture of tomato waste and rice husk; tomato, tomato waste only. For the addition of the acid to the assigned treatments, oxalic acid (2H2O, pure solid formulation, Panreac, Odivelas, Portugal) was dissolved with 25 mL of ethanol 96% and then was carefully sprayed by hand on the biofilter media mixtures. A control treatment (without biofilter media and oxalic acid) was also included, which gives a total of seven treatments considered in this study (Table 2).
Table 2.
Amounts of agricultural wastes and additives added to each biofilter considered as a treatment in the experiment.
2.2. Lab-Scale Biofilter Setup
The experiments were carried out using a system of 12 laboratory scale biofilters (H = 135 mm, Ø = 95 mm, volume = 1.0 L) connected to Kilner jars (H = 230 mm, Ø = 105 mm, volume = 2.0 L) filled with 1.0 L (H = 115 mm) of pig slurry each and under a constant airflow rate (2.5 L min−1) (Figure 1). Ammonia, N2O, CO2 and CH4 concentrations were measured during 14 days after application of constant amounts (100 g) of biofilter media mixtures (Table 2). The temperature was recorded every 600 s by sensors (CS107, Campbell Scientific, Leicestershire, UK) connected to a micrologger (CR3000, Campbell Scientific) and the composition of the pig slurry used in the experiments is described in Table 1.
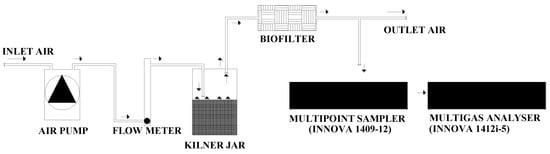
Figure 1.
Layout of the laboratory system used for measuring gas concentrations in the outlet air of each biofilter.
Each Kilner jar had a headspace of 1.0 L between the surface of the slurry and the lid. One air inlet and one air outlet were positioned symmetrically in the jar lid, being inserted a Teflon tube (3 mm internal diameter) through one of the septa and the end kept 20 mm above the slurry surface. The airflow through the headspace of each jar was achieved by a pump (KNF, model N010.KN.18, Neuberger GmbH, Freiburg, Germany), with a 2.5 L min−1 flowrate regulated by a needle valve coupled to a flow meter (AalborgTM FT10201SAVN, Aalborg, Denmark) (Figure 1). The outlet air from the jars passed inside the biofilter media mixtures and finally has been exhausted out of the climatic room by a fume hood (Figure 1).
The concentrations of NH3, N2O, CO2 and CH4 were measured in the exhaust air of the biofilter media mixtures by a photoacoustic multigas monitor (INNOVA 1412i-5, Lumasense Technologies, Ballerup, Denmark) and air samples collected, in sequence (120 s intervals), through one sampling point (Teflon tube with 3 mm internal diameter) per biofilter, by a multipoint sampler (INNOVA 1409-12, Lumasense Technologies, Ballerup, Denmark) provided with PTFE-filters (0.001 mm pore size, Whatman, Tokyo, Japan) (Figure 1). The photoacoustic multigas monitor was equipped with an optical filter for water vapour (filter type SB0527) and the detection limits for NH3 (filter type UA0973), N2O (filter type UA0985), CO2 (filter type UA0982) and CH4 (filter type UA0969) were, respectively, 0.1521, 0.0589, 2.9471 and 0.2864 mg m−3. The photoacoustic multigas monitor was calibrated by the manufacturer before the beginning of the experiment, being operated in a mode that compensates for water interference and cross-interference.
2.3. Data Analysis
The gas concentrations of NH3, N2O, CO2 and CH4 from the exhaust air of the biofilter media mixtures were used to calculate means per hour and day, after discounting the following background coefficients: 0.00266 mg m−3 for NH3, 0.58942 mg m−3 for N2O, 628.71429 mg m−3 for CO2 and 1.07411 mg m−3 for CH4. The gas (NH3, N2O, CO2 or CH4) elimination efficiency (EE, %) of each biofilter media mixture was calculated by comparing the daily mean gas concentrations of the Control (exhaust sample without biofilter) and biofilter treatments (exhaust sample of each biofilter evaluated) [17]. The overall EE (%) of NH3, N2O, CO2 and CH4 was determined from Equation (2):
where, Cl,i was the i-th daily mean gas concentration (NH3, N2O, CO2 or CH4) from the exhaust air of the Control treatment (mg m−3), CE,i was the i-th daily mean gas concentration (NH3, N2O, CO2 or CH4) from the exhaust air of the biofilter treatments (mg m−3), and n was the total data days.
The pollutant elimination capacity (EC, mg m−3 s−1) was the mass (mg m−3) of pollutant (NH3, N2O, CO2 or CH4) reduced by the biofilter media mixtures, expressed per unit volume of the media per unit time [17]. The EC was calculated by Equation (3):
where, Qi was the i-th daily mean treatment airflow rate (m3 s−1), Cl,i was the i-th daily mean gas concentration (NH3, N2O, CO2 or CH4) from the exhaust air of the Control treatment (mg m−3), CE,i was the i-th daily mean gas concentration (NH3, N2O, CO2 or CH4) from the exhaust air of the biofilter treatments (mg m−3), and VB was the filter media volume (m3).
The global warming potential (GWP) for each biofilter media mixture was determined for a time horizon of 100 years, using the GWP coefficients for direct greenhouse gas emissions (265 for N2O, 1 for CO2 and 28 for CH4) and indirect N2O emissions (1% of NH3-N volatilised for N2O-N) [1]. All data obtained were analysed by two-way analysis of variance (ANOVA) to test the effects of each treatment and time on biofilter characteristics and gas concentrations and emissions. The statistical significance (p < 0.05) of the means difference between treatments was determined by the Tukey Honestly Significant Difference test and using the statistical software package STATISTIX 10 (Analytical Software, Tallahassee, FL, USA).
3. Results and Discussion
3.1. Composition of the Biofilters
The initial (0 days) and final (14 days) composition of the biofilter media mixtures are shown in Table 3. The initial and final values of pH did not differ significantly (p > 0.05) among treatments tomato + pine and tomato + rice (average pH = 6.2 at 0 days and average pH = 6.6 at 14 days for treatments tomato + pine and tomato + rice) but were significantly higher (p < 0.05) in these treatments when compared with treatment tomato (pH = 5.7) (Table 3). The addition of oxalic acid had no significant effect (p > 0.05) on the initial and final values of pH of amended treatments, except in treatment tomato + pine + acid (pH = 4.7 at 0 days and pH = 7.5 at 14 days), that was significant (p < 0.05) lower at 0 days and higher at 14 days relative to the same treatment without acid (Table 3). The final values of pH were increased significantly (p < 0.05) when compared with the initial values (Table 3). The initial content of dry matter was significantly lower (p < 0.05) in treatment tomato + pine (DM = 780 g kg−1) relative to treatments tomato+ rice and tomato (DM > 840 g kg−1) (Table 3). The final content of dry matter was not significantly different (p > 0.05) in almost all treatments (Table 3).
Table 3.
Physico-chemical characteristics of the biofilters at the beginning and at end of the experiment (n = 3).
Comparatively to all other treatments, the initial values of total C in treatments tomato + pine and tomato + pine + acid were higher and rather not statistically significant (p > 0.05) whereas the final values of total C were significantly higher (p < 0.05) in these same two treatments (Table 3). The addition of oxalic acid to treatment tomato + pine + acid treatments seems reduced significantly (p < 0.05) the initial and final values of total C relative to the same treatments without acid (Table 3). The initial and final values of total N were higher (but not always statistically significant) in treatment tomato relative to treatments tomato + pine and tomato + rice (Table 3). The addition of oxalic acid to treatments had no significant effect (p > 0.05) on the initial and final values of total N of the same treatments without acid (Table 3). The initial and final values of NH4+ did not differ significantly (p > 0.05) among all treatments but increased significantly (p < 0.05) in the end of the experiment (15 to 40 mg kg−1 DM at day 0 against 41 to 70 mg kg−1 DM at day 14) (Table 3). The initial and final values of NO3− did not differ significantly (p > 0.05) among all treatments (Table 3). Comparatively to 0 days of experiment, the NO3− values did not increase significantly (p > 0.05) in the 14 days of experiment (Table 3). The initial and final values of C/N ratio and bulk density ratio were numerically lower in treatments tomato and tomato + acid when compared with all other treatments (Table 3). The initial values of porosity did not increase significantly (p > 0.05) as increased the amount of tomato-waste in biofilter treatments (Table 3).
3.2. Nitrogen Emissions from Biofilters
3.2.1. Ammonia Emissions
The daily concentrations of NH3 from treatments along the experiment are shown in Table 4. Comparatively to biofilter treatments without acid, the daily NH3 concentrations of the control treatment were significantly higher (p < 0.05) during the 14 days of experiment, with a peak in the first 6 days (14 to 31 mg NH3 m−3) followed by a progressive decrease (31 to 21 mg NH3 m−3) until the end of the experiment (Table 4). The daily NH3 concentrations did not differ significantly (p > 0.05) among all biofilter treatments without acid, except in the first 2 days for treatment tomato (Table 4). The mean NH3 concentrations (0–14 days) decreased but not always significantly by the following order: treatments tomato and tomato + rice < treatment tomato + pine < treatment control (Table 4). The addition of oxalic acid had no significant effect (p > 0.05) on mean NH3 concentrations (0–14 days) of biofilter treatments without acid, except in treatment tomato + pine + acid that was significant lower (p < 0.05) relative to the same treatment without acid (4.9 mg NH3 m−3 for treatment tomato + pine + acid against 14.9 mg NH3 m−3 treatment tomato + pine) (Table 4).
Table 4.
Average ammonia and nitrous oxide concentrations (mg m−3) in the outlet air of each biofilter (n = 3).
As can be observed in Table 5, the NH3 elimination efficiency did not vary significantly (p > 0.05) among biofilter treatments without acid (tomato + pine, tomato + rice and tomato) and these treatments had a significant reduction (p < 0.05) from 51 to 77% relative to treatment control. Comparatively to treatments without acid, the addition of oxalic acid decreased significantly (p < 0.05) the NH3 elimination efficiency in treatment tomato + pine + acid (79% reduction with acid against 51% reduction without acid) but not in the other treatments that received acid (Table 5). The NH3 elimination capacity of biofilter treatments without acid (tomato + pine, tomato + rice and tomato) decreased significantly (p < 0.05) when compared with treatment control, but no were found significant differences (p > 0.05) among these biofilter treatments (reduction of 644 to 908 µg NH3 m3 s−1) (Table 5). No was found significant differences (p > 0.05) among treatments with and without oxalic acid on the NH3 elimination capacity (Table 5).
Table 5.
Gas elimination efficiency and pollutant elimination capacity from each biofilter (n = 3).
The mechanism of NH3 removal occur by nitrifying bacteria that grow on the moist packing material of biofilter [7]. The NH3 dissolves in the water phase and is converted to nitrite and nitrate by nitrification. These compounds could be removed with the percolate water as dissolved NH4NO2 and NH4NO3 and to some extent also are accumulated in the organic packing material [7]. In the present study, the three biofilters evaluated presented similar NH3 elimination efficiency (51 to 77% of reduction) and elimination capacity (644 to 908 µg NH3 m−3 s−1 of reduction) (Table 5). Although not statistically different, the differences among biofilters evaluated in this study (Table 3) could be related with the moisture content and characteristics of the media [11]. Chen et al. [12], studying three moisture levels (20, 40 and 60%) of biofilters filled with wood chips, reported significant decreases in the NH3 removal efficiency according to the type of material.
As can be observed in Table 6, Liu et al. [18] reported that a biofilter using woodchips as packing material could reduce NH3 emissions from 64 to 78%, being comparable with the value observed in the present study for the three tomato based biofilters (51 to 77% of reduction). Also, excluding differences among packing materials referred in Table 6, the reduction of NH3 emissions by tomato based biofilters was comparable with conventional packing materials like woodchip, pine bark and compost, being a promising solution as packing materials in regions where are available. When the biofilters were coated with oxalic acid crystals to absorb NH3 from airflow that passed by the packing material [19,20], a significant NH3 elimination efficiency was observed only in treatment tomato + pine + acid, what could be related with the lower pH value and higher moisture content relative to the other two biofilters that were coated with oxalic acid [20]. In addition, minor advantages were gained from the addition of oxalic acid to the three tomato-based biofilters, with 72 to 79% reduction (average of 75%) with acid against 51 to 77% reduction without acid (average of 66%).
Table 6.
Pollutant removal efficiencies of biofilters for animal housing facilities.
3.2.2. Nitrous Oxide Emissions
The daily concentrations of N2O from all biofilter treatments and control did not varied along the experiment (Table 4). The daily N2O concentrations, including the average values (0–14 days), from biofilter treatments and control did not differed significantly (p > 0.05) in most measurement days (0.5 to 1.2 mg N2O m−3), being numerically higher in treatment tomato (Table 4). Comparatively to treatment control, the mean N2O concentrations (0–14 days) were numerically higher in biofilter treatments without acid by the following order: treatment tomato > treatments tomato + rice and tomato + pine > control (Table 4). The addition of oxalic acid to assigned treatments did not reduce significantly (p > 0.05) the mean N2O concentrations (0–14 days) relative to biofilter treatments without acid (Table 4).
The N2O elimination efficiency was not significantly decreased (p > 0.05) in biofilter treatments without acid relative to treatment control, being observed a significant increase (p < 0.05) in treatment tomato when compared with treatments tomato + pine and tomato + rice (61% increase for treatment tomato against 17% increase for treatments tomato + pine and tomato + rice) (Table 5). The addition of oxalic acid did not affect significantly (p > 0.05) the N2O elimination efficiency of biofilter treatments (tomato + pine, tomato + rice and tomato) relative to these same biofilter treatments without acid (Table 5). The N2O elimination capacity was not significantly reduced (p > 0.05) in treatment tomato (15 µg N2O m3 s−1 of increase) relative to all other biofilter treatments (2 µg N2O m3 s−1 of increase) (Table 5). In addition, no significant differences (p > 0.05) were found among treatments with and without oxalic acid on the N2O elimination capacity (Table 5).
Ammonia gas from contaminated air streams recovered through absorption is then oxidized into nitrite and nitrate by microorganisms that grow on the surface of packing media [7]. In anaerobic zones of the biofilter, denitrification can also take place, meaning that part of the nitrite and/or nitrate is converted to N2 [7]. In the present study, the three tomato-based biofilters without acid increased significantly the N2O emissions (Table 5), particularly for biofilter with 100% tomato, which could be related with the high amount of N in tomato waste (Table 3). Thus, N2O is influenced by moisture content and might be produced in the biofilter as a by-product from both nitrification and denitrification [7,11].
The results of this study followed the same trend than previous studies [18,23,26] reported in Table 6, where biofilters using different packing materials increased the N2O emissions. In the present study, the addition of oxalic acid crystals to the biofilters had no effect on N2O losses, which could be related with the absence of effect on the reduction of pH of packing materials (Table 3) and then did not affected the nitrification and denitrification processes.
3.3. Carbon Emissions from Biofilters
3.3.1. Carbon Dioxide Emissions
In all biofilter treatments and control, the daily concentrations of CO2 were quite similar during the 14 days of experiment (Table 7). For almost all measurement days of experiment, the daily CO2 fluxes, including the average values (0–14 days), from biofilter treatments without acid and control did not varied significantly (p > 0.05) (870 to 1660 mg CO2 m−3), being observed numerically lower fluxes in treatment tomato + rice and higher fluxes in treatment tomato (Table 7). The addition of oxalic acid to assigned biofilter treatments increased, but not significantly (p > 0.05), the mean CO2 concentrations (0–14 days) comparatively to biofilter treatments without acid and control (Table 7).
Table 7.
Average carbon dioxide and methane concentrations (mg m−3) in the outlet air of each biofilter (n = 3).
The CO2 elimination efficiency was not significantly reduced (p > 0.05) in biofilter treatments without acid relative to treatment control (Table 5). The addition of oxalic acid increased significantly (p < 0.05) the CO2 elimination efficiency in treatment tomato + pine + acid relative to treatment tomato + pine, but not in all other treatments (Table 5). The CO2 elimination capacity was not significantly reduced (p > 0.05) in biofilter treatments with and without acid relative to treatment control, except in treatment tomato + pine + acid (Table 5).
Carbon dioxide is originated by decomposition of urea and by anaerobic decomposition of the organic matter present in animal manure, as well as by microbial oxidation of gaseous contaminants in the packing material of biofilter [8,27]. Although the decomposition of packing material of biofilters evaluated in the present study, the three tomato- based biofilters without acid evaluated had similar CO2 elimination efficiency and elimination capacity than values reported by Martinec et al. [26] for biofilters equipped with coconut and peat as pack materials. The addition of oxalic acid to assigned biofilter treatments increased significantly (p < 0.05) the CO2 elimination capacity in treatment tomato + pine + acid relative to treatment tomato + pine, but not in all other biofilter treatments (Table 5).
3.3.2. Methane Emissions
In each biofilter treatment and control, the daily concentrations of CH4 did not varied greatly during the 14 days of experiment (Table 7). On most all days of the experiments, the daily CH4 concentrations and average values (0–14 days) did not differ significantly (p > 0.05) among all biofilter treatments with and without acid and treatment Control (0 to 70 mg CH4 m−3) (Table 7). The mean CH4 concentrations (0–14 days) were higher, although not statistically different, in treatment control (7.9 mg CH4 m−3) when compared with all other biofilter treatments without acid (treatments tomato + pine, tomato + rice and tomato) (2.6 to 4.4 mg CH4 m−3). Comparatively to biofilter treatments without acid, the addition of oxalic acid did not reduce significantly (p > 0.05) the mean CH4 concentrations of these same biofilter treatments (Table 7).
The CH4 elimination efficiency did not decrease significantly (p > 0.05) in biofilter treatments without acid relative to treatment control (Table 5). The addition of oxalic acid to assigned biofilter treatments reduced significantly (p < 0.05) the CH4 elimination efficiency in treatment tomato + pine + acid relative to treatment tomato + pine, but not in all other biofilter treatments (Table 5). The CH4 elimination capacity was not significantly reduced (p > 0.05) in biofilter treatments without acid when compared with treatment Control (Table 5). The addition of oxalic acid to assigned treatments reduced significantly (p < 0.05) the CH4 elimination capacity in treatment tomato + rice + acid relative to treatment tomato + rice, but not in all other treatments (Table 5). On other hand, the GWP elimination efficiency was not reduced significantly (p > 0.05) in biofilter treatments without acid relative to treatment control (Table 5). The addition of oxalic acid to assigned biofilter treatments reduced significantly (p < 0.05) the GWP elimination capacity in treatments tomato + pine + acid and tomato + rice + acid relative to the same biofilter treatments without acid (Table 5).
In the present study, the three tomato-based biofilters had similar CH4 elimination efficiency (29 to 69% of reduction) and elimination capacity (99 to 245 µg CH4 m3 s−1 of reduction) (Table 5). The elimination of CH4 in a biofilter is mainly through aerobic conversion of CH4 to CO2 and water by the so-called methanotrophic bacteria [28]. Also, the adsorption of CH4 in the packing materials, low water solubility and biodegradation rate may also contribute to the CH4 removal [7,29].
The achieved CH4 removal efficiencies (29 to 69% of reduction) in the three tomato based biofilters are in line with previous biofilter studies [22,23,24,26,30] reported in Table 6, with average values that varied from 0 to 85% for biofilters equipped with different type of pack materials. At the present study, the addition of oxalic acid crystals to the biofilters did not reduced the CH4 losses in treatment tomato + rice + acid (140% of increase) relative to the other two acidified treatments (49 to 72%), which may be due to the higher pH value in this treatment (pH = 6.4 for treatment tomato + rice + acid against pH < 5.8 for treatments tomato + pine + acid and tomato + acid) (Table 3).
4. Conclusions
The present study suggests that biofilter media mixtures, mainly composed by tomato waste, had a potential for NH3 retention between 51 and 77% and the addition of oxalic acid to these biofilters increased NH3 retention to 72–79%. Additionally, the biofilter media mixtures with and without oxalic acid showed a potential retention for CH4 (29–69%) but not for N2O, yet with no impact on the global warming potential. The tomato based biofilters had the potential to reduce gaseous emissions from livestock production facilities, but further full-scale studies are needed to confirm these inferences.
Author Contributions
Conceptualization, J.L.S.P.; methodology, J.L.S.P., A.P. and D.F.; software, J.L.S.P., A.P. and D.F.; validation, J.L.S.P., A.P., F.M., C.C., M.M. and D.F.; formal analysis, J.L.S.P., A.P. and D.F.; investigation, J.L.S.P., A.P., F.M., C.C., M.M. and D.F.; resources, J.L.S.P., A.P., F.M., C.C., M.M. and D.F.; data curation, J.L.S.P., A.P., F.M., C.C., M.M. and D.F.; writing—original draft preparation, J.L.S.P. and D.F.; writing—review and editing, J.L.S.P. and D.F.; visualization, J.L.S.P. and D.F.; supervision, D.F.; project administration, J.L.S.P. and D.F.; funding acquisition, J.L.S.P. and D.F. All authors have read and agreed to the published version of the manuscript.
Funding
This research was funded by National Funds by FCT—Portuguese Foundation for Science and Technology, under the projects UIDB/04033/2020 and UID/AGR/04129/2020, and project Cleanslurry PTDC/ASP-SOL/28769/2017.
Institutional Review Board Statement
Not applicable.
Informed Consent Statement
Not applicable.
Data Availability Statement
Not applicable.
Conflicts of Interest
The authors declare no conflict of interest.
References
- IPCC. 2019 Refinement to the 2006 IPCC Guidelines for National Greenhouse Gas Inventories; Calvo Buendia, E., Tanabe, K., Kranjc, A., Baasansuren, J., Fukuda, M., Ngarize, S., Osako, A., Pyrozhenko, Y., Shermanau, P., Federici, S., Eds.; IPCC: Geneva, Switzerland, 2019; Available online: http://www.ipcc-nggip.iges.or.jp (accessed on 17 December 2020).
- Rodriguez, M.R.; Losada, E.; Besteiro, R.; Arango, T.; Velo, R.; Ortega, J.A.; Fernandez, M.D. Evolution of NH3 concentrations in weaner Pig buildings based on set point Temperature. Agronomy 2020, 10, 107. [Google Scholar] [CrossRef]
- Sommer, S.; Zhang, G.; Bannink, A.; Chadwick, D.; Misselbrook, T.; Harrison, R.; Hutchings, N.; Menzi, H.; Monteny, G.; Ni, J.; et al. Algorithms Determining Ammonia Emission from Buildings Housing Cattle and Pigs and from Manure Stores. Adv. Agron. 2006, 89, 261–335. [Google Scholar] [CrossRef]
- Pereira, J.L.S.; Ferreira, S.; Pinheiro, V.; Trindade, H. Ammonia, Nitrous Oxide, Carbon Dioxide and Methane Emissions from Commercial Broiler Houses in Mediterranean Portugal. Water Air Soil Pollut. 2018, 229, 377. [Google Scholar] [CrossRef]
- Van Der Heyden, C.; Demeyer, P.; Volcke, E.I. Mitigating emissions from pig and poultry housing facilities through air scrubbers and biofilters: State-of-the-art and perspectives. Biosyst. Eng. 2015, 134, 74–93. [Google Scholar] [CrossRef]
- Swanson, W.J.; Loehr, R.C. Biofiltration: Fundamentals, Design and Operations Principles, and Applications. J. Environ. Eng. 1997, 123, 538–546. [Google Scholar] [CrossRef]
- Melse, R.W.; Hol, J.M. Biofiltration of exhaust air from animal houses: Evaluation of removal efficiencies and practical experiences with biobeds at three field sites. Biosyst. Eng. 2017, 159, 59–69. [Google Scholar] [CrossRef]
- Nicolai, R.; Janni, K. Biofilter media mixture ratio of wood chips and compost treating swine odors. Water Sci. Technol. 2001, 44, 261–267. [Google Scholar] [CrossRef]
- Pagans, E.; Font, X.; Sánchez, A. Biofiltration for ammonia removal from composting exhaust gases. Chem. Eng. J. 2005, 113, 105–110. [Google Scholar] [CrossRef]
- Chen, L.; Hoff, S.J. Mitigating Odors from Agricultural Facilities: A Review of Literature Concerning Biofilters. Appl. Eng. Agric. 2009, 25, 751–766. [Google Scholar] [CrossRef]
- Dumont, E.; Hamon, L.; Lagadec, S.; Landrain, P.; Landrain, B.; Andres, Y. NH3 biofiltration of piggery air. J. Environ. Manag. 2014, 140, 26–32. [Google Scholar] [CrossRef]
- Chen, L.; Hoff, S.; Cai, L.; Koziel, J.; Zelle, B. Evaluation of wood chip-based biofilters to reduce odor, hydrogen sulfide, and ammonia from swine barn ventilation air. J. Air Waste Manag. Assoc. 2009, 59, 520–530. [Google Scholar] [CrossRef] [PubMed]
- Pereira, J.; Fangueiro, D.; Misselbrook, T.H.; Chadwick, D.R.; Coutinho, J.; Trindade, H. Ammonia and greenhouse gas emissions from slatted and solid floors in dairy cattle houses: A scale model study. Biosyst. Eng. 2011, 109, 148–157. [Google Scholar] [CrossRef]
- Pereira, J.; Misselbrook, T.H.; Chadwick, D.R.; Coutinho, J.; Trindade, H. Effects of temperature and dairy cattle excreta characteristics on potential ammonia and greenhouse gas emissions from housing: A laboratory study. Biosyst. Eng. 2012, 112, 138–150. [Google Scholar] [CrossRef]
- Grubecki, I. Airflow versus pressure drop for a mixture of bulk wood chips and bark at different moisture contents. Biosyst. Eng. 2015, 139, 100–110. [Google Scholar] [CrossRef]
- Kizito, S.; Wu, S.; Kirui, W.K.; Lei, M.; Lu, Q.; Bah, H.; Dong, R. Evaluation of slow pyrolyzed wood and rice husks biochar for adsorption of ammonium nitrogen from piggery manure anaerobic digestate slurry. Sci. Total Environ. 2015, 505, 102–112. [Google Scholar] [CrossRef]
- Lim, T.-T.; Jin, Y.; Ni, J.-Q.; Heber, A.J. Field evaluation of biofilters in reducing aerial pollutant emissions from a commercial pig finishing building. Biosyst. Eng. 2012, 112, 192–201. [Google Scholar] [CrossRef]
- Liu, T.; Dong, H.; Zhu, Z.; Shang, B.; Yin, F.; Zhang, W.; Zhou, T. Effects of biofilter media depth and moisture content on removal of gases from a swine barn. J. Air Waste Manag. Assoc. 2017, 67, 1288–1297. [Google Scholar] [CrossRef] [PubMed]
- Kokkonen, A.; Esala, M.; Aura, E. Acceleration of N mineralization by release of enzymes and substrates from soil mineral particles with phosphates. Soil Biol. Biochem. 2006, 38, 504–508. [Google Scholar] [CrossRef]
- Rybarczyk, P.; Szulczyński, B.; Gebicki, J.; Hupka, J. Treatment of malodorous air in biotrickling filters: A review. Biochem. Eng. J. 2019, 41, 146–162. [Google Scholar] [CrossRef]
- Uenk, G.H.; Monteny, G.J.; Demmers, T.G.M.; Hissink, M.G. Reduction of Ammonia Emission from Pig Houses Using Biofilters (in Dutch); Report 93-28; DLO Instituut voor Milieu- en Agritechniek (IMAG-DLO): Wageningen, The Netherlands, 1993. [Google Scholar]
- Melse, R.W.; Hol, J.M.G.; Nijeboer, G.M. Measurements on a Bioscrubber System with Denitrification at a Fattening Pig House (in Dutch); Livestock Research; Report 554; Wageningen UR: Wageningen, The Netherlands, 2012. [Google Scholar]
- Melse, R.W.; Hol, J.M.G.; Nijeboer, G.M.; van Hattum, T.G. Measurements on a Biofilter for Treatment of Exhaust Air from a Fattening Pig House (in Dutch); Livestock Research; Report 802; Wageningen UR: Wageningen, The Netherlands, 2014. [Google Scholar]
- Akdeniz, N.; Janni, K.A.; Salnikov, I.A. Biofilter performance of pine nuggets and lava rock as media. Bioresour. Technol. 2011, 102, 4974–4980. [Google Scholar] [CrossRef] [PubMed]
- Hartung, E.; Jungbluth, T.; Bascher, W. Reduction of Ammonia and Odor Emissions from a Piggery with Biofilters. Trans. ASAE 2001, 44, 113–118. [Google Scholar] [CrossRef]
- Martinec, M.; Hartung, E.; Jungbluth, T.; Schneider, F.; Wieser, P. Reduction of Gas, Odor and Dust Emissions from Swine Operations with Biofilters. In Proceedings of the 2001 ASAE Annual International Meeting Sponsored by ASAE, Sacramento, CA, USA, 29 July–1 August 2001. [Google Scholar]
- Pereira, J.L.S.; Figueiredo, V.; Pinto, A.F.M.A.; Silva, M.E.F.; Brás, I.; Perdigão, A.; Wessel, D.F. Effects of Biochar and Clinoptilolite on Composition and Gaseous Emissions during the Storage of Separated Liquid Fraction of Pig Slurry. Appl. Sci. 2020, 10, 5652. [Google Scholar] [CrossRef]
- Hanson, R.S.; Hanson, T.E. Methanotrophic bacteria. Microbiol. Rev. 1996, 60, 439–471. [Google Scholar] [CrossRef] [PubMed]
- Liu, F.; Wienke, C.; Fiencke, C.; Guo, J.; Dong, R.; Pfeiffer, E.M. Biofilter with mixture of pine bark and expanded clay as packing material for methane treatment in lab-scale experiment and field-scale implementation. Environ. Sci. Pollut. Res. 2018, 25, 31297–31306. [Google Scholar] [CrossRef] [PubMed]
- Melse, R.W.; Van Der Werf, A.W. Biofiltration for Mitigation of Methane Emission from Animal Husbandry. Environ. Sci. Technol. 2005, 39, 5460–5468. [Google Scholar] [CrossRef]
Publisher’s Note: MDPI stays neutral with regard to jurisdictional claims in published maps and institutional affiliations. |
© 2021 by the authors. Licensee MDPI, Basel, Switzerland. This article is an open access article distributed under the terms and conditions of the Creative Commons Attribution (CC BY) license (http://creativecommons.org/licenses/by/4.0/).