Article

Differing Phosphorus Crop Availability of Aluminium and Calcium Precipitated Dairy Processing Sludge Potential Recycled Alternatives to Mineral Phosphorus Fertiliser

1
Teagasc, Environment Research Centre, Johnstown Castle, Co., Y35 Y521 Wexford, Ireland
2
Department of Green Chemistry and Technology, Faculty of Bioscience Engineering, Ghent University, Coupure links 653, 9000 Ghent, Belgium
*
Author to whom correspondence should be addressed.
Agronomy 2021, 11(3), 427; https://doi.org/10.3390/agronomy11030427
Submission received: 27 January 2021 / Revised: 17 February 2021 / Accepted: 23 February 2021 / Published: 26 February 2021

Abstract

:
The European dairy industry generates large volumes of wastewater from milk and dairy food processing. Removal of phosphorus (P) by complexing with metal (e.g., aluminium, calcium) cations in P rich sludge is a potential P source for agricultural reuse and P recycling. However, there is a significant knowledge gap concerning the plant availability of this complexed P in comparison to conventional mineral P fertiliser. The current absence of information on plant P bioavailability of dairy processing sludge (DPS) limits the ability of farmers and nutrient management advisors to incorporate it correctly into fertiliser programmes. The present study examined the most common types of dairy sludge—(1) aluminium-precipitated sludge (“Al-DPS”) and (2) calcium-precipitated lime-stabilised sludge (“Ca-DPS”) at field scale to assess P availability in grassland versus mineral P fertiliser over a growing season. The experimental design was a randomised complete block with five replications. Crop yield and P uptake were assessed for 4 harvests. The initial soil test P was at a low level and the experimental treatments were super phosphate at 15, 30, 40, 50 and 60 kg P ha−1, two dairy sludge applied at 40 kg P ha−1 (comparison was made with mineral P at same application rate) and a zero P control applied in a single application at the beginning of the growing season. Results showed a significant positive slope in the relationship between P uptake response and mineral P application rate indicating the suitability of the experimental site for P availability assessment. The P bioavailability of Al- and Ca-DPS varied greatly between treatments. The P fertiliser replacement value based on the 1st harvest was 50 and 16% increased to 109 and 31% cumulatively over the four harvests for Al- and Ca-DPS, respectively. The Al concentration in Al-DPS did not limit P bioavailability, but low P bioavailability from Ca-DPS can be associated with its high Ca content that can lead to formation of low soluble Ca-P compounds at alkaline pH conditions with a high Ca/P ratio. These findings show that P availability from dairy sludge can be quite different depending on treatment process. Consequently, it is critical to have P availability information as well as total P content available to ensure the application rate meets crop requirements without creating environmental risk by over application.

1. Introduction

Currently European agriculture is heavily dependent on imported (about 92%) mineral phosphorus (P) inputs with P listed as a critical raw material due to short supply and potential negative impact on food security [1]. Increased recycling of P from different bio-based feedstocks (e.g., dairy processing sludge (DPS)) has the potential to reduce reliance on P importation [2,3]. The recently published European Union (EU) ”Farm to Fork Strategy” aims to accelerate the transition from inorganic to organic sources of fertilisers within sustainable food and agriculture systems [4]. A recommended practice is to reduce excess fertilisation and to foster the recycling of nutrients from different types of organic waste as fertilisers. This presents an opportunity to increase the use of recovered secondary-raw-material-based fertilising products such as DPS. However, to do so in a meaningful way there is a need for information about the plant availability of nutrients including P in the potential recycled alternatives.
The dairy industry has a worldwide presence meeting a growing demand for milk and milk products (e.g., milk powder, butter, cheese yogurt and ice cream) [5]. The processing of dairy products consumes large volume of water (up to 11 L L−1 processed milk) and generates wastewater (up to 10 L L−1 milk processing) containing high concentrations of dissolved organic components, such as lactose, minerals, fat and whey protein [6,7]. These wastewaters are treated at source using conventional biological and chemical processes of wastewater treatment to meet effluent discharge limits. This could result the generation of up to 20 kg sludge (settled solid-liquid residues) per cubic meter of milk processed [8]. The dairy industry in Europe generates very large volumes of wastewater treated sludge i.e., DPS [9], estimated to be about 3.8 million tonnes of dairy sludge (fresh weight) annually corresponding to about 155 million tonnes of EU milk production per year [10]. These DPSs are a valuable secondary resource for agricultural re-use and nutrient recycling due to high content of crop macro-nutrients like P, nitrogen (N), and low content of toxic metals like lead, chromium, cadmium, nickel, etc. [11,12]. For example, it has been estimated that P and N recycled of DPS within the Irish dairy industry is about 664 and 905 tonnes year−1, respectively, from an estimated 126,700 tonnes (fresh weight) of DPS generated annually [8]. In addition to macro-nutrients, DPS also contains organic matter, carbon and other micro-nutrients (e.g., copper, iron, manganese, molybdenum and zinc) [8] that could potentially be beneficial for soil fertility and crop production [11]. Presently, land spreading of DPS occurs without knowledge of its plant available P and this creates potential for uncertainty in the level of P available to meet crop and soil requirements. This knowledge gap also creates difficulties for its use to build soil fertility and for determining maximum desirable applications from an environmental standpoint.
The application rate of organic or secondary residue derived fertilisers (e.g., DPS, cattle slurry and biosolids) can be determined by pH, metal and nutrient content of the soil, and the nutrient and metal content of the materials to meet the limits recommended in the “Codes of Good Practice for the Use of Biosolids in Agriculture” [13]. However, a number of other factors like organic matter composition, mineralisable pools of nutrients within bio-based residues and soil properties may influence the application rate [14]. The total content of P in the material is commonly used as the determinant factor to estimate a legal application rate when applying secondary fertiliser materials [15,16]. For example, up to 60 kg P ha−1 annually is recommended for silage production on soils at the lowest soil P level (Index 1) [17].
While conventional mineral P fertilisers such as triple super phosphate (Ca(H2PO4)2·H2O) has more than 90% P rapidly available for plant uptake [18], the secondary residue derived fertilisers (e.g., manures, wastewater treated bio-stabilised sludge, and different treated organic waste) generally do not show similar availability due to differences in composition, source, biological and bio-chemical mineralization processes [19]. The P fertilisers replacement values (FRV) reported in the literature ranged from 55–86% for ashes (from oat grain, wheat straw), 64–67% for biogas residue (from crop, slaughterhouse waste), 64% for chicken manure, 65% for brewer’s spent grain, 59% for cattle slurry, 60% for meat meal, 44% for bone meal, and 13–63% for sewage sludge (lowest for Ca-precipitated and highest for Fe-precipitated) [20]. However, there is no known equivalent P FRV data source for DPS to the best of our knowledge. This information is a critical knowledge gap impeding the reuse of P from DPS in agricultural systems. Recent findings indicate that DPS includes a variable presence of aluminium (Al), iron (Fe) and calcium (Ca) oxides which are associated with the use of Al and/or Fe based salts and lime addition during wastewater treatment to remove P [21,22]. These metal oxides are known to fix plant available P into unavailable forms in Irish grassland soils of contrasting parent material and chemical properties [23,24]. Therefore, the amount of these metal oxides present has potential to significantly affect P bio-availability from DPS [25,26].
The objective of the present study was to fill the knowledge gap concerning first-year P bioavailability and fertilisation performance of two common types of dairy processing sludge (Ca-DPS and Al-DPS) in order to aid their adoption as bio-based fertilisers. The hypothesis tested was P availability of Al-DPS vs. Ca-DPS is different for crop yield and uptake in comparison to reference mineral fertiliser over one seasonal year.

2. Materials and Methods

2.1. Characterisation of Dairy Processing Sludge (DPS)

Activated sludge aluminium-precipitated (“Al-DPS”) and lime-stabilised sludge calcium-precipitated (“Ca-DPS”) were tested in this study. The activated sludge is generated after dairy food processing wastewater treatment using aeration and a biological floc formation including the dosing of aluminium flocculent to remove P. The generation of Al-DPS is common across dairy wastewater treatment facilities due to the common practice of using aerobic secondary treatment such as activated sludge aeration to remove organic material and suspended solids followed by removal of P in the tertiary treatment phase involving the use of chemicals such as ferric sulphate or aluminium chloride. The Ca-DPS is generated by a dissolved air floatation (DAF) technique whereby dairy wastewater rich in fats, oils and greases are floated to the surface and treated using the addition of lime, added as Ca(OH)2 or CaO, to produce a Ca and P rich sludge. The details on the DPS characterisation profile and method can be found in the recent paper by Ashekuzzaman et al. [8] which reported that Ca and Al are the dominant externally added metal cations within Irish dairy processing wastewater treatment facilities. The nutrient concentrations of DPS from single treatment facility were found not varying seasonally but differed significantly due to differences in sludge type and processing plant source [8]. The physicochemical properties of the DPS samples that were investigated for P availability are presented in Table 1 whereby the DPS composition reflects the processing stream it originated from.

2.2. Experimental Grassland Plots

This investigation was conducted at a temperate grassland site (on a grass sward dominated by perennial ryegrass) located at the Teagasc, Johnstown Castle Research Station, Co., Wexford, Ireland (latitude 52°17′ N, longitude 6°29′ W) in the southeast of Ireland. The site contains a well-drained, high permeability sandy loam textured soil (sand 54.9%, silt 30.1% and clay 15%), with a 0−10 cm Morgan’s soil test P level of 2.86 mg L−1, which places the site in the lowest P level, index 1 (i.e., P deficient) in the Irish system [17]. The Morgan’s soil P extraction method [27] is used in Ireland as the basis for agronomic recommendations and legal P application rate determination as outlined in Table 2. The average soil properties of the surface 10 cm soil layer prior to the application of treatments were a pH 5.6, total carbon 2.5%, organic carbon 1.8%, total N 0.3%, and Morgan’s extractable potassium (K) 69.9 mg L−1, magnesium (Mg) 166.9 mg L−1 (Mg considered sufficient). Lime was applied to the site at a rate of 1.5 tonnes ha−1 prior to the beginning of the experiment per soil test recommendations as the pH was considered suboptimal.
The field experiment was established in the 1st week of April 2019 employing a randomised complete block experimental design with five replications for each of the eight experimental treatments (with plot size 6 × 2 m2 for each). The experimental treatments, applied once at the beginning (12 April 2019) of the experiment, were super phosphate (SP) mineral fertiliser at rates of 15, 30, 40, 50 and 60 kg P ha−1, Ca and Al DPS applied at 40 kg P ha−1 and with a zero P (control). To ensure that it was P and not N, K or S that was the yield-limiting nutrient, a basal dressing of N (125 kg ha−1), K (155 kg ha−1) and S (20 kg ha−1) was applied to all treatments for the first silage harvest cycle using a combination of calcium ammonium nitrate (CAN), Muriate of Potash (MOP) and sulphate of potash (SOP). For the subsequent 2nd and 3rd silage cutting cycles the following were applied N (100 kg ha−1), K (75 kg ha−1) and S (20 kg ha−1) on 29 May 2019 and 25 July 2019, respectively. A fourth and final residual cut was taken after winter. All fertilisers were weighed out in advance and hand spread uniformly to each individual experimental unit (plot) ensuring even distribution of material by covering each plot a minimum of three times. The basal N, K and S dressing with mineral fertilisers was applied using a calibrated barrow applicator that covers two meters.

2.3. Crop and Soil Analysis

Plots were harvested four times on 24 May 2019, 17 July 2019, 26 September 2019 and 6 February 2020, fresh weight was recorded to determine grass yield and a subsample was collected to determine P uptake and dry matter (DM) content. Plots were harvested using an Etesia (Etesia Hydro 124DS, Etesia, Oxon, United Kingdom) commercial lawnmower (1.24 m cut width) or Haldrup F−55 (Deutz Fahr, Haldrup GmbH, Ilshofen, Germany) grass harvester (cut width of 1.5 m) at a cut height of 5 cm. Harvesting was from the centre of the 2 m plots.
Fresh subsamples of grass were weighed and then dried in perforated plastic bags in an oven at 70 °C for 72 h. Once dried dry weight was recorded for DM analysis and subsequently, dried samples were grounded and sieved to 2 mm size and used for nutrient analysis. Total crop P, K, S, Mg and Ca were analysed using an Agilent 5100 synchronous vertical dual view inductively coupled plasma optical emission spectrometer (Agilent 5100 ICP-OES, Agilent Techn ologies, Inc., Santa Clara, CA, USA) following the microwave-assisted acid digestion of sieved samples [29]. Total N and carbon were analysed using a combustion analyser (LECO 630–100−500 TruSpec CN analyser, LECO Corporation, Michigan, United States).
Soil samples (representative composite sample of a minimum of 6 samples from each plot), 0–10 cm were collected from each plot at the beginning of the experiment and again after directly after each harvest with the goal of assessing how long a practitioner might have to wait to assess the impact of DPS application on soil test values which influence spreading permitting. Samples were dried at 40 °C for 72 h and subsequently ground to <2 mm using a soil sieving machine in preparation for chemical analysis. Morgan extractable P was determined to quantify plant available and labile P fractions [30]. Morgan’s reagent [27] solution was used to extract soil to determine extractable P, K, Mg and LR. Morgan’s solution was prepared by combining 740 mL of 40% sodium hydroxide and 720 mL of glacial acetic acid and making a final volume about 10 L with the addition of distilled water. The solution pH was adjusted to 4.8. Soil samples were mixed with the Morgan’s solution in a 1:5 (v/v) soil to solution ratio and shaken for 30 min. The solutions were then filtered and analysed on the Lachat system (Lachat QuickChem 8500 Series 2 continuous flow analyser, Hach Lange GmbH, Düsseldorf, Germany) colorimetrically for P and Mg, and photometrically for K. Soil pH was determined using a Metler-Toledo pH electrode in the pH autoanalyser system (Gilson 215 Liquid Handler, Gilson Inc., Middleton, WI, USA) where soil solutions were prepared by mixing 10 mL scoop of soil (dried at 40 °C and sieved to 2mm) with 20 mL deionised water (1:2 ratio) and pH calibration maintained with buffer pH 4.00, 7.00 and 10.00 standards. Total carbon (TC) and total N were measured by high temperature combustion method using LECO TruSpec CN analyser (LECO Corporation, St. Joseph, MI, USA).

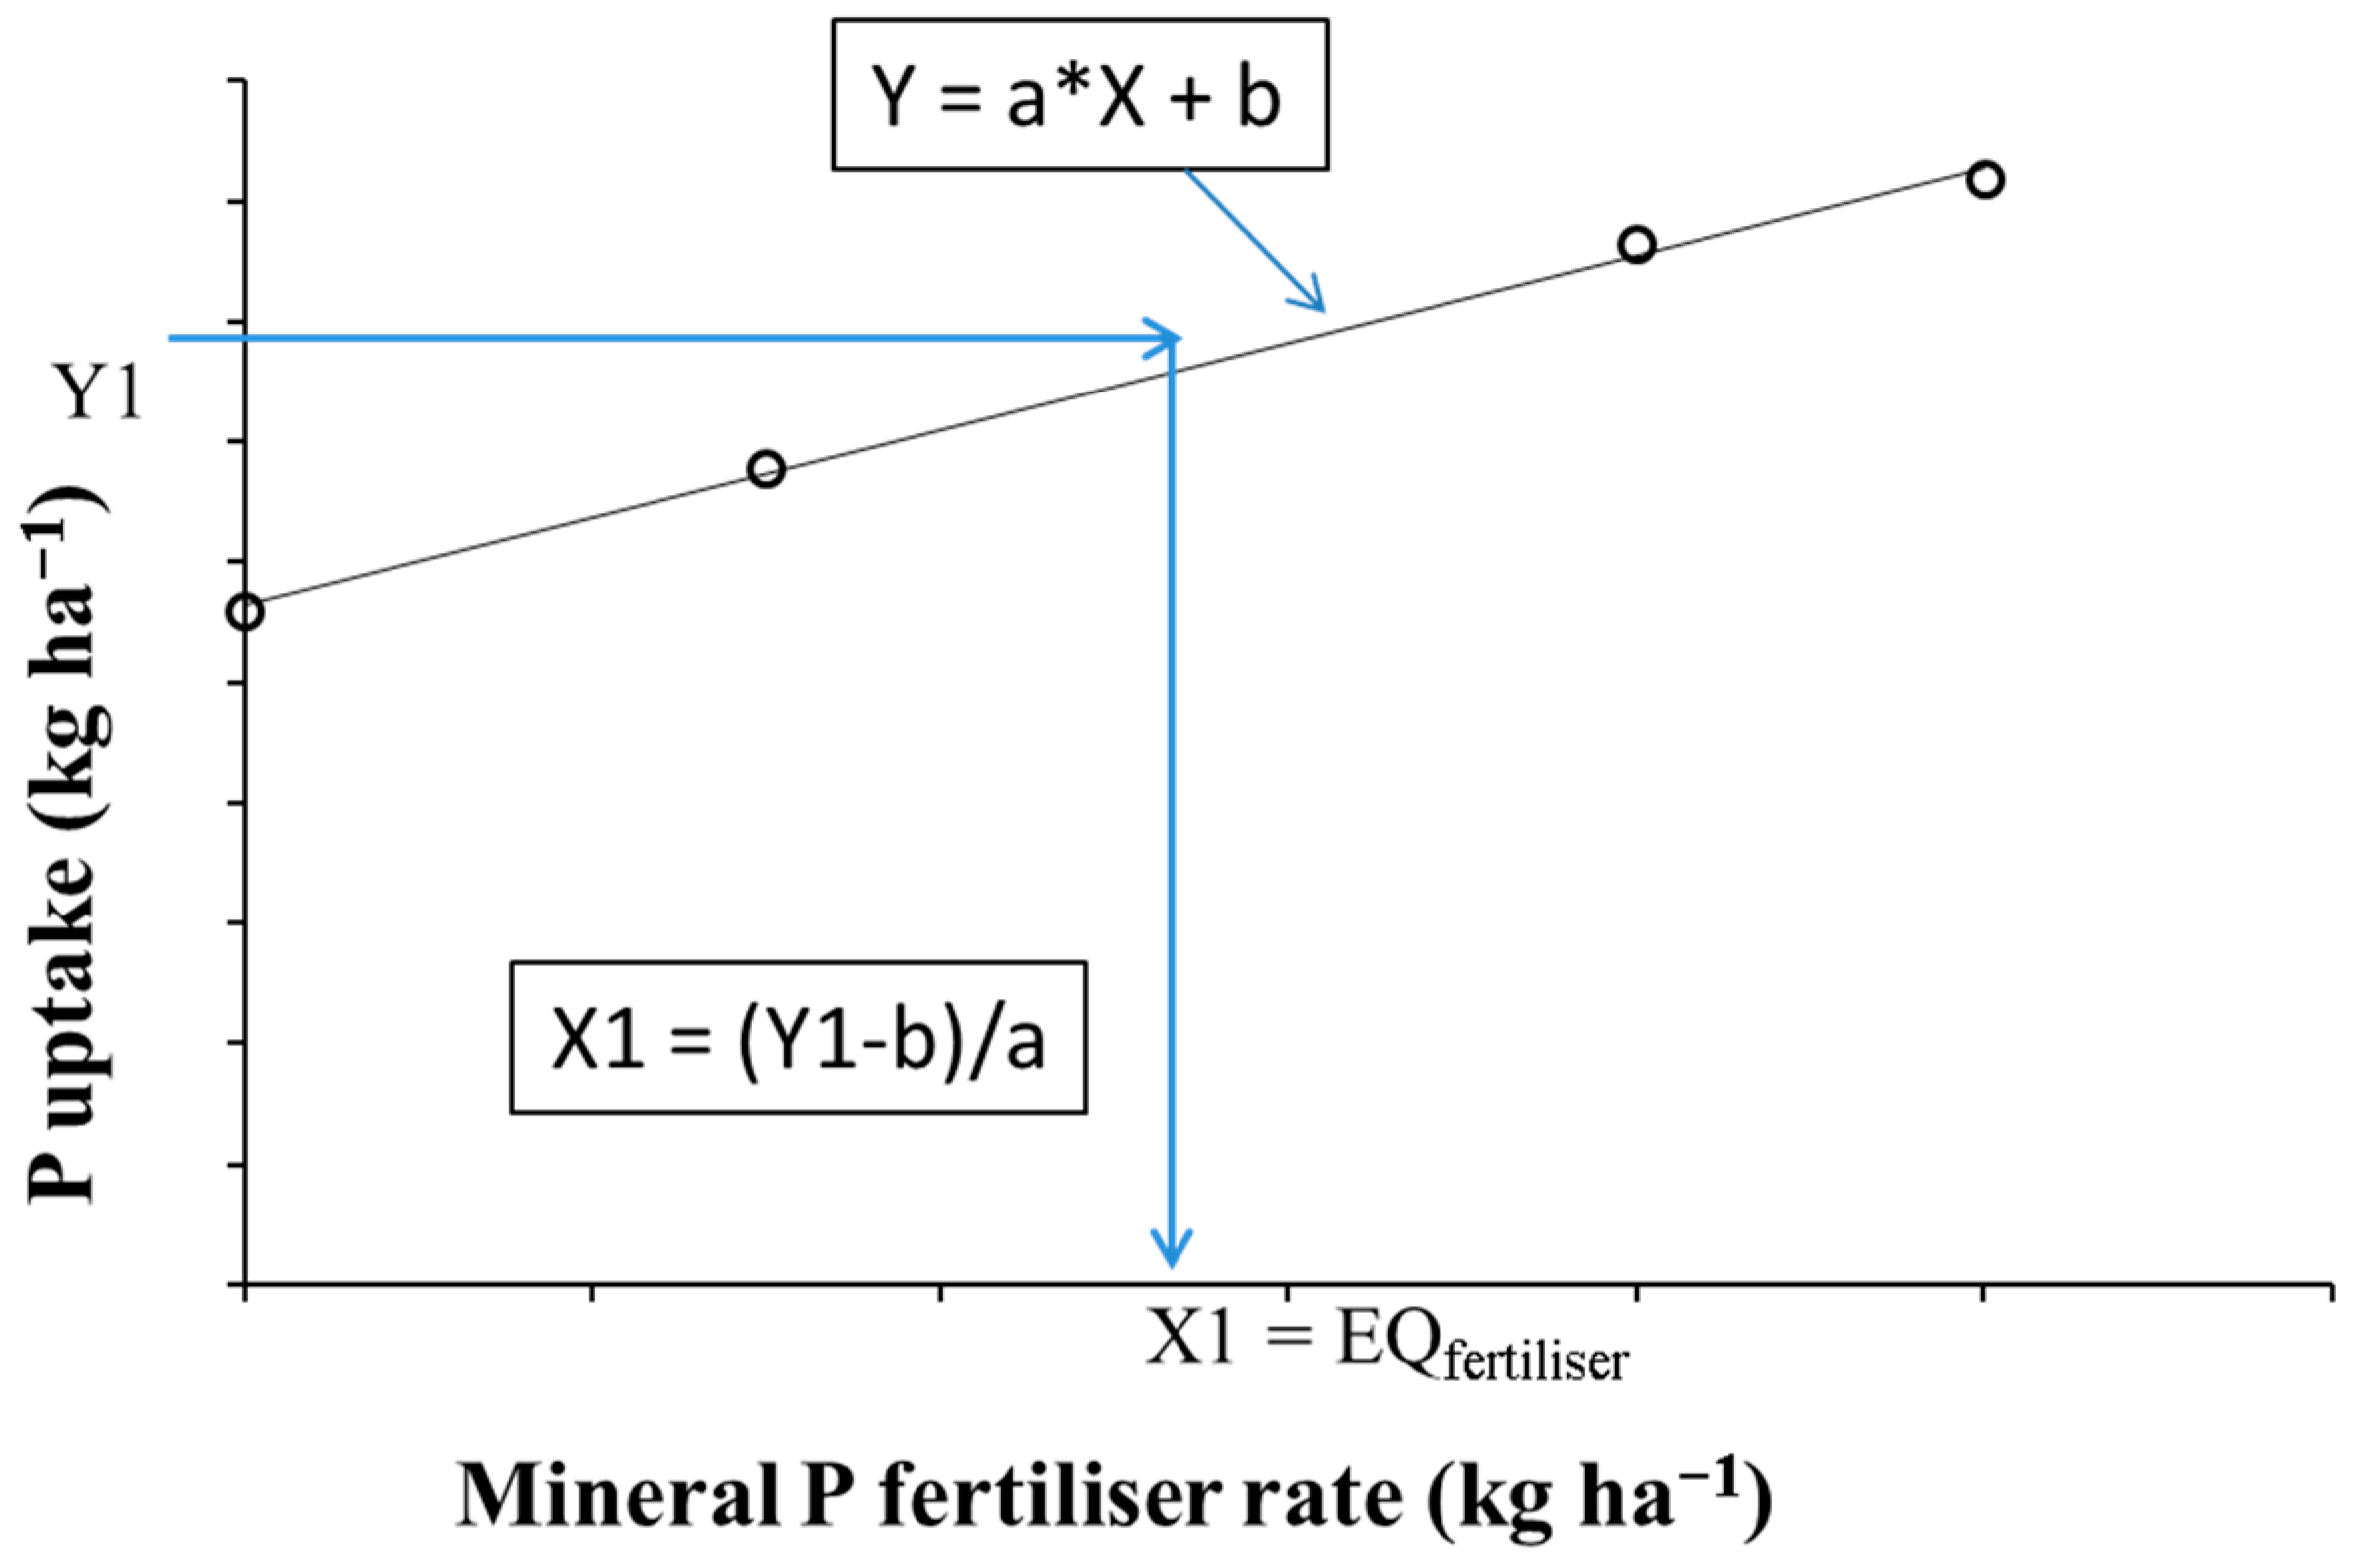
2.4. Calculation of P Bioavailability

Apparent P recovery (APR), relative P effectiveness (RPE) and fertiliser P equivalence (FPE) were calculated using Equations (1)–(3), respectively to assess P bioavailability of DPS samples. Apparent P recovery represents P uptake due solely to the treatment and compares crop P uptake in an amended treatment with that in an unamended control (i.e., zero P treatment). This method makes the assumption that the amount of P provided by the soil is the same amongst treatments. Relative P effectiveness allows comparison of the potential of the DPS treatment to provide bioavailable P in comparison to a mineral P fertiliser. RPE is determined by using the ratio of APR for the treatment to be evaluated to that of a reference mineral fertiliser as per Equation (2). In the present study, DPS treatments were applied at 40 kg-P ha−1, so the mineral P fertiliser treatment at 40 kg-P ha−1 is considered the reference. The RPE method allows for P bioavailability to be determined where multiple rates of mineral fertiliser are not included in the experimental design [26]. The FPE method which uses multiple rates of mineral P reference was also evaluated and estimates P availability of the treatment being evaluated, in this case DPS, by comparing crop response (P uptake or yield) with that of mineral fertiliser applied at multiple rates. Both RPE and FPE can be referred to as the P fertiliser replacement value (P FRV) of DPS products and both provide an estimation of the percentage of total P in the applied DPS that is equivalent to the amount of mineral fertiliser required to attain the same P uptake level [31].
APR   ( % )   =   P treatment     P control   P applied   × 100
where APR (%) is the apparent P recovery of treatment (DPS or mineral P fertiliser), Ptreatment is the crop P uptake (kg ha−1) due to P application treatment, Pcontrol is the crop P uptake in the zero P treatment (control plot), and Papplied is the total amount of treatment P applied (kg ha−1).
RPE   ( % )   =   APR   ( % ) DPS   APR   ( % ) mineral ( P 40 )     × 100
where RPE (%) is the relative P effectiveness of DPS compared to mineral P fertiliser applied at 40 kg-P ha−1, APRDPS is the apparent P recovery for DPS and APRmineral(P40) is the apparent P recovery of mineral P fertiliser applied at 40 kg-P ha−1.
FPE   ( % )   =   EQ mineral   P   fertiliser   rate   P applied     × 100
where FPE (%) is the percentage of mineral P fertiliser equivalence of DPS, EQmineral P fertiliser rate is the equivalent of amount of mineral P fertiliser that returns the same response (e.g., P uptake) compared to DPS (Figure 1), and Papplied is the amount of DPS P applied. The equivalent mineral fertiliser (EQfertiliser) is determined using the regression between mineral fertiliser application rates (kg ha−1) and crop response (P uptake or yield) as illustrated in Figure 1. In the present study, the best fit of mineral P fertiliser application rates and their corresponding P uptake is provided by a linear regression (Figure 2). In some other studies, such response was observed to be the best fit as non-linear and the illustration was provided using cubic polynomials [31].

2.5. Statistics

Statistical analysis was performed in GraphPad Prism 7 (GraphPad Software, Inc.) to determine the effect of experimental treatments on the response variables of crop yield, crop P concentration, P uptake, soil Morgan’s P level and pH change. The data was a blocked one-way classification (eight treatments) with repeated measures corresponding to harvesting time for grass. Repeated measure one-way analysis of variance (ANOVA) with the Greenhouse-Geisser correction was performed for each dataset to determine if differences were seen as a function of treatment. Statistically significant differences were considered at a p-value ≤ 0.05 and where significance found, Fisher’s Least Significant Difference (LSD) test was used to determine statistical differences in means as a function of treatment for each variable, at each harvest.

3. Results and Discussion

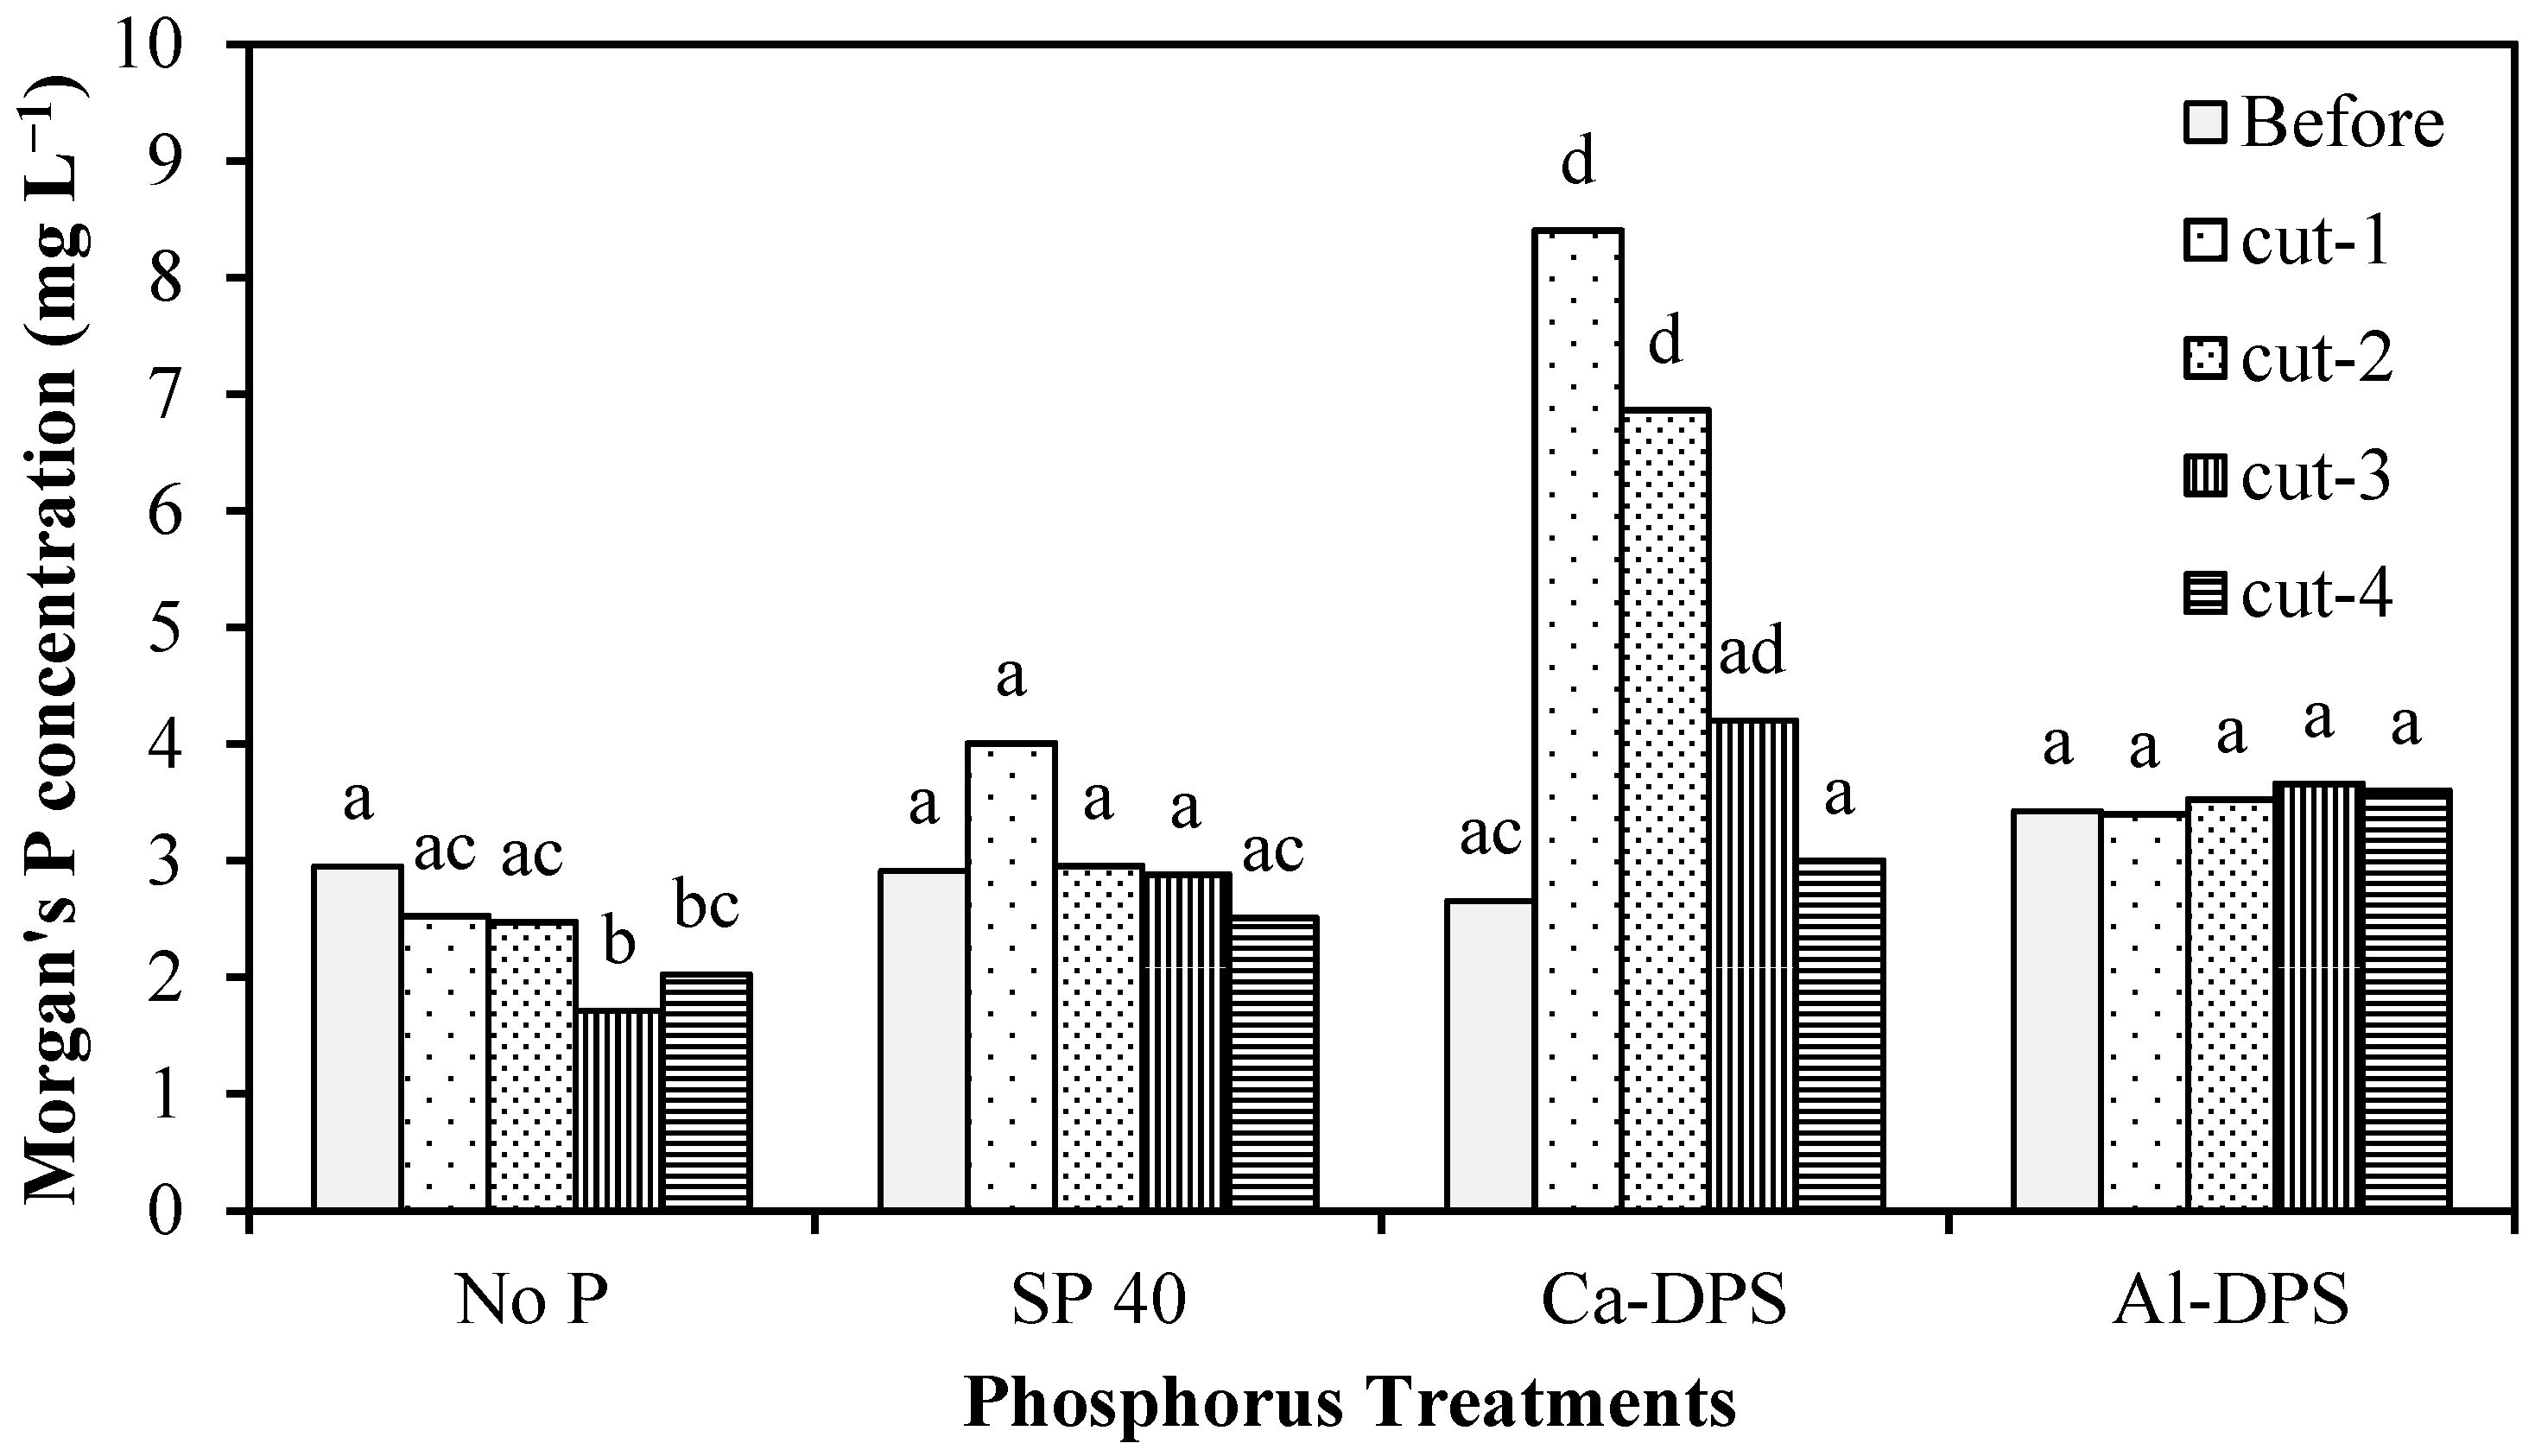
3.1. Soil P and pH Change

The soil test P level was not significantly different (p > 0.05) between pre- and post-harvest soils across treatments receiving P. However, where no P was applied Morgan’s soil P concentrations decreased significantly (p = 0.0026) (Figure 2). The result indicates that the crop removal of P (between 28.1 and 33.4 kg ha−1 over the course of the experiment) across P treatments was replenished by P applications. This contrasts with the zero P application (i.e., control plots) where the plant removal of 26.2 kg ha−1 caused plant available soil P concentration reduction of 1 mg/L (33% drop) compared to their initial levels. This is a quite a rapid decrease within one year. In comparison, Sheil et al. [28] reported a 45 to 50% drop of soil test P (a reduction of 1.4 and 2.2 mg L−1 comparing to their initial values 3.1 and 4.4 mg L−1, respectively at two sites) in zero P plots over 17 years compared to initial values in a grassland P experiment. Similarly to the current experiments, Sheil et al. [28] observed annual P uptake of 20 to 28 kg P ha−1 year−1 for zero P plots, indicating that even at relatively low available soil test P values some soils continue to supply significant levels of P. However, annual P fertiliser applications of greater than 30 kg ha−1 year−1 were necessary to maintain soil test P levels at their initial levels in the experiment of [28]. Promisingly for the DPS, both provided enough plant available P to give similar yield to the mineral P 40 treatment while maintaining soil P level at the end of the experiment at similar level to the beginning. Ashekuzzaman et al. [32] reported that the application of both Al- and Ca-DPS in grassland soil with optimum plant available P (P index 3 at Morgan’s P concentration of 6.0−6.5 mg L−1) also showed no significant change in soil test P level while provided similar biomass yield and P uptake comparing mineral P fertilisers. No statistical difference in soil pH was attributable to the application of either the Al-DPS or the Ca-DPS. The soil pH at the beginning of the experiment was 5.6 and at the end 5.8 for Al-DPS and 5.9 for the Ca-DPS.
In the present study soil samples were collected before the experimental treatments were applied and after each of the four harvests. Tracking soil test P levels is an important way in which the environmental impact of the use of DPS can be assessed and over application of P avoided. However, for this type of material it is an open question as to how long to wait between application and sampling to get a true picture of soil test P, a question which is important for practitioners. From Figure 2 it can be seen that Ca-DPS behaves differently to SP mineral P and Al-DPS in terms of soil test P availability estimates. For Ca-DPS, a large and significant increase in soil P was observed following Ca-DPS application. The reason of this increase of Morgan’s soil P concentration with only Ca-DPS (first and second harvest soil samples) is likely an artefact of the Morgan’s P test, given that there was no increase of plant P uptake and P concentrations, compared to Al-DPS or SP 40. Morgan’s P reagent (at pH 4.8) is designed to dissolve plant available P i.e., orthophosphate ion (PO43−) in soil extracts and this has been shown to over-estimate plant available P in high Ca soils [23] where recalcitrant fractions of Ca-P are extracted by the reagent under high Ca conditions [33] therefore exaggerating the available pool. Future work is suggested to include alternative P extracting methods such as sodium bicarbonate (NaHCO3) extractable-P (Olsen-P), in addition to Morgan’s reagent, so that confounding factors that mask available p values can be observed. When dealing with high Ca and Al dairy sludges, the NaHCO3 extractant (Olsen P test, [34] might be better suited to elucidate plant available P in soil with neutral and slightly acidic pH 6 to 7 [35]. However, following the final harvest in February P levels had declined to levels not different from the beginning or the other treatments. These results indicate that the passage of a growing season and winter will allow for soil test P estimates to settle and that a spring sample can be used to evaluate the effect of last season’s applications and determine an appropriate application strategy for the following season.

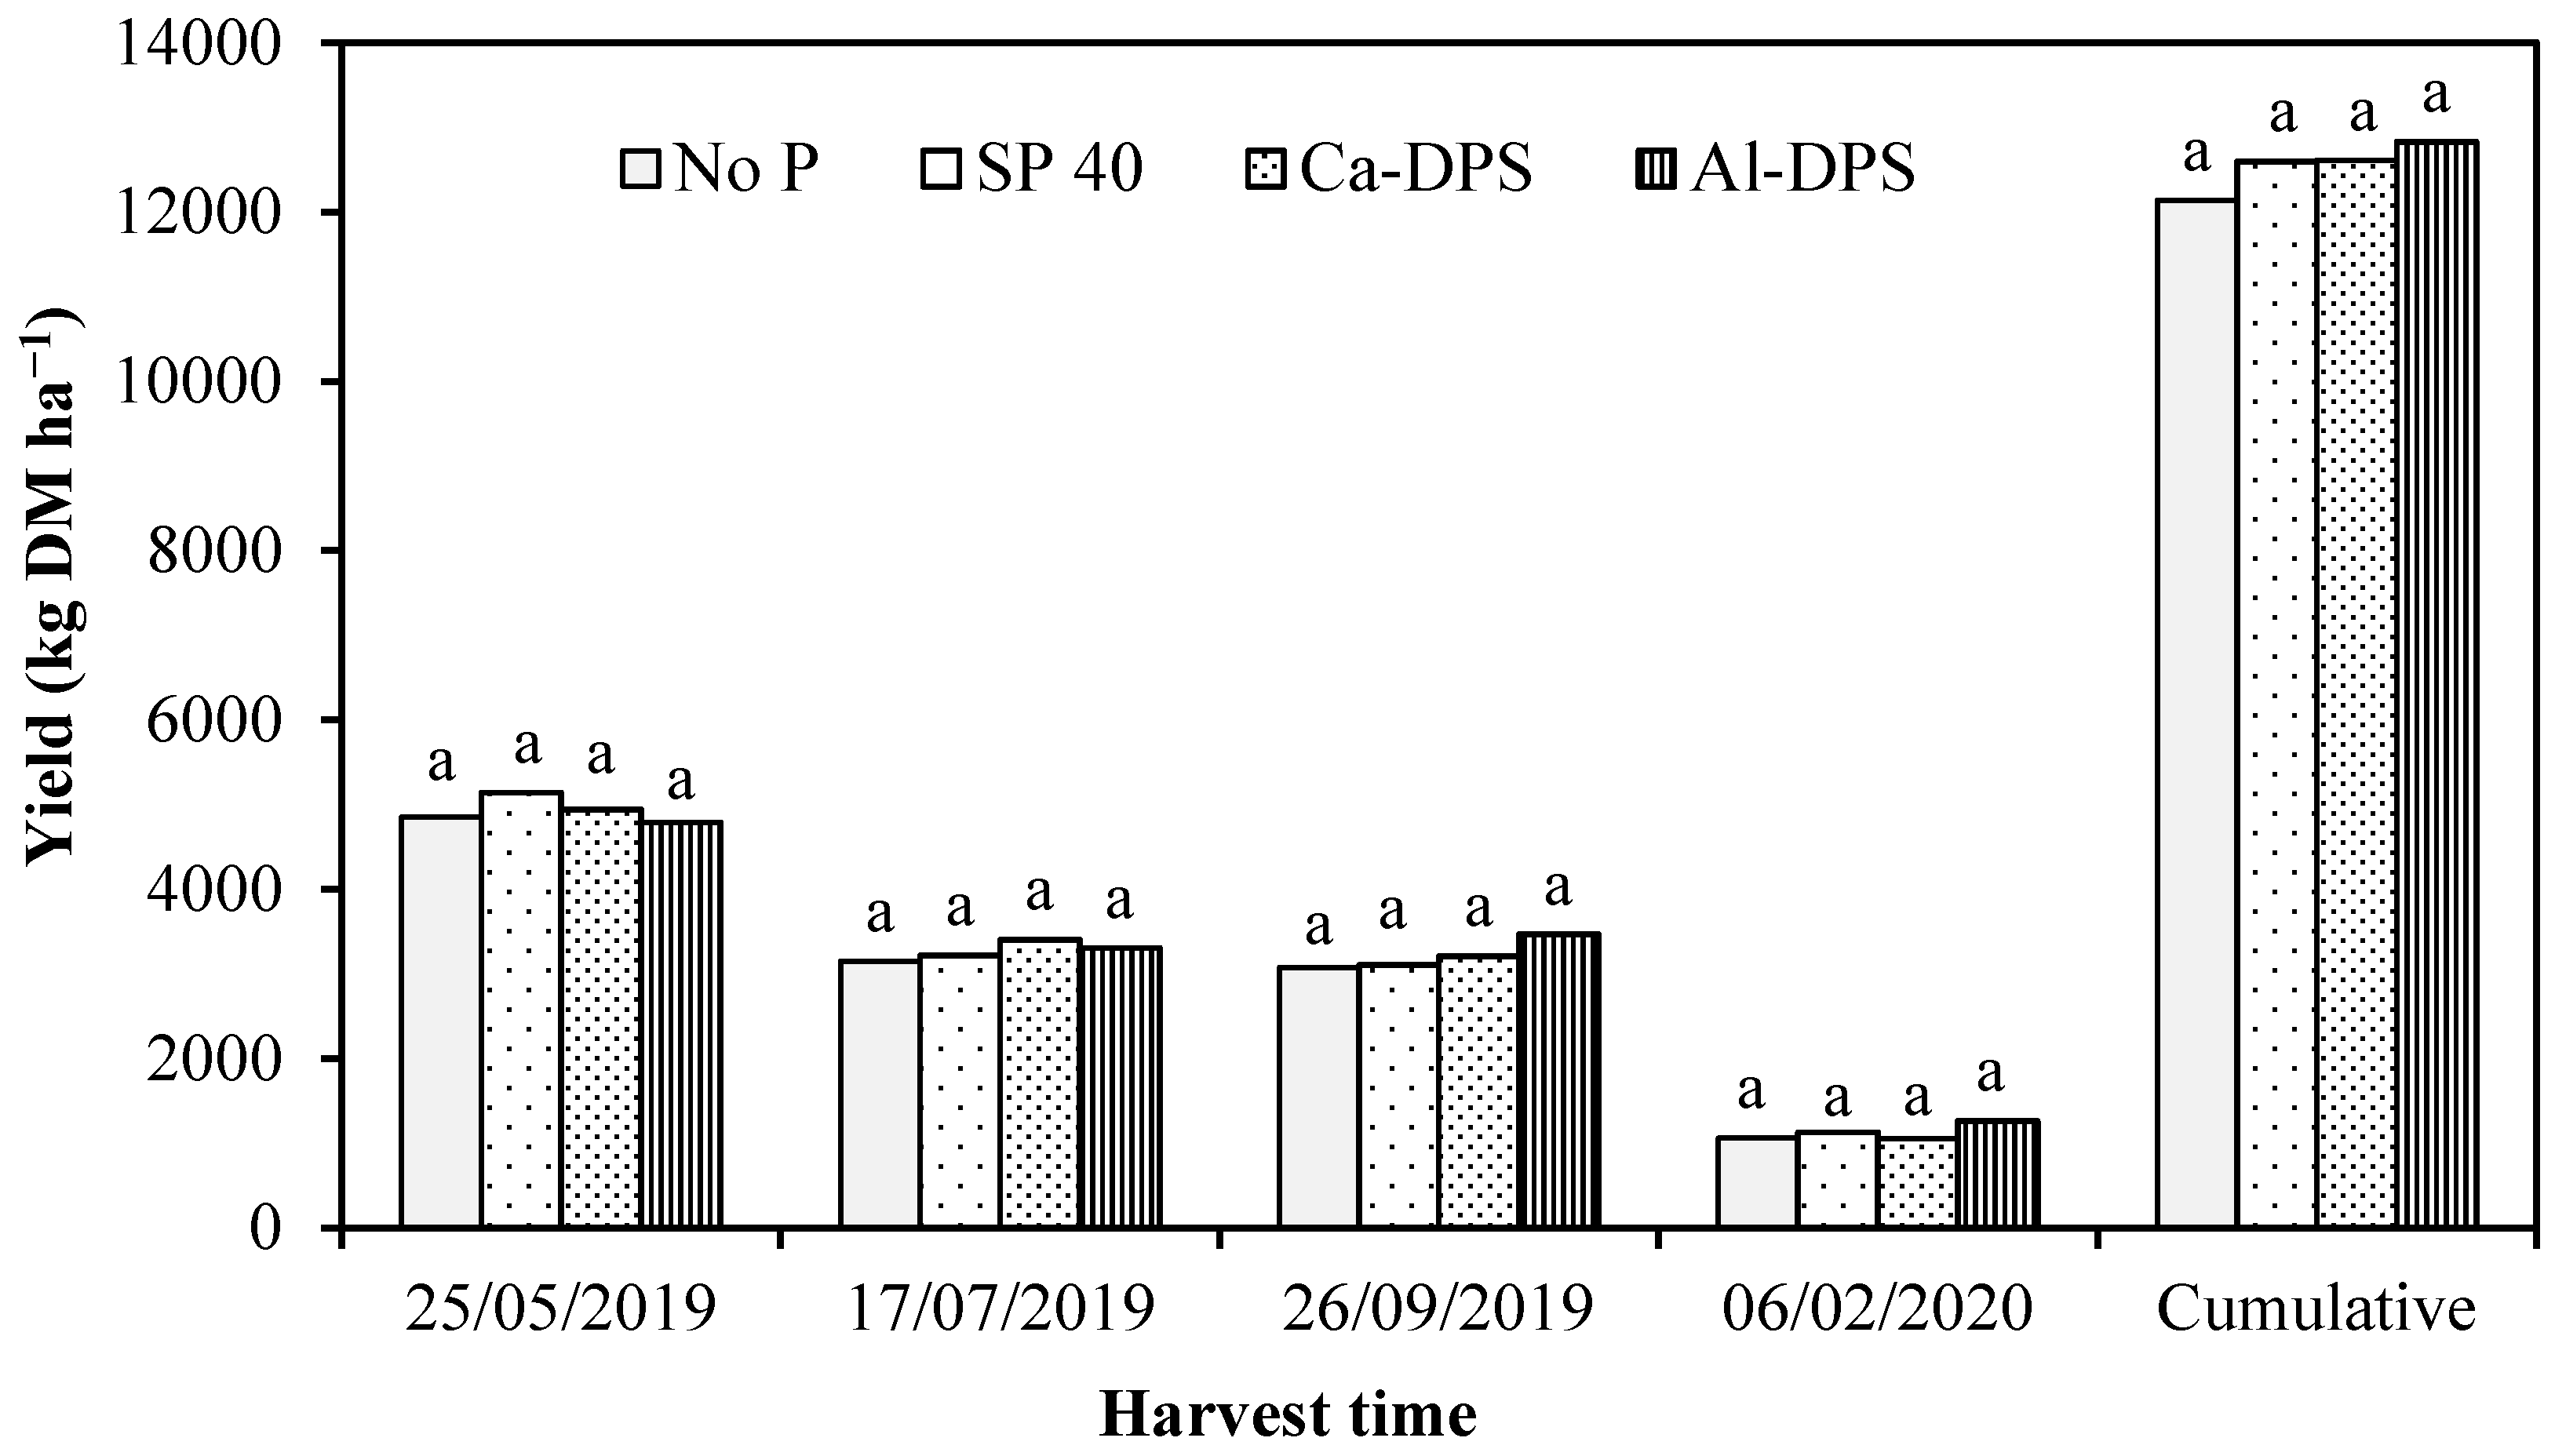
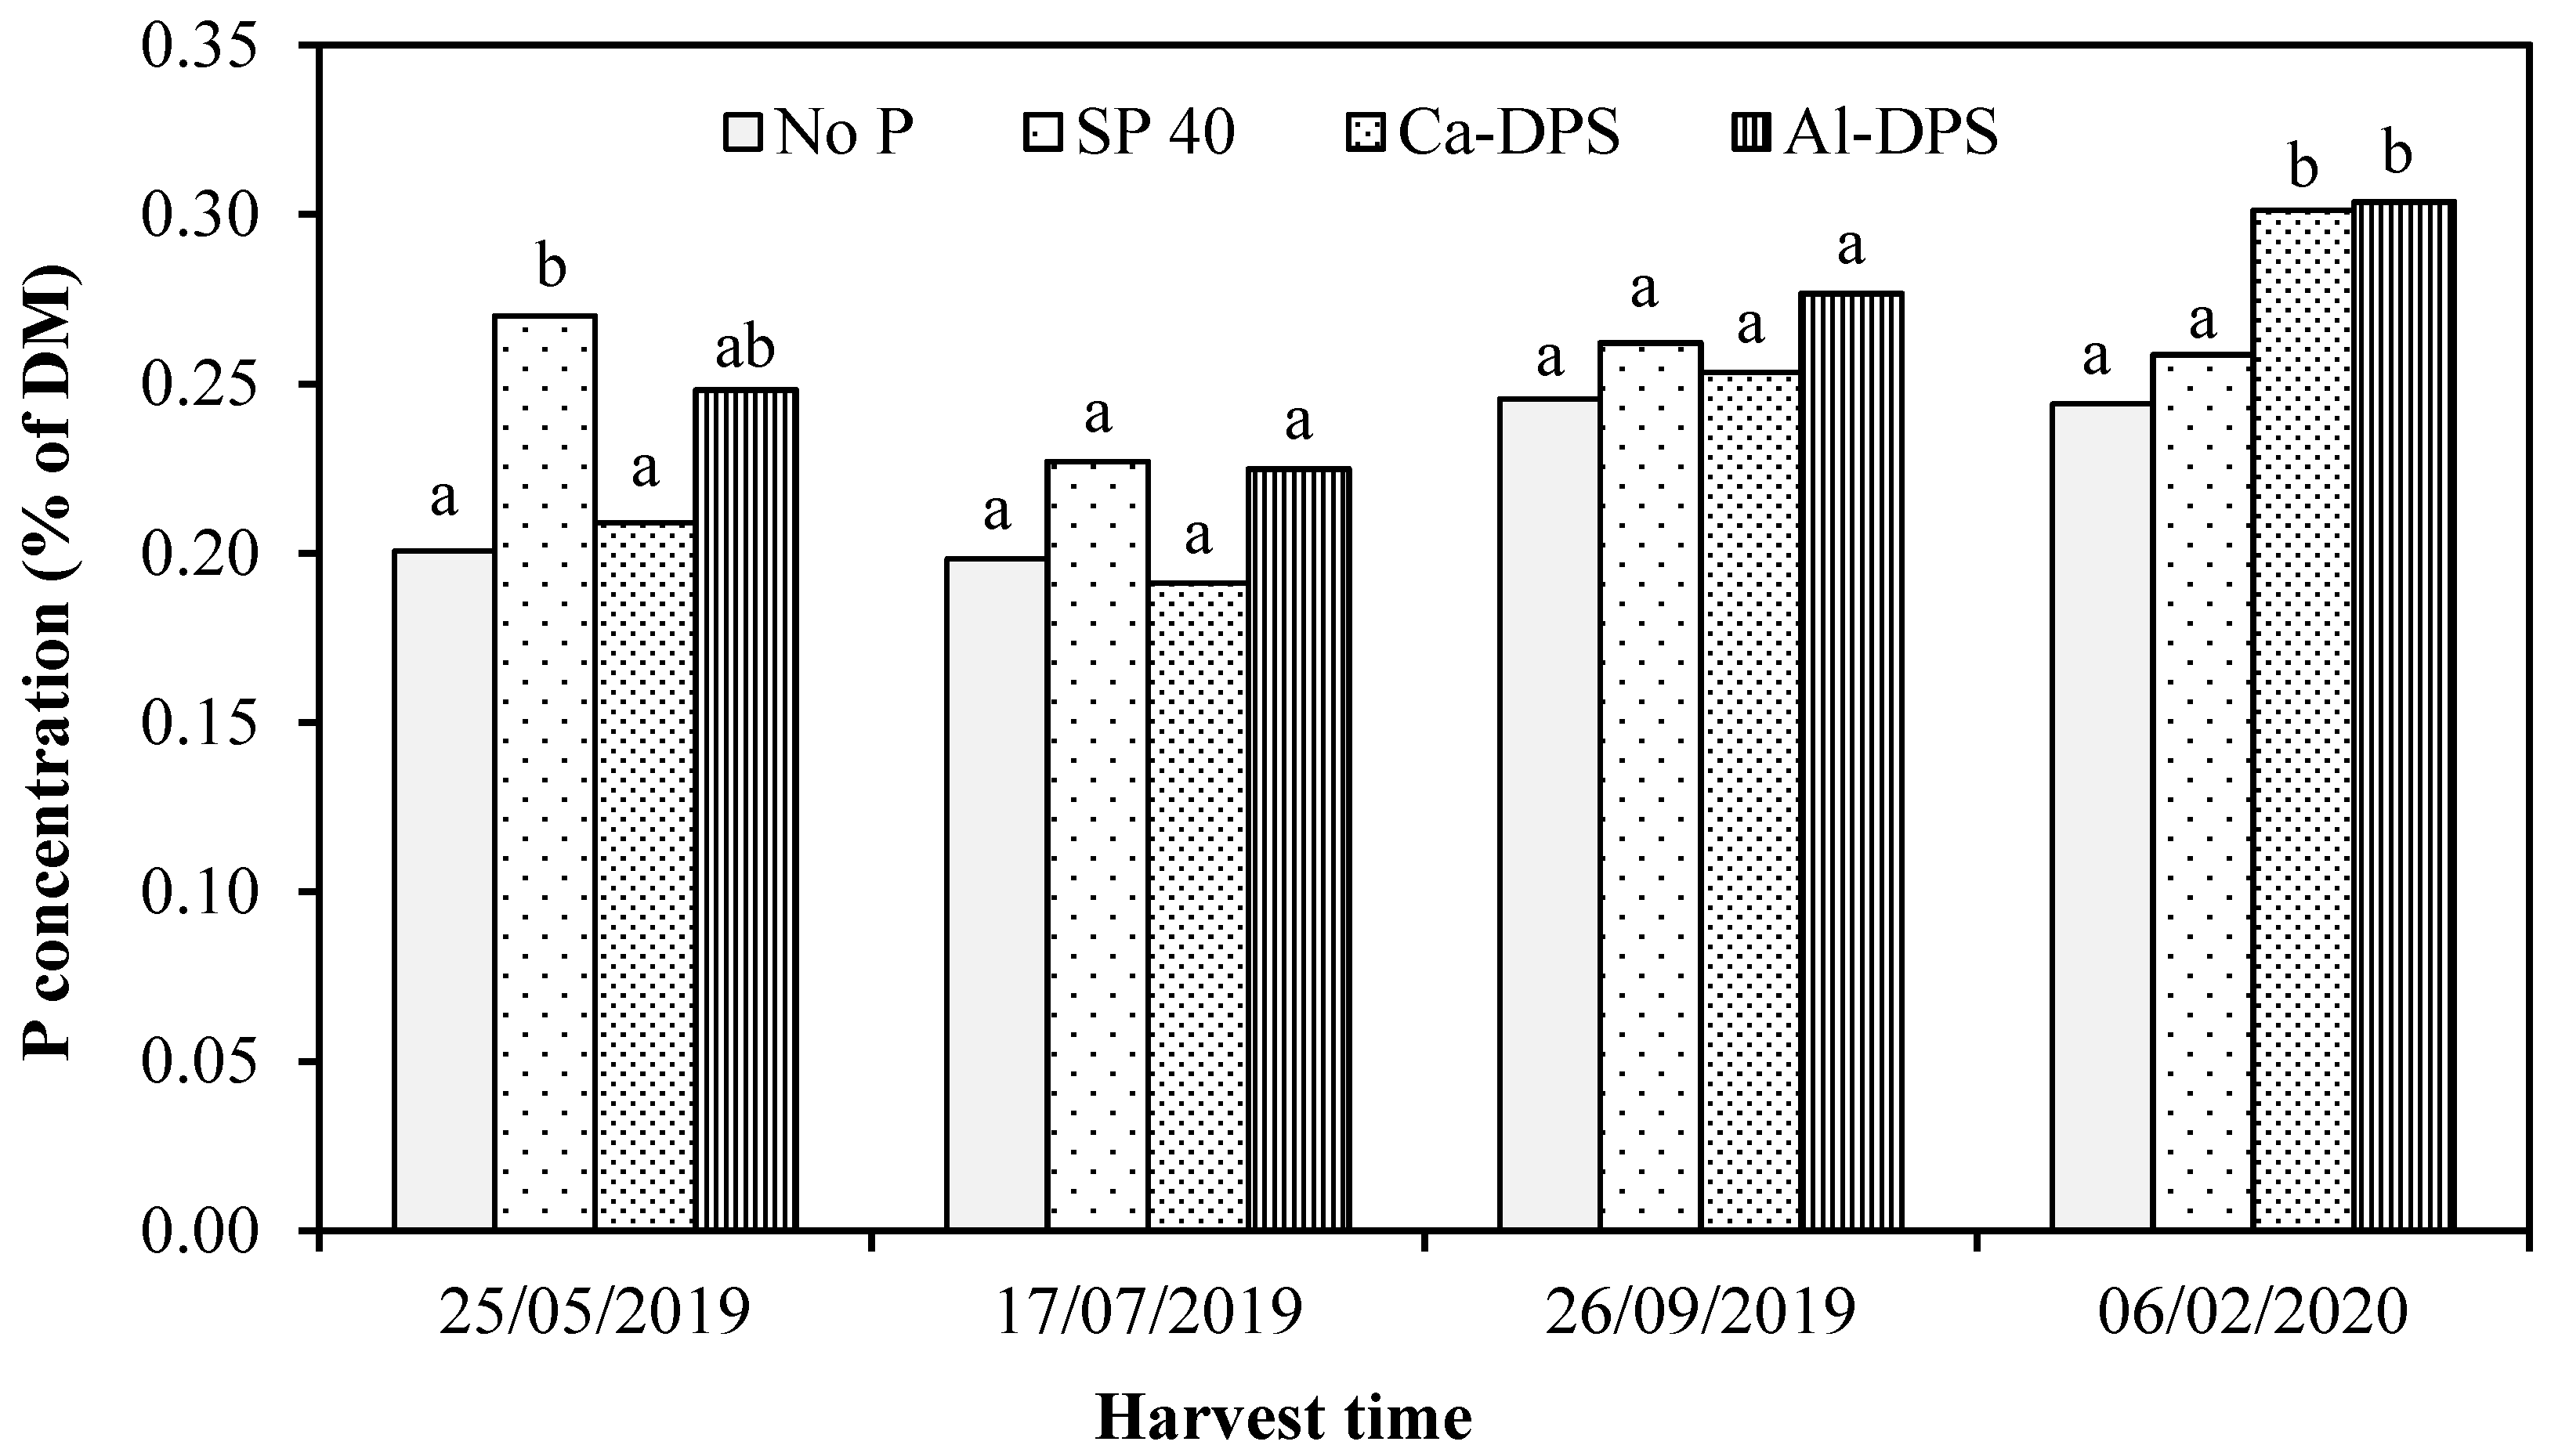
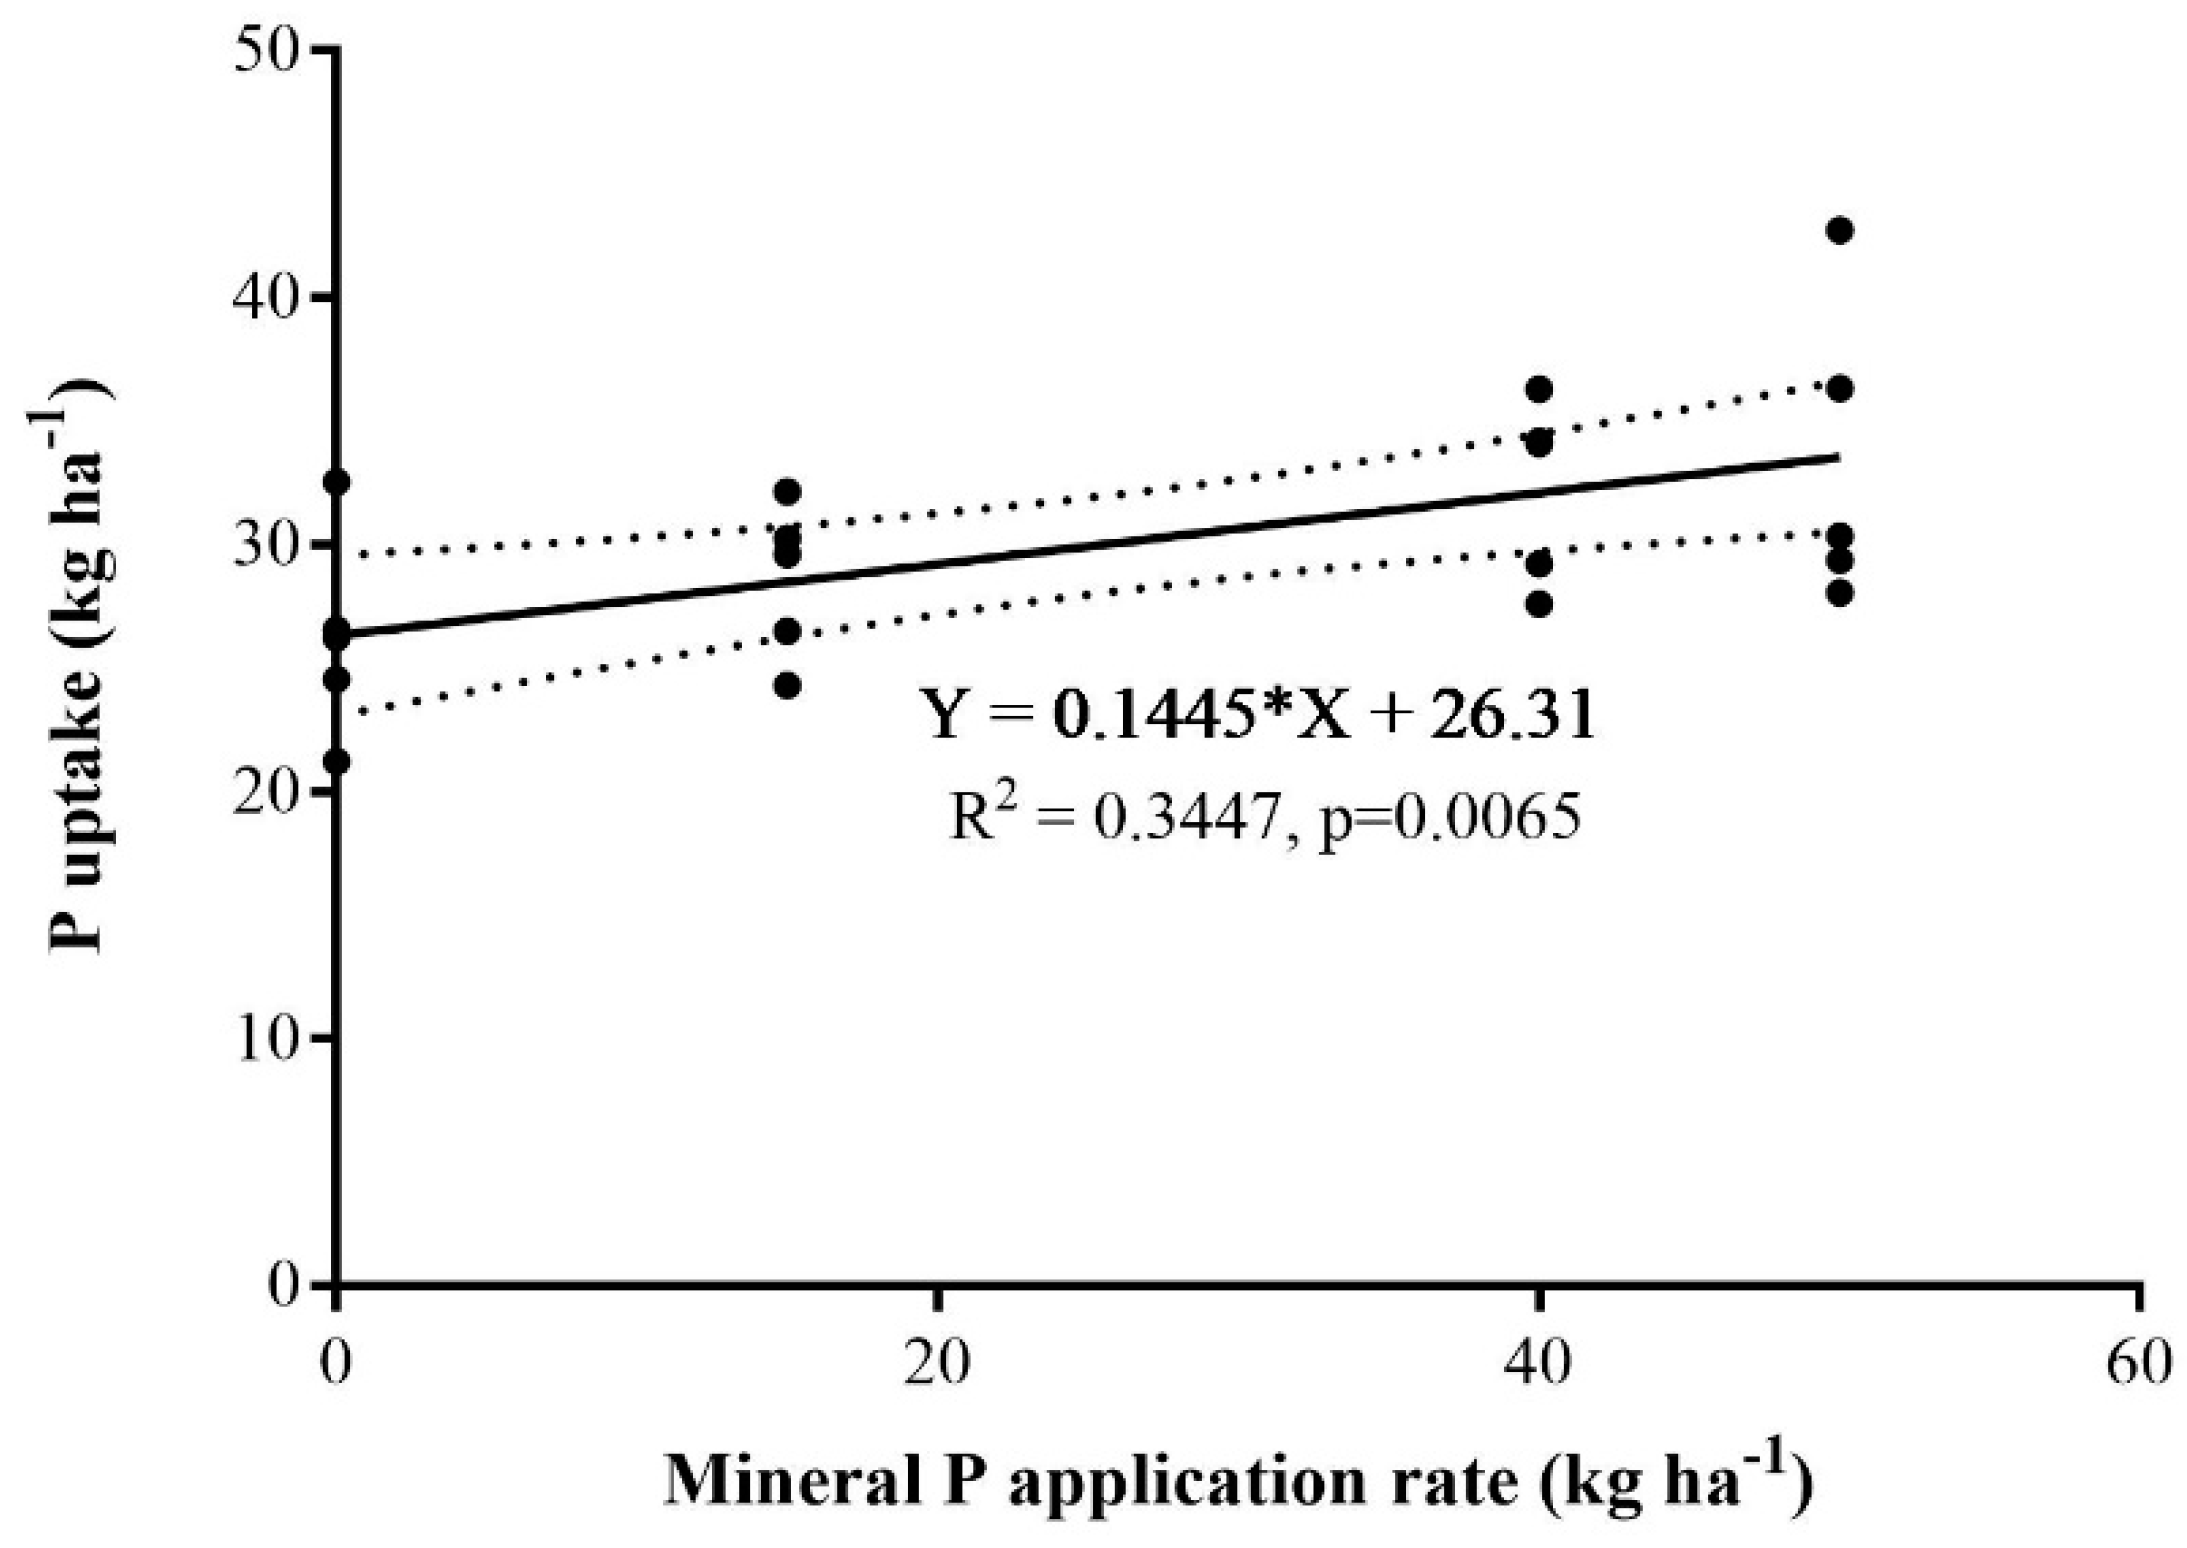
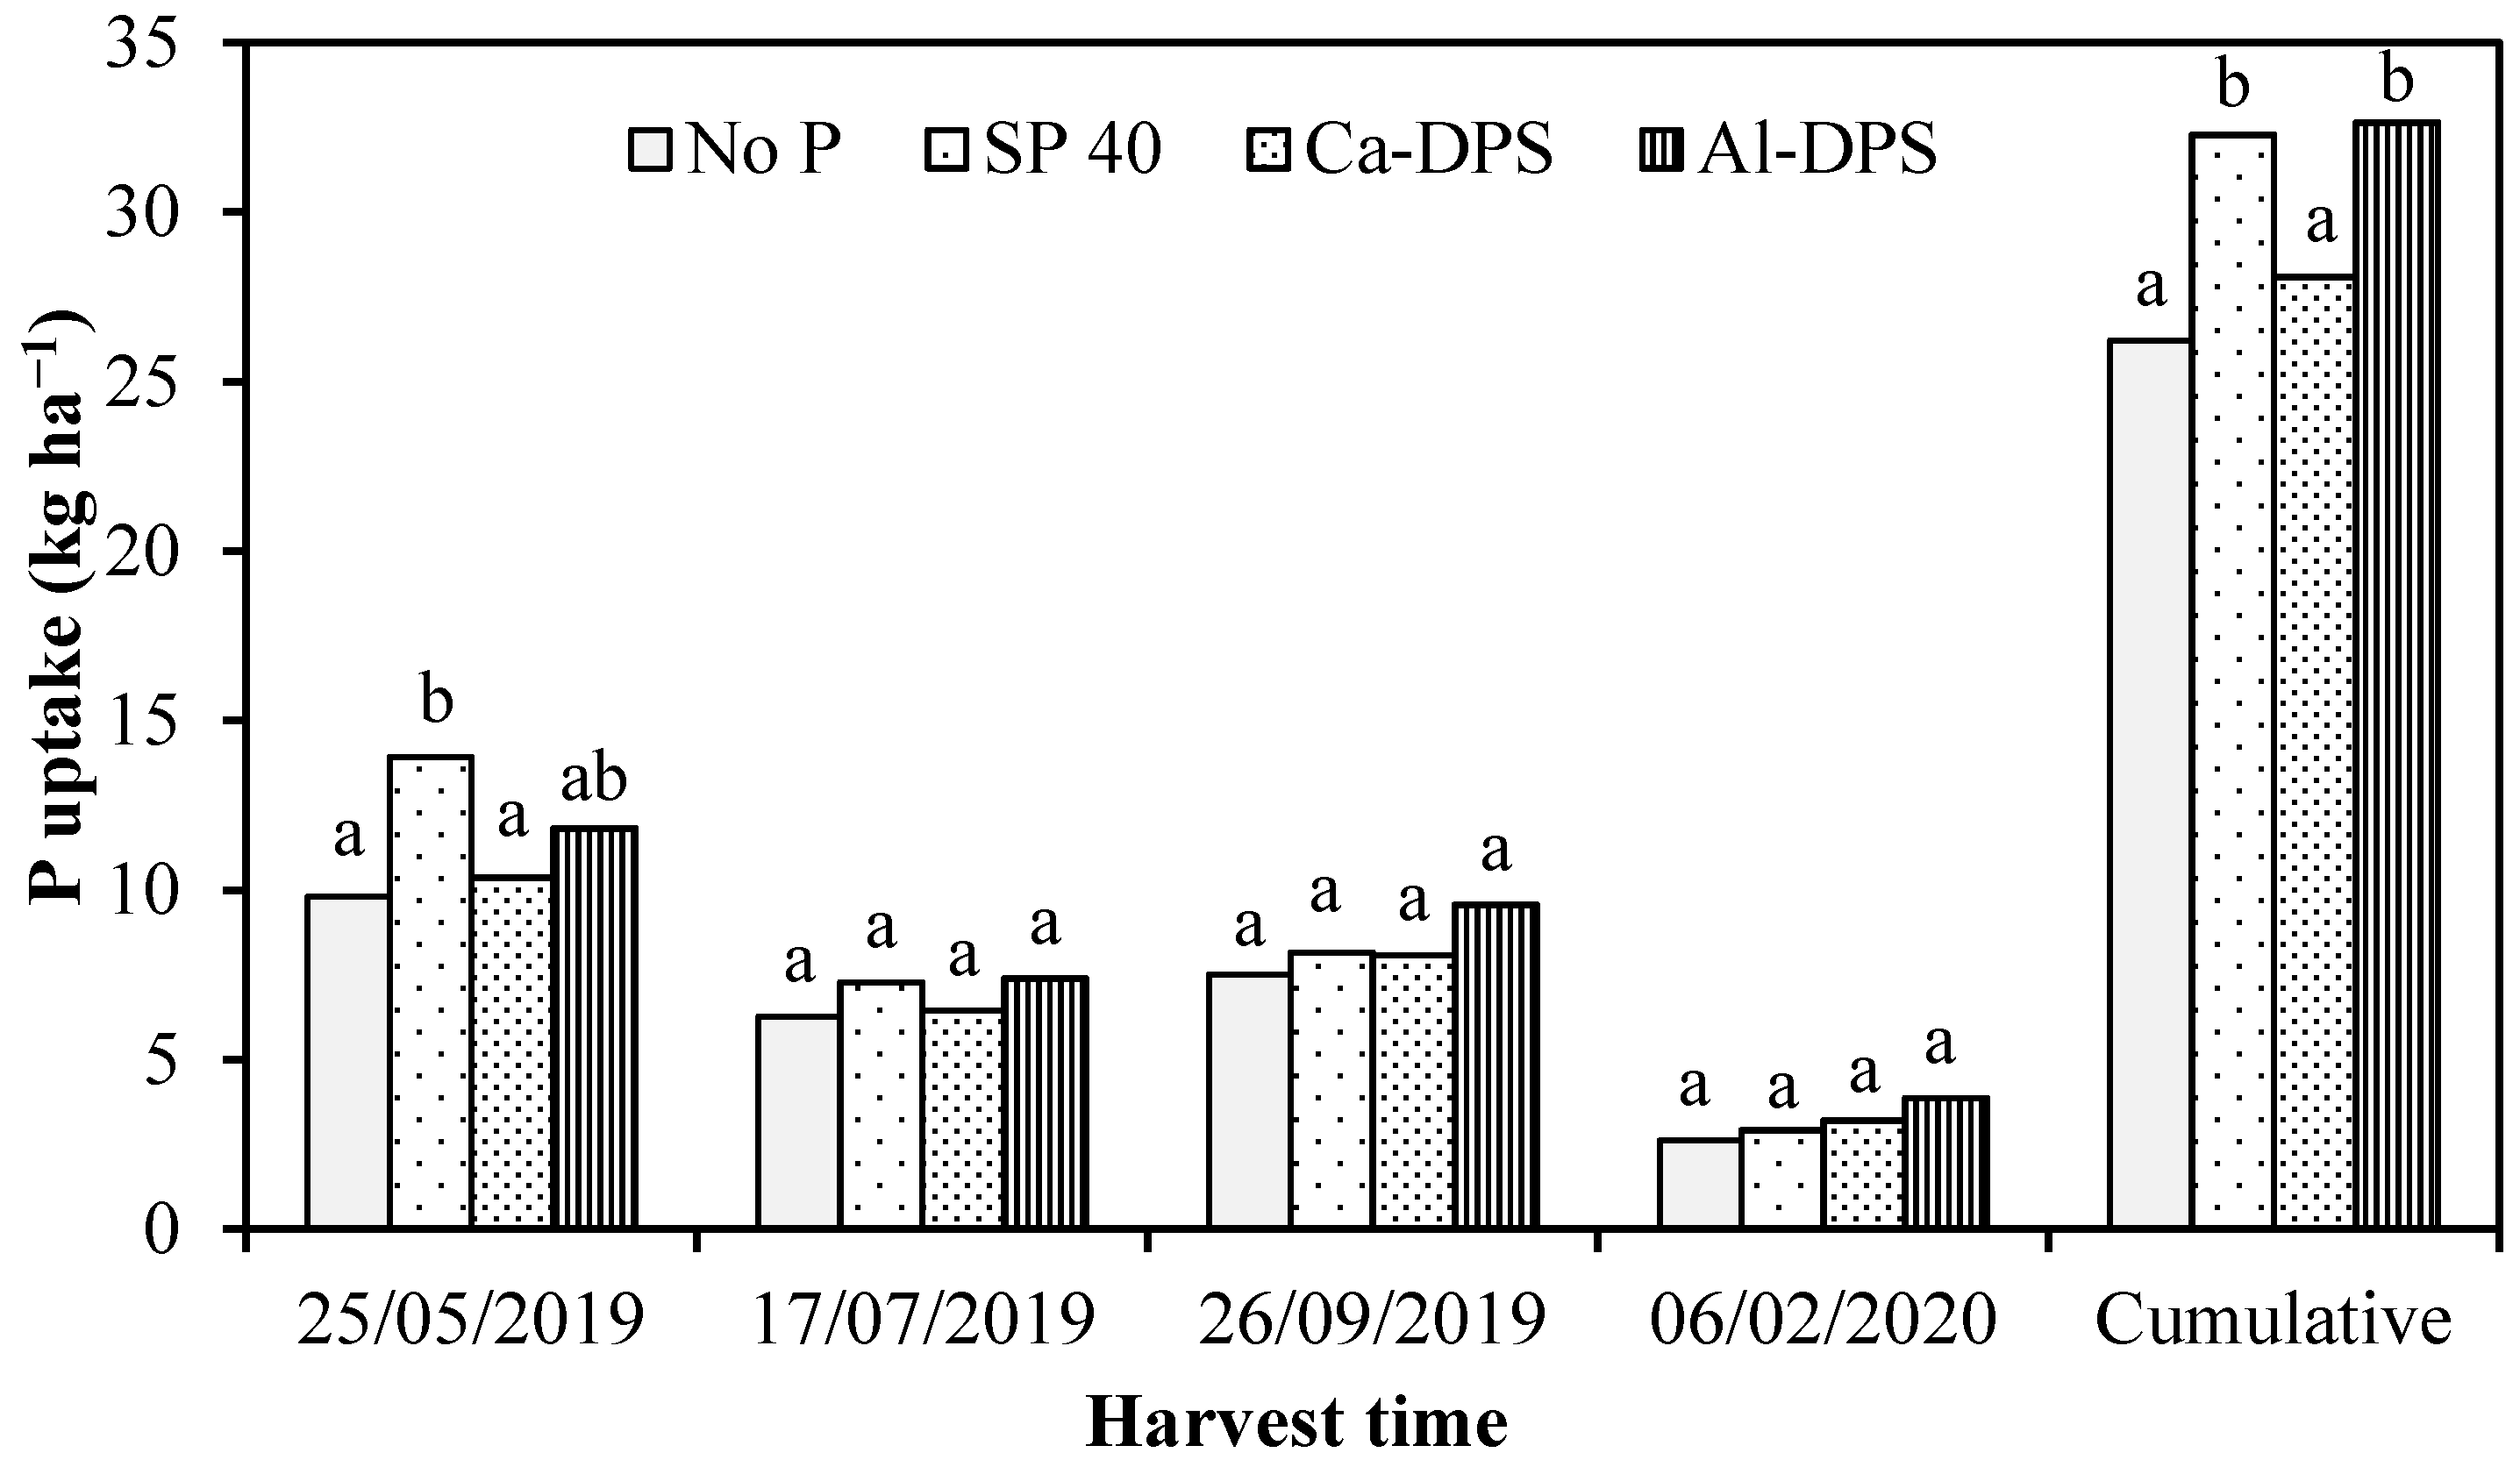
3.2. Grass Yield and P Uptake

The mean grass dry matter (DM) yield for the experimental treatments is presented in Figure 3. No significant (p > 0.05) effect of P application was observed at any harvest (Figure 3 and results for different dose of mineral P application is shown in Supplementary Table S1), this contrast with Table 2 which indicates that a response to P is definite at P deficient soil i.e., at a soil test level of 0−3 mg L−1. A number of studies with bio-based recycling (e.g., struvite, FePO4-sludge) or organic P fertilisers (e.g., digestate, manure) also reported no difference on the biomass yield with regards to the effect of P treatments, rate and type [36,37]. In the present study, the total yield across four harvests resulted cumulative DM yields 12.5−13.2, 12.6−12.8 and 12.1 tonnes ha−1year−1, respectively, for mineral P fertilisers, DPS treatment and zero P treatment. These values are comparable to what is typically observed in relevant Irish agricultural soil, for example, annual grass DM yield was observed to be varied between 6.83 to 12.96 tonnes ha−1 for zero P application and 8.65 to 13.2 tonnes ha−1 for 45 kg-P ha−1 application, respectively, over 17 years of Irish grassland P experiment [28]. While significant differences relating to yield were absent, P uptake can be more sensitive to treatment differences by taking into account of crop P concentration and biomass yield [37,38].
In contrast to the grass yield result, the grass P concentrations varied significantly (p = 0.002) due to the applied treatments. A significant treatment effect was detected at harvests 1 (p = 0.006) and 4 (p = 0.012) (Figure 4). In particular, for the first harvest mineral P treatments of 40, 50 and 60 kg ha−1 had significantly higher herbage P concentration compared to the control (i.e., zero P) and Ca-DPS (results for different dose of mineral P application is shown in Supplementary Table S2). At harvests 2 and 3, the P treatment effect on herbage P concentration was not significant. At harvest 4, the herbage P concentrations due to both DPS treatments were significantly higher than for the mineral P treatments at 15, 40, 50 kg-P ha−1 and control, respectively, while P concentrations between control and mineral P treatments did not vary significantly (Table S2). The herbage P concentrations results from recurring harvests indicate that plant P availability from Ca-DPS is significantly lower compared to the reference mineral P (40 kg ha−1) in the short-term. However, in later harvests, this difference was absent or indeed the DPS resulted in significantly higher herbage P concentration in the final residual cut. A similar trend for increased P concentrations in the herbage in the final harvest was observed for Al-DPS, however, unlike the Ca-DPS the Al-DPS had the same levels of P concentration as the mineral P 40 kg ha−1 in the 1st harvest, indicating rapid availability.
The yield results comparing zero P to mineral P fertilisation treatments shows that the P scavenging capacity of established grassland appears to be high along with the capacity for yield to mask a reduced P uptake. Although significant differences relating to yield were absent, there was clear indication of P deficiency in herbage and soil plant available P level due to zero P application compared to reference mineral P at 40 kg ha−1. For example, average grass P concentration was 0.22% for zero P treatment and 0.26% for mineral P 40 treatment. The herbage P concentration of 0.21% i.e., 2.1 g kg−1 DM of grass was reported to be critical compromising yield as per [39]. Moreover, with zero P application the plant removal of 26.2 kg ha−1 caused a 33% drop in plant available soil P concentration compared to their initial levels while no such drop observed for mineral P 40 treatment. This is an indication that P uptake can be more sensitive to treatment differences by taking into account of crop P concentration and biomass yield, similar observation was also reported in other study e.g., [37]. In addition, the yield sensitivity might be also related to agro-meteorological, physiological and phenological processes that are involved in nutrient utilisation and the production of total herbage mass, which are not reflected in soil tests and hence outweigh the effect of P to be easily detectable from P fertilisers [40,41]. Future studies may consider a more P sensitive crop, but this study provides the case for grass representing Irish grassland silage production system where DPS will mainly be used in Ireland.
Total P uptake during the measurement period showed a significant positive relationship with P application rate as evidenced by a significant slope (p = 0.0065) (Figure 5). This is an indication that the experimental site with P deficient soil (P index 1) was responsive to increasing rate of mineral P application, in terms of P uptake at an initial Morgan’s soil test value of 2.86 mg L−1, though not in yield at least in the first year. Previously, Ashekuzzaman et al. [32] reported no P uptake or yield response at a grassland site with adequate soil P status (Morgan’s P concentration 6.8 mg L−1 i.e., P index 3). As a result, P bioavailability value of DPS products could not be quantified in that study.
Environmental and cost considerations have increased the interest in boosting N use efficiency (NUE), with soil fertility and other nutrient, including P availability seen as potential tools to lift NUE. Under a grassland cutting system Forrestal et al. [42] reported apparent N recovery of 56 to 75% (mean 67%) for three N fertilisers five rates of N applied at three sites over two growing seasons and receiving P as per soil test recommendations to ensure P was not limiting. This shows evidence that NUE can be achieved >70% where soil pH, P and K are at adequate level. A recent study across 21 intensive dairy farms in Ireland showed a trend for higher NUE in higher P status soil (59% under P index 3) compared to low P status soil (50% under P index 1) [43]. This shows the importance of maintaining sufficient P bioavailability in soil not only to meet crop uptake demand but also to improve NUE. In the present study however NUE was found to be similar (not significant) between mineral P application rates including the zero rate (Table 3). This is an interesting observation requiring a longer-term evaluation as it goes against the general consensus that applying P to a soil with very low P status, such as the site in question, would be expected to increase NUE. In terms of DPS effects, a clear contrast in NUE was noted between Ca and Al-DPS with a 10-percentage point lower NUE observed for Ca-DPS compared to reference mineral P applied at 40 kg ha−1. The Al-DPS has a 12-percentage point higher NUE compared with the Ca-DPS. This might be an indication of higher N volatilisation losses from mineral N fertiliser input in Ca-DPS receiving plots compared to mineral P 40 plots due to interaction with lime treated Ca-DPS (with alkaline pH) during fertiliser application. Further study on the aspect of mineral N fertiliser application timing and its interaction with Ca-DPS or other relevant bio-based products with alkaline pH needs to assess if NUE and N uptake due to application strategy are significantly affected.

3.3. P Bioavailability

Treatment differences in P uptake were most apparent in the first harvest after treatment application where uptake by mineral P 40, 50 and 60 kg ha−1 are significantly higher comparing the control and Ca-DPS (Figure 6 and results for different dose of mineral P application is shown in Supplementary Table S3). Although no significant (p > 0.05) treatment effect on P uptake was observed in the second or subsequent harvests, the mean P uptake of recurring harvests by the mineral P 30, 40, 50, 60 kg ha−1 and Al-DPS are significantly higher than for the control, the mineral P 15 kg ha−1 and the Ca-DPS. The cumulative P uptake from reference mineral P 40 kg ha−1 and Al-DPS was similar but both of them showed significantly higher P uptake than Ca-DPS.
For the soil test P of index 1 the APR was determined to be between 5.7 and 10.9% in the 1st harvest for the mineral P treatments (Table 4). Over the course of the season cumulatively the APR increased to between 11.8 and 20.3% of the total P applied. The highest APR of 20.3% was observed at mineral P rate of 30 kg P ha−1. Our results corresponded well to the typical P fertiliser efficiency of 10 to 25% commonly seen in the year of application [44]. However, over the long-term APR may increase as soil test P levels of zero P plots were observed to decrease (Figure 2). For example, in a long-term Irish grassland P experiment (17 years), Sheil et al. [28] with soil test P levels of 4.4 and 3.1 mg L−1 (Index 2) observed APR 37 to 47% in fine loam soil and 46 to 57% in coarse loam soil for annual P fertiliser application rates of 15, 30 and 45 kg ha−1 (with highest APR observed at the 15 kg ha−1 rate at both site).
The 1st harvest APR for the DPS treatments (Ca-DPS 1.4% and Al-DPS 5%) was much lower than for the reference Mineral P fertiliser, for which APR was 10.3% at the same P application rate. However, when P uptake from subsequent harvests was considered APR for the reference mineral P fertiliser increased to 15.2% vs. a similar level of 16% for the Al-DPS but a lower level of 4.7% for Ca-DPS. These results demonstrate that mineral P fertiliser is initially much more readily available for plant uptake than either Al-DPS or Ca-DPS. However, over the course of the growing season the Al-DPS can match mineral P perhaps indicating that it feeds out P more rapidly or is less prone to lock up in the soil compared to the mineral P. The Ca-DPS provided plant available P only sparingly compared to the mineral P or the Al-DPS.
The P FRV of Al-DPS in comparison to reference mineral P (applied at 40 kg ha−1) is determined to be about 50% in the 1st harvest which eventually reached to 109% within the first year (consisting of four harvests) as quantified by RPE and FPE method. For Ca-DPS, P FRV is only about 16% in the first harvest that increased to about 31% for the first year. The results demonstrate that P bioavailability from the Ca- and Al-DPS product is very different and they should not be treated the same when used as P fertilisers. This is important information for incorporation of these materials into fertiliser programmes.
The P availability of different bio-based fertilisers is known to vary widely as a result of origin, composition, biological and bio-chemical mineralization processes affecting the availability of P to plants in different cropping system [19]. As both DPS in this study originated from dairy wastewater treatment process, their composition (Table 1) reflects the presence of Al and Ca which is associated with Al salts and lime addition during wastewater treatment to remove P from the secondary effluent. The composition analysis of 63 DPS samples from nine dairy food processing wastewater treatment sites showed that Al, Fe, Ca and P content vary greatly as there is no standard chemical treatment use across different sites [8]. This is expected to have important implications for the P availability for this material and it should not all be assumed to have the same P availability as the present study demonstrates. Research has found an association between the amount of Al and Fe in wastewater treated sludge and P availability to plants from the sludge. A 27 to 85% P bioavailability was reported from sewage wastewater treated biosolids depending on the total concentration of Al and Fe content [26]. According to their study, sewage sludge derived biosolids having the Al+Fe total concentration of 260–400, 400–1100, 1100–2800 and 2800–4600 mmol kg−1 can be classified to be predicted for very high, high, medium and low P bioavailability, respectively. In comparison the Al-DPS used in the present study had an Al concentration level of 30,272 mg kg−1 ≈ 1122 mmol kg−1 which did not limit P bioavailability for the season overall. However, the total concentrations of Al and Fe need to be carefully monitored in the wastewater treated sludge because high concentrations (e.g., ≥2800 mmol kg−1) of either or both may significantly reduce P bioavailability.
The reason for low P bioavailability from Ca-DPS might be associated with its high Ca content (240,532 mg kg−1 ≈ 6013 mmol kg−1) because total Al+Fe content in this DPS was only 130 mmol kg−1. The amount of Ca content exceeding a molar Ca:P ratio of 2 in organic fertilisers (e.g., compost and biochar) can negatively affect the P availability for plant uptake due to formation of low soluble Ca-P compounds such as hydroxyl-apatite (Ca3(PO4)2Ca(OH)2), formation of which is favoured in alkaline conditions [25]. In our study, the Ca/P molar ratio in Ca-DPS was 1.84 which with a pH 7.7 might be associated to the formation such low soluble Ca-P compounds potentially explaining the low P bioavailability of Ca-DPS observed in the first year. In a recent study, Vanden Nest et al. [25] investigated 50 organic fertilisers including biochar, compost, digestate, animal manure and blends of these materials for their P use efficiency (PUE) in greenhouse pot trials using ryegrass in a P deficient acid sandy loam soil. According to their study, apatite formation in biochars and composts (these had pH between 7.3 and 10.7, and Ca/P molar ratio between 3.9 and 22.1) during the production processes was the main reason for decreased P availability. As the Ca-DPS treatment demonstrated much lower P availability in the first year compared to the mineral P 40 treatment and Al-DPS, we suggest that longer-term effects could be important to investigate in a multi-year experiment. Future studies should carry on investigating details of Ca-DPS chemical properties e.g., Ca-P mineral forms, inorganic and organic P fractions, and its effect on soil P dynamics to better understand P availability in soil and P uptake by plants.
The P FRV from this first-year study of the two DPS samples provides a quantitative fertiliser effect compared to the mineral P fertiliser. These findings should change the perception of these materials and shift them from secondary P sources to bio-based fertilisers. The data presented herein provides the necessary information to support improved incorporation into fertiliser programmes vs. using total P content values. This in turn will aid in more bespoke applications avoiding crop deficiencies due to under application and environmental risk due to over application. The findings in this study are more relevant to grassland systems in Ireland with particular association for well-drained sandy loam soil. However, it may not be rational to interpret these results for different environmental conditions including soil type, soil pH, soil Al and Fe contents, soil organic matter, climatic conditions such as precipitation and air temperature, method of application and storage time, because these factors are known to affect P availability in plants [44].

4. Conclusions

Aluminium precipitated activated sludge (Al-DPS) and calcium precipitated lime-stabilised sludge (Ca-DPS) both derived from the milk processing industry differed in their crop P availability and fertiliser replacement values. While Al-DPS was equivalent to mineral P fertiliser in terms of growing season P availability (P fertiliser replacement value 109%) it was initially more slowly available compared to mineral P. The Ca-DPS had low initial and season long P availability compared to mineral P and Al-DPS with a P fertiliser replacement value of only 31%. The presence of high Ca content (Ca/P molar ratio 1.86) and alkaline pH in Ca-DPS is likely to have promoted the formation of low soluble Ca-P compounds and low P availability. Assessment of Ca-DPS performance over a longer term in a multi-year P availability experiment is warranted. The use of mineral P fertiliser or dairy sludge products maintained soil test P levels. However, the absence of P application caused a 33% or 1 mg L−1 drop in Morgan’s soil test P indicating P mining. Mineral P application did not affect N use efficiency in this single year study, though longer-term effects cannot be ruled out. These findings will aid the dairy industry and related stakeholders (farmers, nutrient advisors) to utilise dairy processing sludge as bio-based recycled P alternative to mineral P fertiliser. This new information on P availability will aid the appropriate incorporation of dairy sludge into the nutrient management programmes supporting growth of the bioeconomy and aiding reduced reliance on imported mineral P fertilizer.

Supplementary Materials

The following are available online at https://www.mdpi.com/2073-4395/11/3/427/s1, Table S1: Effect of treatment and rate on the grass dry matter (DM) yield. Table S2: Effect of treatment and rate on grass P concentrations across four consecutive harvestings between May 2019 and February 2020. Table S3: Effect of treatment and rate on grass P uptake across four consecutive harvests between May 2019 and February 2020.

Author Contributions

Conceptualization, S.M.A. and P.J.F.; Data curation, S.M.A.; Formal analysis, S.M.A.; Funding acquisition, E.M. and P.J.F.; Investigation, S.M.A. and P.J.F.; Methodology, S.M.A. and P.J.F.; Project administration, S.M.A. and P.J.F.; Resources, P.J.F.; Visualization, S.M.A.; Writing—original draft, S.M.A.; Writing—review & editing, O.F., E.M. and P.J.F. All authors have read and agreed to the published version of the manuscript.

Funding

This research was funded by the European Union’s Horizon 2020 research and innovation programme, grant number 773682 (Nutri2Cycle project) and The APC was funded by the project.

Institutional Review Board Statement

Not Applicable.

Informed Consent Statement

Not applicable.

Data Availability Statement

The data presented in this study are available within the article or supplementary material.

Acknowledgments

This work received funding from the European Union’s Horizon 2020 research and innovation programme under grant agreement No. 773682 (Nutri2Cycle project). Special thanks to Cathal Redmond and John Murphy for contribution in plot set-up, seasonal harvesting, sample processing and fertiliser applications. We also thank to our laboratory technical team from Teagasc Johnstown Castle Research Centre on processing samples for analysis.

Conflicts of Interest

The authors declare no conflict of interest.

Abbreviations

Al-DPS, aluminium precipitated activated sludge; APR, Apparent phosphorus Recovery; Ca-DPS, calcium-phosphorus precipitated lime-stabilised sludge; DM, dry matter; DPS, dairy processing sludge; FPE, Fertiliser P Equivalence; FRV, fertiliser replacement value; FW, fresh weight; NUE, nitrogen use efficiency; OM, organic matter; RPE, Relative phosphorus Effectiveness; SP, super phosphate; TC: total carbon.

References

  1. Nättorp, A.; Kabbe, C.; Matsubae, K.; Ohtake, H. Development of phosphorus recycling in Europe and Japan. In Phosphorus Recovery and Recycling; Springer: Singapore, 2019; pp. 3–27. [Google Scholar] [CrossRef]
  2. Chojnacka, K.; Moustakas, K.; Witek-Krowiak, A. Bio-based fertilizers: A practical approach towards circular economy. Bioresour. Technol. 2020, 295, 122223. [Google Scholar] [CrossRef]
  3. Kratz, S.; Vogel, C.; Adam, C. Agronomic performance of P recycling fertilizers and methods to predict it: A review. Nutr. Cycl. Agroecosyst. 2019, 115, 1–39. [Google Scholar] [CrossRef]
  4. EC (European Commission). Farm to Fork Strategy: For a Fair, Healthy and Environmentally-Friendly Food System. 2020. Available online: https://ec.europa.eu/food/sites/food/files/safety/docs/f2f_action-plan_2020_strategy-info_en.pdf (accessed on 1 November 2020).
  5. Slavov, A.K. General characteristics and treatment possibilities of dairy wastewater—A review. Food Technol. Biotechnol. 2017, 55, 14–28. [Google Scholar] [CrossRef]
  6. Ahmad, T.; Aadil, R.M.; Ahmed, H.; Rahman, U.U.; Soares, B.C.V.; Souza, S.L.Q.; Pimentel, T.C.; Scudino, H.; Guimarães, J.T.; Esmerino, E.A.; et al. Treatment and utilization of dairy industrial waste: A review. Trends Food Sci. Technol. 2019, 88, 361–372. [Google Scholar] [CrossRef]
  7. Daufin, G.; Escudier, J.P.; Carrère, H.; Bérot, S.; Fillaudeau, L.; Decloux, M. Recent and emerging applications of membrane processes in the food and dairy industry. Food Bioprod. Process. 2001, 79, 89–102. [Google Scholar] [CrossRef]
  8. Ashekuzzaman, S.M.; Forrestal, P.; Richards, K.; Fenton, O. Dairy industry derived wastewater treatment sludge: Generation, type and characterization of nutrients and metals for agricultural reuse. J. Clean. Prod. 2019, 230, 1266–1275. [Google Scholar] [CrossRef]
  9. Erkan, H.S.; Gunalp, G.; Engin, G.O. Application of submerged membrane bioreactor technology for the treatment of high strength dairy wastewater. Braz. J. Chem. Eng. 2018, 35, 91–100. [Google Scholar] [CrossRef] [Green Version]
  10. EC (European Commission). Milk and Dairy Products. 2020. Available online: https://ec.europa.eu/info/food-farming-fisheries/animals-and-animal-products/animal-products/milk-and-dairy-products_en#:~:text=Total%20EU%20milk%20production%20is,yield%20per%20cow%20has%20improved (accessed on 27 November 2020).
  11. Lopez-Mosquera, M.E.; Cascallana, V.; Seoane, S. Comparison of the effects of dairy sludge and a mineral NPK fertilizer on an acid soil. Invest. Agr. Prod. Prot. Veg. 2002, 17, 87–99. [Google Scholar]
  12. López-Mosquera, M.E.; Moirón, C.; Carral, E. Use of dairy-industry sludge as fertiliser for grasslands in northwest Spain: Heavy metal levels in the soil and plants. Resour. Conserv. Recy. 2000, 30, 95–109. [Google Scholar] [CrossRef]
  13. Fehily Timoney and Company, Codes of Good Practice for the Use of Biosolids in Agriculture-Guidelines for Farmer. 1999. Available online: https://www.housing.gov.ie/sites/default/files/migrated-files/en/Publications/Environment/Water/FileDownLoad%2C17228%2Cen.pdf (accessed on 20 January 2021).
  14. Chew, K.W.; Chia, S.R.; Yen, H.-W.; Nomanbhay, S.; Ho, Y.-C.; Show, P.L. Transformation of Biomass Waste into Sustainable Organic Fertilizers. Sustainability 2019, 11, 2266. [Google Scholar] [CrossRef] [Green Version]
  15. Nolan, S.; Thorn, C.E.; Ashekuzzaman, S.M.; Kavanagh, I.; Nag, R.; Bolton, D.; Cummins, E.; O’Flaherty, V.; Abram, F.; Richards, K.; et al. Landspreading with co-digested cattle slurry, with or without pasteurisation, as a mitigation strategy against pathogen, nutrient and metal contamination associated with untreated slurry. Sci. Total Environ. 2020, 744, 140841. [Google Scholar] [CrossRef]
  16. Lucid, J.D.; Fenton, O.; Healy, M.G. Estimation of maximum biosolids and meat and bone meal application to a low P index soil and a method to test for nutrient and metal losses. Water Air Soil Pollut. 2013, 224, 1464–1475. [Google Scholar] [CrossRef] [Green Version]
  17. Teagasc. Major and micro nutrient advice for productive agricultural crops. In Johnstown Castle Wall DP; Plunkett, M., Ed.; Teagasc Environment Research Centre: Wexford, Ireland, 2016; p. 81. [Google Scholar]
  18. International Plant Nutrition Institute. Nutrient Source Specifics—Triple Superphosphate. 2020. Available online: http://www.ipni.net/publication/nss.nsf/0/35039C5F78D8740C852579AF0076567A/$FILE/NSS-14%20Triple%20Superphosphate.pdf (accessed on 12 October 2020).
  19. Schneider, K.D.; Martens, J.R.T.; Zvomuya, F.; Reid, D.K.; Fraser, T.D.; Lynch, D.H.; O’Halloran, I.P.; Wilson, H.F. Options for improved phosphorus cycling and use in agriculture at the field and regional scales. J. Environ. Qual. 2019, 48, 1247–1264. [Google Scholar] [CrossRef] [Green Version]
  20. Delin, S. Fertilizer value of phosphorus in different residues. Soil Use Manag. 2016, 32, 17–26. [Google Scholar] [CrossRef]
  21. Ashekuzzaman, S.M.; Kwapinska, M.; Leahy, J.J.; Richards, K.; Fenton, O. Novel use of dairy processing sludge derived pyrogenic char (DPS-PC) to remove phosphorus in discharge effluents. Waste Biomass Valor. 2019, 11, 1453–1465. [Google Scholar] [CrossRef]
  22. Ashekuzzaman, S.M.; Forrestal, P.; Richards, K.; Fenton, O. Potential loss of nutrients, carbon and metals in simulated runoff associated with dairy processing sludge application. Int. J. Environ. Sci. Technol. 2020, 17, 3955–3968. [Google Scholar] [CrossRef]
  23. Daly, K.; Styles, D.; Lalor, S.; Wall, D. Phosphorus sorption, supply potential and availability in soils with contrasting parent material and soil chemical properties. Eur. J. Soil Sci. 2015, 66, 792–801. [Google Scholar] [CrossRef]
  24. Wendling, L.A.; Blomberg, P.; Sarlin, T.; Priha, O.; Arnold, M. Phosphorus sorption and recovery using mineral-based materials: Sorption mechanisms and potential phytoavailability. Appl. Geochem. 2013, 37, 157–169. [Google Scholar] [CrossRef]
  25. Vanden Nest, T.; Amery, F.; Fryda, L.; Boogaerts, C.; Bilbao, J.; Vandecasteele, B. Renewable P sources: P use efficiency of digestate, processed animal manure, compost, biochar and struvite. Sci. Total Environ. 2021, 750. [Google Scholar] [CrossRef] [PubMed]
  26. Khiari, L.; Joseph, C.-A.; Gallichand, J.; Beecher, N.; Bouslama, S. Classification and Assessment Models of First Year Biosolids Phosphorus Bioavailability. Waste Biomass Valor. 2020, 11, 1443–1452. [Google Scholar] [CrossRef]
  27. Morgan, M.F. Chemical Soil Diagnosis by the Universal Soil Testing System. Connecticut Agricultural Experiment Station, Bulletin 450. 1941. Available online: https://portal.ct.gov/-/media/CAES/DOCUMENTS/Publications/Bulletins/B450pdf.pdf?la=en (accessed on 17 May 2020).
  28. Sheil, T.S.; Wall, D.P.; Culleton, N.; Murphy, J.; Grant, J.; Lalor, S.T.J. Long-term effects of phosphorus fertilizer on soil test phosphorus, phosphorus uptake and yield of perennial ryegrass. J Agric. Sci. 2016, 154, 1068–1081. [Google Scholar] [CrossRef]
  29. USEPA (undated) Memorandum. Subject: Fipronil ID#000264-00554: Updated Toxicology Hazard Assessment. Evaluation of an Acute Neurotoxicity Study with Fipronil and Reevaluation of the Developmental Neurotoxicity Study; USEPA: Washington, DC, USA, 1996.
  30. Daly, K.; Casey, A. Eutrophication from agricultural sources: Environmental soil phosphorus test. In EPA Research Report; Environmental Protection Agency: Wexford, Ireland, 2003; ISBN 1840951117. [Google Scholar]
  31. Delin, S. Fertilizer value of nitrogen in hen and broiler manure after application to spring barley using different application timing. Soil Use Manag. 2011, 27, 415–426. [Google Scholar] [CrossRef]
  32. Ashekuzzaman, S.M.; Forrestal, P.; Richards, K.; Daly, K.; Fenton, O. Grassland Phosphorus and Nitrogen Fertiliser Replacement value of Dairy Processing Dewatered Sludge. Sustain. Prod. Consum. 2021, 25, 363–373. [Google Scholar] [CrossRef]
  33. Graca, J. An Evaluation of Phosphorus Supply Capacities in Irish Grassland Soils. Ph.D. Dissertation, University of Limerick, Limerick, Ireland, 2018. [Google Scholar]
  34. Olsen, S.R.; Cole, C.V.; Watanabe, F.S.; Dean, L.A. Estimation of Available Phosphorus in Soils by Extraction with Sodium Bicarbonate; US Department of Agriculture: Washington, DC, USA, 1954; p. 939.
  35. USDA (United States Department of Agriculture). Selection of an Appropriate Phosphorus Test for Soils. Soil Survey Laboratory, National Soil Survey Center: Lincoln. 2020. Available online: https://www.nrcs.usda.gov/Internet/FSE_DOCUMENTS/nrcs142p2_051918.pdf (accessed on 17 February 2021).
  36. Arendas, T.; Csatho, P. Comparison of the effect of equivalent nutrients given in the form of farmyard manure or fertilizers in Hungarian long-term field trials. Commun. Soil Sci. Plan. 2002, 33, 2861–2878. [Google Scholar] [CrossRef]
  37. Vaneeckhaute, C.; Janda, J.; Vanrolleghem, P.A.; Tack, F.; Meers, E. Phosphorus Use Efficiency of Bio-based Fertilizers: Bioavailability and Fractionation. Pedosphere 2016, 26, 310–325. [Google Scholar] [CrossRef] [Green Version]
  38. Mohanty, S.; Paikaray, N.K.; Ranjan, A.R. Availability and uptake of phosphorus from organic manures in groundnut (Arachis hypogea L.)-corn (Zea mays L.) sequence using radio tracer technique. Geoderma 2006, 133, 225–230. [Google Scholar] [CrossRef]
  39. Smith, G.S.; Cornforth, I.S.; Henderson, H.V. Critical leaf concentrations for deficiencies of nitrogen, potassium, phosphorus, sulfur, andmagnesium in perennial ryegrass. New Phytol. 1985, 101, 393–409. [Google Scholar] [CrossRef]
  40. Quintero, C.E.; Boschetti, N.G.; Benavidez, R.A. Effect of soil buffer capacity on soil test phosphorus interpretation and fertilizer requirement. Commun. Soil Sci. Plant Anal. 2003, 34, 1435–1450. [Google Scholar] [CrossRef]
  41. Schulte, R.; Herlihy, M. Quantifying responses to phosphorus in Irish grasslands: Interactions of soil and fertiliser with yield and P concentration. Eur. J. Agron. 2007, 26, 144–153. [Google Scholar] [CrossRef]
  42. Forrestal, P.J.; Harty, M.A.; Carolan, R.; Watson, C.J.; Lanigan, G.J.; Wall, D.P.; Hennessy, D.; Richards, K.G. Can the agronomic performance of urea equal calcium ammonium nitrate across nitrogen rates in temperate grassland? Soil Use Manag. 2017, 33, 243–251. [Google Scholar] [CrossRef]
  43. Murphy, P.; Murphy, P.N.C.; Wall, D.P. Evaluating the Role of Scale in the Sustainability of Nutrient Management of Grazed Pasture Dairy Systems. Ph.D. Thesis, University College Dublin, Dublin, Ireland, April 2020. [Google Scholar]
  44. Syers, J.K.; Johnston, A.E.; Curtin, D. Efficiency of Soil and Fertiliser Phosphorus Use: Reconciling Changing Concepts of Soil Phosphorus with Agronomic Information. In FAO Fertilizer and Plant Nutrition Bulletin; FAO: Rome, Italy, 2008; p. 18. [Google Scholar]
Figure 1. Illustration of calculation of equivalent mineral fertiliser (X1 = EQmineral P fertiliser rate) rate that returns the same P uptake obtained by DPS P fertiliser. Y1 is the P uptake due to DPS application, “a (slope)” and “b (y-intercept)” are coefficients of linear regression equation (Y = a*X + b). “*” in the equation indicates multiplication sign.
Agronomy 11 00427 g001
Figure 2. Pre- and post-harvest comparison of agronomically available Morgan’s P concentrations across treatments. Shared letters denote no difference (p > 0.05), and unshared letters denote a statistical difference (p ≤ 0.05).
Agronomy 11 00427 g002
Figure 3. Effect of treatment on the grass dry matter (DM) yield. Within each harvest shared letters denote no difference (p > 0.05), and unshared letters denote a statistical difference (p ≤ 0.05). DPS: dairy processing sludge; Ca-DPS: calcium-phosphorus rich lime treated sludge; Al-DPS: aluminium rich activated sludge; SP: super phosphate.
Agronomy 11 00427 g003
Figure 4. Effect of treatment on grass P concentrations across four consecutive harvestings between May 2019 and February 2020. Within each harvest shared letters denote no difference (p > 0.05), and unshared letters denote a statistical difference (p ≤ 0.05). DPS: dairy processing sludge; Ca-DPS: calcium-phosphorus rich lime treated sludge; Al-DPS: aluminium rich activated sludge; SP: super phosphate.
Agronomy 11 00427 g004
Figure 5. Cumulative P uptake response (solid line) with 95% confidence intervals (dotted lines). “*” in the equation indicates multiplication sign.
Agronomy 11 00427 g005
Figure 6. Effect of treatment on grass P uptake. Within each harvest shared letters denote no difference (p > 0.05), and unshared letters denote a statistical difference (p ≤ 0.05). DPS: dairy processing sludge; Ca-DPS: calcium-phosphorus rich lime treated sludge; Al-DPS: aluminium rich activated sludge; SP: super phosphate.
Agronomy 11 00427 g006
Table 1. Physicochemical characteristics of dairy processing sludge and super phosphate.
SampleDMOMTCpHNPKSCaAlFeRate Applied *
% FW% FW% FW g Kg−1 FWFW Tonnes ha−1
Al-DPS128.14.36.97.35.92.10.63.73.70.26.8
Ca-DPS257.28.17.76.425.31.40.760.10.31.31.6
SPndndndnd01632.012.92091.4nd0.25
* Application rate at 40 kg P ha−1; nd: not determined; DPS: dairy processing sludge; Ca-DPS: calcium-phosphorus rich lime treated sludge (Ca/P molar ratio 1.84); Al-DPS: aluminium rich activated sludge; SP: super phosphate (containing 16.3% P, Ca/P molar ratio 0.99); FW: fresh weight; DM: dry matter; OM: organic matter; TC: total carbon.
Table 2. Soil phosphorus index system for grassland in Ireland (adapted from [17,28]).
Soil P IndexSoil P Range
(Morgan’s mg-P L−1)
Index DescriptionResponse to P FertiliserP Fertiliser Application Recommendation
10–3Very LowDefiniteBuild up 1,2 + maintenance 3
23.1–5LowLikelyBuild up 1,2 + maintenance 3
35.1–8Medium/AdequateUnlikelyMaintenance
4>8Sufficient/HighNoneP application not recommended
1 Build-up P fertiliser rates for grassland are 20 kg ha−1 year−1 at Index 1, and 10 kg ha−1 year−1 at Index 2. 2 Until next soil test. 3 Maintenance requirements of P fertiliser e.g., silage 1st cut 20 kg P ha−1 and 10 kg P ha−1 for subsequent 2 cuts.
Table 3. Effect of P application rate and type on first year total N uptake and N use efficiency. Values indicated in brackets are standard deviations (n = 5).
TreatmentP RateN Input *Total N Uptake NUE **
kg ha−1kg ha−1kg ha−1%
no P0325255 (34.8)79 (10.7)
SP15325256 (18.5)79 (5.7)
SP30325271 (32.0)83 (9.9)
SP40325279 (26.8)86 (8.3)
SP50325260 (24.5)80 (7.5)
SP60325257 (27.7)79 (8.5)
Ca-DPS40327 #248 (25.5)76 (7.8)
Al-DPS40329 #288 (35.1)88 (10.7)
* From calcium ammonium nitrate (CAN) application at 125, 100 and 100 kg-N ha−1 at the start, after harvest 1 and 2, respectively; ** NUE (N use efficiency, %) = Total N uptake*100/N input; # For Ca-DPS and Al-DPS, 25% and 8% N availability, respectively from [32], which provides additional available N input of 1.75 and 4.24 kg, respectively.
Table 4. First year 1st harvest and total P uptake associated APR, RPE and FPE of tested DPS.
TreatmentRateAPR (%)RPE (%)FPE (%)
kg ha−11st HarvestTotal1st HarvestTotal1st HarvestTotal
No P0
SP158.216.0
SP 3010.920.3
SP 4010.315.210010099.3103
SP 505.714.4
SP 608.211.8
Ca-DPS 401.44.713.830.916.030.8
Al-DPS 405.016.048.910649.9109
APR: Apparent P Recovery; RPE: Relative P Effectiveness; FPE: Fertiliser P Equivalence; DPS: dairy processing sludge; Ca-DPS: calcium-phosphorus rich lime treated sludge; Al-DPS: aluminium rich activated sludge; SP: super phosphate.
Publisher’s Note: MDPI stays neutral with regard to jurisdictional claims in published maps and institutional affiliations.

