Article

Can Soil pH Correction Reduce the Animal Supplementation Needs in the Critical Autumn Period in Mediterranean Montado Ecosystem?

MED-Mediterranean Institute for Agriculture, Environment and Development, Instituto de Investigação e Formação Avançada (IIFA), University of Évora, Pólo da Mitra, Ap. 94, 7006-554 Évora, Portugal
*
Author to whom correspondence should be addressed.
Agronomy 2021, 11(3), 514; https://doi.org/10.3390/agronomy11030514
Submission received: 31 January 2021 / Revised: 27 February 2021 / Accepted: 5 March 2021 / Published: 10 March 2021
(This article belongs to the Special Issue Sustainable Management and Utilization of Permanent Grassland)

Abstract

:
Extensive livestock production in Mediterranean climate conditions and acidic soils requires animal feed supplementation. This occurs during the summer and, frequently, also in the autumn and winter, depending on the prevailing rainfall patterns. The purpose of this study was to evaluate the effect of dolomitic limestone application and of tree canopy on availability, quality, and floristic composition of a permanent pasture, grazed by sheep. At the end of autumn, winter, and spring of 2018/2019 and 2019/2020 pasture green and dry matter production (GM and DM, respectively), crude protein (CP), and fiber (neutral detergent fiber) were monitored in 24 sampling points. Half of these points were located in areas amended with dolomitic limestone (COR) and half in unamended areas (UCOR). In each of these, half of the sampling points were located under tree canopy (UTC) and half outside tree canopy (OTC). Pasture floristic composition was monitored in spring 2020. The results show, in autumn, a positive and significant effect (i) of soil pH amendment on pasture DM and CP daily growth rate (kg·ha−1·day−1) (+28.8% and +42.6%, respectively), and (ii) of tree canopy on pasture CP daily growth rate (+26.4%). Both factors affect pasture floristic composition. Pasture species were identified as potential bio-indicators, characteristic of each field area. These results show the practical interest of the soil pH correction to reduce the animal supplementation needs in the critical autumn period in the Mediterranean montado ecosystem.

1. Introduction

Montado (dehesa in Spain) is an agro-silvo-pastoral ecosystem characteristic of the southern region of the Iberian Peninsula [1], with an important role in natural resource conservation and carbon sequestration, reducing soil erosion, and mitigating the effects of climate change [2]. In this ecosystem, pasture, considered a low-cost feed [3], is the main food resource for extensive livestock production [4]. This resource provides adequate nutritional value but only for a part of the year [5] because it does not have constant productivity and quality [3]. The Mediterranean climate is a bioclimatic variant of the temperate climate with a marked seasonal and inter-annual variability, characterized by winter cold stress and summer drought stress. These are periods when pasture species do not grow [4], due to the physiologic and metabolic limitations that inhibit normal plant functions [6]. Therefore, ruminants that depend solely on natural pasture start the grazing period with forage of high quality (low levels of fiber and high levels of protein), but after the blooming period and the peak biomass production in late spring, there is a sharp drop in pasture quality associated with a decrease of the pasture feed value (reduction in the proportion of leaves and high tissue lignification) which may lead to the worsening of the animal’s corporal condition [5].
These periods, in which animal diets need to be supplemented, normally last about six months (summer and autumn seasons) but can go on for longer if rainfall patterns in autumn and winter seasons are below normal [4]. Under these circumstances, supplementation is inevitable to meet nutritional deficiencies, ensuring greater average daily gain, and to mitigate the fluctuation of pasture quality and dry matter production over the year [3]. However, this strategy is expensive and unviable from an economic point of view, so alternatives should be sought to improve food self-sufficiency, thus reducing production costs [7].
In Portugal, this ecosystem is based on Cambisoils of the Alentejo region [8], whose genesis derives from granitic bedrock. As a result, these are normally shallow and stony soils with low fertility and pH, thus with very clear handicaps in terms of productivity [9]. Soil acidity restricts agricultural production mainly due to nutrient deficiency and toxicity by metals such as manganese, Mn [10] and, due to the different tolerance of botanical species, with significant impact on the pasture floristic composition [11] and pasture quality [9]. Various pasture species are considered to be very sensitive to Mn toxicity and affected by the presence of high levels of Mn, while others are considered to be relatively tolerant to soil acidity [9]. For example, the development of legumes in general is inhibited in acidic soils, and they can benefit from soil amendments [11] but also from the application of phosphate fertilizers, which result in an increase in the total biomass production of the pasture [12].
The recommended procedure for the recovery of these soils is the installation of permanent pastures and the increase of soil fertility through the application of chemical phosphate fertilizers [9]. According to Carvalho et al. [10], one of the low-cost alternatives suggested in this context is the application of dolomitic limestone as a way of improving soil fertility and, consequently, pasture productivity and quality, while avoiding the dependence on supplementation. Some studies have shown, however, that soil acidity amendment based on dolomitic limestone application is a slow and gradual process [12], recommending the application of limestone systematically and, at least every two years until the soil pH stabilized at close to neutral [9]. A recent study [12], in the same experimental field and referring to only one year (2018/2019), showed a positive influence of soil amendment on pasture quality in terms of CP availability. However, few studies explore the development of the montado ecosystem as a result of soil pH correction, under and outside tree canopy. Soil parameters have long been recognized as the main drivers of vegetation growth [13], so one would expect that the existing variability in soil fertility conferred by the tree canopy will also play a decisive role in vegetation growth [14]. Despite the greater fertility normally associated with areas under the canopy (UTC), competition for resources (water, light, and nutrients) between tree and pasture roots is the main reason for decreased crop yields UTC [15,16]. Additionally, there are patterns of distribution of certain botanical species that can influence the quality and productivity of the pasture UTC and outside tree canopy (OTC) [17,18].
The purpose of this study was to evaluate, in two vegetative cycles (2018/2019 and 2019/2020), the effect of dolomitic limestone application and of tree canopy on: (i) pasture daily grown rate (DM, kg·ha−1·day−1); (ii) pasture daily grown rate quality (CP, kg·ha−1·day−1); and pasture floristic composition.

2. Materials and Methods

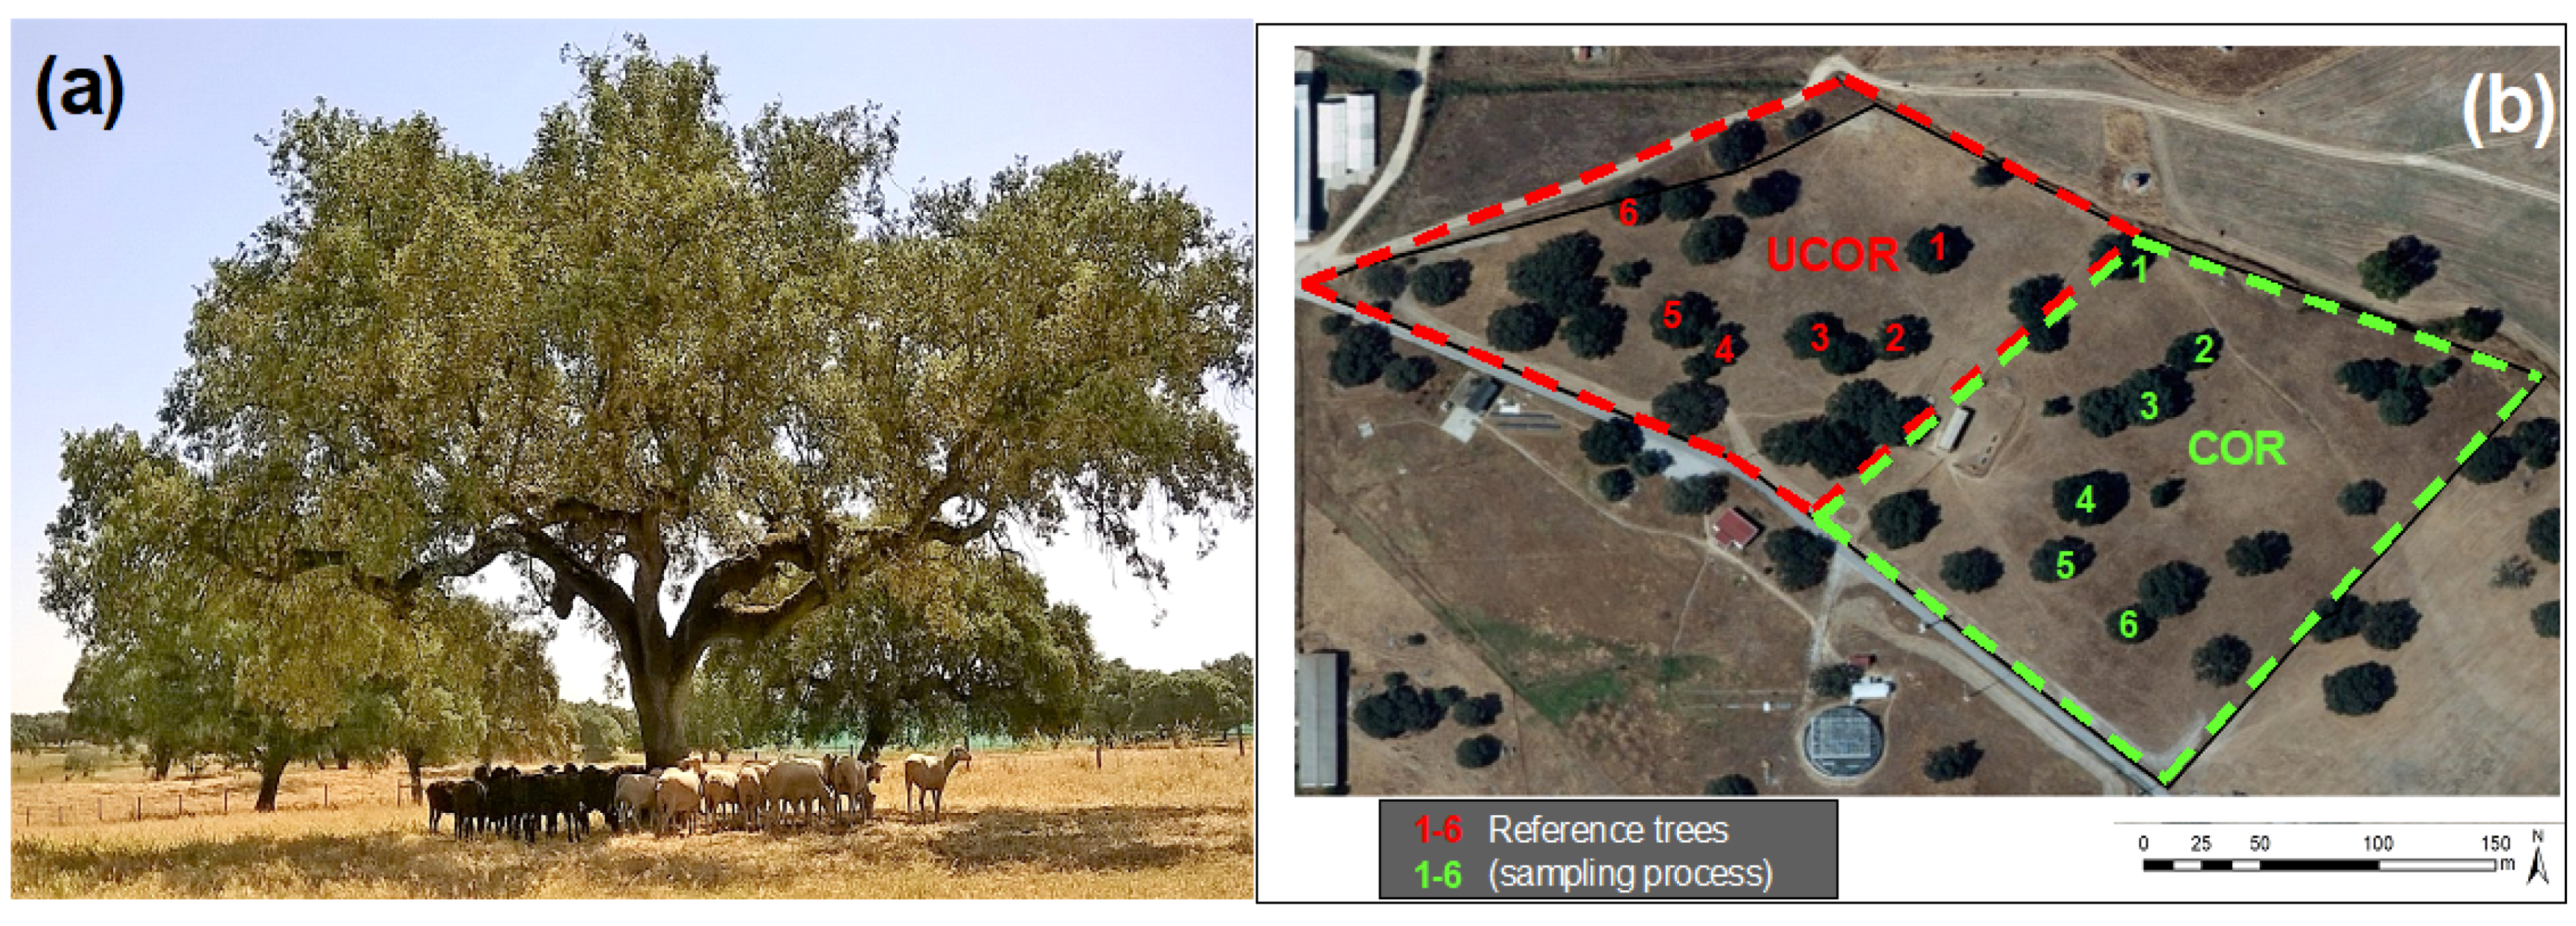
2.1. Experimental Field and Sampling Scheme

The experimental field (Figure 1), with 4.0 ha, is located at Mitra Farm (38°53.10 N; 8°01.10 W). This figure shows the amended area (“COR”; approximately 2 ha) and the unamended area (“UCOR”; approximately 2 ha) and, in each of these, the six trees used as a reference in the sampling process. For each reference tree two sampling points were geo-referenced, one UTC and the other OTC. In each of these twenty-four sampling points, a wooden grazing exclusion cage (dimensions 0.5 m × 0.5 m × 0.5 m) was installed.
The predominant soil of this field is classified as Cambisol, derived from granite, usually cultivated under mixed, agro-forestry production systems [8]. This Montado ecosystem consists of dryland biodiverse pastures, Quercus ilex ssp. rotundifolia Lam. trees, and is grazed by adult sheep in a rotational regime (variable stocking rate throughout the year). These types of soils are generally characterized as shallow soils with low fertility. In this case, soil analyses performed in this same field in October 2015 [19] revealed a sandy loam texture (sand = 80.6 ± 2.3%; silt = 10.1 ± 1.7%; and clay = 9.3 ± 1.4%), small cation exchange capacity (CEC = 7.3 cmol kg−1), low pH (5.4 ± 0.3), medium organic matter content (2.0 ± 0.8%), high levels of potassium (K2O = 270 ± 136 mg kg−1), of phosphorus (P2O5 = 93 ± 62 mg kg−1), of magnesium (Mg = 96 ± 44 mg kg−1) and manganese (Mn = 76 ± 45 mg kg−1).

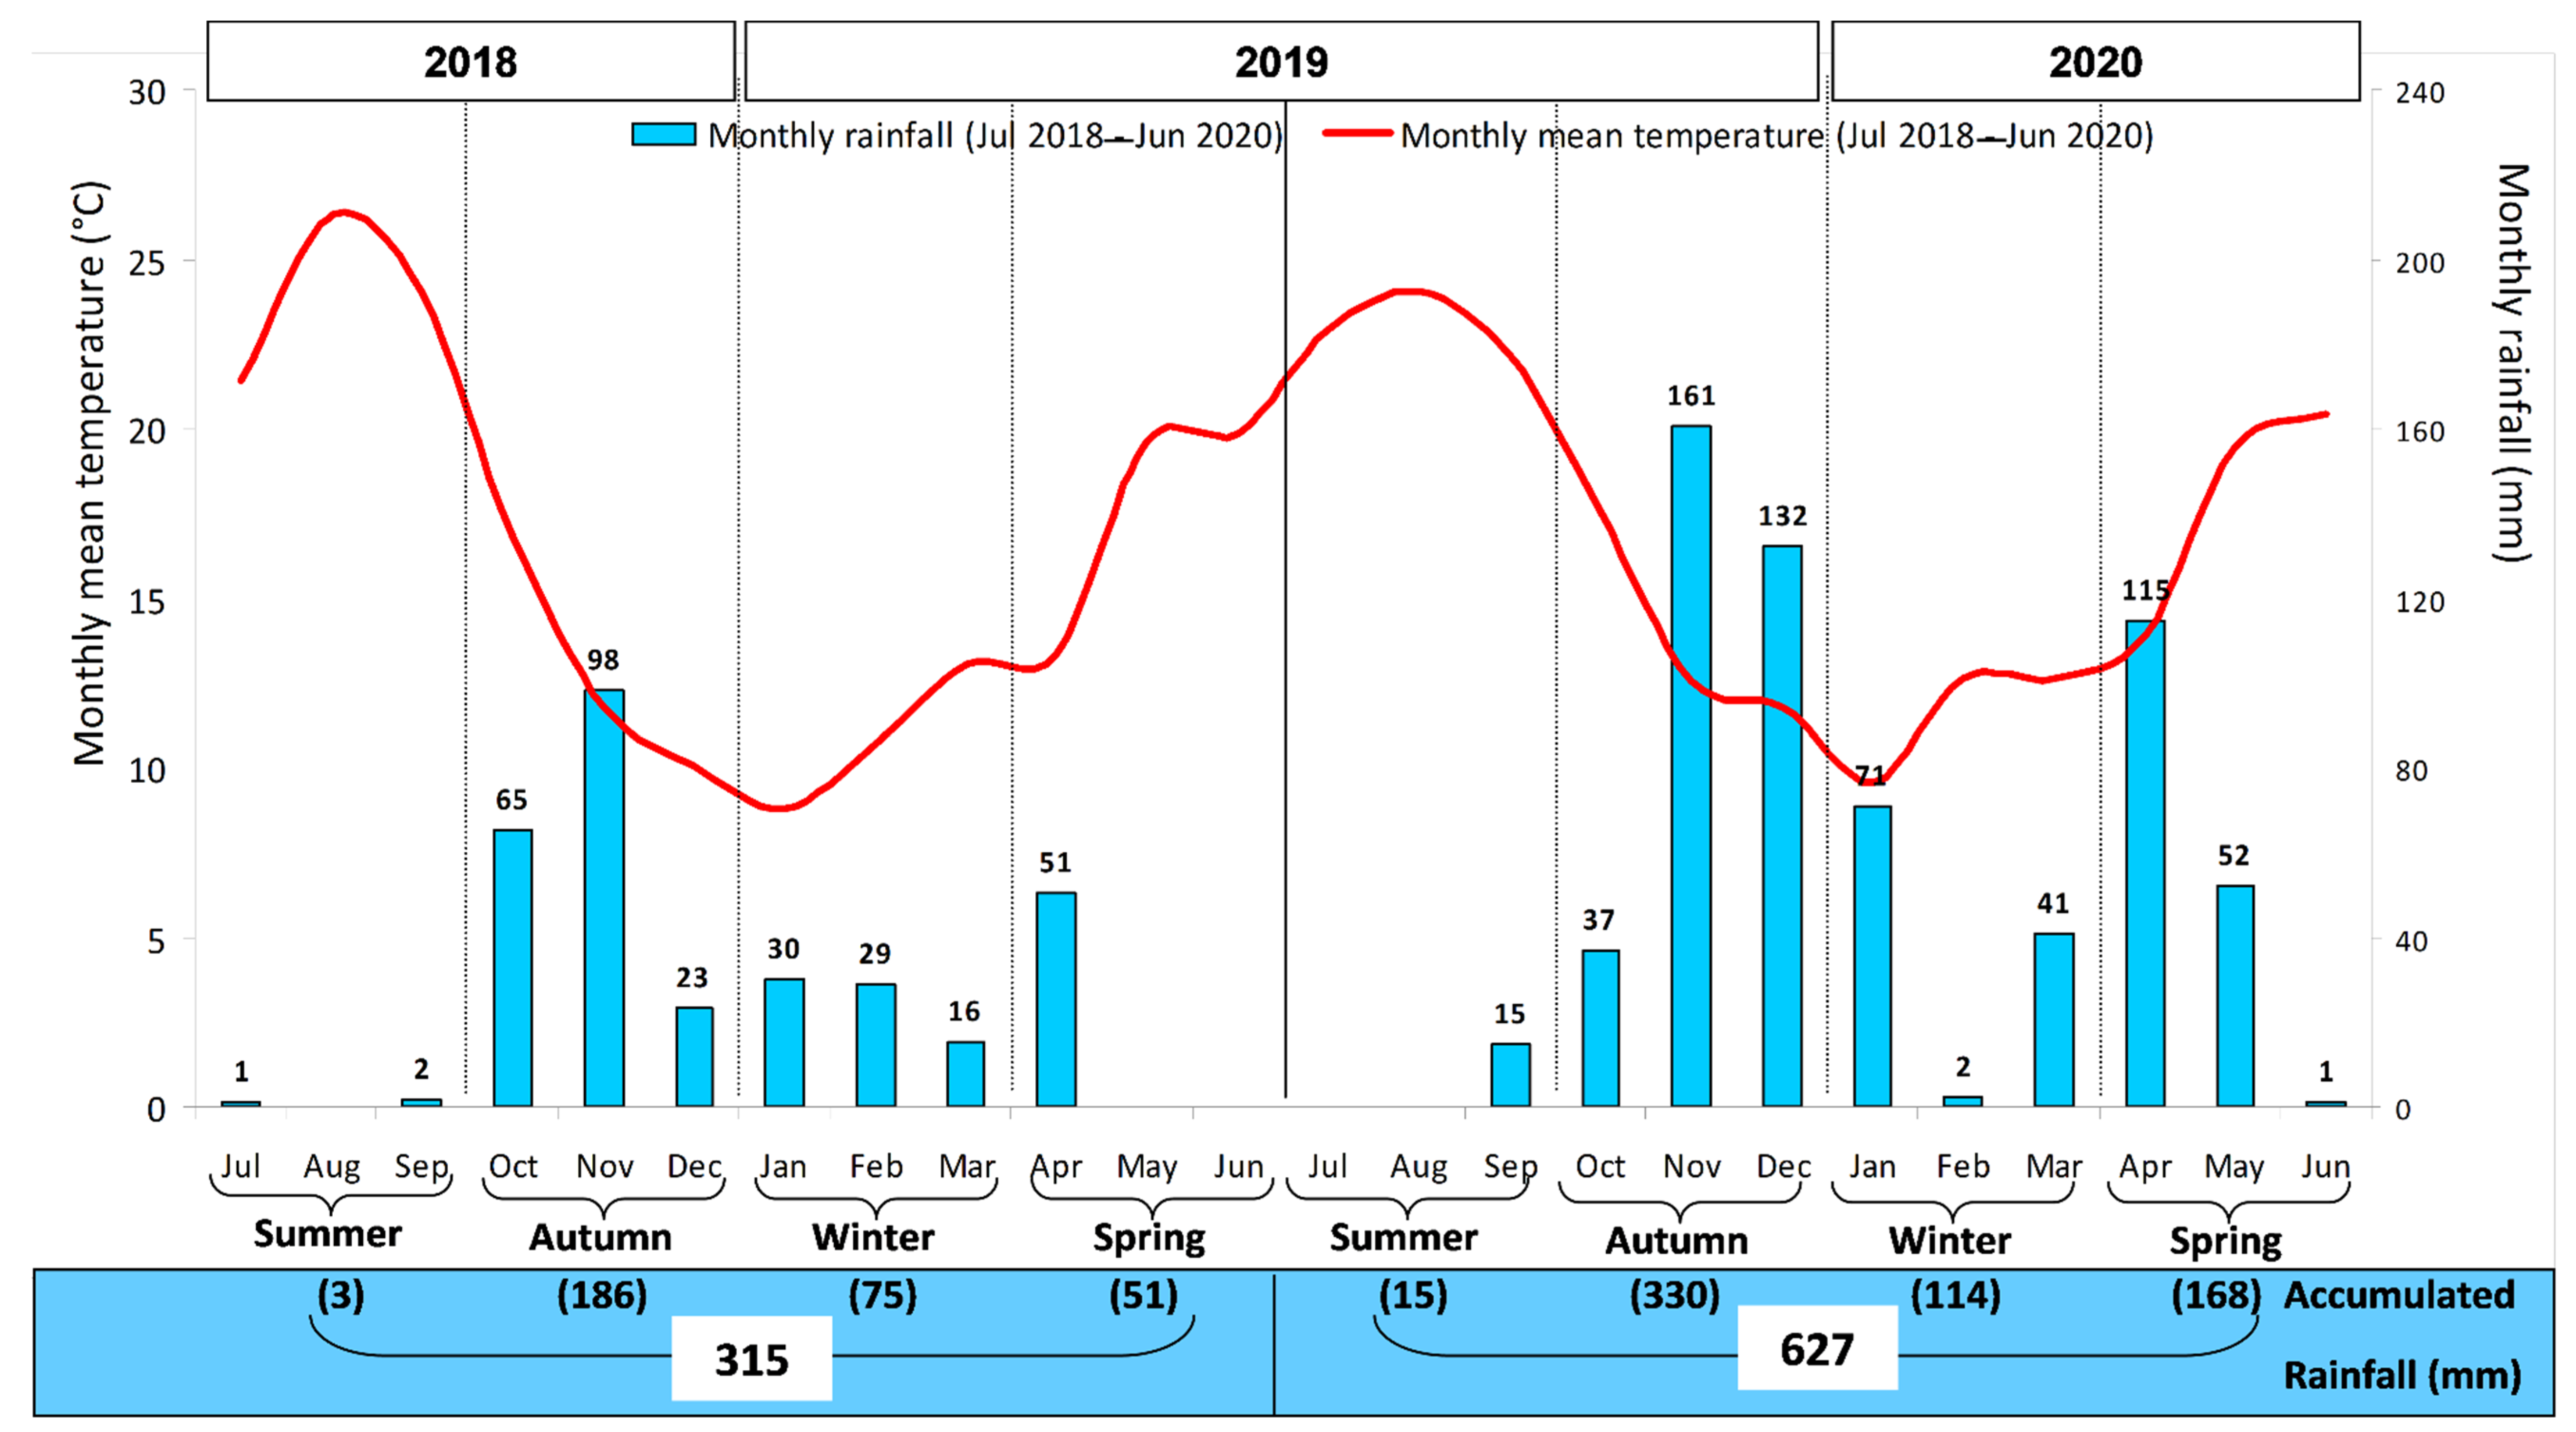
2.2. Characterization of the Climate

The Mediterranean climate is characterized by a high concentration of rainfall in the winter and very dry, hot summers. Rainy autumns, very cold winters (with minimum temperatures close to 0 °C between December and February), uneven springs, and very hot summers (maximum temperatures above 40 °C) are characteristic of this region and climate, with significant impact on the vegetative cycle of dryland pastures. The annual accumulated precipitation in the region varies between 300 and 650 mm, distributed mainly between October and March. Figure 2 illustrates the thermo-pluviometric diagram of the Meteorological Station of Mitra (Évora, Portugal). This figure shows the evolution of the monthly mean temperature and monthly rainfall between July 2018 and June 2020. These are very different years in terms of accumulated precipitation, the first very dry (accumulated rainfall of 315 mm) and the second relatively rainy, with practically double the accumulated rainfall (627 mm). This difference is particularly accentuated in autumn (186 mm in 2018 and 330 mm in 2019) and in spring (56 mm in 2019 and 168 mm in 2020) seasons and confirms the inter-annual irregularity responsible for low productivity and poor quality of dryland pastures in this region.

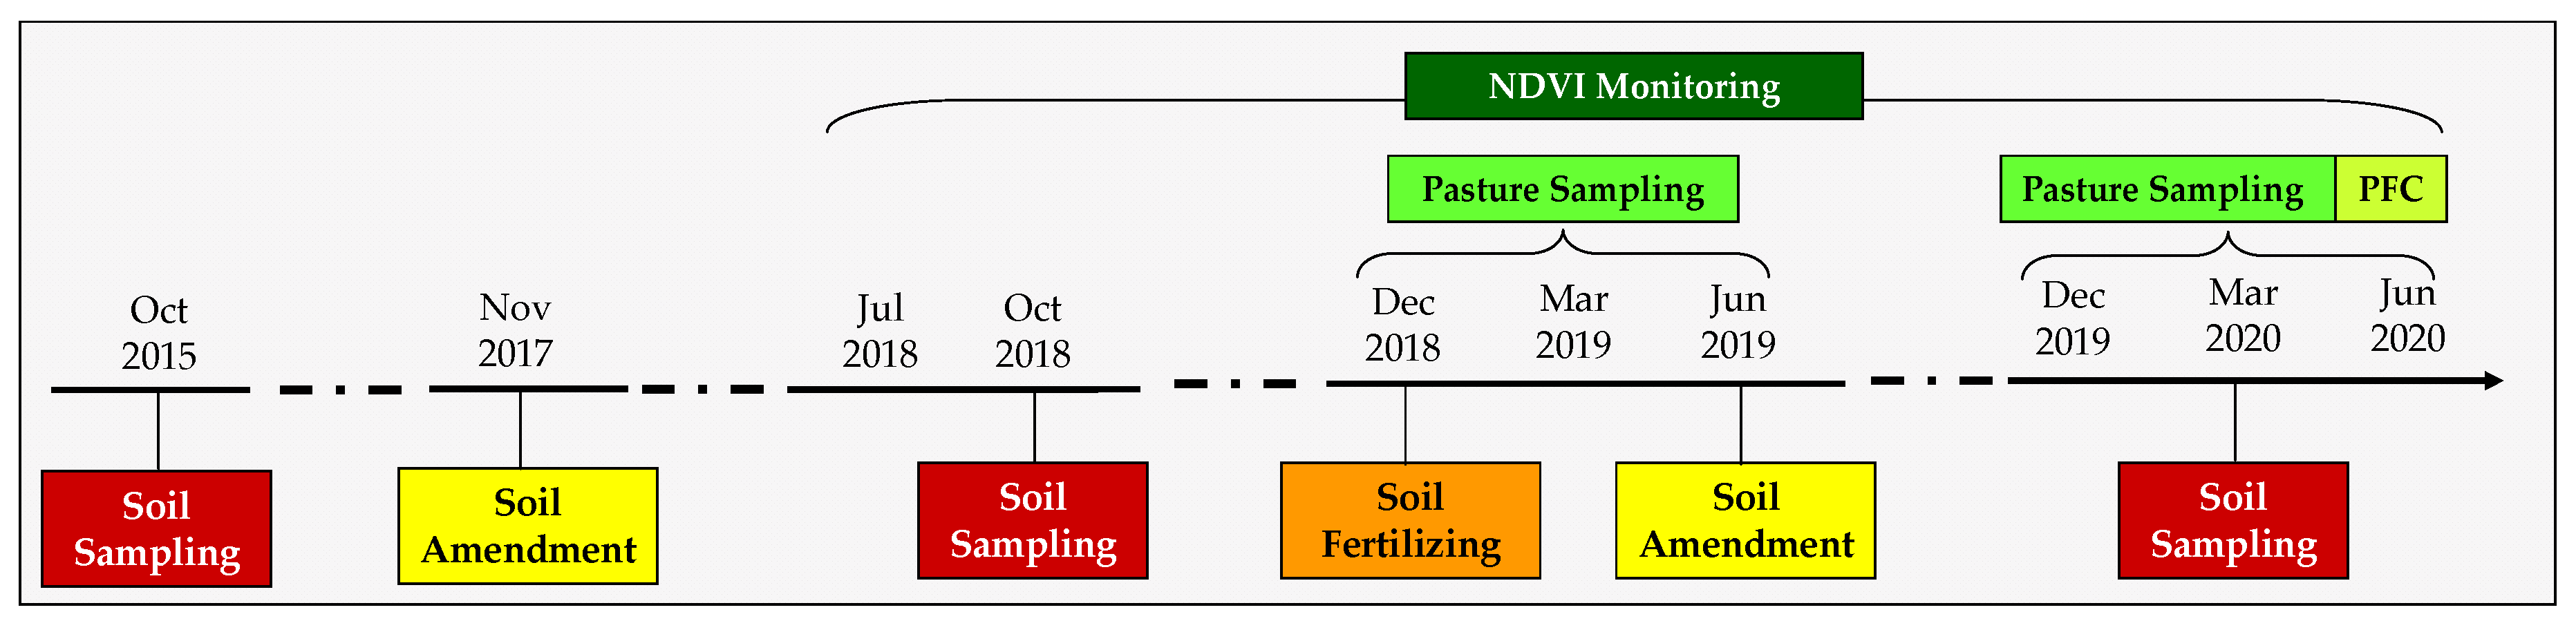
2.3. Chronological Sequence of the Interventions and Measurements in the Experimental Field

Figure 3 shows the chronological diagram of the activities carried out in this work for monitoring the montado ecosystem at the Mitra experimental field, between October 2015 and June 2020. Soil sampling carried out in October 2015 marked the beginning of this project having identified a low pH (mean pHH2O = 5.4 ± 0.3) and low ratio Mg/Mn (approximately 1.3) [19]. Soil interventions consisted of two differential amendments (November 2017 and June 2019), with the application of 2000 kg ha−1 of dolomitic limestone (42% calcium oxide, CaO and 10% magnesium oxide, MgO) only in “COR” areas, and a uniform fertilizer application in all experimental field (December 2018), with the application of 100 kg ha−1 of ammonium phosphate (18% of nitrogen and 46% of phosphorous). In October 2018 [19] and in March 2020, twenty-four geo-referenced soil samples were collected, twelve in each area (“COR” and “UCOR”), half UTC, and the other half OTC. The effect of soil interventions (amendment and fertilization) was evaluated outside and under tree canopy at the level of pasture productivity and quality. Pasture sampling processes were carried out in two vegetative cycles: 2018/2019 and 2019/2020.

2.4. Soil Sample Collection and Analysis

Soil samples were collected in a depth range of 0–0.30 m, on three occasions: October 2015 [19], October 2018 [12], and March 2020. One composite soil sample was taken in each of the geo-referenced sampling points, comprising four subsamples from within 1 m of the center of the exclusion cage. Soil samples were kept in plastic bags and, in the laboratory, air-dried, and sieved. In March 2020, with the objective of evaluating the effect of dolomitic limestone application (November 2017 and June 2019) on soil pH, Mg, and Mn availability, the fraction with diameter <2 mm was characterized in terms of pH in 1:2.5 (soil: water) suspension, using the potentiometric method and Mg and Mn were measured using atomic absorption spectrometry [20].

2.5. Pasture Samples Collection and Analysis

Pasture sampling processes were carried out at the end of autumn (December), of winter (March), and of spring (June) in two consecutive vegetative cycles: 2018/2019 and 2019/2020. Pasture samples collected at twenty-four exclusion cages were subjected to standard analysis of wet chemistry according to the Association of Official Analytical Chemists [21] to obtain the following pasture parameters: (i) productivity (green matter, GM, and dry matter, DM, in kg·ha−1) and (ii) quality (crude protein, CP, and neutral detergent fiber, NDF, in % of DM). DM and CP are expressed as daily growth rate, in kg·ha−1·day−1, calculated from Equations (1) and (2), respectively. The number of days (n) used in these equations in each pasture vegetative cycle (2018/2019 and 2019/2020) was: (i) in autumn, the number of days between the beginning of vegetative cycle (the moment of plant emergence—10 days after an accumulated rainfall of 30 mm since September of each year) and the day of pasture collection; (ii) in winter, the number of days between the beginning of the vegetative cycle and the second pasture collection; (iii) in spring, the number of days between the beginning of the vegetative cycle and the third pasture collection. The daily growth rates variations (DMvar and CPvar), expressed graphically, indicate the variation of DM and CP (in kg·ha−1) in the respective period.
D M ( kg · h a 1 · d a y 1 ) = D M ( k g · h a 1 ) n
C P ( k g · h a 1 · d a y 1 ) = C P ( % ) × D M ( k g · h a 1 · d a y 1 ) 100
where “DM” is pasture dry matter, “CP” is pasture crude protein, and “n” is the number of days of each temporal period considered.
Pasture vegetation index (Normalized Difference Vegetation Index, NDVI) was monitored monthly between July 2018 and June 2020. Measurements were carried out in all twenty-four sampling points with an active optical sensor (AOS, OptRxTM, Ag Leader, Ames, IA, USA). The sensor measures “RED” (670 nm) and “Near InfraRed” (NIR, 775 nm) spectral bands, which allow the calculation of NDVI (Equation (3)). The average monthly value of NDVI in the set of twenty-four sampling points of the experimental field, between July 2018 and June 2020, was calculated to characterize graphically its evolution during the pasture vegetative cycle.
N D V I = N I R R E D N I R + R E D
During the pasture flowering period of the 2019/2020 vegetative cycle (May 2020), a floristic inventory of species and families present in each of the sampling points was carried out by an expert in conservation biology based on the phytosociological method of Braun-Blanquet [22]. In each sampling area (0.25 m2), the percentage of coverage by each species was recorded.

2.6. Statistical Analysis of the Data

Descriptive statistical analysis (mean, standard variation, and range) was performed for soil and pasture parameters. Then, ANOVA of the data was carried out considering a two-factor experiment (soil amendment, COR vs. UCOR, and influence of tree canopy, UTC vs. OTC), using “MSTAT-C” software with a 95% significance level (p < 0.05). Because soil amendment was not geographically, the interactions between fields and replicas were used to generate the error to compare the two fields. The “Fisher” (“Fisher’s least significant difference, LSD”) test was applied whenever the ANOVA results presented significant differences between factors.
Data of PFC were submitted to a multilevel pattern analysis (Indicator Species Analysis- ISA), a specific package for “R” statistic software (St. Louis, MO, USA) [23]. ISA involves the calculation of an indicator value (IV) for species, corresponding to the product of the relative abundance (specificity) and relative frequency (fidelity), expressed as the degree (in percentage) [24,25,26]. The indicator value ranges between 0 (species absent in a given group) and 100 (species that occurs in all samples within the group and does not occur in other groups) [26]. In order to identify bio-indicator species, characteristic of each study area, three approaches were taken in this analysis: (i) soil pH correction (COR and UCOR) factor; (ii) tree canopy (UTC and OTC) factor; and (iii) the combination of the two previous factors (COR, UCOR, UTC, and OTC). Statistical significance was assessed using α = 0.05.

3. Results

3.1. Temporal and Spatial Variability Pattern of the Soil Parameters

Taking as reference the soil data obtained in October 2015 and in March 2020 (Table 1), there was a slight increase in pH (on average from 5.4 to 5.7). This improvement in pH was significantly more evident, as expected, in the areas where the dolomitic limestone was applied (pHCOR = 5.8 ± 0.4; pHUCOR = 5.6 ± 0.2; p = 0.0225; Table 1) and accentuates the pattern of improvement that the October 2018 results also evidenced (pHCOR = 5.6 ± 0.2; pHUCOR = 5.3 ± 0.2; p = 0.0193; Table 1). However, these results also show that the surface application of amendments has a slow positive effect on the soil pH.
Still spatially, a positive and significant effect of the tree canopy on the soil pH is also evident.
Table 1 shows that dolomitic limestone (which has 10% of MgO in its composition) application also had a positive effect on the Mg/Mn ratio: overall the ratio increased from 1.26 in 2015 to 2.36 in 2020. In the COR areas this ratio reached an average of 3.33, compared to 1.38 in UCOR areas. This improvement resulted mainly from the reduction of Mn levels: in global terms, the Mn levels decreased from 76.4 ± 44.9 mg kg−1 in 2015 to 40.1 ± 17.3 mg kg−1 in 2020.
The improvement in the Mg/Mn ratio materialized in a similar way in UTC areas (on average, it increased from 1.15 to 2.15 in 2020) and in OTC areas (on average it went from 1.45 in 2015 to 2.32 in 2020).

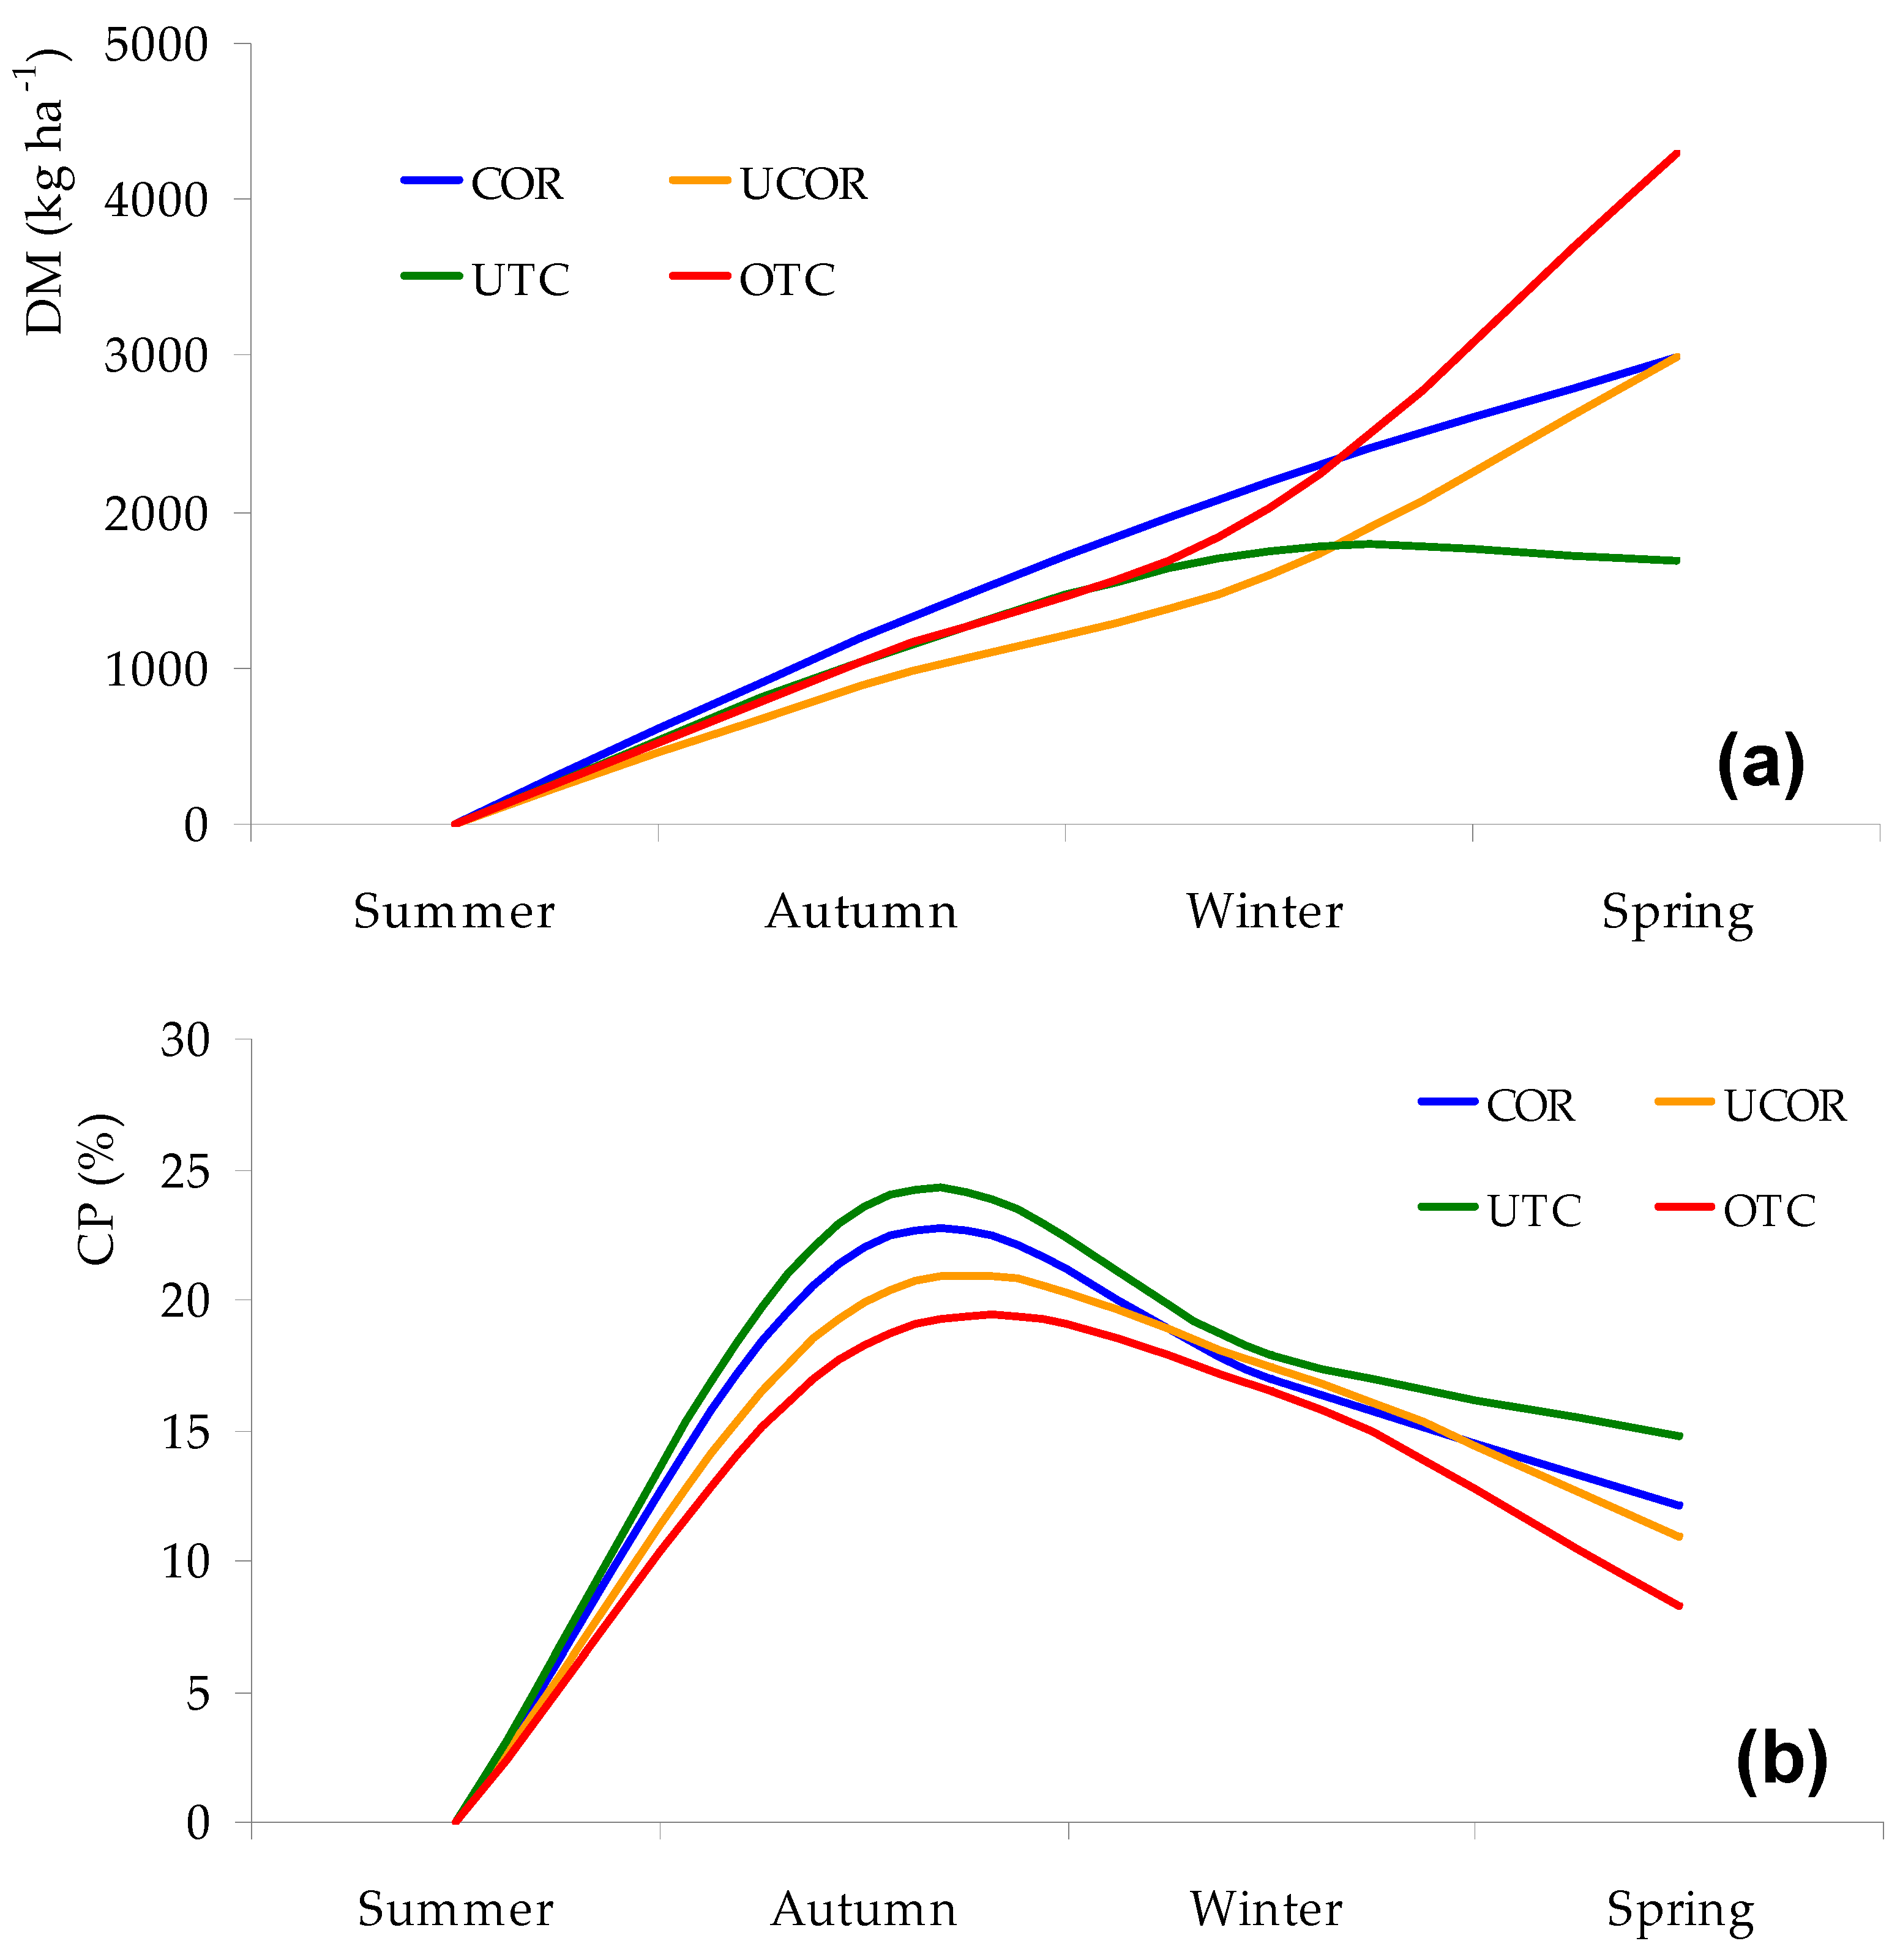
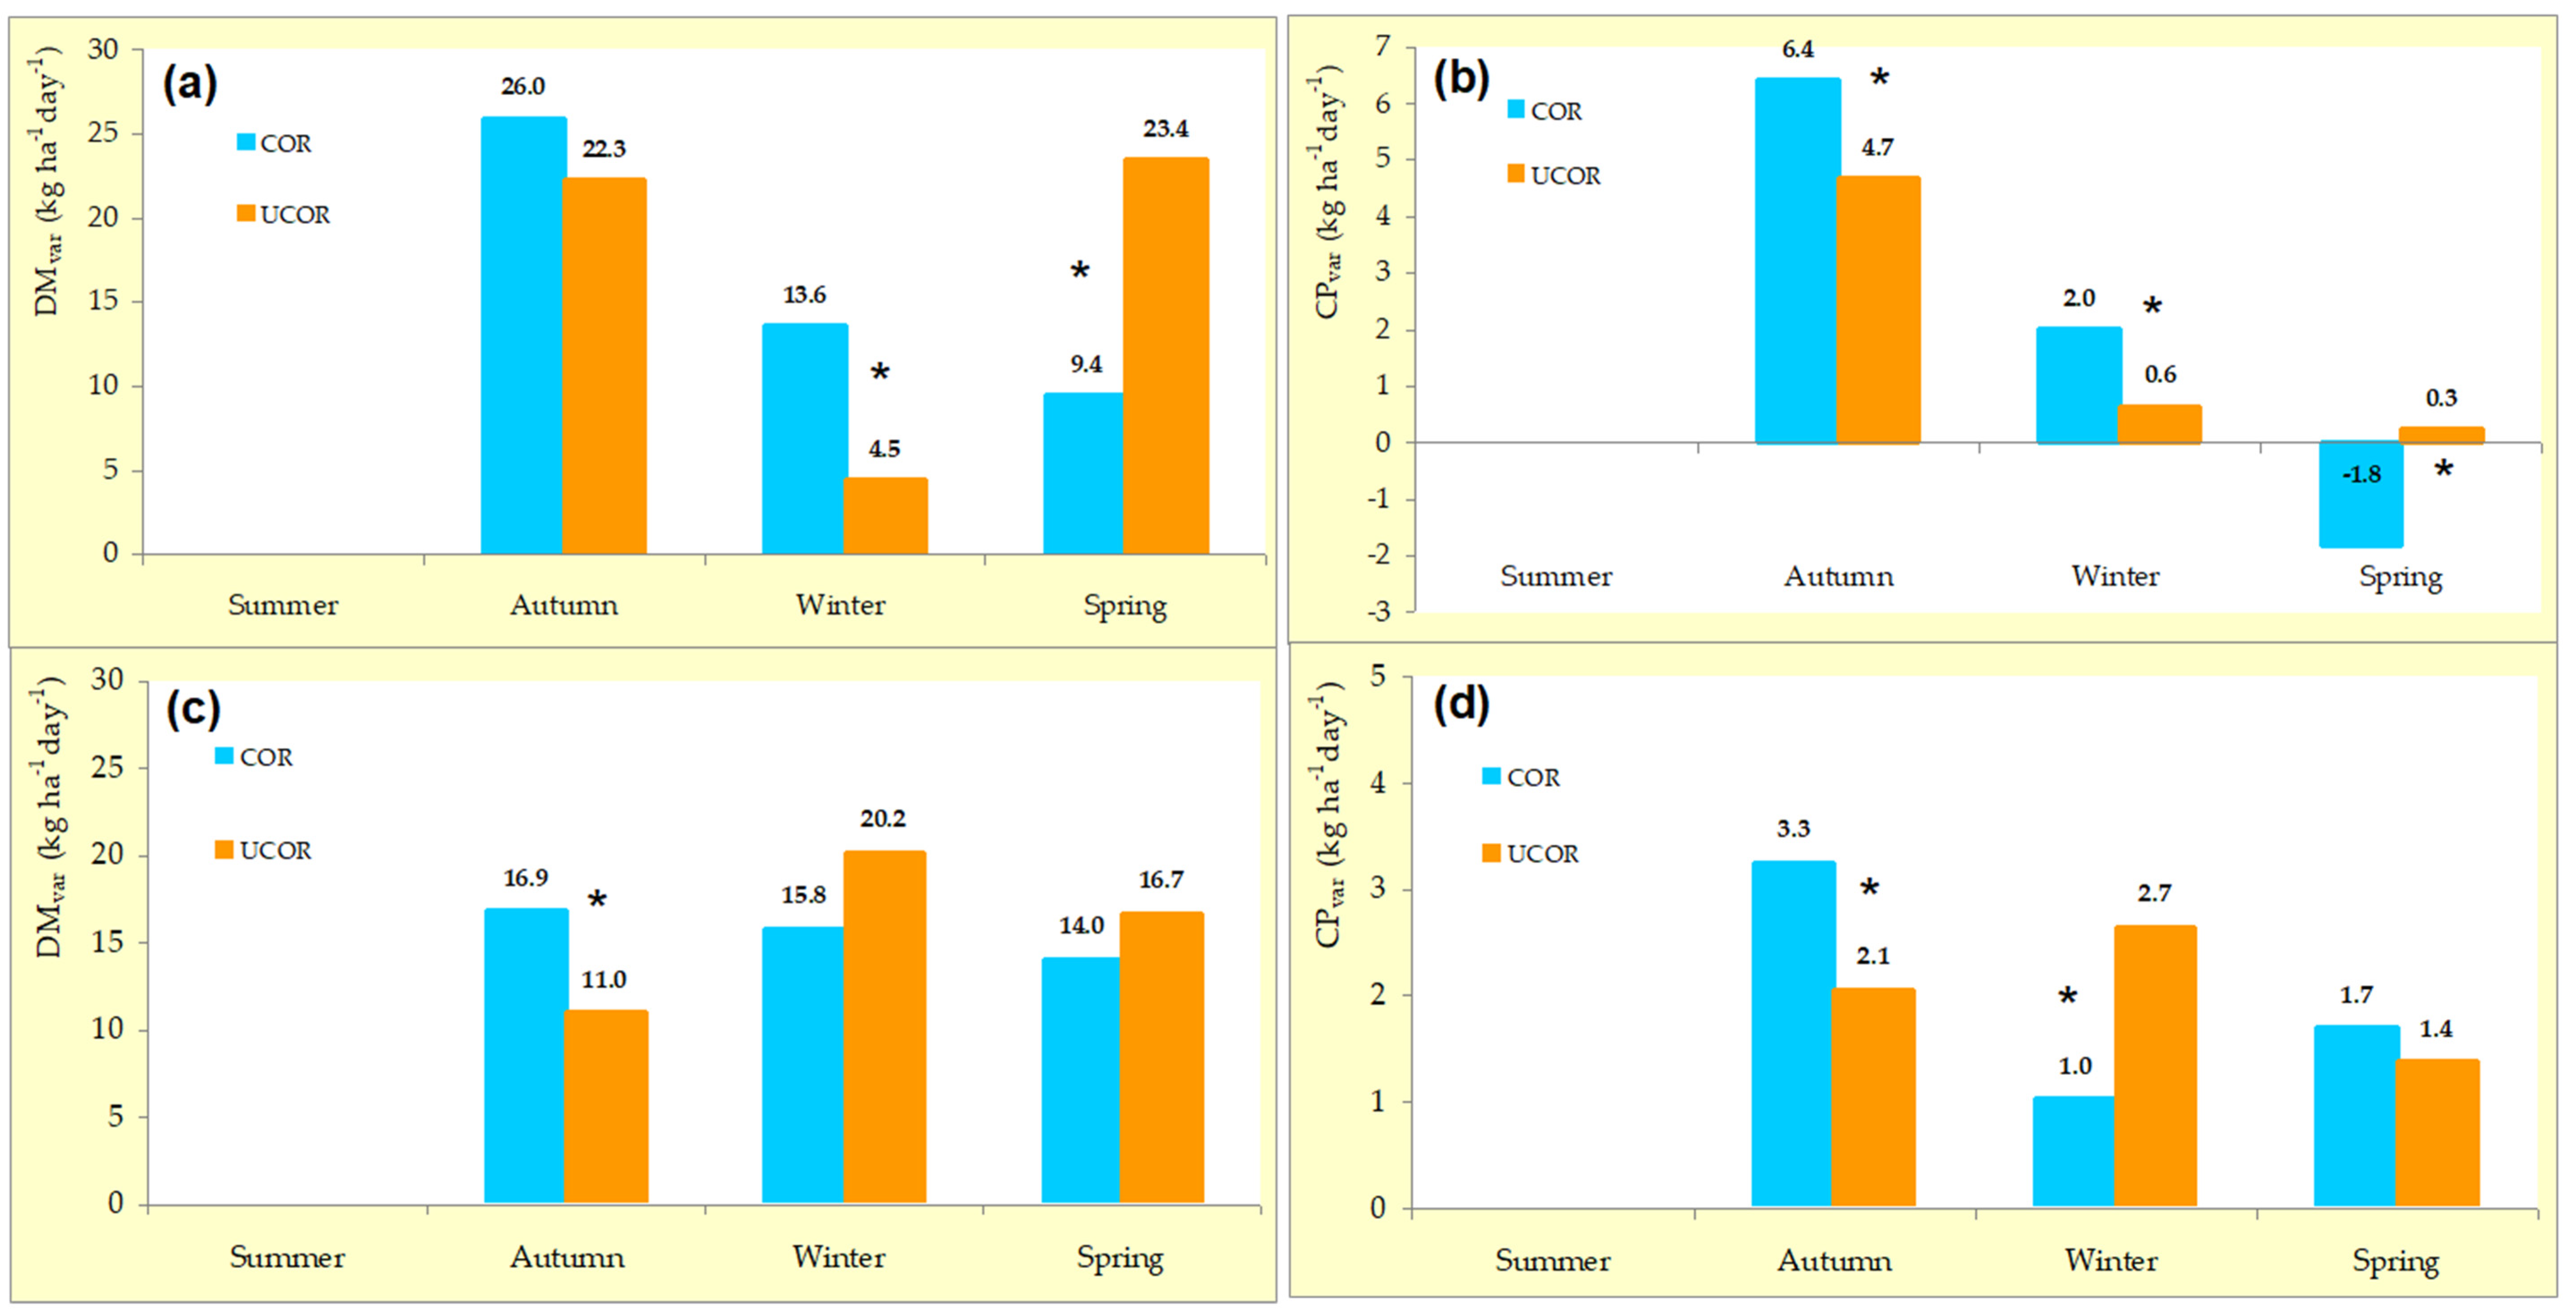
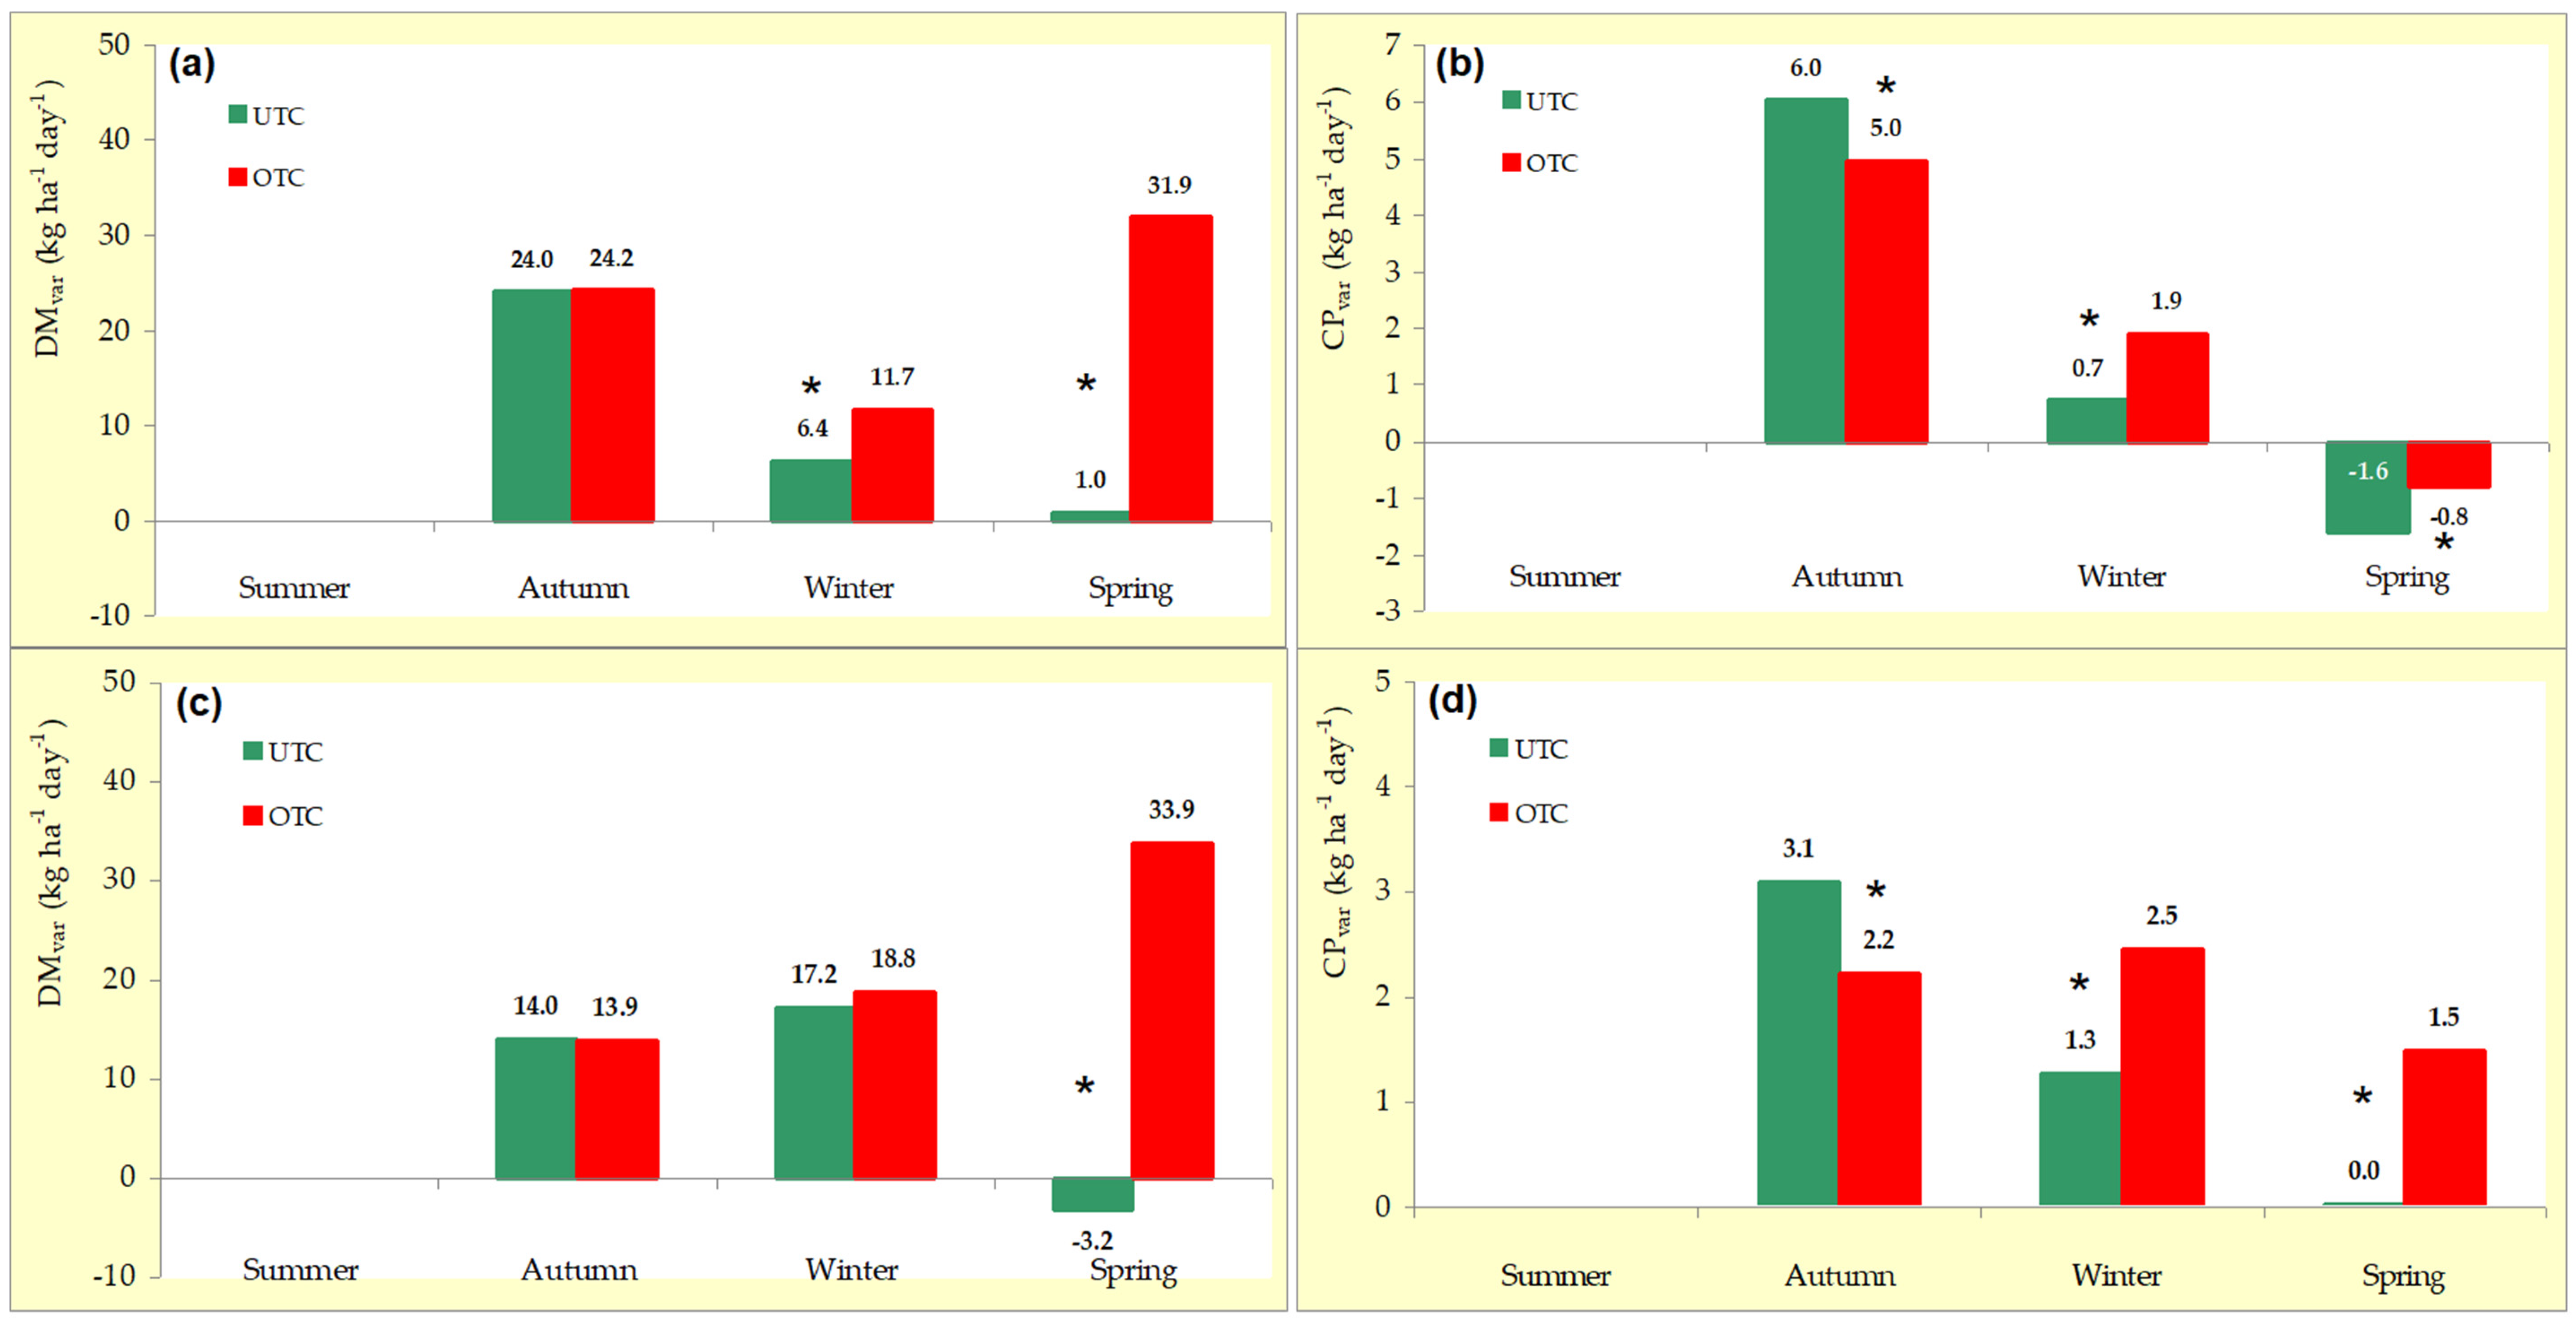
3.2. Variability Pattern of Pasture Productivity and Quality

Spatially, dolomitic limestone application tended to have a positive effect on pasture productivity (Table 2), however, this was significant for both GM and DM only in Winter 2018/2019 and in Autumn 2019/2020. In terms of pasture quality, CP showed no significant change due to the application of dolomitic limestone, while NDF in winter showed lower values in COR areas. Tree canopy areas (UTC), on the other hand, showed a significant and positive effect on GM and DM in autumn. This trend is reversed in winter and especially in spring, with clearly greater productivity OTC. Tree canopy also showed a significant and positive effect on pasture quality (with higher values of CP and lower values of fiber UTC).
The pattern of evolution of DM (Figure 4a) and CP (Figure 4b) in the experimental field, based on the average of these parameters during two vegetative cycles (2018/2019 and 2019/2020; Table 3) show that COR areas have a greater tendency, in autumn and winter, towards greater DM than UCOR areas. Unamended areas tend to recover in late spring (Figure 4a). This parameter (DM) is influenced more by tree canopy than soil pH correction, showing, between winter and spring, a very significant increase in OTC and, during the same period, a slight decrease in UTC. Pasture quality (measured as CP in % DM; Figure 4b), on the other hand, shows a decrease between autumn and summer of the following year. It is also evident that (i) the highest CP values are obtained UTC throughout the entire vegetative cycle; and (ii) that soil pH correction anticipates the availability of protein in the autumn (with higher CP values in COR areas), an effect which tends to fade by the end of the vegetative cycle (late spring).
The transformation of DM and CP data into daily growth rate (DMvar and CPvar, in kg ha−1 day−1; Figure 5 and Figure 6, respectively, shows that soil amendment resulted, in autumn, in significantly higher DMvar and CPvar (+28.8% and +42.6%, respectively, in an average of two years; Figure 5). The tree canopy effect (Figure 6) was significant and positive in CP daily growth rate at autumn (+26.4% in average of two years).

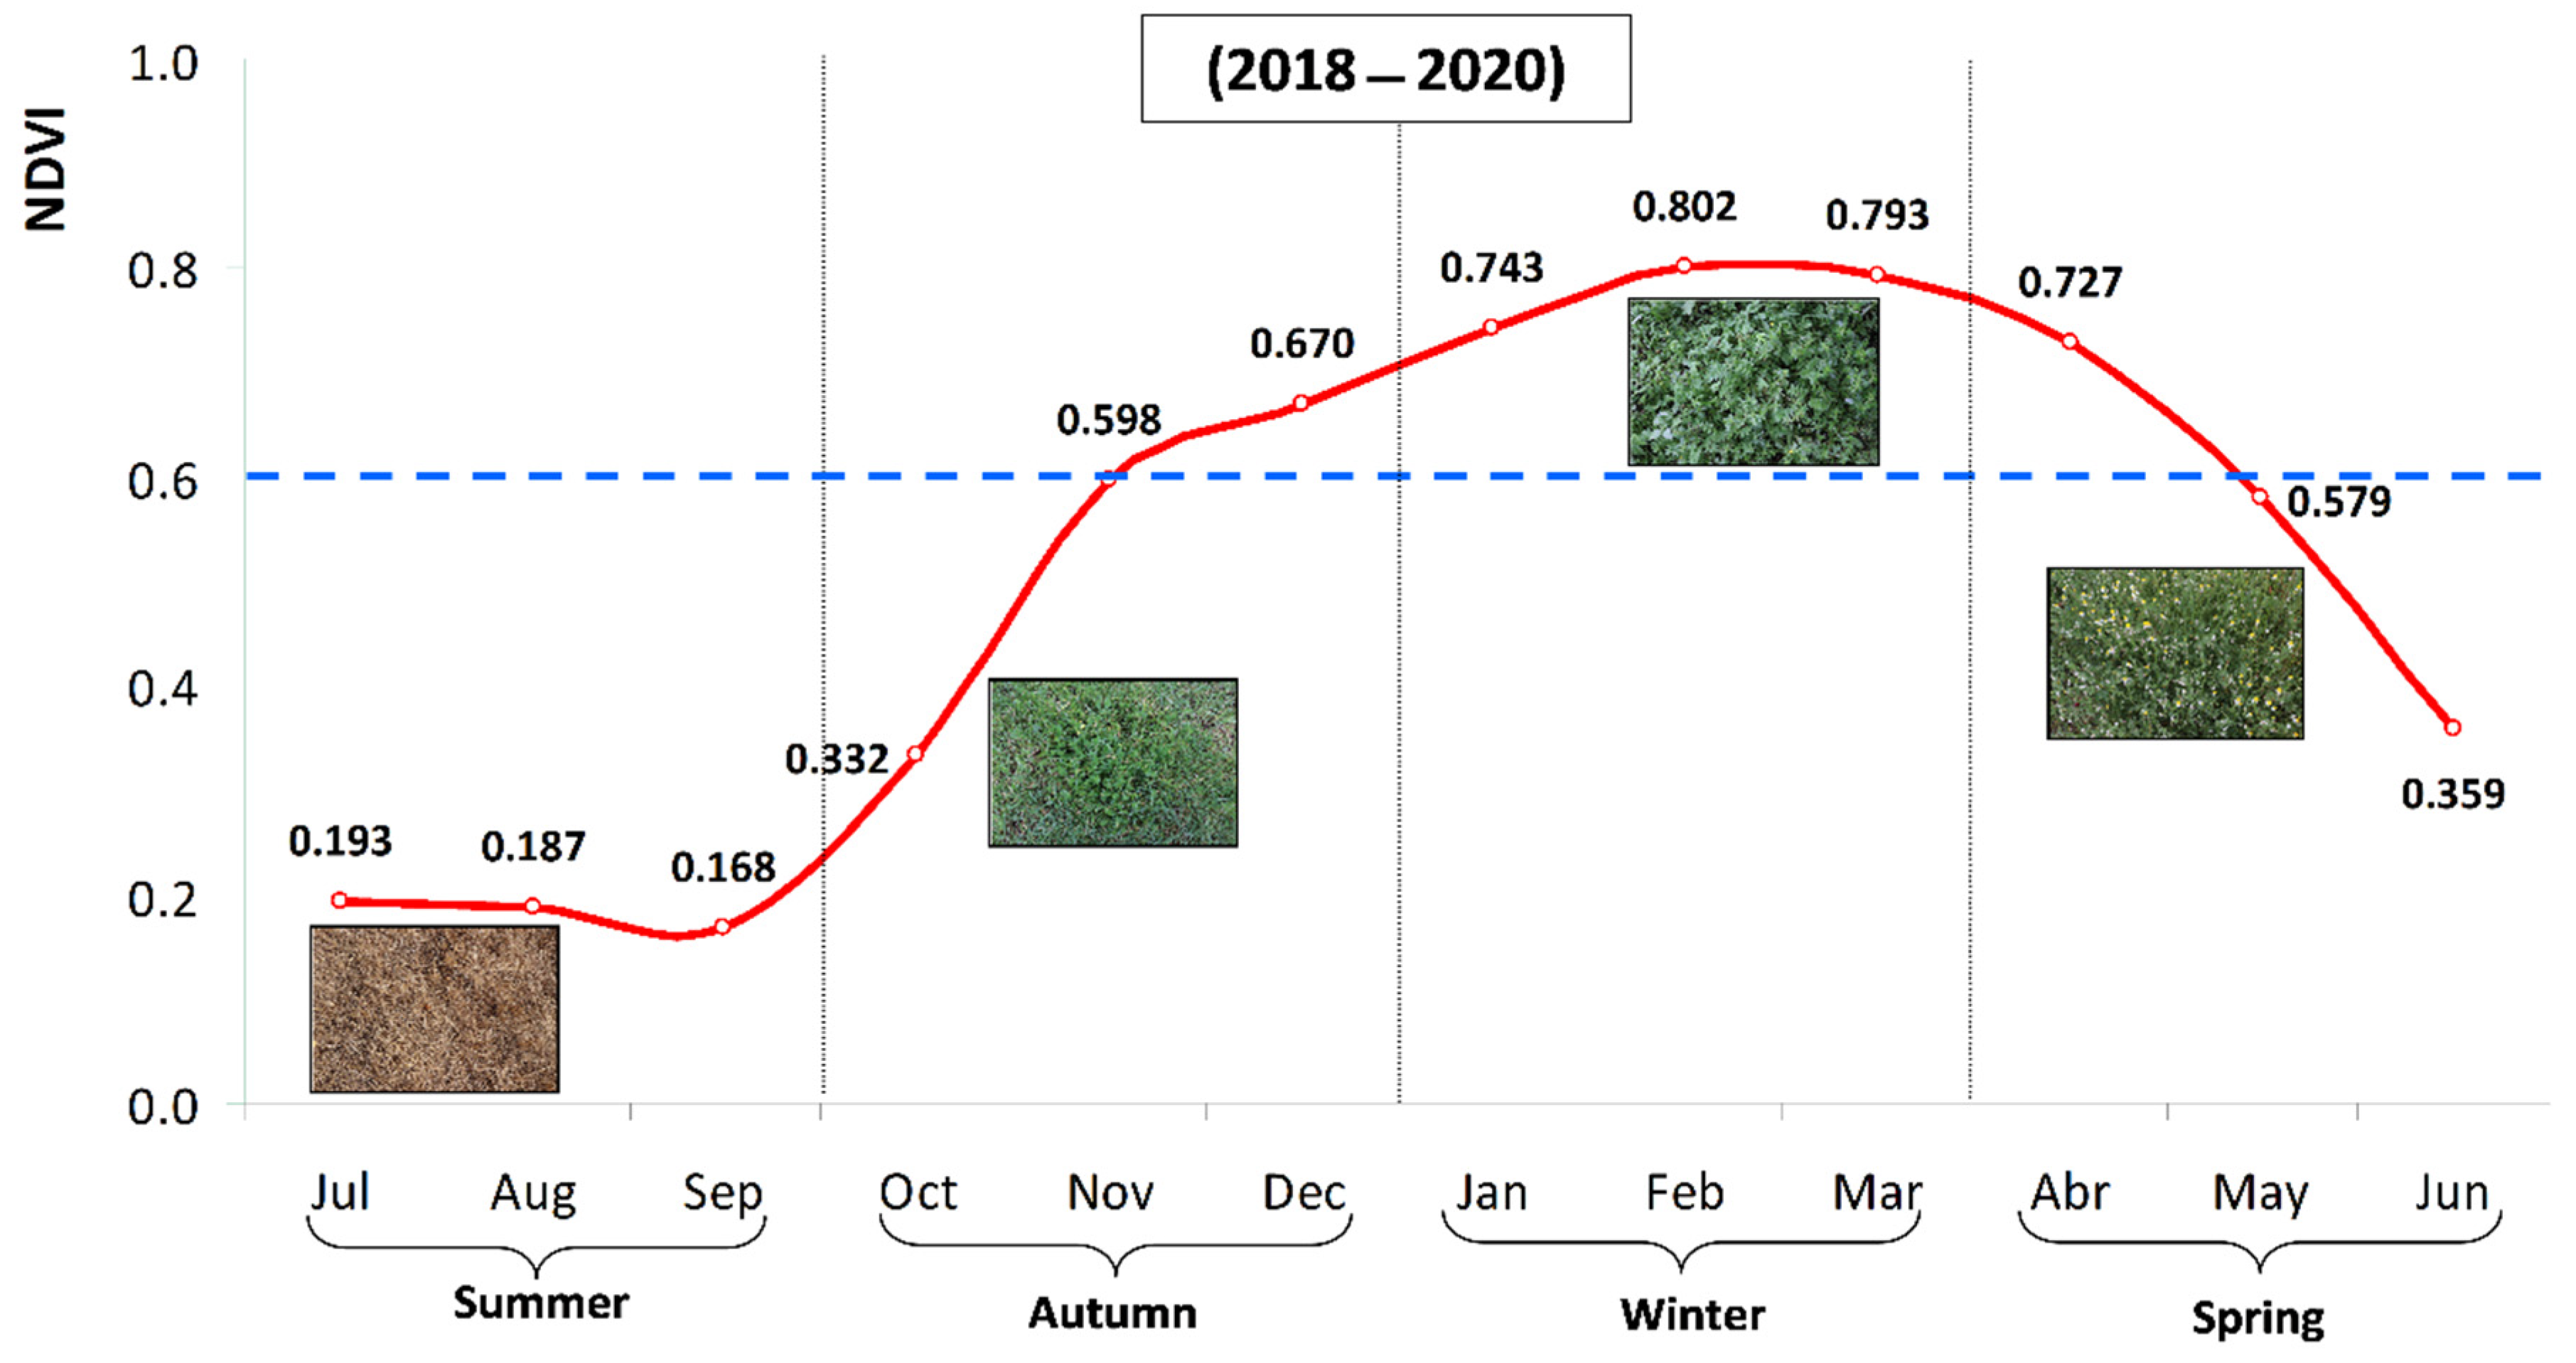
3.3. Temporal Pattern of Evolution of Normalized Difference Vegetation Index (NDVI)

The typical pattern of evolution of monthly mean NDVI at the experimental field measured with an active optical sensor “OptRx” during pasture vegetative cycles of 2018/2019 and 2019/2020 (Figure 7) reflects the combined effect of temperature and rainfall on the vegetative vigor of rainfed plants. In the hot and dry summer months (July–September) there is a low vegetative index (NDVI < 0.2). This is the most stable period over the years since the absence of precipitation in this period is a characteristic pattern of the Mediterranean climate. Autumn months (October–December) are decisive, since the first rains and the consistency of their distribution, associated with average temperatures in the 12–18 °C range (Figure 2) precipitate mark the emergence of the plants and the beginning of the vegetative cycle. Figure 7 shows that, between October and November, the average two-year values of NDVI practically doubled (NDVI: 0.332 →0.598). The winter period, due to low temperatures, is normally a period of vegetative dormancy, keeping plants with high vegetative vigor, which, associated with greater soil coverage, leads to the maximum NDVI value (around 0.80) between February and March. Between April and May, the rise in average temperature (about 10 °C; Figure 2) and a drop in rainfall (and, consequently, in soil moisture content) accelerates the pasture vegetative cycle, resulting in the flowering of a large part of the flora. These factors lead to an important breakdown of NDVI between May and June (NDVI: 0.579 →0.359). The period in which NDVI is below 0.60, in the case of Figure 7 between June and November (because it rained early in autumn 2018 and 2019), but sometimes for longer periods depending on the distribution of precipitation in the autumn months, requires animal feed supplementation.
Figure 7. Evolution of monthly mean normalized difference vegetation index (NDVI) at the experimental field during pasture vegetative cycles of 2018/2019 and 2019/2020. The broken line (NDVI = 0.6) correspond to the sheep CP maintenance requirements [27].
Agronomy 11 00514 g007

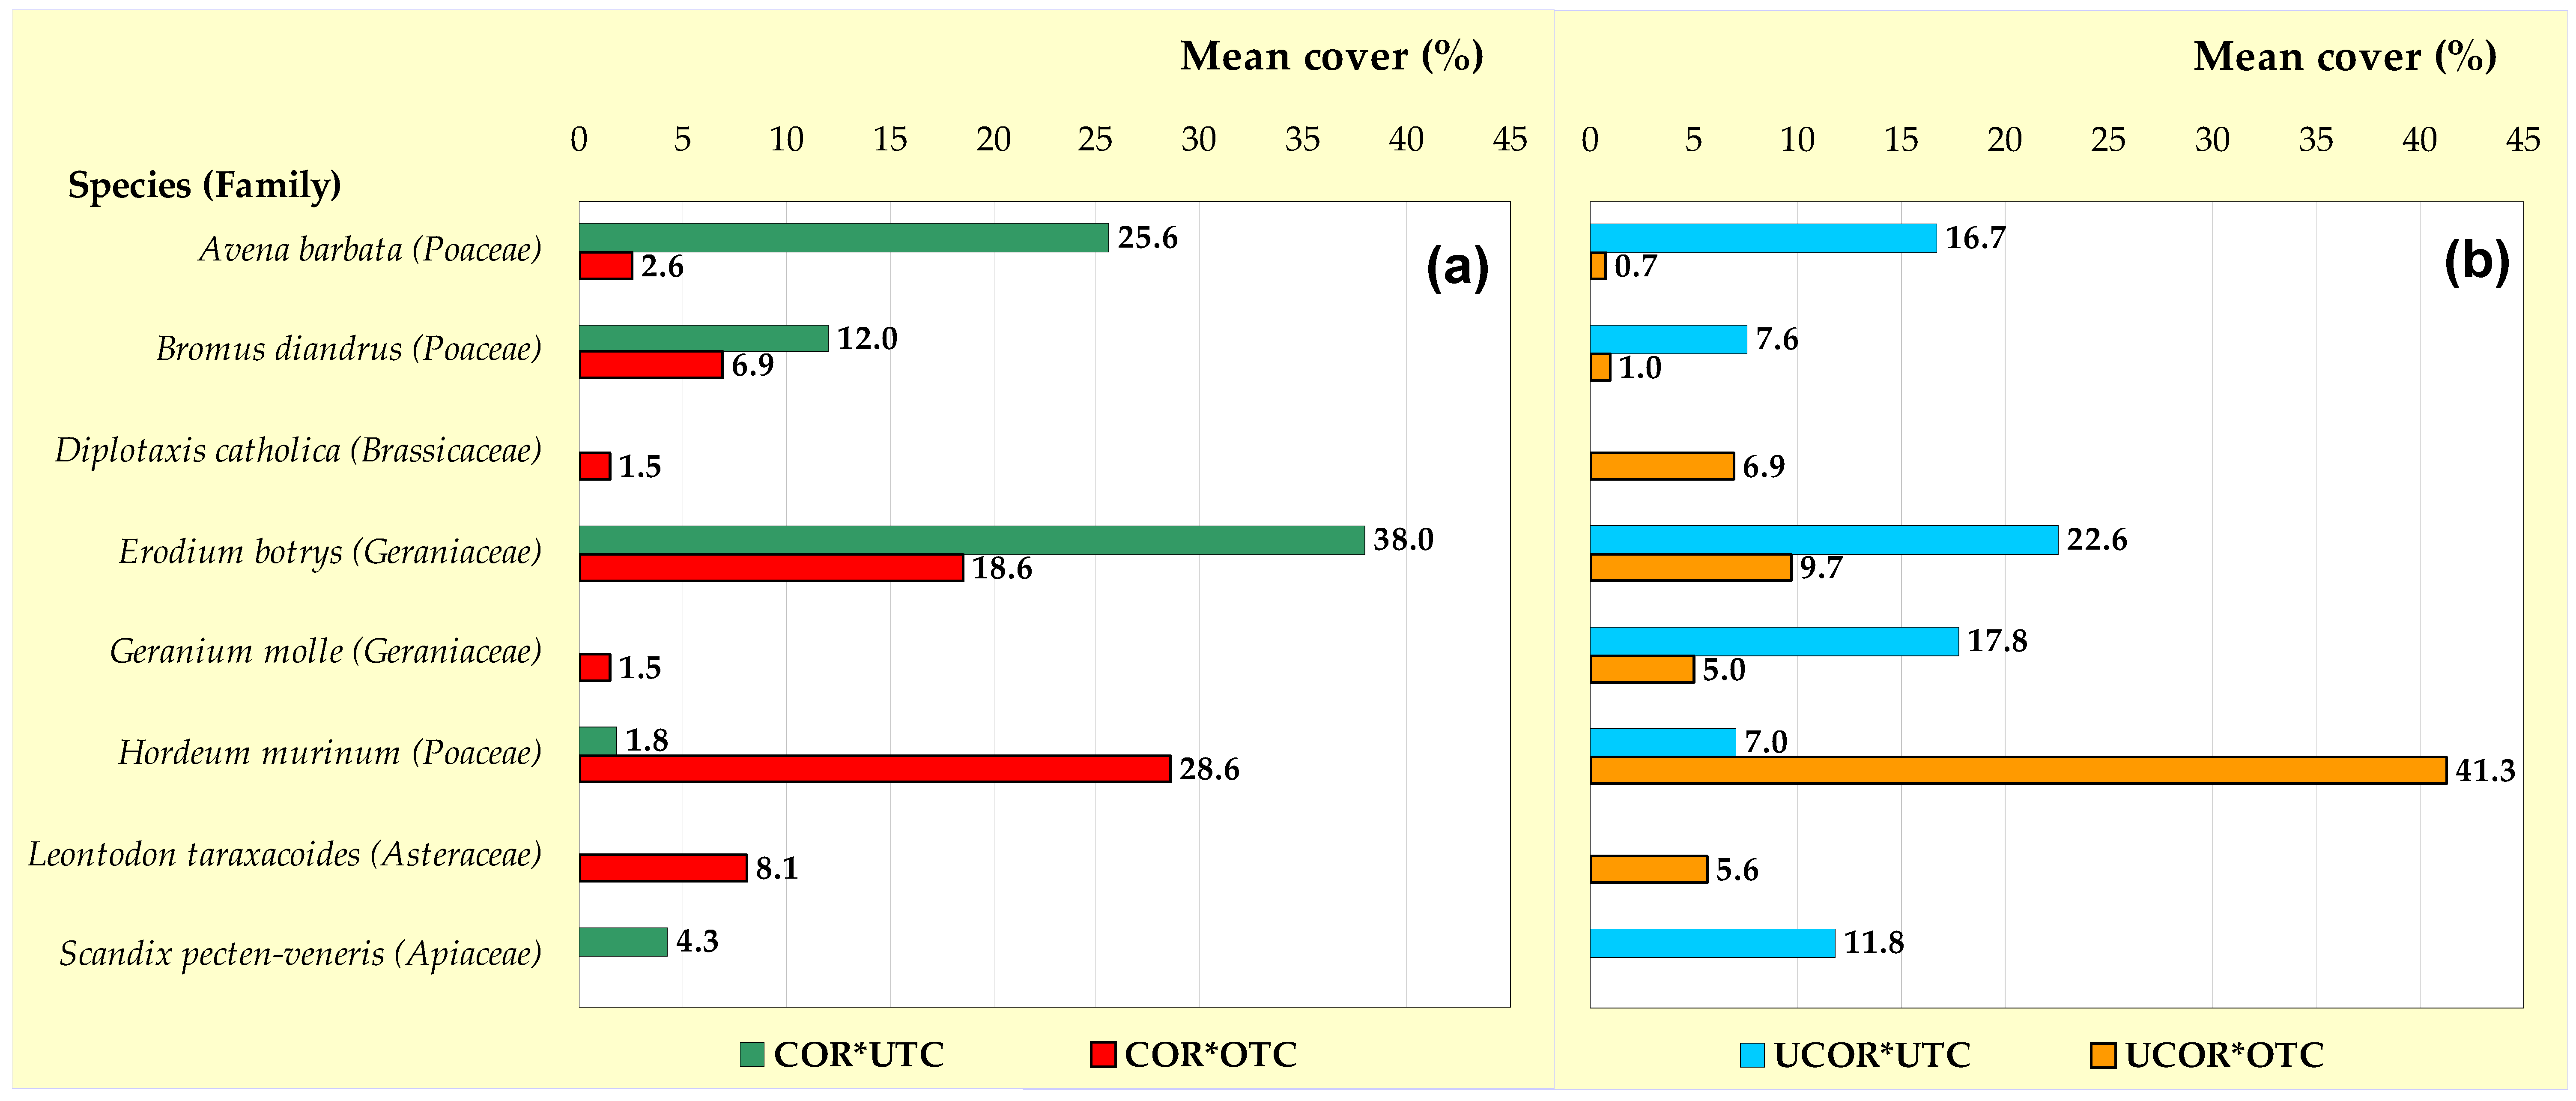
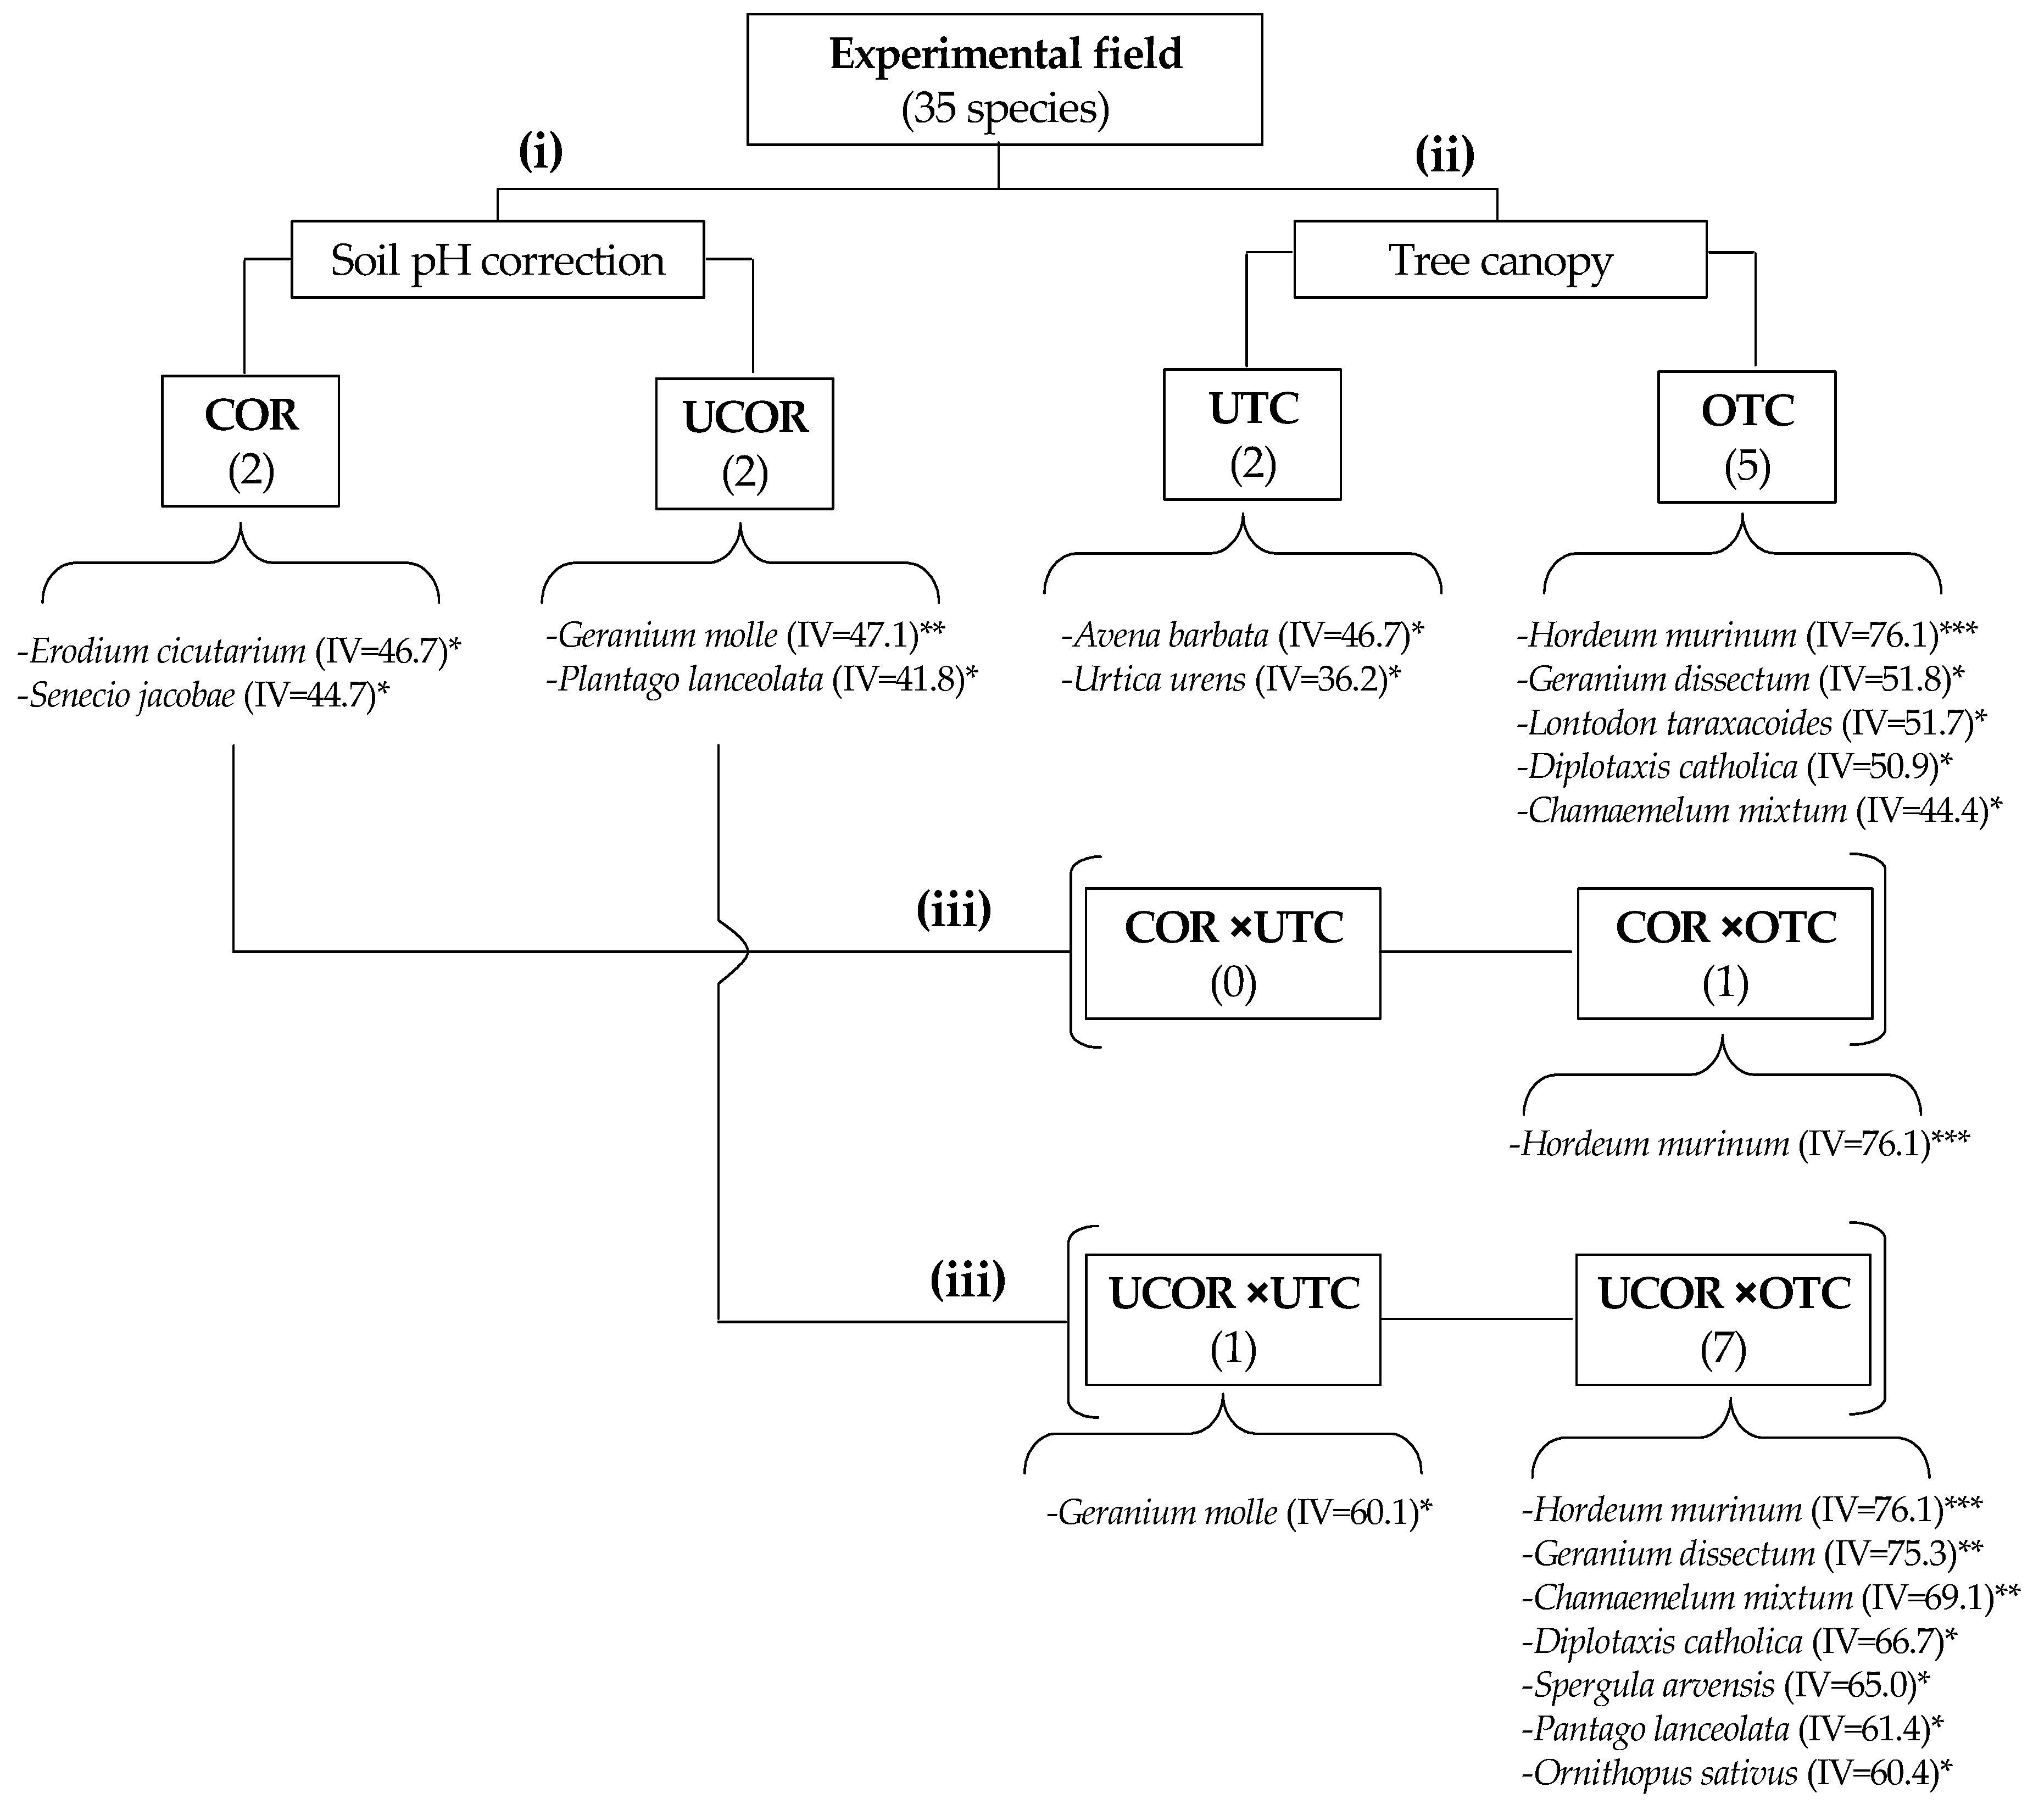
3.4. Spatial Variability of Pasture Floristic Composition (PFC)

In the experimental field, 35 botanical species were identified (Table 3). A general descriptive analysis reveals that the two more representative species (shaded values in Table 3) are Erodium botrys and Hordeum murinum. The first is of great interest for animal grazing and, at the same time, an indicator of good soil fertility, hence more representative UTC areas (38.0 ± 24.2% in COR areas; 22.6 ± 26.4% in UCOR areas). The second is more representative in OTC areas (28.6 ± 20.3% in COR areas; 41.3 ± 12.3% in UCOR areas). Together they account for about two-thirds of the soil vegetation cover (67% of COR areas and 64% of UCOR areas).
In terms of the number of species present, there is a clear negative effect of tree canopy on pasture species diversity (14 species UTC and 24 species OTC) and a very slight effect of soil amendment (30 species in COR areas and 28 species in UCOR areas). Figure 8 shows the eight species (and their families) with a greater presence in amended (a) and unamended (b) areas, accounting for more than 80% of UTC areas and approximately 70% of OTC areas. Apart from the two aforementioned species (Erodium botrys and Hordeum murinum), two other species, Avena barbata (25.6 ± 31.5% in COR areas and 16.7 ± 23.9% in UCOR areas) and Geranium molle, are prevalent in UTC areas, although only in uncorrected areas (17.8 ± 18.1%).
These results also show that vegetation cover is clearly higher in OTC areas (mean of 95%) than in UTC areas (mean of 65%), but very similar in COR areas (mean of 78.8%) and UCOR areas (mean of 81.3%) (Figure 9a). Other relevant aspects in this field are: (i) the absence of legumes in UTC areas; (ii) very low representativeness of legumes in OTC areas (mean of 5.7%) (Figure 9b); and (iii) the clear preponderance of two families, Poaceae (mean 41%) and Geraniaceae (mean of 32%) (Figure 9c).
After this general descriptive analysis, are presented in Figure 10 the results of three approaches of ISA in order to identify the bio-indicators species of each study area. In the factor soil pH correction (COR and UCOR) were identified four species characteristics, two responded well to the soil dolomitic limestone application, COR areas (Erodium circutarium and Senecio jacobae), and two to the UCOR areas (Geranium molle and Plantago lanceolata). In the factor tree canopy (UTC and OTC) were identified seven species characteristics, two indicators of good adaptation to the microclimate provided by tree canopy, UTC areas (Avena barbata and Urtica urens), and five of OTC areas (Hordeum murinum, Geranium dissectum, Leontodon taraxacoides, Diplotaxis catholica, and Chamaemelum mixum). In the combination of the two previous factors (soil pH correction and tree canopy) were identified eight species characteristics, one of UCOR × UTC areas (Geranium molle), one of COR and UCOR × OTC areas (Hordeum murinum) and six of UCOR × OTC areas (Geranium dissectum, Chamaemelum mixum, Diplotaxis catholica, Spergula arvensis, Plantago lanceolata, and Ornithopus sativus). Of all these, Hordeum murinum and Geranium dissectum species stand out, with IV > 75%, the first strong indicator of OTC areas (COR and UCOR) and the second strong indicator also of OTC areas, but only in UCOR areas.

4. Discussion

This study focuses on the montado ecosystem, covering about 3.5 million ha in the South-East region of the Iberian Peninsula [28]. This occupies mainly acid soils, which represent ≈50% of the world’s arable land [29]. Soil acidity and the toxicity associated with some elements (namely the Al and the Mn) are a very common stress factor in arable lands around the world [30], and in particular, they are some of the most important limiting factors to plant productivity in the South of Portugal [31].
The central question presented in this paper (“Can soil pH correction reduce the animal supplementation needs in the critical autumn period in Mediterranean montado ecosystem?”), finds an answer based on two approaches, interconnected in its discussion: (i) the variability of pasture productivity and quality; and (ii) the variability of spatial patterns of pasture floristic composition.

4.1. Variability Pattern of Pasture Productivity and Quality

Globally, as in other studies carried out on pastures integrated in agro-silvo-pastoral systems [9,15], there is a high spatial variability in pasture productivity (GM and DM; CV = 40–70%) and quality (CP; CV = 23–39%; NDF; CV = 6–21%).
Another aspect to be highlighted is related to the inter-annual variability in productivity. GM and DM were clearly higher in 2019/2020, which reflects the positive effect of the greater amount of precipitation that occurred in that year (627 mm verses 315 mm 2018/2019) [9]. In pasture cropping systems, production increases with rainfall [32]. In all years, higher productivity (in terms of DM) is observed in the spring compared to the other seasons, which is also in line with expectations, since it is the period when temperatures are most favorable for plant development [9]. The optimal temperature for growth of plants characteristic of temperate regions range between 15–23 °C, with various studies reporting a reduction in photosynthesis and growth outside of this range [6].
On the other hand, in both vegetative cycles corresponding to this study, pasture quality follows a pattern already identified in several works [1,9,12,15,19]: a progressive decrease in the relative contents of CP and an increase in the relative content of fiber (NDF) resulting in lower CP and higher NDF values in late spring.
Pasture is the main food resource in extensive livestock production systems [4] and can be considered a low-cost feed [3], but supplementation is inevitable in the Mediterranean climate [3]. The pattern of NDVI in the two years under study (Figure 7) showed that between June and November, but sometimes for longer periods depending on the distribution of precipitation in the autumn months, animal feed supplementation is required so that the animals do not lose body condition [33]. A critical threshold is defined by an NDVI value of 0.6, below which CP content in these dryland and biodiverse pastures corresponds to the sheep maintenance requirements of 9.4% [27].
The surface application (not incorporated into the soil through mobilization) of amendments does not result in an immediate and significant increase in the soil pH, but rather in a gradual increase over time [34,35]. However, the benefit of soil pH correction observed in these fields, in terms of anticipating CP availability in the autumn, after several months of supplementation, is a key aspect in terms of ecosystem management and economic and environmental sustainability. Pasture crude protein availability (CPvar, in kg ha−1 day−1) is a very practical indicator because it integrates both pasture productivity (DM) and pasture quality (CP) [12].
Regarding the effect of tree canopy on pasture productivity, the competition for resources water, light, and nutrients are considered as the main reason for decreased yields UTC in winter and especially in spring [15,16]. However, given that tree canopy contributes to less pasture evapotranspiration and, as a consequence, guarantees higher soil moisture content [19], and also because UTC areas are usually more fertile [19], the critical factor for the lower pasture productivity under tree canopy must result from the combination of four sub-factors: (i) lower incidence of solar radiation, which affects directly the physiological processes of plants and net DM production [15], since light interception by plant leaves is used in photosynthesis to provide energy for plant maintenance, to grow new leaves and roots, and to produce carbohydrates [36]; (ii) lower land cover, due to the release of inhibitory substances resulting from leaves and other tree residues [32]; (iii) development of less productive botanical species; Graß et al. [16] highlight the shadow inhibitor effects specifically on the growth of legumes; and (iv) livestock grazing, which, according to Hussain et al. [37] can have an important influence on sward composition, quality and production UTC and OTC.
Relatively to pasture quality, throughout the entire vegetative cycle, the highest CP values are obtained in UTC areas comparing to OTC areas, which finds support on the influence of tree canopy on microclimate and soil properties [15,19,38]. Sousa et al. [39] attributed the higher quality of pasture UTC in terms of CP levels to the delay in the ontogenic development of shady plants (less advanced state of vegetative development), keeping them younger physiologically and allowing the maintenance of higher metabolic levels for a longer period of time. Herbage quality is mainly determined by plant species (and functional groups; e.g., legumes have more protein than grasses [40]), but also influenced by plant parts (leaves/stems) and plant maturity, with young plants having higher protein and mature plants higher fiber content [41].
Agroforestry systems, as is the case of Montado, the most common production system in the Alentejo region in Southern Portugal [10], are often described as an innovative, multifunctional, and sustainable option due to their multiple several environmental benefits, e.g., soil protection, biodiversity, nutrient conservation, mitigation of climate change by C-sequestration and enhanced adaptation to climate change [16]. To this environmental vision must be added the perspective of economic sustainability of extensive livestock production. These results show, on the one hand, the positive and combined effect of soil correction and tree canopy on the availability of CP at the beginning of the vegetative cycle (autumn), which will reduce the need for supplementation. On the other hand, animals find at the end of the vegetative cycle (late spring) in OTC areas the greatest availability of pasture (DM), which allows them to maintain their body condition without the need for supplementation in early summer (July), using the shade UTC for rest and well-being in view of the high temperatures that occur in this season.

4.2. Variability of Spatial Pattern of Pasture Floristic Composition (PFC)

Composition and functional diversity are among the most significant ecological attributes of a particular ecosystem [42]. One of the aspects that should be highlighted in the spatial variability pattern of PFC of this experimental field is the smaller vegetation cover UTC relatively to OTC areas. This aspect is particularly important because it has a direct and negative effect on pasture productivity. Modifications to vegetation cover and botanical composition under tree canopy are caused by changes in the microclimate, soil properties, and livestock grazing [15]. Gómez-Rey et al. [43], for example, reported that the soil UTC presents higher density and lower porosity as a result of the greater compaction caused by the animals. The smaller number of species present UTC may, therefore, reveal the reduced capacity of some botanical species to sustain animal grazing, especially with moist soil in autumn and winter, or the effect of tree shade. On the other hand, tree litter, mainly leaves, overlaying the pasture and the subsequent incorporation and decomposition into the soil can immobilize nitrogen and contribute to reduced pasture growth [44]. Additionally, deleterious effects of substances (allelopathic agents) exuded from leaves or roots may retard plant growth near the trees [32].
Although it is possible to identify bio-indicators that confirm that tolerance to soil acidity depends on the plant species [11], in this study, the effect of tree canopy on PFC was stronger than the effect of soil pH correction. ISA identified only four species that are characteristic of soil pH correction factor (two in COR areas and two in UCOR areas), in contrast with seven species identified in the tree canopy factor (two in UTC areas and five in OTC areas). This is, however, an expected scenario, since soil correction in this experimental field is a relatively recent intervention, and it is known that soil acidity amendment using dolomitic limestone is a slow and gradual process [12]. The tree effect is, on the other hand, the accumulated consequence of several decades. Nevertheless, based on the criteria proposed by Dufrêne and Legendre [24], all identified species can be considered strong bio-indicators for each group (IV > 25%).
In terms of balance, the clear preponderance in this experimental field of vegetation belonging to the syntaxonomic unit “Stellarietea mediae” (six of the eight species with greater representation) and the “Poaceae” family (Figure 9c), which usually have low nutritional value for animal grazing, indicates a low pasture quality. The presence in the list of the eight more representative species, of only one species of syntaxonomic unit “Poetea bulbosae” (Erodium botrys), of great interest for animal grazing and representing a coverage area of 10–38% (especially in more fertile soils, in COR areas and UTC) and one species of syntaxonomic unit “Tuberarietea guttatae” (Leontodon taraxacoides), representing a coverage area of only 6–8% (only in OTC areas) indicate the need for pasture improvement and rehabilitation. The main indicator regarding the degradation of pasture quality is the very small presence of the legumes functional group [40], family “Fabaceae” (Trifolium repens; Ornithopus sativus, and Ornithopus pinnatus), representing 4–7% of coverage area and only OTC. The lower legume contribution may be a consequence of shadow effects of grasses, taller upright, which inhibit the growth of the prostrate legumes, through reduced radiation, putting them at an unfavorable competitive position [16]. According to Paço et al. [11] Mn toxicity is one of the most important constraints to plant growth in acid soils, especially for legumes dependent on N2-fixing symbiosis. The reduced presence of legumes in this ecosystem calls into question not only the soil fertility, because it compromises the atmospheric capture of nitrogen through symbiotic fixation by rhizobia [9], but also the nutritional value of pasture [45] and justifies, in this case, the differential application of nitrogen fertilizer and the reseeding of legumes to restore the pasture balance [9]. Improving the symbiotic performance of rhizobia with legumes growing in highly acidic and high Mn soils through sustainable agricultural practices is a great challenge [11]. Other effective ways to reverse land degradation and improve pasture biodiversity include implementation of dynamic grazing management [12], a holistic approach that in the coming years will greatly benefit from the development of technologies associated with Precision Agriculture, namely, proximal and remote sensing and global navigation satellite systems.
This possibility of using botanical species as bio-indicators of greater or lesser adaptability to changes in soil pH or to tree canopy effect justifies continuing their monitoring in future studies while integrating into this complex dynamic the inter-annual irregularity of rainfall that is characteristic of the Mediterranean climate.

5. Conclusions

Extensive livestock production in Mediterranean climate conditions and acidic soils requires animal feed supplementation over a considerable period of the year, with high costs. Strategies that can improve the pasture productivity and quality in these critical periods and reduce the dependence on supplementation, contribute to the increase of the profit margin of farmers and to the environmental sustainability of these ecosystems. The results of this study show the positive and combined effect of dolomitic limestone application and tree canopy on the DM and CP daily growth rate (in kg ha−1 day−1) at the beginning of the vegetative cycle (autumn). Thus, anticipating pasture availability and reducing the need for animal supplementation. This study also shows the importance of monitoring pasture floristic composition, as a bio-indicator of the effect of soil pH correction and tree canopy. The very weak expression of the functional group legumes (only 4–7% of coverage area) is the main indicator of degradation of this pasture and justifies, in this case, the differential application of nitrogen fertilizer and the reseeding of legumes to restore the pasture balance and to improve the ecosystem response to the rehabilitation strategies.

Author Contributions

Conceptualization, J.S., A.P. and M.C.; formal analysis, J.S., S.S., and M.C.; funding acquisition, J.S. and M.C.; investigation, J.S., F.C. and E.C.; methodology, J.S., S.S., F.C., E.C., and A.P.; project administration, J.S. and A.P.; supervision, J.S., A.P. and M.C.; validation, J.S., S.S.; visualization, J.S. and S.S.; writing—original draft preparation, J.S.; writing—review and editing, S.S. All authors have read and agreed to the published version of the manuscript.

Funding

This work was funded by National Funds through FCT (Foundation for Science and Technology) under the Project UIDB/05183/2020 and by the projects PDR2020−101-030693 and PDR2020−101-031244 (“Programa 1.0.1-Grupos Operacionais”).

Institutional Review Board Statement

Not applicable.

Informed Consent Statement

Not applicable.

Data Availability Statement

Not applicable.

Acknowledgments

The authors would like to express their sincere appreciation to Carlos Pinto Gomes, Eliana Machado, Paulo Palma and Paulo Infante for their support in floristic inventory of species present in pasture of the experimental field and the respective Indicator Species Analysis.

Conflicts of Interest

The authors declare no conflict of interest.

References

  1. Serrano, J.; Sales-Baptista, E.; Shahidian, S.; Marques da Silva, J.; Ferraz de Oliveira, I.; Lopes de Castro, J.; Pereira, A.; Cancela d’Abreu, M.; Carvalho, M. Proximal sensors for monitoring seasonal changes of feeding sites selected by grazing ewes. Agroforest. Syst. 2018, 95, 55–69. [Google Scholar] [CrossRef]
  2. Hanson, J.; Ellis, R.H. Progress and Challenges in Ex Situ Conservation of forage germplasm: Grasses, herbaceous legumes and fodder trees. Plants 2020, 9, 446. [Google Scholar] [CrossRef] [Green Version]
  3. Santos, S.K.; Falbo, M.K.; Sandini, I.E.; Pacentchuk, F.; Neumann, M.; Garbossa, G. Concentrate supplementation strategies in ryegrass pasture for productive performance in lambs. Span. J. Agric. Res. 2018, 16, 1–6. [Google Scholar] [CrossRef]
  4. Polo, J.L.M.; Bellido, I.G.; Rodriguez, M.E.S. Plant production and nutritive quality of savannah-like grasslands (dehesas) in semi-arid zones of the province of Salamanca. Span. J. Agric. Res. 2003, 1, 41–49. [Google Scholar] [CrossRef] [Green Version]
  5. Scocco, P.; Piermarteri, K.; Malfatti, A.; Tardella, F.M.; Catorci, A. Effects of summer rainfall variations on sheep body state and farming sustainability in sub-Mediterranean pastoral systems. Span. J. Agric. Res. 2016, 14, 1–4. [Google Scholar] [CrossRef] [Green Version]
  6. Perera, R.S.; Cullen, B.R.; Eckard, R.J. Growth and physiological responses of temperate pasture species to consecutive heat and drought stresses. Plants 2019, 8, 227. [Google Scholar] [CrossRef] [Green Version]
  7. Ruiz, F.A.; Vázquez, M.; Camuñez, J.A.; Castel, J.M.; Mena, Y. Characterization and challenges of livestock farming in Mediterranean protected mountain areas. Span. J. Agric. Res. 2020, 18, 1–14. [Google Scholar] [CrossRef]
  8. IUSS Working Group WRB. World Reference Base for Soil Resources 2014; International Soil Classification System for Naming Soils and Creating Legends for Soil Maps. Update 2015; World Soil Resources Report 106; Food and Agriculture Organization (FAO): Rome, Italy, 2015; 188p. [Google Scholar]
  9. Efe Serrano, J. Pastures in Alentejo: Technical Basis for Characterization, Grazing and Improvement; Universidade de Évora—ICAM, Ed.; Gráfica Eborense: Évora, Portugal, 2006; pp. 165–178. (In Portuguese) [Google Scholar]
  10. Carvalho, M.; Goss, M.J.; Teixeira, D. Manganese toxicity in Portuguese Cambisols derived from granitic rocks: Causes, limitations of soil analyses and possible solutions. Rev. Cienc. Agrar. 2015, 38, 518–527. [Google Scholar] [CrossRef]
  11. Paço, A.; da-Silva, J.R.; Torres, D.P.; Glick, B.R.; Brígido, C. Exogenous ACC Deaminase is key to improving the performance of pasture legume-rhizobial symbioses in the presence of a high manganese concentration. Plants 2020, 9, 1630. [Google Scholar] [CrossRef]
  12. Serrano, J.; Shahidian, S.; Marques da Silva, J.; Moral, F.; Carvajal-Ramirez, F.; Carreira, E.; Pereira, A.; Carvalho, M. Evaluation of the effect of dolomitic lime application on pastures—Case study in the Montado Mediterranean ecosystem. Sustainability 2020, 12, 3758. [Google Scholar] [CrossRef]
  13. Demarchi, L.O.; Scudeller, V.V.; Moura, L.C.; Dias-Terceiro, R.G.; Lopes, A.; Wittmann, F.K.; Piedade, M.T.F. Floristic composition, structure and soil-vegetation relations in three white-sand soil patches in central Amazonia. Acta Amaz. 2018, 48, 46–56. [Google Scholar] [CrossRef] [Green Version]
  14. Serrano, J.; Shahidian, S.; da Silva, J.M.; Carvalho, M. A holistic approach to the evaluation of the Montado ecosystem using proximal sensors. Sensors 2018, 18, 570. [Google Scholar] [CrossRef] [Green Version]
  15. Benavides, R.; Douglas, G.B.; Osoro, K. Silvopastoralism in New Zealand: Review of effects of evergreen and deciduous trees on pasture dynamics. Agrofor. Syst. 2009, 76, 327–350. [Google Scholar] [CrossRef]
  16. Graß, R.; Malec, S.; Wachendorf, M. Biomass performance and competition effects in an established temperate agroforestry system of willow and grassland—Results of the 2nd rotation. Agronomy 2020, 10, 1819. [Google Scholar] [CrossRef]
  17. Ramírez, N.; Dezzeo, N.; Chacón, N. Floristic composition, plant species abundance, and soil properties of montane savannas in the Gran Sabana, Venezuela. Flora 2007, 202, 316–327. [Google Scholar] [CrossRef]
  18. Irume, M.V.; Morais, M.L.C.S.; Zartman, C.E.; Amaral, I.L. Floristic composition and community structure of epiphytic angiosperms in a terra firme forest in central Amazonia. Acta Bot. Bras. 2013, 27, 378–393. [Google Scholar] [CrossRef] [Green Version]
  19. Serrano, J.; Shahidian, S.; da Silva, J.M.; Sales-Baptista, E.; de Oliveira, I.F.; de Castro, J.L.; Pereira, A.; d’Abreu, M.C.; Machado, E.; Carvalho, M. Tree influence on soil and pasture: Contribution of proximal sensing to pasture productivity and quality estimation in montado ecosystems. Int. J. Remote Sens. 2018, 39, 4801–4829. [Google Scholar] [CrossRef]
  20. Egner, H.; Riehm, H.; Domingo, W.R. Untersuchungen über die chemische Bodenanalyse als Grudlage für die Beurteilung des Nahrstoffzunstandes der Boden. II: Chemische extraktion methoden zur phosphor- und kalium-bestimmung. K. Lantbrhogsk. Annlr 1960, 26, 199–216. (In German) [Google Scholar]
  21. AOAC. Official Method of Analysis of AOAC International, 18th ed.; AOAC International: Arlington, AT, USA, 2005. [Google Scholar]
  22. Braun-Blanquet, J. Pflanzensoziologie, 3rd ed.; Grundzüge der Vegetationskunde; Springer: Vienna, Austria; New York, NY, USA, 1964. [Google Scholar]
  23. Shore, A. DESeq and Indicator Species Analysis R script. Figshare. Software. 2020. [Google Scholar] [CrossRef]
  24. Dufrêne, M.; Legendre, P. Species assemblages and indicator species: The need for a flexible asymmetrical approach. Ecol. Monogr. 1997, 67, 345–366. [Google Scholar] [CrossRef]
  25. McGeoch, M.A.; Chown, S.L. Scaling up the value of bioindicators. Trends Ecol. Evol. 1998, 13, 46–47. [Google Scholar] [CrossRef]
  26. Bakker, J.D. Increasing the utility of Indicator Species Analysis. J. App. Ecol. 2008, 45, 1829–1835. [Google Scholar] [CrossRef]
  27. National Research Council. Nutrient Requirements of Sheep, 6th ed.; National Academy Press: Washington, DC, USA, 1985; Volume 5. [Google Scholar]
  28. Pinto-Correia, T.; Ribeiro, N.; Sá-Sousa, P. Introducing the montado, the cork and holm oak agroforestry system of Southern Portugal. Agrofor. Syst. 2011, 82, 99. [Google Scholar] [CrossRef] [Green Version]
  29. Sade, H.; Meriga, B.; Surapu, V.; Gadi, J.; Sunita, M.S.; Suravajhala, P.; Kavi Kishor, P.B. Toxicity and tolerance of aluminum in plants: Tailoring plants to suit to acid soils. Biometals 2016, 29, 187–210. [Google Scholar] [CrossRef]
  30. Kochian, L.V.; Piñeros, M.A.; Hoekenga, O.A. The physiology, genetics and molecular biology of plant aluminum resistance and toxicity. Plant Soil 2005, 274, 175–195. [Google Scholar] [CrossRef]
  31. Alho, L.; Carvalho, M.; Brito, I.; Goss, M.J. The effect of arbuscular mycorrhiza fungal propagules on the growth of subterranean clover (Trifolium subterraneum L.) under Mn toxicity in ex situ experiments. Soil Use Manag. 2015, 31, 337–344. [Google Scholar] [CrossRef]
  32. Luna, I.M.; Fernández-Quintanilla, C.; Dorado, J. Is Pasture Cropping a Valid Weed Management Tool? Plants 2020, 9, 135. [Google Scholar] [CrossRef] [Green Version]
  33. Serrano, J.; Shahidian, S.; da Silva, J.M. Monitoring seasonal pasture quality degradation in the Mediterranean montado ecosystem: Proximal versus remote sensing. Water 2018, 10, 1422. [Google Scholar] [CrossRef] [Green Version]
  34. Halim, N.; Abdullah, R.; Karsani, S.; Osman, N.; Panhwar, Q.; Ishak, C. Influence of soil amendments on the growth and yield of rice in acidic soil. Agronomy 2018, 8, 165. [Google Scholar] [CrossRef] [Green Version]
  35. Li, G.D.; Conyers, M.K.; Helyar, K.R.; Lisle, C.J.; Poile, G.J.; Cullis, B.R. Long-term surface application of lime ameliorates subsurface soil acidity in the mixed farming zone of south-eastern Australia. Geoderma 2019, 338, 236–246. [Google Scholar] [CrossRef]
  36. Rayburn, E.B.; Griggs, T.C. Light interception and the growth of pastures under ideal and stressful growing conditions on the Allegheny Plateau. Plants 2020, 9, 734. [Google Scholar] [CrossRef]
  37. Hussain, Z.; Kemp, P.D.; Horne, D.J. Pasture production under densely planted young willow and poplar in a silvopastoral system. Agrofor. Syst. 2009, 76, 351–362. [Google Scholar] [CrossRef]
  38. Marcos, G.M.; Obrador, J.J.; Garcia, E.; Cubera, E.; Montero, M.J.; Pulido, F.; Dupraz, C. Driving competitive and facilitative interactions in oak dehesas through management practices. Agrofor. Syst. 2007, 70, 25–40. [Google Scholar] [CrossRef]
  39. Sousa, L.F.; Maurício, R.M.; Moreira, G.R.; Gonçalves, L.C.; Borges, I.; Pereira, L.G.R. Nutritional evaluation of “Braquiaro” grass in association with “Aroeira” trees in a silvopastoral system. Agrofor. Syst. 2010, 79, 189–199. [Google Scholar] [CrossRef]
  40. Avdiu, B.; Aliu, S.; Fetahu, S.; Zeka, D.; Rusinovci, I. The floristic composition of the natural pastures in Massive of Novoberba. Agric. For. 2018, 64, 235–241. [Google Scholar]
  41. Sales-Baptista, E.; Oliveira, I.F.; Santos, M.B.; Castro, J.A.; Pereira, A.; Rafael, J.; Serrano, J. Tecnologia GNSS de baixo custo na monitorizacão de ovinos em pastoreio. Rev. Cienc. Agrar. 2016, 39, 251–260. (In Portuguese) [Google Scholar] [CrossRef]
  42. Solefack, M.C.M.; Fedoung, E.F.; Temgoua, L.F. Factors determining floristic composition and functional diversity of plant communities of Mount Oku forests, Cameroon. J. Asia Pac. Biodiver. 2018, 11, 284–293. [Google Scholar] [CrossRef]
  43. Gómez-Rey, M.X.; Garcês, A.; Madeira, M. Soil organic-C accumulation and N availability under improved pastures established in Mediterranean Oak Woodlands. Soil Use Manag. 2012, 28, 497–507. [Google Scholar] [CrossRef]
  44. Guevara-Escobar, A.; Kemp, P.D.; Mackay, A.D.; Hodgson, J. Pasture production and composition under poplar in a hill environment in New Zealand. Agrofor. Syst. 2007, 3, 199–213. [Google Scholar] [CrossRef]
  45. Ferraz de Oliveira, M.I.; Lamy, E.; Bugalho, M.N.; Vaz, M.; Pinheiro, C.; Cancela d’Abreu, M.; Capela e Silva, F.; Sales-Baptista, E. Assessing foraging strategies of herbivores in Mediterranean oak woodlands: A review of key issues and selected methodologies. Agrofor. Syst. 2013, 87, 1421–1437. [Google Scholar] [CrossRef]
Figure 1. Experimental field: (a) picture of montado ecosystem; (b) sampling areas, amended and unamended (COR and UCOR, respectively) and the six trees used in each area as reference in sampling process.
Agronomy 11 00514 g001
Figure 2. Thermo-pluviometric diagram of Meteorological Station of Mitra (Évora, Portugal) between July 2018 and June 2020. Is also indicates the accumulated rainfall by season and year.
Agronomy 11 00514 g002
Figure 3. Chronological sequence of the interventions and measurements in the experimental field between October 2015 and June 2020. PFC—Evaluation of pasture floristic composition.
Agronomy 11 00514 g003
Figure 4. Evolution of pasture dry matter (DM; (a)) and crude protein (CP; (b)) in the experimental field: average values of 2018/2019 and 2019/2020 vegetative cycles.
Agronomy 11 00514 g004
Figure 5. Pasture daily growth rate (kg·ha−1·day−1) in amended areas (COR) and unamended areas (UCOR), in the vegetative cycles of 2018/2019 ((a,b), respectively dry matter, DMvar and crude protein, CPvar) and 2019/2020 ((c,d), respectively dry matter, DMvar and crude protein, CPvar). * Significant at the 0.05 level.
Agronomy 11 00514 g005
Figure 6. Pasture daily growth rate (kg·ha−1·day−1) under tree canopy (UTC) and outside tree canopy (OTC), in the vegetative cycles of 2018/2019 ((a,b), respectively dry matter, DMvar and crude protein, CPvar) and 2019/2020 ((c,d), respectively dry matter, DMvar and crude protein, CPvar). * Significant at the 0.05 level.
Agronomy 11 00514 g006
Figure 8. Species (and their families) with greater representation in amended areas (COR; (a)) and in unamended areas (UCOR; (b)), under tree canopy (UTC) and outside tree canopy (OTC).
Agronomy 11 00514 g008
Figure 9. Pasture characteristics of the experimental field in spring 2020, in amended (COR) and unamended areas (UCOR), under tree canopy (UTC) and outside tree canopy (OTC): (a) vegetation cover (%); (b) floristic composition by groups; (c) floristic composition by families.
Agronomy 11 00514 g009
Figure 10. Dendogram representing the results of ISA in three approaches: (i) soil pH correction factor, (ii) tree canopy factor and (iii) combination of the two previous factors. COR—Amended area; UCOR—Unamended area; UTC—Under tree canopy; OTC—Outside tree canopy; IV—Indicator value; ***—Probability < 0.001; **—Probability < 0.01; *—Probability <0.05.
Agronomy 11 00514 g010
Table 1. Descriptive (mean ± standard deviation) and inferential statistics of soil parameters in experimental field (0–0.30 m depth).
Soil ParametersGLOBALCORUCORProb.UTCOTCProb.Ref.
October 2015 --- [19]
pH5.4 ± 0.35.4 ± 0.45.3 ± 0.2ns
Mg (mg kg−1)95.6 ± 43.7115.0 ± 38.876.3 ± 40.90.0503
Mn (mg kg−1)76.4 ± 44.9100.0 ± 45.752.8 ± 30.10.0131
October 2018 [12]
pH5.4 ± 0.2 5.6 ± 0.25.3 ± 0.20.01935.5 ± 0.25.3 ± 0.20.0232
Mg (mg kg−1)78.1 ± 33.082.9±32.173.3±34.6ns84.2 ± 21.272.1 ± 41.8ns
Mn (mg kg−1)50.2 ± 29.733.6±16.166.8±31.4038.4 ± 23.462.1 ± 31.50
March 2020 -
pH5.7 ± 0.35.8 ± 0.45.6 ± 0.20.02255.8 ± 0.25.6 ± 0.40.0331
Mg (mg kg−1)94.8 ± 29.2108.1 ± 22.371.3 ± 16.80.0442102.4 ± 25.879.8 ± 19.30.0215
Mn (mg kg−1)40.1 ± 17.332.5 ± 13.651.6 ± 24.60.018247.6 ± 22.334.3 ± 16.10.0441
GLOBAL—All area; COR—Amended areas; UCOR—Unamended areas; UTC—Under tree canopy areas; OTC—Outside tree canopy areas; SD—Standard deviation; Prob.—Significance (Probability) at level 0.05; ns—Not significant; Ref.—Reference; Mg—Magnesium; Mn—Manganese.
Table 2. Descriptive (mean ± standard deviation) and inferential statistics of pasture parameters of the experimental field.
Pasture ParametersCORUCORProb.UTCOTCProb.COR × UTCCOR × OTCUCOR × UTCUCOR × OTC
GM (t ha−1)
2018/2019, Autumn7.9 ± 3.46.8 ± 2.4ns6.9 ± 3.57.9 ± 2.9ns7.9a7.8a5.6b8.0a
Winter 16.3 ± 9.88.7 ± 4.90.04869.2 ± 8.115.8 ± 7.80.020513.7a18.8a4.6b12.8a
Spring4.9 ± 2.64.7 ± 2.8ns2.7 ± 1.46.9 ± 1.90.00013.3b6.6a2.2b7.2a
2019/2020, Autumn8.3 ± 3.45.1 ± 2.20.02777.6 ± 3.85.8 ± 2.40.09599.5a7.2b5.7bc4.4c
Winter 14.4 ± 6.713.0 ± 5.5ns12.5 ± 5.314.8 ± 6.7ns14.1a14.7a10.9b15.0a
Spring12.7 ± 4.614.7 ± 8.7ns9.8 ± 2.517.8 ± 7.40.00109.3b16.2a9.9b19.4a
DM (t ha−1)
2018/2019, Autumn1.1 ± 0.60.9 ± 0.2ns1.0 ± 0.61.0 ± 0.3ns1.2a1.0a0.9a1.1a
Winter 2.3 ± 0.91.4 ± 0.40.01981.6 ± 0.82.1 ± 0.80.03072.1ab2.6a1.1c1.6bc
Spring3.0 ± 1.83.1 ± 1.9ns1.7 ± 0.94.5 ± 1.30.00021.8b4.2a1.5b4.7a
2019/2020, Autumn1.3 ± 0.40.8 ± 0.40.02261.1 ± 0.51.0 ± 0.4ns1.2a1.3a0.9b0.8b
Winter 2.1 ± 1.01.8 ± 0.4ns1.9 ± 0.72.0 ± 0.9ns2.0a2.1a1.8b1.9b
Spring2.9 ± 1.72.9 ± 1.3ns1.7 ± 0.54.1 ± 1.00.00001.5b4.4a2.0b3.8a
CP (%)
2018/2019, Autumn24.7 ± 8.621.0 ± 3.2ns25.1 ± 8.020.5 ± 3.90.070828.5a20.9b21.8ab20.2b
Winter 19.6 ± 6.219.1 ± 4.8ns20.3 ± 6.118.4 ± 4.7ns23.5a15.7b17.1b21.2ab
Spring10.5 ± 5.18.9 ± 1.9ns12.2 ± 4.07.2 ± 1.30.000414.1a6.8c10.2b7.6bc
2019/2020, Autumn19.3 ± 4.818.8 ± 4.1ns22.1 ± 3.416.0 ± 2.80.001522.5a16.0b21.8a15.9b
Winter 14.4 ± 4.015.7 ± 3.3ns15.53 ± 4.214.6 ± 3.2ns15.6a13.2b15.5a15.9a
Spring13.7 ± 6.213.0 ± 3.9ns17.4 ± 3.59.3 ± 2.50.000019.1a8.2b15.7a10.4b
NDF (%)
2018/2019, Autumn48.5 ± 9.750.4 ± 6.9ns52.2 ± 6.646.7 ± 9.2ns50.7a46.3a53.8a47.1a
Winter 43.1 ± 6.948.7 ± 9.00.042450.6 ± 9.141.2 ± 3.80.001444.7b41.5b56.7a40.8b
Spring63.6 ± 5.065.6 ± 2.8ns62.7 ± 4.066.5 ± 3.40.045760.6b66.7a64.9ab66.3a
2019/2020, Autumn36.3 ± 8.839.0 ± 6.8ns35.5 ± 7.439.9 ± 8.00.097634.8b37.9b36.2b41.9a
Winter 41.6 ± 6.348.7 ± 4.30.012643.1 ± 5.047.3 ± 7.20.045240.2c43.1bc46.0b51.5a
Spring57.3 ± 6.958.7 ± 6.2ns53.9 ± 5.762.1 ± 4.30.000251.5b63.2a56.3ab61.1a
N—Number of samples; COR—Amended areas; UCOR—Unamended areas; Prob.—Probability at level 0.05; UTC—Under tree canopy; OTC—Outside tree canopy; GM—Green matter; DM—Dry matter; CP—Crude protein; NDF—Neutral detergent fiber; Different lowercase letters in the interactions indicate significant differences in the mean of pasture parameters for the “Fisher’s” test (Prob. <0.05).
Table 3. Floristic composition (botanical species and family mean cover, %) of pasture of the experimental field in spring 2020.
FAMILY Botanical Species CORUCOR
UTCOTCUTCOTC
Vegetation cover 65.8 ± 14.391.7 ± 7.564.2 ± 15.398.3 ± 4.1
Bare soil 34.2 ± 14.38.3 ± 7.535.8 ± 15.31.7 ± 4.1
APIACEADaucus carota5.3 ± 13.006.9 ± 13.10
Scandix pecten-veneris4.3 ± 6.7011.8 ± 26.30
ARACEAEArum italicum1.0 ± 2.501.5 ± 3.70
ASTERACEAEChamaemelum mixtum00.3 ± 0.403.2 ± 3.1
Leontodon taraxacoides08.1 ± 9.205.6 ± 8.1
Senecio jacobae2.6 ± 5.55.3 ± 1.902.0 ± 1.9
Tolpis barbata01.3 ± 3.200.7 ± 1.7
BRASSICACEAE Diplotaxis catholica01.5 ± 3.806.9 ± 5.5
Raphanus raphanistrum02.1 ± 3.800.7 ± 1.8
BORAGINACEAE Echium plantagineum03.0 ± 7.200
CARYOPHYLLACEAE Cerastium glomeratum01.3 ± 3.21.1 ± 2.21.9 ± 2.1
Spergula arvensis0003.7 ± 4.1
FABACEAE Medicago polymorpha0.2 ± 0.4000
Ornithopus pinnatus0001.1 ± 1.8
Ornithopus sativus0005.3 ± 6.6
Trifolium repens04.3 ± 9.400.7 ± 1.8
GERANIACEAEErodium botrys38.0 ± 24.218.6 ± 26.522.6 ± 26.49.7 ± 11.2
Erodium cicutarium2.8 ± 3.26.5 ± 8.700
Geranium dissectum00.6 ± 1.604.8 ± 3.4
Geranium molle01.5 ± 2.317.8 ± 18.15.0 ± 6.6
IRIDACEAEGynandrisis sisyrinchium00.6 ± 1.600.1 ± 0.3
PLANTAGINACEAEPlantago lanceolata000.2 ± 0.41.4 ± 1.6
POACEAEAvena barbata25.6 ± 31.52.6 ± 4.116.7 ± 23.90.7 ± 1.8
Bromus diandrus12.0 ± 12.16.9 ± 14.97.6 ± 13.41.0 ± 1.8
Bromus hordeaceus00.4 ± 0.900
Hordeum murinum1.8 ± 4.428.6 ± 20.37.0 ± 10.941.3 ± 12.3
Lolium multiflorum2.3 ± 3.00.6 ± 1.600
Lolium rigidum00.4 ± 0.900
Poa annua0.2 ± 0.5000.1 ± 0.4
Vulpia geniculata1.3 ± 1.83.3 ± 2.63.0 ± 4.10.7 ± 0.3
POLYGONACEAERumex angiocarpus0003.0 ± 4.6
Rumex bucephalophorus01.0 ± 1.700.3 ± 0.4
Rumex conglomeratus00.5 ± 1.12.4 ± 4.40
RUBIACEAESherardia arvensis00.6 ± 1.600
URTICACEAEUrtica urens2.5 ± 4.801.4 ± 2.60
COR—Amended areas; UCOR—Unamended areas; UTC—Under tree canopy; OTC—Outside tree canopy.
Publisher’s Note: MDPI stays neutral with regard to jurisdictional claims in published maps and institutional affiliations.

