Abstract
Cover crops (CCs) are able to affect subsequent crop behaviour by acting on many soil variables and affecting the dynamics of different ecological processes. This study aimed to investigate the effects of introducing CC in continuous-maize cropping systems within Mediterranean areas. The experimental site was located in Central Italy, on a sandy loam and the research activity was carried out over two years (2019–2020). The two cropping systems in comparison differed from each other in terms of the CC cultivation: TR (treated, with CC) and CO (control, without CC). In both years, we observed a significant reduction (p < 0.05) of soil nitrate and water content for the TR system. In the shallowest layer (0–30 cm), nitrate content was reduced by up −80% and −65% (July 2019 and 2020), whereas soil moisture showed decreases ranging from −13% (July 2019) to −34% (May 2019). In 2019, the TR-maize (Zea mays L.) yield was statistically lower than CO (−443 g dm m−2), whereas in 2020 the yields of the two systems resulted statistically equivalent. This different behaviour can be explained with the serious delay in the CC sowing occurred in 2019 (12 December). Conversely, an increase in the apparent remaining N in the soil (+140 and +133 kg N ha−1 for 2019 and 2020, respectively) and in the C (carbon) inputs (+4.78 and +7.39 t dm ha−1 of biomass) were pointed out for the TR system. The large use of inputs in Mediterranean maize cropping systems limited some of the benefits from CCs, but their suitability has to be evaluated by considering all the involved effects, some of which need a long time to become appreciable.
1. Introduction
Cover crops (CCs) are considered a real opportunity to improve the sustainability of today’s cropping systems [1,2]. Their use, at first restricted to organic farming [3], has become a pillar for the most widespread environmentally friendly management systems, such as agroecology [4] or conservation agriculture [5].
CCs are able to affect the behaviour of subsequent crops by acting on many soil characteristics and, at the same time, they can drive dynamics of a large number of ecological processes, which are extremely relevant from an environmental point of view. Among the effects attributable to the former, we can mention: (i) soil humidity conservation [6], (ii) improvement of soil structure and aggregate stability [7], (iii) weed suppression [8], (iv) increased availability of nutrient [9], (v) enhancement of soil microbial environment and wildlife category [10]. Conversely, (i) soil erosion control [11], (ii) reduction of nutrient losses via run-off and leaching [12], (iii) increasing of organic C (carbon) content in soil [13] can be included in the second category. However, many barriers still impede a wide adoption of CCs also in conventional agriculture [14]. The first reason is the lack of robust scientific results on some adverse effects ascribable to CCs, such as an increase in gaseous exchange and global warming potential [15], and a variable level of competition with cash crops for edaphic factors (nutrients and water) [16]. In addition, a detailed economic analysis of the cost (tillage, seeds, termination) and the benefits (cost saving for the remaining N in soil or weed suppression) to be gained from the CC introduction is scarce and not exhaustive [17]. Other reasons can be the lack of training and technical assistance in relation to the cropping system re-arrangements that the introduction of cover implies [18] Therefore, the utility of CCs should be carefully evaluated before deciding about their introduction in cropping system design [19].The effects of CCs have been extensively investigated in recent decades [19,20,21] and researchers pointed out how the extent of these effects were greatly influenced by the site-specific conditions, such as cover crop species, soil nature, climate regime, crops in rotation, input level of the farming practices adopted [22,23,24]. For instance, the expected increase in SOM (soil organic matter) due to CC biomass burial is not generalizable. CCs can produce a priming decomposition effect on native SOM and/or an increase of the mineralisation rate of cash crop residues leading to a wide variation in SOM response in relation to the particular agro-environmental conditions [25]. Moreover, the tillage system chosen [26,27], the rate of nitrogen fertilizer applied [28] and the intensity in the use of irrigation [29] are all features able to mimic and substitute the effects of cover crops to the point that they become insignificant.
Maize (Zea mays L.)-based cropping systems had been always considered suitable for the introduction of CCs [30]. However, in Mediterranean areas, maize cultivation is supported by a large use of agronomic inputs (nitrogen fertilisers, irrigation, tillage systems) that are necessary to fully exploit the productive potential of this cereal crop [31]. Under these conditions, the suitability of the cover crops is questionable because the level of intensification adopted can nullify their agronomic benefits making their use unjustified [16,32]. On the other hand, intensive techniques of cultivation could increase the need to provide agro-ecosystem services in order to contain the incidence of anthropogenic impacts on the environment and, therefore, lead towards the adoption of CCs [20].
For these reasons, this study aims to evaluate the suitability of CCs in a Mediterranean continuous maize cropping system by exploring the effects of a mixture of gramineous and legumes species on chemical (nitrate content) and physical (moisture and bulk density) characteristics of the soil as well as the crop behaviour. Moreover, some agro-ecological aspects such as apparent remaining N in soil, C inputs, and weed suppression were considered in order to achieve a more complete evaluation of CC adoption.
2. Materials and Methods
2.1. Experimental Site
The experiment was carried out at the Agro-Environmental Research Centre “E. Avanzi” of the University of Pisa situated in the lower valley of the Arno River in Tuscany, Central Italy (43°40′ N, 10°19′ E, 2 m amsl). The soil (Typic Xerofluvent, USDA classification) was sandy-loam (clay 10%, silt 36%, sand 54%, USDA method) and previously it had been almost continuously grown with maize. The main chemical characteristics in the 0.00–0.30 m layer were the following: pH 8.0, organic matter 1.2% (w/w) (Walkley-Black method), total nitrogen 0.18% (w/w) (Kjeldhal method), assimilable phosphorus 16 ppm (Olsen method), exchangeable potassium 107 ppm (Thomas method), and cation exchange capacity 15 meq 100 g−1 (Bascom method). Climatic conditions are representative of Mediterranean coastal areas, with 900 mm of cumulated average annual rainfall and 15 °C of mean temperature [33]. Rainfalls are concentrated in autumn and, to a lesser extent, in spring, whereas summers are warm and humid, with maximum air temperature sometimes higher than 30 °C, and minimum relative humidity seldom less than 40%. Yearly global solar radiation is about 5200 MJ m−2 d−1. Figure 1 shows the time course of mean air temperatures and rainfall during the experimental period (years 2019 and 2020).
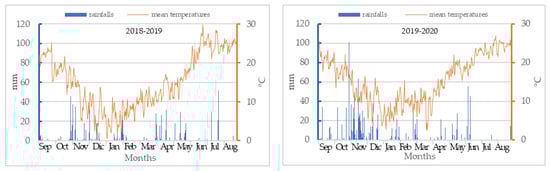
Figure 1.
Rainfall (mm) and mean temperatures (°C) during the experimental period: 2018–2019 and 2019–2020.
2.2. Field Experiment Set-Up
To evaluate the effects of a cover crop introduction, we set a comparison between two continuous maize cropping systems: TR (treated) with the cover crop and CO (control) without the cover crops. Hereafter, TR-1 and TR-2 refer to the results of the CC system obtained in 2019 and 2020, whereas we use CO-1 and CO-2 to indicate the annual results of the control.
The farming practices were the same for the two systems if we exclude the cover crop cultivation. They are representative of the main cultivation methods adopted by local farmers in terms of soil tillage (shallow ploughing), fertilisation rates (about 210 kg ha−1 of N), chemical weed control (post-emergence), and irrigation (1–2 interventions) and can be considered usual for semi-intensive models of conventional agriculture. For maize (Zea mays L.), a hybrid of Food and Agriculture Organization (FAO) class 600 was used in consideration of the silage destination of the crop. As cover crop, we chose to use a mixture of gramineous and leguminous species constituted by 20% of Lolium multiflorum Lam. (var. Westerwoldicum Mansh., diploid type), 30% Lolium multiflorum Lam. (var. Westerwoldicum Mansh., tetraploid type), 20% Vicia villosa Roth., and 30% Vicia sativa L. (percentage w/w on the composition of seeding mixture). The CC was sown in autumn after the soil ploughing and subsequent operations to obtain a good tilth and was killed by a disk-harrowing a few days before the maize sowing. No fertilisation and weed control were foreseen.
The main agronomic interventions carried out on the two systems over the two years are reported in Table 1.

Table 1.
Main cultivation practices for the treated (TR, with cover crops (CC)) and control (CO, without CC) systems.
The differences in the timing of interventions between the two years were caused only by the different weather patterns (Table 1). The main difference concerns the dates of the cover crop seeding. In the first year, the heavy autumn rainfalls forced us to a serious delay in sowing (12 December), unlike what happened the following year (30 September). As result of the different regimes of summer rainfalls, irrigation management was also changed over the two-year period. Only one intervention in 2019 (43 mm on 27 June) and two interventions in 2020 (64 mm on 16 July and 61 mm on 3 August).
2.3. Data Collection and Processing
Over the maize-growing season (from May to August), soil water content was monitored monthly for five soil layers (at 0–10, 10–20, 20–30, 30–40 and 40–50 cm) in order to evaluate the effects of CC on the possible plow pan (30 cm). The soil moisture was calculated with the gravimetric method (samples were weighed twice before and after oven drying at 60 °C until constant weight). Nitrate content was determined on the same samples taken to monitor soil moisture by pooling the first three (0–30 cm) and the last two (30–50 cm) layers. The ion chromatography method was used (Dx-500 ion chromatograph; Dionex, Sunnyvale, CA, USA).
On the same dates, samples of above-ground plant biomass were taken over a 2 m2 area from each experimental plot to evaluate the growth of maize and weeds, as well as their respective nutrient concentrations (N and P). The plant material was oven-dried at 60 °C until constant weight to determine the dry matter (dm). The dried samples were ground to 1 mm and directed to the analysis following digestion of 200 mg of plant material by H2SO4/H2O2 [34]. The Kjeldahl and the molybdenum blue (using a Perkin Elmer Lambda 25 spectrophotometer) methods were used to determine the N and P concentrations, respectively. The maize density was evaluated at the end of the maize cycle (August) by counting the plants present within a sampling area of 2 m2.
At the peak of the cover crop growth (May), a 0.5 m2 destructive sample was taken from each experimental plot to evaluate the above ground biomass of the two genera present in the cover crop mixture (Lolium and Vicia) and weeds. The samples were oven-dried at 60 °C until constant weight and, after weighting, the samples were milled and analysed as mentioned to determine the nutrient content (N and P) for each plant category.
The C/N of each plant genus present in the CC mixture was calculated by considering constant the C concentration fixed to 50% w/w of dm, according to [35], and by using the specific N concentration obtained by the analyses. The calculation of the nutrient restitutions to the soil was based on the product of the cover crop and weed biomass by their respective N and P contents. In the same way, we calculated the amount of N and P taken up by maize. The contribution of roots was never considered.
According to [36], we calculated the Apparent Remaining N in the Soil (ARNS) as ARNS (kg ha−1) = Ncover + Nmin + Nfert − Nup. Ncover is the N in the cover crop residues (or weed residues in the case of CO), Nmin is the mineral N in the soil at the maize sowing (we used the N nitrate failing the N ammonium data), Nfert is the N added with fertilization and Nup is the N taken up by maize at the harvest time. Finally, the soil bulk density (SBD) was measured twice, before the CC killing (May 2019) and after the maize harvest (August 2020). The soil samples were collected from five different depths (0–10, 10–20, 20–30, 30–40 and 40–50 cm) by using a steel probe with a metal cylinder inside (volume = 22.3 cm3) and were weighed after oven drying (105 °C for 24 h). Soil bulk density was calculated as the ratio between the weight of oven-dried soil and the volume of the cylinder [37].
Data were subject to analysis of variance (ANOVA) according to a randomised complete block design, with the maize cropping system as unique factor replicated four times on elementary plots of about 250 m2. The homogeneity of error variance (Bartlett test) was verified for each studied variable. The Duncan honest significant difference test was used for post-hoc means comparison at the 0.05 p-level. Nutrient concentration data were transformed in arcsine or natural logarithm to fulfil the assumptions of normal distribution (version 9.1; SAS Institute Inc., Cary, NC, USA). For the cumulative analysis of the two years of experimentation, a split-plot design was used with maize cropping systems in the main plots and years in the sub-plot. When treatments and interaction effects were significant, differences among treatment means were compared by using LSD [38].
3. Results
3.1. Cover Crop Biomass and Nutrient Content
The cover crop development was statistically different over the two years of experimentation (Table 2). In 2019, the reduction of above-ground biomass compared with 2020 (−230 g m−2) was almost relatable to a lower development of the vetch (−182 g of dm m−2) and, only to a lesser extent, to the Italian ryegrass (−48 g of dm m−2), as confirmed by the respective statistical tests.
Table 2.
Above-ground biomass (g m−2), N (mg g−1) and P (mg g−1) content, total N and P uptake (kg ha−1) and C/N ratio for the two CC genera and for the CC mixture. Different letters are significantly different at p < 0.05 (Duncan test).
Concerning the nutrient content, the only significant differences (p < 0.05) were observed for the phosphorous concentration in the vetch (2.63 and 1.55 mg g−1 for 2019 and 2020, respectively) and for the nitrogen concentration in the Italian ryegrass (12.2 and 15.9 mg g−1 for 2019 and 2020, respectively). The nutrient concentration of the cover crop mixture, obtained by considering the different contribution of the gramineous and leguminous species to biomass production, did not result significantly different (p > 0.05) in the two years either for N (15.7 and 20.5 mg g−1 for 2019 and 2020, respectively) and P (2.22 and 2.17 mg g−1 for 2019 and 2020, respectively) (Table 2).
The C/N of the vetch resulted very similar over the two years (about 17–18), whereas that of the Italian ryegrass varied significantly (p < 0.05) from 32 (2020) to 41 (2019). Overall, the C/N values of the mixture were statistically different in the two years (32 in 2019 and 24 in 2020) as well as the total amounts of N taken up by the CC (83 kg ha−1 in 2019 and to 156 kg ha−1 in 2020). Conversely, the P uptake was statistically equivalent in the two years and varied from 12 to 17 kg ha−1 (Table 2).
3.2. Soil Nitrate, Water Content and Bulk Density
The temporal trends of soil nitrate concentrations (NO3−) are depicted in Figure 2. In 2019, the concentrations of the shallowest soil layer (0–30 cm) became significantly different (p < 0.01) between CO-1 and TR-1 only after the top-dressing fertilisation in July (+226 ppm in favour of CO-1). In the second year, the two systems pointed out a more diversified behaviour. The CO-2 system showed statistically higher nitrates values both in May (+24 ppm) and especially in July (+290 ppm), whereas in August the situation was reversed and the values measured in TR-2 resulted significantly higher (p < 0.05) than the CO-2 ones (−154 ppm).
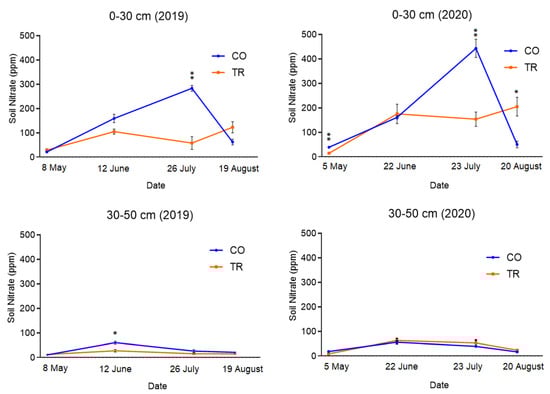
Figure 2.
Nitrate content (ppm) in the two soil layers, 0–30 cm and 30–50 cm for the TR (with CC) and CO (without CC) systems in 2019 and 2020 years. Vertical bars represent the standard error (* = p < 0.05 and ** = p < 0.01).
In the underlying layer (30–50 cm), the soil nitrate content was generally lower with values always below 70 ppm. The only significant difference (p < 0.05) observed during the experimental timespan was recorded in the June 2019 sampling date when the CO system exceeded TR by 33 ppm.
Concerning the water content (Figure 3), all the statistical significances were to the advantage of CO, which generally showed higher soil moisture values than TR. The overview of the data (Figure 3), allows us to distinguish different phases in the water content profile, which resulted similar during the two years of experimentation.
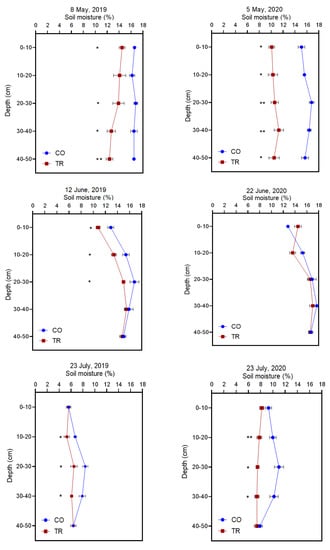
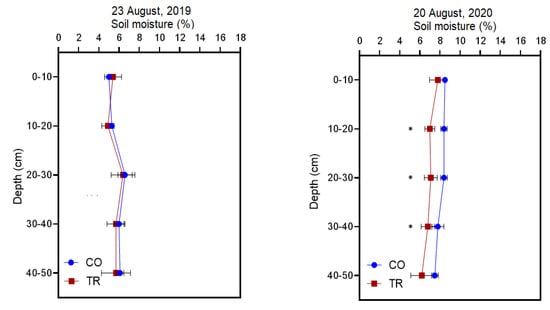
Figure 3.
Water content (% w/w) long the soil profile (0–50 cm) for the TR (with CC) and CO (without CC) systems. Horizontal bars represent the standard error (* = p < 0.05 and ** = p < 0.01).
In the initial phase (May), the soil moisture profiles of TR and CO appeared so well separated that the values differed significantly (p < 0.05) for nearly all (2019) or all (2020) the tested layers. Furthermore, in this phase, the water content remained almost constant at the different depths in both systems. In the next phase (June), the soil moisture increased with increasing depth. In 2019, the two curves (TR and CO) were statistically separated in the shallowest soil layers, but they approached each other to greater depths (30–40 and 40–50 cm) to the point of resulting statistically equivalent. In 2020, a similar trend was recorded, even if no significant difference (p > 0.05) was observed.
In July (third phase), the differences between the two systems were enhanced at the level of the three intermediate layers (10–40 cm), which showed water contents always statistically different. Conversely, the soil moisture measured at the extreme layers (0–10 and 40–50 cm) did not show significant differences (p > 0.05) between TR and CO and the values of the shallowest and the deepest layers tended, for each year to coincide. In the last phase (August), we found a pattern similar to that of the first phase even if the two curves (TR and CO) were closer to each other and the measured values were lower. Only in 2020 were significant differences (p < 0.05) between TR and CO found. These differences related to the intermediate soil thickness as in the previous month, although the gaps were smaller than those observed in July.
Finally, it seems that no significant effects (p > 0.05) on soil bulk density were attributable to the cover crop introduction since the TR and CO values were statistically equivalent for all the layers tested in the two sampling dates (Figure 4). However, in May, the SBD values of TR were constantly lower, along the profile, than those measured in CO plots, whereas in August, that is, at the end of maize cycle, the differences between the two systems had completely disappeared.
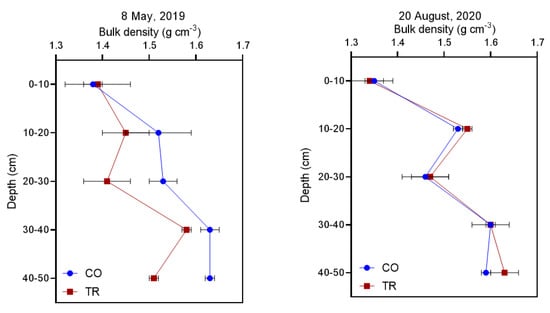
Figure 4.
Soil bulk-density (g cm−3) long the soil profile (0–50 cm) for the TR (with CC) and CO (without CC) systems before the CC killing (May 2019) and after the maize harvesting (August 2020). Horizontal bars represent the standard error.
3.3. Weed Biomass and Nutrient Content
The results on the weeds monitoring are reported in Table 3. Before the CC killing (May), the differences on weed development were statistically significant (p < 0.05) and remarkable for both years. In 2019, weeds reached 51 and 9 g of dm m−2 for CO and TR, respectively, whereas in 2020 the above ground biomass resulted lower in both systems (19 and 1 g of dm m−2 for CO and TR, respectively). The nutrient content of weeds in May was almost constant for the two years ranging from 31.4 to 32.9 mg g−1 for N and from 2.56 to 2.68 mg g−1 for P. Consequently, the C/N remained constant with values around 15. The differences between the two systems measured in July (after the post-emergence weeding) had narrowed and the weed biomass became statistically equivalent both in 2019 and 2020. At the end of the maize growing season (August), we again recorded a significant difference (p < 0.05) between CO (43 g of dm m−2) and TR (23 g of dm m−2) in the first year, but not in the second-one (13 g of dm m−2 for both systems).
Table 3.
Above-ground biomass of weeds (g m−2) in May, July and August. N (mg g−1) and P (mg g−1) content, N and P uptake (kg ha−1) and C/N ratio all measured in May. Different letters are significantly different at p < 0.05 (Duncan test).
3.4. Maize Biomass and Nutrient Content
The number of maize plants was statistically equivalent in the two systems both in 2019 (8.3 and 7.8 plants m−2 for CO and TR, respectively) and 2020 (6.7 and 7.3 plants m−2 for CO and TR, respectively). Maize growth was affected by the cover crop presence in different ways during the two years of experimentation (Table 4). In 2019, after an initial (June) advantage for the TR system (+9.2 g of dm m−2), the maize growth in the CO plots was significantly higher (p < 0.05) than in TR both in July (+268 g of dm m−2) and August (+443 g of dm m−2). In 2020 the maize following CC showed a significant increase (p < 0.05) in biomass production both in June (+15 g of dm m−2) and July (+174 g of dm m−2), whereas at the harvest time (August) the yields of the two systems were statistically equivalent (1582 and 1587 g of dm m−2 for CO and TR, respectively).
Table 4.
Above-ground biomass of maize (g m−2) measured at three different stages of the maize cycle. Different letters are significantly different at p < 0.05 (LSD test).
The cumulative processing of the annual yield data (August) put in evidence an interaction system × year, which resulted in the statistical superiority of CO-1 compared with the yields recorded in the other systems-year combinations (CO-2, TR-1 and TR-2).
About the nutrient content (Table 5), no significant differences (p > 0.05) were observed in the concentration of N and P for the two systems during the entire experimental period. The mean values of N measured at the harvest time were equal to 13.9 mg g−1 (CO) and 13.6 (TR) in 2019 and, slightly lower, in 2020 (11.7 for CO and 11.2 for TR). P concentrations recorded over the two years showed a narrower range passing from 2019 (2.12 for CO and 2.26 for TR) to 2020 (2.07 for TR and 2.33 for CO).
Table 5.
N (mg g−1) and P (mg g−1) content, N and P uptake (kg ha−1) for the TR (with CC) and CO (without CC) systems measured at the maize harvest time. Different letters are significantly different at p < 0.05 (Duncan test).
Consequently, the N uptake of maize without the CC was equal to 292 and 184 kg ha−1 in 2019 and 2020, respectively, whereas that with the CC was equal to 227 and 177 kg ha−1 for the same years (Table 5). The only significant difference (p < 0.05) between the two systems was observed for the N uptake in 2019 (+65 kg ha−1 for CO). About the P, the uptakes of maize recorded ranged from 33 to 38 kg ha−1 for TR and from 37 to 45 kg ha−1 for CO, without ever reaching statistical significance (p > 0.05). About the ARNS, it was evident that the CC can ensure a higher amount of apparent remaining N in soil. In the two years, TR showed values of ARNS always higher in comparison with CO (+140 and +132 kg N ha−1 in 2019 and 2020, respectively). Even limiting the Ncover to the contribution from the vetch only, the values of TR remained higher than those of CO (+87 and +57 kg N ha−1 in 2019 and 2020, respectively).
4. Discussion
4.1. Effect of the Cover Crop (CC) on Soil
The reason for the lower growth of the CC in 2019 was mainly related to the delay in sowing date (12 December, instead of 30 September). The depressive effect concerned mostly the vetch, whereas the reduction in development of Italian ryegrass was less marked. This difference in the amount and composition of the biomass buried affected, as reported below, the pattern of other variables.
About the nitrate content in the shallow layer (0–30 cm), the difference between TR-2 and CO-2 recorded before the CC killing and the pre-sowing N fertilisation (May) can be related to the larger incidence of leguminous plants and consequently to a more intense N-fixation activity. Similarly, at the end of summer (August), the increase in TR-2 values in comparison with CO-2 can be explained by the rising share of N from the mineralisation of organic matter due in turn to the different quantity and quality of the material incorporated into the soil.
Regarding the intermediate sampling dates, the significant reduction (p < 0.05) in nitrate concentrations recorded for TR-1 and TR-2 was the consequence of temporary immobilization of nitrogen fallowing the burying of the CC biomass carried out in May. This effect was already appreciable in June (after the N fertilisation at sowing time, 93 kg N ha−1), but it was more evident in July after the top-dressing N fertilisation (115 kg N ha−1). The C/N values calculated for the CC mixture (32 in 2019 and 24 in 2020) and the proximity of two sampling dates at the time of the CC killing (1 and 2 months, respectively) can support this hypothesis.
The differences between CO and TR almost disappeared in the underlying layer (30–50 cm) since the tillage did not allow the residues of CC to reach this depth and therefore the growth of the nitrogen immobilization did not occur [9].
Other authors reported similar results. Reference [30] observed in a continuous maize cropping system an initial reduction in soil mineral N content in the plots where the bare fallow was replaced by a CC of vetch or barley. Only after the third maize-growing seasons did the values of the system with the vetch exceed those of the bare soil, whereas in the plots with barley the N-min remained lower, and [36] reported an increase of the N-min soil content due the cover crop introduction only for the crimson clover in pure stand, whereas the mixture with growing rates of Italian ryegrass led to lower values than the control (spontaneous weeds). Reference [39] set the C/N threshold value at 25, beyond which immobilization processes prevail on mineralization ones.
Essentially, the capability of CC to supply N for succeeding crops depends on the intensity of pre-emptive competition before the CC killing and on the trade-off between mineralization/immobilization processes during the decomposition of cover crop residues. Under our conditions, the N immobilization process seemed to prevail definitely on the others at least until mid-summer.
The different development of the CC in the two years also produced effects on the soil water content. Indeed, it was evident that the differences between TR and CO at the first sampling date (May) were higher in 2020 than in 2019. On the other hand, the reduction of soil moisture due to CC introduction is well known in literature and is directly related to the consumption of water due to CC growth [6].
After the CC killing date (June), the differences between the two systems decreased (2019) or were cancelled (2020) in response to the rainfall in the previous periods (49 mm in the period 19–29 May 2019 and 101 mm in the period 10–14 June 2020). It is more difficult to explain the differences observed in the following dates. In July, CO showed a higher soil moisture content in both years. These results cannot be related to differences in the maize development and the consequent water consumes for evapotranspiration since TR-maize biomass was higher than CO in 2020 (+174 g of dm m−2), but lower in 2019 (−268 g of dm m−2). The differences in soil moisture between the two systems could be explained with a lower water retention capacity of TR due to a temporary increase in soil porosity (according to the values of bulk density measured in May).
As reported by [40], it takes more than 2 years before that the CC can increase water infiltration rate or ease the access of maize roots to deep soil water in relation to a lower penetration resistance. Furthermore, the use of ploughing causes the full inversion of soil layers and hinders the aforementioned processes. Therefore, when the CC residues are not retained on the soil surface to reduce soil evaporation (as in our case) no positive effects can be expected on the soil water content and maize drought stress.
Finally, the values of the soil bulk-density have not been significantly (p > 0.05) affected by the CC presence as reported also by [41]. However, the SBD values recorded for TR at the pick of CC growth (May) were lower than those of CO and this fact could lead, in the case of repeated cultivation of CC, to an improvement in the soil physical conditions (increase of porosity).
4.2. Effect of the CC on Plants
The reasons of the negative (2019) or negligible effect (2020) of CC on the maize yields descend from the analysis of previous data. The lower values of nitrate concentrations and soil moisture recorded in TR are enough to explain the crop behaviour, although the higher development and the more balanced composition of the CC in 2020 contributed to contain the depressive effects. It is also possible that, in second year, TR took advantage from the residual effects produced on the same plots by the previous CC cycle. On the other hand, some authors pointed out the need for a more or less long period before that CCs can fully perform their functions, and [16,28] identified in the low quality and quantity of CC residues the reason of a lower N availability to the next crop, and a consequent decreasing of yields unless additional nitrogen inputs. The same authors pointed out that under high nitrogen fertilizer rate (>200 kg ha−1) the effect of CC on the succeeding maize yields were almost nil.
Concerning weeds, CC was able to affect their development only before the maize seeding. In absence of the mechanical and chemical control (May), the growth of weeds was significantly limited (p < 0.05) by the competition exerted by the CC. Our results are in agreement with the meta-analysis study by [42], in which the authors proved that cover crops contain the development of weeds at the CC termination time and up to the first stages of the succeeding crop. After the soil tillage and the post-emergence weeding on maize, the two systems resulted equivalent (July). However, the difference in weed biomass recorded at the end of the maize cycle suggests that the CC can have a weed suppression effect even after its termination.
4.3. Agro-Ecosystem Services
Although this work is not specifically aimed to explore the ecological and environmental benefits attributable to CC, some considerations are possible. There is no doubt that the CC enhanced the C fixation capability of the TR cropping system and the soil mixing of its biomass contribute to preserve or increase the soil organic matter (SOM) content and the C sequestration. In our conditions, the difference of C input between the two systems was not negligible. Also considering the contribution of weeds, the amount of organic matter buried in TR was definitely higher than in CO (+4.78 and +7.39 t dm ha−1, for 2019 and 2020, respectively). This plant material, if incorporated every year in the shallowest soil layer, can progressively increase the SOM content in relation to its probable rate of turnover in humus (favoured by the C/N value being not too high). Reference [43] in our meta-analysis study confirmed the capability of CCs to increase the SOM stocks and determined that their contribution can be estimated as equal to 0.32 ± 0.08 t ha−1 yr−1 of C as mean annual value. However, the effects of introducing CCs are significantly enhanced only by adopting a no-till system that can couple slowing down soil carbon decomposition rate with increased carbon inputs [44]. Moreover, we have to consider that a portion of N present in CC tissues derived from symbiotic fixation allowing farmers to reduce consequently the nitrogen fertilisation rate for maize. A simple estimation, made by considering an efficiency of transformation of the N-org in N-min equal to 30% leads us to quantify these contributions between 25 and 47 kg N ha−1 (in 2019 and 2020, respectively). These values are fully compatible with those found by other authors [13]. On the other hand, the calculated values of ARNS also confirmed the capability of TR to increase the presence of nitrogen in the soil in comparison with CO.
With regard to nitrate leaching, CCs add to the capability to catch the N mobile forms during their growing season, the effect being to immobilize partially and temporarily the N from the subsequent fertilisations. As reported above, the buried residues can abate the nitrate concentration by one third or more during the first phases of the maize biological cycle (June and July) and consequently limit N losses. Although in that period the rainfalls in Mediterranean areas are not frequent, the reduced capability of maize to uptake nitrates and the need to intervene with irrigation make leaching risks not so unlikely.
Finally, the introduction of CCs counteracts the selection pressure exerted by herbicides and limits the production of weed seeds (or other reproductive organs) during the fallow period. The weed control is the result not only of the protection of the cash crop, but of a global strategy involving the management of the entire cropping system. In our experiment, the high weed development recorded in CO-1 at time of maize harvest, although it can no longer depress the crop yield, can increase the weed infestation potential through an increase of seed production.
5. Conclusions
In Mediterranean areas, farmers are forced to manage maize-based cropping systems by adopting intensive cultivation methods in order to achieve satisfactory yields. Under these conditions, the effects of CCs can be largely surrogated by the use of agronomic inputs (tillage, fertilisation, weed chemical control, irrigation) and the benefits from their cultivation seem to be uncertain. Our results confirmed a reduction of nitrate concentrations and water content in the soil due to the CC growth and the subsequent burial of a biomass with a rather high C/N value (24–32). These conditions can produce a depressive effect on maize yield especially when the composition of gramineous and leguminous species in the CC mixture was not balanced (2019). For this purpose, it is crucial to be able to sow legume species in advance of the lowering of winter temperatures (from end of September to beginning of October).
However, the suitability of CCs has to be evaluated by considering other aspects beyond cash crop production. The introduction of CCs ensures a number of agro-ecosystem services that cannot be disregarded, such as the restraint of nitrate leaching risks and the opportunity to reduce the use of N fertiliser without reducing the N availability for crops. In our experimentation, the nitrate concentrations after fertilisations were significantly abated (up to half) and the residual fertilising effect attributable to the CC was estimated to range from 25 and 47 kg ha−1 of N.
Finally, some effects produced by CCs need more time to become appreciable, but these contributions can play an important role in achieving sustainable agricultural models. Increase in SOM content, weed suppression and improvement of soil physical characteristics, although not yet proved on the basis of the collected data, seem to be predictable and susceptible to further improvement in relation to the farming practices adopted. For these reasons, the CC may represent an option to be carefully considered in the design of sustainable cropping systems for Mediterranean areas.
Author Contributions
Conceptualization: N.S., M.R.; methodology: N.S., R.C.; software: N.S., N.G.; formal analysis: N.S., N.G., R.C.; resources: N.S., M.M., M.R., I.A., L.G. and R.C.; writing—original draft preparation: N.S. and N.G.; writing—review and editing: N.S., N.G., M.M., M.R., I.A., L.G. and R.C.; supervision: N.S., N.G. All authors have read and agreed to the published version of the manuscript.
Funding
This research was funded by the University of Pisa, Project No. PRA-2018-0024 “Valorizzazione delle interazioni tra piante, microrganismi e suolo in agricoltura”.
Informed Consent Statement
Not Applicable.
Data Availability Statement
Not Applicable.
Acknowledgments
The authors would like to thank Valentina Cantini (Department of Agriculture, Food and Environment, University of Pisa) for her support with laboratory analyses, Maya Cristina Rabelo Lanza (Department of Agriculture, Food and Environment, University of Pisa) for creating graphics and Antonio Coli for his help during the sampling campaigns.
Conflicts of Interest
The authors declare no conflict of interest.
References
- GAO. Agricultural Conservation: USDA’s Environmental Quality Incentives Program Could Be Improved to Optimize Benefits [online]. Available online: https://www.gao.gov/products/gao-17-225 (accessed on 13 March 2021).
- Pe’er, G.; Zinngrebe, Y.; Hauck, J.; Schindler, S.; Dittrich, A.; Zingg, S.; Tscharntke, T.; Oppermann, R.; Sutcliffe, L.M.E.; Sirami, C.; et al. Adding some green to the greening: Improving the EU’s ecological focus areas for biodiversity and farmers. Conserv. Lett. 2017, 10, 517–530. [Google Scholar] [CrossRef]
- Vincent-Caboud, L.; Peigné, J.; Casagrande, M.; Silva, M.E. Overview of organic cover crop-based No-Tillage technique in Europe: Farmers’ practices and research challenges. Agriculture 2017, 7, 42. [Google Scholar] [CrossRef]
- Lovell, S.T.; Nathan, C.A.; Olson, M.B.; Mendez, V.E.; Kominami, H.C.; Erickson, D.L.; Morris, W.B. Integrating agroecology and landscape multifunctionality in Vermont: An evolving framework to evaluate the design of agroecosystems. Agric. Syst. 2010, 103, 327–341. [Google Scholar] [CrossRef]
- FAO. Food and Agriculture Organization of the United Nations: Conservation Agriculture [online]. Available online: http://www.fao.org/ag/ca (accessed on 28 August 2017).
- Alletto, L.; Coquet, Y.; Justes, E. Effects of tillage and fallow period management on soil physical behaviour and maize development. Agric. Water Manag. 2011, 102, 74–85. [Google Scholar] [CrossRef]
- Ren, L.; Nest, T.V.; Ruysschaert, G.; D’Hose, T.; Cornelis, W.M. Short-term effects of cover crops and tillage methods on soil physical properties and maize growth in a sandy loam soil. Soil Tillage Res. 2019, 192, 76–86. [Google Scholar] [CrossRef]
- Adeux, G.; Cordeau, S.; Antichi, D.; Carlesi, S.; Mazzoncini, M.; Munier-Jolain, N.; Bàrberi, P. Cover crops promote crop productivity but do not enhance weed management in tillage-based cropping systems. Eur. J. Agron. 2020, 123, 126221. [Google Scholar] [CrossRef]
- Silvestri, N.; Giannini, G.; Antichi, D. Intercropping cover crops with a poplar short rotation coppice: Effects on nutrient uptake and biomass production. Ital. J. Agron. 2018, 13, 126–133. [Google Scholar] [CrossRef]
- Hallama, M.; Pekrun, C.; Lambers, H.; Kandeler, E. Hidden miners—The roles of cover crops and soil microorganisms in phosphorus cycling through agroecosystems. Plant Soil 2019, 434, 7–45. [Google Scholar] [CrossRef]
- De Baets, S.; Poesen, J.; Meersmans, J.; Serlet, L. Cover crops and their erosion-reducing effects during concentrated flow erosion. Catena 2011, 85, 237–244. [Google Scholar] [CrossRef]
- Silvestri, N.; Pistocchi, C.; Antichi, D. Soil and nutrient losses in a flat land-reclamation district of central Italy. Land Degrad. Dev. 2017, 28, 638–647. [Google Scholar] [CrossRef]
- Thorup-Kristensen, K.; Magid, J.; Jensen, L.S. Catch crops and green manures as biological tools in nitrogen management in temperate zones. Adv. Agron. 2003, 79, 227–302. [Google Scholar]
- Daryanto, S.; Jacinthe, P.A.; Fu, B.; Zhao, W.; Wang, L. Valuing the ecosystem services of cover crops: Barriers and pathways forward. Agric. Ecosyst. Environ. 2019, 270, 76–78. [Google Scholar] [CrossRef]
- Basche, A.D.; Miguez, F.E.; Kaspar, T.C.; Castellano, M.J. Do cover crops increase or decrease nitrous oxide emissions? A meta-analysis. J. Soil Water Conserv. 2014, 69, 471–482. [Google Scholar] [CrossRef]
- Marcillo, G.S.; Miguez, F.E. Corn yield response to winter cover crops: An updated meta-analysis. J. Soil Water Conserv. 2017, 72, 226–239. [Google Scholar] [CrossRef]
- Daryanto, S.; Fu, B.; Wang, L.; Jacinthe, P.A.; Zhao, W. Quantitative synthesis on the ecosystem services of cover crops. Earth-Sci. Rev. 2018, 185, 357–373. [Google Scholar] [CrossRef]
- Silva, E.; Moore, V. Cover crops as an agroecological practice on organic vegetable farms in Wisconsin, USA. Sustainability 2017, 9, 55. [Google Scholar] [CrossRef]
- Shackelford, G.E.; Kelsey, R.; Dicks, L.V. Effects of cover crops on multiple ecosystem services: Ten meta-analyses of data from arable farmland in California and the Mediterranean. Land Use Policy 2019, 88, 104204. [Google Scholar] [CrossRef]
- Schipanski, M.E.; Barbercheck, M.; Douglas, M.R.; Finney, D.M.; Haider, K.; Kaye, J.P.; White, C. A framework for evaluating ecosystem services provided by cover crops in agroecosystems. Agric. Syst. 2014, 125, 12–22. [Google Scholar] [CrossRef]
- Blanco-Canqui, H.; Shaver, T.M.; Lindquist, J.L.; Shapiro, C.A.; Elmore, R.W.; Francis, C.A.; Hergert, G.W. Cover crops and ecosystem services: Insights from studies in temperate soils. Agron. J. 2015, 107, 2449–2474. [Google Scholar] [CrossRef]
- Snapp, S.S.; Swinton, S.M.; Labarta, R.; Mutch, D.; Black, J.R.; Leep, R.; O’neil, K. Evaluating cover crops for benefits, costs and performance within cropping system niches. Agron. J. 2005, 97, 322–332. [Google Scholar]
- Cherr, C.M.; Scholberg, J.M.S.; McSorley, R. Green manure approaches to crop production: A synthesis. Agron. J. 2006, 98, 302–319. [Google Scholar] [CrossRef]
- Ramírez-García, J.; Carrillo, J.M.; Ruiz, M.; Alonso-Ayuso, M.; Quemada, M. Multicriteria decision analysis applied to cover crop species and cultivars selection. Field Crop. Res. 2015, 175, 106–115. [Google Scholar] [CrossRef]
- Cates, A.M.; Ruark, M.D.; Grandy, A.S.; Jackson, R.D. Small soil C cycle responses to three years of cover crops in maize cropping systems. Agric. Ecosyst. Environ. 2019, 286, 106649. [Google Scholar] [CrossRef]
- Sapkota, T.B.; Mazzoncini, M.; Bàrberi, P.; Antichi, D.; Silvestri, N. Fifteen years of no till increase soil organic matter, microbial biomass and arthropod diversity in cover crop-based arable cropping systems. Agron. Sustain. Dev. 2012, 32, 853–863. [Google Scholar] [CrossRef]
- Büchi, L.; Wendling, M.; Amossé, C.; Necpalova, M.; Charles, R. Importance of cover crops in alleviating negative effects of reduced soil tillage and promoting soil fertility in a winter wheat cropping system. Agri. Ecosyst. Environ. 2018, 256, 92–104. [Google Scholar] [CrossRef]
- Tonitto, C.; David, M.B.; Drinkwater, L.E. Replacing bare fallows with cover crops in fertilizer-intensive cropping systems: A meta-analysis of crop yield and N dynamics. Agric. Ecosyst. Environ. 2006, 112, 58–72. [Google Scholar] [CrossRef]
- Salmerón, M.; Isla, R.; Cavero, J. Effect of winter cover crop species and planting methods on maize yield and N availability under irrigated Mediterranean conditions. Field Crop. Res. 2011, 123, 89–99. [Google Scholar] [CrossRef]
- Gabriel, J.; Muñoz-Carpena, L.R.; Quemada, M. The role of cover crops in irrigated systems: Water balance, nitrate leaching and soil mineral nitrogen accumulation. Agric. Ecosyst. Environ. 2012, 155, 50–61. [Google Scholar] [CrossRef]
- Cavero, J.; Beltran, A.; Aragues, R. Nitrate exported in drainage waters of two sprinkler-irrigated watersheds. J. Environ. Qual. 2003, 32, 916–926. [Google Scholar] [CrossRef]
- Miguez, F.E.; Bollero, G.A. Winter cover crops in Illinois: Evaluation of ecophysiological characteristics of corn. Crop Sci. 2006, 46, 1536–1545. [Google Scholar] [CrossRef]
- Stazione Meteorologica di Pisa San Giusto. Available online: https://it.wikipedia.org/wiki/Stazione_meteorologica_di_Pisa_San_Giusto (accessed on 28 February 2021).
- Bremner, J. Total nitrogen. Methods of soil analysis. Part 2. Chem. Microbiol. Prop. 1965, 9, 1149–1178. [Google Scholar]
- Schlesinger, W.H. Biogeochemistry, an Analysis of Global Change, 2nd ed.; Academic Press: New York, NY, USA, 1991. [Google Scholar]
- Kramberger, B.; Gselman, A.; Kristl, J.; Lešnik, M.; Šuštar, V.; Muršec, M.; Podvršnik, M. Winter cover crop: The effects of grass–clover mixture proportion and biomass management on maize and the apparent residual N in the soil. Eur. J. Agron. 2014, 55, 63–71. [Google Scholar] [CrossRef]
- Hao, X.; Ball, B.C.; Culley, J.L.B.; Carter, M.R.; Parkin, G.W. Soil Density and Porosity. In Soil Sampling and Method of Analysis; Carter, M.R., Gregorich, E.G., Eds.; Canadian Society of Soil Science: Boca Raton, FL, USA, 2006. [Google Scholar]
- Gomez, K.; Gomez, A. Statistical Procedures for Agricultural Research; John Wiley & Sons: New York, NY, USA, 1984. [Google Scholar]
- White, C.M.; Finney, D.M.; Kemanian, A.R.; Kaye, J.P. A model–data fusion approach for predicting cover crop nitrogen supply to corn. Agron. J. 2016, 108, 2527–2540. [Google Scholar] [CrossRef]
- Hunter, M.C.; Kemanian, A.R.; Mortensen, D.A. Cover crop effects on maize drought stress and yield. Agric. Ecosyst. Environ. 2021, 311, 107294. [Google Scholar] [CrossRef]
- Chen, G.; Weil, R.R. Root growth and yield of maize as affected by soil compaction and cover crops. Soil Tillage Res. 2011, 117, 17–27. [Google Scholar] [CrossRef]
- Osipitan, O.A.; Dille, J.A.; Assefa, Y.; Knezevic, S.Z. Cover Crop for Early Season Weed Suppression in Crops: Systematic Review and Meta-Analysis. Agron. J. 2018, 110, 2211–2221. [Google Scholar] [CrossRef]
- Poeplau, C.; Don, A. Carbon sequestration in agricultural soils via cultivation of cover crops–A meta-analysis. Agric. Ecosyst. Environ. 2015, 200, 33–41. [Google Scholar] [CrossRef]
- Huang, Y.; Ren, W.; Grove, J.; Poffenbarger, H.; Jacobsen, K.; Tao, B.; McNear, D. Assessing synergistic effects of no-tillage and cover crops on soil carbon dynamics in a long-term maize cropping system under climate change. Agric. For. Meteorol. 2020, 291, 108090. [Google Scholar] [CrossRef]
Publisher’s Note: MDPI stays neutral with regard to jurisdictional claims in published maps and institutional affiliations. |
© 2021 by the authors. Licensee MDPI, Basel, Switzerland. This article is an open access article distributed under the terms and conditions of the Creative Commons Attribution (CC BY) license (http://creativecommons.org/licenses/by/4.0/).