Article

Physiological and Yield Responses of Green-Shelled Beans (Phaseolus vulgaris L.) Grown under Restricted Irrigation

1
Department of Vegetal Sciences, Facultad de Agronomía e Ingeniería Forestal, Pontificia Universidad Católica de Chile, Vicuña Mackenna, Macul 7810000, Santiago, Chile
2
TerraNutri LLC, 7605 Mayflower Way, Ave Maria, FL 34142, USA
3
Department of Fruit Production and Oenology, Facultad de Agronomía e Ingeniería Forestal, Pontificia Universidad Católica de Chile, Vicuña Mackenna, Macul 7810000, Santiago, Chile
*
Author to whom correspondence should be addressed.
Agronomy 2021, 11(3), 562; https://doi.org/10.3390/agronomy11030562
Submission received: 15 January 2021 / Revised: 9 March 2021 / Accepted: 10 March 2021 / Published: 17 March 2021
(This article belongs to the Section Water Use and Irrigation)

Abstract

:
Common bean is an important crop, consumed as green-shelled bean in several countries. In Chile, green-shelled beans are cultivated often as a dry land crop, vulnerable to drought. The objective of this study was to characterize the hydric and productive responses of four green-shelled bean genotypes subjected to deficit irrigation in order to outline production strategies in the face of increasing water scarcity. Two experiments were evaluated: one pot experiment with three irrigation treatments, supplying 100% of the crop evapotranspiration (ETc) (T100), 50% (T50), and 30% (T30); and an open field experiment with two treatments: 100% (I100) and 40% of ETc (I40). Treatments were applied during reproductive stage in determinate cultivars and vegetative stage in indeterminate plants. Severe water restriction (T30 and I40) in both experiments showed a significant decrease in stomatal conductances, as well as biomass and number of grains per pod; I40 treatment also showed a reduction in chlorophyll fluorescence. Water use efficiency (WUE) was higher under water stress in field (I40), but lower on the T30 treatment from the pot experiment. Determinate cultivars showed 22.7% higher of 100-seed weight compared to indeterminate type, and, thus, higher tolerance to drought. Our results indicate that severe water stress is highly harmful in terms of yield, and a moderate controlled deficit irrigation plus the use of determinate genotypes may be a strategy for producing green-shelled bean successfully under a drought scenario.

1. Introduction

Common bean (Phaseolus vulgaris L.) is one of the most consumed legumes worldwide because of its high seed nutritional value and low-cost protein source for human and animal consumption [1]. Common bean is used for intercropping that associates with environmental benefits due to the symbiotic interactions with Rhizobium, allowing the fixation of atmospheric nitrogen (N), which is important in soils with low N availability [2].
There are three principal types of common bean products: dry beans (seeds harvested at complete maturity), green or snap beans (fully developed pods before seed development), and green-shelled beans (immature seeds with 60–70% seed moisture content) [3], which are also called ‘cranberry beans’ in certain parts of the world, or ‘poroto granado’ in Spanish (Figure S1). There is limited technical information on green-shelled beans production, however, these products are used in the Chilean traditional cuisine and widely consumed in many Latin American countries [4].
More than 60% of the beans worldwide production is concentrated in areas affected by long periods of drought [5], and only 7% have been grown in irrigated land [4]. In addition, bean is one of the legumes most sensitive to water stress among legume species [6]. The physiological responses to drought can vary depending on whether the water stress occurs during vegetative or reproductive stages of development [7], and according to the intrinsic tolerance to water stress of the different common bean cultivars used [8]. Modern cultivars are preferred over landraces mainly because of their higher grain yields, which is relevant in highly-technified farming systems [9]. However, landraces often show higher performance under non-optimal farming conditions due to their high resilience under harsh environmental conditions and they achieve stable crop yields, especially under droughts stress, which is very important for small-scale farmers [10]. The intensive spread and wide use of improved, modern cultivars has led to a genetic bottleneck, reducing considerably their genetic diversity [11]. In the case of beans, most of the naturally available genetic variation to cope with drought in the natural environments was lost through domestication and recent plant breeding, making it crucial to exploit the reservoir of wild relatives and landraces to produce new bean cultivars that are more drought-tolerant [12,13].
Although climate change is clearly decreasing productivity of bean production in different parts of the world [14], there is still little information about genetic characterization and agronomic managements to deal with this new scenario. This creates a need to identify cultivars with a better performance under water stress conditions and to develop more efficient irrigation strategies. Considering that bean tolerance to mild water availability has been reported in bean [15], it is possible to hypothesize that local heirloom varieties or landraces, traditionally cultivated under dry conditions, would have better performance under restricted irrigation (RI) regimes, and, therefore, be more suitable for cropping under the future climatic conditions of water scarcity. On the other hand, for the conditions of water scarcity occurring in the Chilean green-shelled bean production area, it is necessary to evaluate the behavior of determinate or indeterminate type varieties subjected to water stress.
Hence, the objective of this study was to characterize the hydric and productive responses of four green-shelled bean genotypes subjected to deficit irrigation in order to outline production strategies in the face of increasing water scarcity. This characterization was carried out to quantify the physiological responses based on stomatal conductance, chlorophyll fluorescence and stem water potential, yield components and water use efficiency (WUE) of four genotypes grown under different water-stressed conditions from third-trifoliate leaf expanded stage, during the vegetative or reproductive stages of development.

2. Materials and Methods

2.1. Plant Material

Four green-shelled bean genotypes that are commonly used in Chile were studied in this work: Cimarrón (a bred material with growth habit type III, indeterminate type, 94 days from sowing to first harvest), Coscorrón (a bred genotype with growth habit type I, determinate type, 98 days from sowing to first harvest), Rubí (a bred cultivar with growth habit type I, determinate type, similar cycle length to Cimarrón), and Local Cimarrón, hereinafter named L. Cimarrón (one landrace from Navidad, O’Higgins Region, Chile, with growth habit type III, indeterminate type, cycle length not previously described). Growth habit types were described by Lynch and Vanbeem (1993) [16]. Five seeds of each cultivar were sown on 20 January 2016, in plastic pots (20 L) containing a mix of green waste mature compost: sand (7:3) with nutrient rates equivalent to 30 kg ha−1 of N, 50 kg ha−1 of P2O5 and 40 kg ha−1 of K2O. All seeds were pre-inoculated with Rhizobium (RizoFix Gel®, BIOGRAM S.A., Santiago, Chile) at rates of 1 × 10⁹ cfu/mL to maintain the N requirement throughout the season.

2.2. Open Field Pot Experiment

An open field experiment was conducted at the Pontificia Universidad Católica of Chile (33°29′46″ S; 70°36′27″ W), San Joaquín campus, Santiago, Chile, during the summer of the 2016 season. The experiment was arranged as a split-plot design with three irrigation treatments as main plot and the four cultivars previously describes as subplot treatments, with five replications. The irrigation treatments were performed in all cultivars from the stage of third-trifoliate leaf expanded, considered as a crop establishment, for 50 days (reproductive stage) in determined cultivars, and during 30 days (vegetative stage) in indetermined beans. The three irrigation treatments consisted of (a) optimal irrigation (T100, or control treatment), whose pots were irrigated up to 100% of the crop evapotranspiration (ETc) and maintained at pot capacity (near to −1 MegaPascals, MPa) of potted soil matric potential) throughout the experiment; (b) moderate restricted irrigation (or T50 treatment), with only 50% of irrigation relative to T100 treatment; and (c) severe restricted irrigation (or T30 treatment), characterized by the application of only 30% of irrigation with respect to T100. The plants were located under a low-density shade net, and drip irrigation was applied by using well water.
The water availability equivalent to pot capacity (between −1 and −1.4 MPa) was estimated using a water retention curve [17]. The accumulated evapotranspiration (ETc) was estimated by the water balance equation as follows: I + PP = ETc + Pc + Δθv, in which I was irrigation (mm), PP was precipitation (mm), Pc was percolation (mm), and Δθv corresponds to the difference of the volumetric soil humidity estimated through the daily weights of the pots. All plants were fully watered (pot capacity) until the stage of third-trifoliate leaf expanded, in which only one plant per pot was left to continue with the water stress treatments. Irrigation treatments started at 29 days after seeding (DAS) when third-trifoliate leaf stage occurred. For determinate cultivars (Coscorrón and Rubí) at that moment, the flower bud stage was also occurring. Irrigation treatments were applied until harvest (50 days) and, thus, plants were subjected to different watering conditions during the whole reproductive phase (bud flower to harvest). On the other hand, at third-trifoliate leaf stage, indeterminate cultivars (Cimarrón and L. Cimarrón) were still in vegetative growth without flower bud appearance. Plants were subjected to irrigation treatments only until bud flower during 30 days, and, thus, treated during the vegetative stage.

2.3. Field Experiment

A field experiment was conducted in a commercial farm with a loam soil type in Rapel de Navidad (33°56′34″ S; 71°44′21″ W), O´Higgins Region, Chile, from November 2015 until February 2016. The experiment was arranged as a split-plot design with two irrigation treatments as main plot and the four cultivars previously described as subplot treatments with three replications. All plots were fully watered (field capacity, soil matric potential near to −3 MPa) until anthesis. The two irrigation treatments consisted in (a) optimal irrigation (I100 or control treatment), whose plots were irrigated up to 100% of ETc and maintained at field capacity throughout the experiment, and (b) severe irrigation restriction (or I40 treatment), with plots watered with only 40% of ETc. Watering was performed by using drip irrigation.
Fertilization management was based on soil nutrient analyses prior to seeding that required the application of N as urea through irrigation at the rate of 25 kg ha−1 once in the beginning of the flowering stage. Plants were sown in rows of 5 m long and 0.7 m between rows of spacing. The drip irrigation system was a single line for each plant row with a drip emitter spacing at 0.1 m each with a discharge rate of 1 L h−1. The ETc was calculated using the FAO model [18], based upon the Penman–Monteith equation, utilizing data obtained from INIA (Chile’s National Agricultural Research Institute)´s Hidango weather station (34°6′44″ S; 71°47′50″ W). The Cropwat 8.0 computer software (FAO, Rome, Italy) was used to determine the treatments irrigation schedules using the standard crop coefficient (Kc) for beans [18]. The soil matric potential of both irrigation treatments was measured with Bourdon´s tensiometers (Irrometer Company, Inc., Riverside, CA, USA), installed between plants at a depth of 30 cm, and soil samples were collected at these places to calculate gravimetric water content. Soil texture was determined by the Bouyoucos method [19], and bulk density was estimated by the clod method [20]. Available water capacity, field capacity (FC), and permanent wilting point (PWP) was estimated by the Saxton–Rawls method [21].

2.4. Evaluated Parameters

For the pot experiment, at the end of the trial, the pods and the foliage were harvested separately. The foliage was dried in oven at 85 °C for 48 h for dry mass determination. Yield components were estimated as follows: seed yield per plant or linear meter, number of pods per plant, number of seeds per pods, weight of 100-seeds (g), pod length (cm), and harvest index (HI). The WUE of biomass (WUEb) and grain (WUEg) were estimated as follows: WUEb = (foliage dry mass + 30% of pods and seeds fresh weight)/total ETc, and WUEg = (30% of seeds fresh weight)/total ETc, considering 70% of seeds and pods humidity at harvest of green-shelled beans [22].
The physiological traits were evaluated at midday using a fully expanded leaf every week since 29 days after sowing in the pot experiment, and only before harvest in the field experiment. Stomatal conductance (gs) was measured with a steady state portable porometer (SC-1 model, Decagon Device Inc., Pullman, WA, USA). Chlorophyll fluorescence (Fv/Fm) was determined with a portable fluorometer (Pocket PEA, Hansatech Instruments Ltd., Norfolk, UK). Stem (xylem) water potential (SWP) was measured with a Scholander pressure chamber (Soil Moisture Equipment Corp., Santa Barbara, CA, USA) as described by Meyer and Reicosky (1985) [23]. In the field trial, only gs and Fv/Fm were scored.

2.5. Statistical Analysis

Data were analyzed using a two-way analysis of variance (ANOVA) at a significance level of p ≤ 0.05. The main effects were considered to be due to cultivars (subplot) and irrigation regimes (main plot) as well as their interactions. When the ANOVA was significant at p ≤ 0.05, means comparison was done using Tukey’s test for Open field pot experiment data and Newman–Keuls test for Field experiment data, with the statistical software package JMP® V.11 (SAS institute Inc., Cary, NC, USA) [24] for both experiments.

3. Results

3.1. Yield and Yield Components

For both pot and field experiments, no interaction between irrigation and genotypes was observed (Table 1, Table 2 and Table 3). In the pot experiment, significant differences in total yield and biomass production were found only between water stress treatments. Seed yield and biomass was higher in the T100 treatment and lower in the T30 treatment, regardless of whether the water stress was applied during either the vegetative or the reproductive phase (Table 1 and Table 2). Regarding the indeterminate cultivars, Cimarrón and L. Cimarrón, no significant differences among cultivars were observed (Table 1). Moreover, only the severe irrigation restriction treatment (T30) reduced the number of seeds per pod and the total biomass production, with no statistical differences between cultivars under water stress during the vegetative growth phase. In the case of the determinate cultivars, Coscorrón showed significant fewer seed pods−1 than Rubí (Table 2) although there was no statistical difference between cultivars in the total seed yields. Surprisingly, there were no differences in 100-seed weight between treatments or cultivars.
In the field experiment, no interaction between irrigation and genotypes was observed (Table 3). With respect to the irrigation treatment, significant differences were identified in some of the productive parameters studied, such as 100-seed weight, pods length, and number of seed per pods. There was a decrease close to 12% of the 100-seed weight between I100 and I40 as a consequence of the water restriction applied. Regarding the genotypes evaluated in this study, Coscorrón and Rubí (determinate cultivars) exhibited significantly higher values for 100-seed weight and pods length (Table 3), compared to indeterminate cultivars, even though Coscorrón and Rubí were subjected to water stress during reproductive phase.

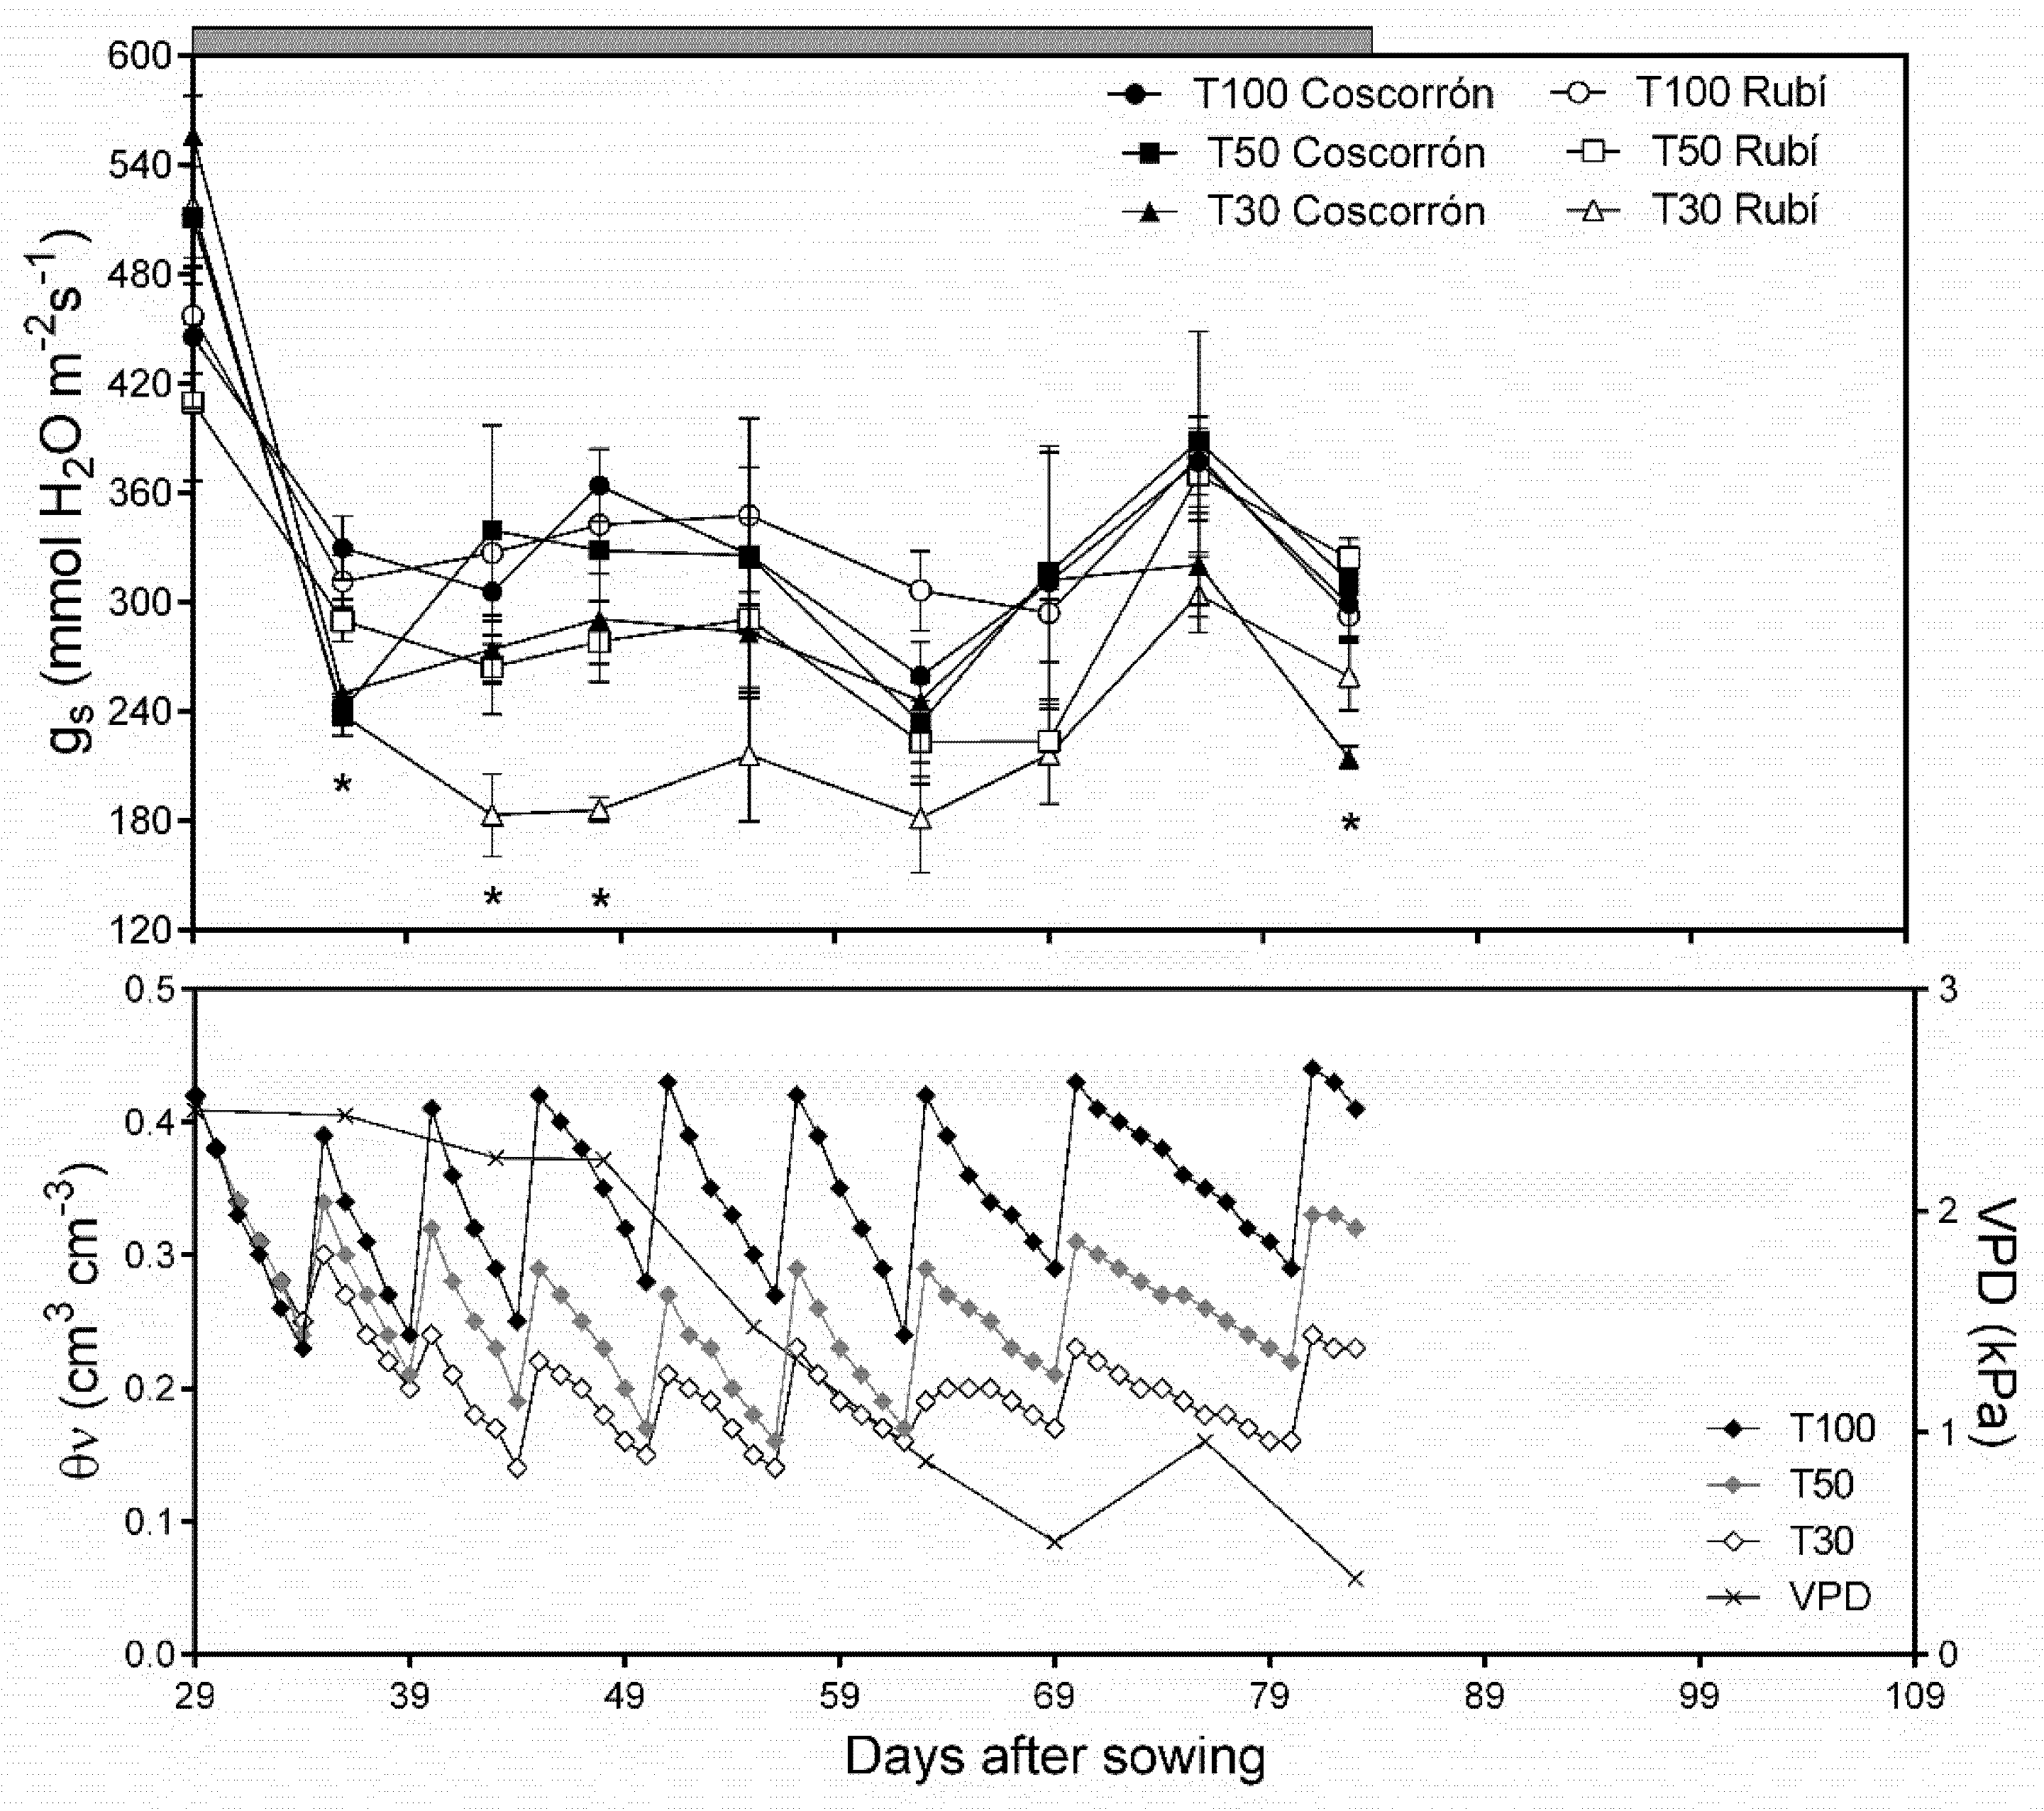
3.2. Effect of Water Stress on Physiological Parameters

Severe irrigation restriction resulted in a significant reduction of stomatal conductance (gs). In the pot experiments, only the T30 treatment had a significant effect on the gs in some of the studied dates (Figure 1 and Figure 2).
The same effect was observed in the field conditions experiment because the I40 treatment showed a gs decrease of 22% compared to the control treatment (Table 4).
In potted plants, the values of SWP showed high variability and no overall significant differences were observed, suggesting no water stress effect on this parameter over any of the cultivars evaluated in this experiment. During the study period, SWP average values fluctuated between −0.32 and −0.8 MPa for T100, −0.33 and −0.87 for T50, and −0.35 and −0.78 MPa for T30 in indeterminate cultivars. For determinate cultivars, SWP average values fluctuated between −0.18 and −0.68 MPa for T100, −0.1 and −0.55 MPa for T50, and −0.15 and −0.7 for T30 (data not shown).
Regarding chlorophyll fluorescence (Fv/Fm), different results between the pot and the field experiments were obtained. In the potted plants, water stress had no significant effect on Fv/Fm, in addition the Fv/Fm mean values were close to 0.80 that is the maximum value expected under pot conditions (data not shown). Conversely, in the open field experiment, a Fv/Fm value decrease of around 18% of the I40 treatment relative to the I100 treatment was reported, with no significant differences between cultivars (Table 4).

3.3. Water Use Efficiency Estimation for Pot and Field Experiments

In the pot experiments, WUEb and WUEg decreased as water restriction became more severe, showing no significant differences between cultivars (see lower cases, Table 5). Even though the amount of water applied in the T30 treatment was lower than the control condition (T100), the T30 plants produced much less biomass and showed lower grain yield compared to the control treatment (Table 1), resulting in a significantly lower WUE; these results was observed in all the studied cultivars (Table 5). These results differ from those obtained under open field conditions, where the water restriction significantly increased the water use efficiency (Table 6).

4. Discussion

Total net water requirements of bean can vary between 350 and 500 mm depending on soil, climate, and cultivar characteristics [25]. During the early vegetative development stage, the crop water requirements are low, but they increase as the canopy develops. During pre-flowering and the development of the reproductive phase, common bean has been reported to be more susceptible to water stress [26]. This explains why numerous studies subjecting P. vulgaris to water stress show significant grain yield losses as a consequence of this abiotic restriction [5,27]. Most of them argue that those yield losses are mainly associated to a reduction in the number of pods per plant. The main plant processes that are negatively affected by water stress are photosynthesis, cellular elongation, and changes in carbon metabolism, among others, influencing the pool of carbohydrates that are used as cellular signals or substrates of different biochemical reactions [8]. Water stress during reproductive phase could directly affects the final yield of the crops since cell elongation is necessary during the elongation and growth of the pollen tube, seeds, and fruits [28]. In our study, however, indeterminate varieties stressed during vegetative stage in the field experiment showed less 100-seed weight and pod length than determinate cultivars stressed during reproductive phase, indicating that stress could affect performance also if it affects the processes that occur during the vegetative development of the bean, such as induction and floral differentiation.
Our results indicate that more than the stage when water stress was applied, the level of irrigation stress conditioned the physiological response and yield components of green-shelled beans, for both the pot and the open field experiments (Table 2 and Table 3). In addition, water stress directly affects final yields, harvest index, and total biomass. According to Mathobo et al. (2017) [29], drought stress inhibits the development of new leaves and causes leaf senescence; this reduction in dry matter can suggest a decline in photosynthesis. In our work, however, there was no direct effect of water restriction on 100-seed weight and pod length of the determinate cultivars (Rubí and Coscorrón), which is the developing structure during the period in which water restriction was applied to the pot experiment (Table 2). Conversely, the experiments performed under open field conditions did show differences on 100-seed weight (Table 3), with determinate type cultivars showing better response that indeterminate type materials. In keeping with this, Emam et al. (2012) [30] reported that drought stress effects on two common bean cultivars with contrasting growth habits showed that the cultivar with determinate growth (D81083) had potential as a rainfed rotation crop in arid regions with better performance than the indeterminate genotype (Sayyad). As previously stated by González el al. (2016) [31] this behavior may be attributable to the genetic differences between the studied cultivars, in which the indeterminate materials (Cimarron and L. Cimarron) must split their assimilates between the vegetative growth and grain filling, whereas the determinate cultivars can destine most of their photosynthates to the grains. In addition, differences in drought response between determinate and indeterminate cultivars of common bean may associate to enhanced water uptake and efficient water conduction of determinate genotypes [32], restriction in transpiration [33], and water storage and desiccation tolerance [34]. Further, earliness is a desirable trait because early cultivars can escape drought of beans grown in rainfed conditions, as some determinate genotypes show, particularly under severe water stress [35].
In terms of the physiological responses, stomatal conductance is the most affected parameter in these experiments, since a clear decrease in gs was reported under severe water restriction conditions (T30) for the pot and moderate water restriction (I40) on the field experiments (Figure 2 and Table 4). The stomatal conductance has a complex regulation because it can vary due to external factors (soil water availability, vapor pressure deficit (VPD)) and internal factors (abscisic acid (ABA) levels, xylem conductivity, leaf water status), and it can be used as a consistent and integrative indicator of water stress in C3 species [36], although it is also an adaptative response to avoid excess of water loss and maintenance of cell turgor [5]. It was also reported that gs values lower than 100–150 mmol m−2 s−1 reflect water stress in beans [37]. Stomatal changes are faster under water stress than under optimal irrigation conditions in common bean, suggesting a greater sensitivity to changes in vapor pressure deficit of the air combined with soil water status [38]. According to Rosales et al. (2012) [39], partial or complete closure of the stomata result in a reduction of transpiration and CO2 entry for the photosynthesis, which is associated with reductions in vegetative growth, premature leaf senescence, and yield losses, similar to our results. In this sense, the results of our study indicated that both type of cultivars are similarly sensitive to water stress, with a clear stomatal response when subjected to severe water stress. That performance was observed in the pot and field experiments (Figure 2; Table 4).
Regarding the SWP results, no significant differences were found probably due to the high variability of the data in our study (data non-showed). However, SWP registered corresponded to non-stress levels, which considering the gs response, suggests that bean cultivars treated in this study can actually maintain plant turgor during water stress. The maintenance of turgor under water stress conditions is considered a water-stress resistance trait, since it keeps normal cellular activity and contributes to growth when plants undergo water restrictions. This can be explained by osmotic adjustment and the elasticity of the cell wall [36]. Martínez et al. (2007) [5] reported that Coscorrón bean exhibited a decrease in osmotic potential at full turgor, which means that osmotic adjustment occurred, although they did not identify differences in the modulus of elasticity between the irrigation treatments.
The chlorophyll fluorescence variable measured was the Fv/Fm ratio, which is directly correlated with the physiological efficiency of the photosynthetic machinery. It is used to calculate the maximum quantum efficiency of the photosystem II (PS II) photochemistry. A drop of Fv/Fm can be attributed to photoinhibition, indicating that an important quantity of absorbed light was not used in photosynthesis [40] (Table 4). There are different mechanisms to avoid damages in the photosynthetic machinery, such as changes in chlorophyll concentration, exposure reduction of organelles and photosynthetic complexes to light, chloroplast movement and leaf movement [41]. In common beans, paraheliotropism seems to be an important mechanism to avoid photoinhibition that may coincide with the closure of stomata [42], and even when a decrease in Fv/Fm indicates a down-regulation of photosynthesis, drought not always has an effect on Fv/Fm in beans [29]. In our study, all the cultivars studied showed paraheliotropism, based on an overall visual evaluation; however, this mechanism/parameter was not measured. In pot experiments, this strategy may be sufficient to avoid damage of the photosynthetic machinery, but apparently not enough for plants in open field conditions (Table 4), probably because potted plants were cultivated under a low-density shading net.
There are differences in the results of the WUE depending on the type of study (field or pot), the period during which the plants were subjected to water stress, the severity of the stress, and the parameters used for the calculation of WUE (Table 5 and Table 6). Our results for potted plants agree with the study of Muñoz-Perea et al. (2007) [26], who also considered WUE as crop yield by ETc. They also found that the P. vulgaris cultivars evaluated are more efficient under optimal irrigation than under water-stress conditions. However, other studies report an increase in WUE of common bean, this is because less water is used in water stress treatments compared to an optimal irrigation condition [39,43]. On the contrary, the field experiment showed a higher biomass and grain WUE when applying 40% of water requirement compared with 100%.

5. Conclusions

According to our results, severe water restriction has a direct effect on yield and yield components in green-shelled beans. Our results did not show a clear effect of the cultivar in the physiological and yield response to water stress; however, in the field experiment, indeterminate cultivars, subjected to water stress during the vegetative phase, showed significantly less 100-seed weight and pods length compared with determinate cultivars subjected to water stress during the reproductive phase. As previously stated, this behavior may be attributable to the genetic differences between indeterminate and determinate type bean cultivars [31], in which the indeterminate materials must split their assimilates between the vegetative growth and grain filling, whereas the determinate cultivars can destine most of their photosynthates to the grains. The quantification of chlorophyll fluorescence as a sensitive trait to environmental stresses could be a tool in the characterization of drought-susceptible genotypes. In this regard, Sánchez Reinoso et al. (2019) [44] reported that the parameters derived from rapid-light response curves can be used as tools to identify drought susceptibility in the vegetative stage and in the reproductive stage.
Severe irrigation restriction affects the stomatal conductance, which contributes to yield and biomass losses. From a productive point of view, water stress of 70% or 60% in pot and field conditions, respectively, are highly harmful in terms of yields; although milder water stress of 50% or less may be a strategy for saving water of green-shelled beans, which would only affect yields marginally. Our results did not show any advantage of the landrace cultivar (L. Cimarrón) in terms of tolerance to water-stress, but determinate cultivars stressed during reproductive phase showed better results in some yield components, compared with indeterminate cultivars restricted during vegetative growth. Thus, our results suggest that in a drought scenario, a moderate controlled deficit irrigation plus the use of determinate type beans may be a good strategy for producing green-shelled beans with profits for the growers.

Supplementary Materials

The following are available online at https://www.mdpi.com/2073-4395/11/3/562/s1, Figure S1. Images of green-shelled bean crop, pods and seeds at harvest.

Author Contributions

Conceptualization, A.R.S., K.C. and P.M.G.; methodology, K.C., A.R.S., D.M., P.M.G.; software, K.C., D.M.; validation, A.R.S., K.C., M.O.-H., P.M.G.; formal analysis, A.R.S., K.C. and D.M.; investigation, K.C., A.R.S., D.M., P.M.G.; resources, A.R.S., K.C., P.M.G.; data curation, A.R.S., K.C., D.M., P.M.G.; writing—original draft preparation, A.R.S., K.C., P.M.G.; writing—review and editing, A.R.S., K.C., M.O.-H., P.M.G.; visualization, A.R.S., K.C., M.O.-H., P.M.G.; supervision, A.R.S., P.M.G.; project administration, A.R.S., K.C.; funding acquisition, A.R.S. All authors have read and agreed to the published version of the manuscript.

Funding

This research was funded by Innovation Fund for Competitiveness of O´Higgins Region, Chile, FIC-R-2014, code 30343832-0, involving the project “Innovation and transfer to improve the cultivation of legumes in the O’Higgins Region” (2014–2017).

Institutional Review Board Statement

Not applicable.

Informed Consent Statement

Not applicable.

Acknowledgments

We thank Fidel Torres for providing with a space to conduct the open field experiment. We also thank Sebastián Castro for his hard work and his invaluable help during this study.

Conflicts of Interest

The authors declare no conflict of interest. The funders had no role in the design of the study; in the collection, analyses, or interpretation of data; in the writing of the manuscript, or in the decision to publish the results.

References

  1. Beebe, S.E.; Rao, I.M.; Blair, M.W.; Acosta-Gallegos, J.A. Phenotyping common beans for adaptation to drought. Front. Physiol. 2013, 4, 35. [Google Scholar] [CrossRef] [PubMed] [Green Version]
  2. Schwember, A.R.; Schulze, J.; Del Pozo, A.; Cabeza, R.A. Regulation of Symbiotic Nitrogen Fixation in Legume Root Nodules. Plants 2019, 8, 333. [Google Scholar] [CrossRef] [PubMed] [Green Version]
  3. Bascur, G. Calidad Culinaria del Poroto Verde y Granado: Aspectos relevantes para el desarrollo de variedades mejoradas para el mercado fresco. Tierra Adentro 2011, 95, 31–37. [Google Scholar]
  4. Broughton, W.J.; Hernández, G.; Blair, M.; Beebe, S.; Gepts, P.; Vanderleyden, J. Beans (Phaseolus spp.)–model food legumes. Plant Soil 2003, 252, 55–128. [Google Scholar] [CrossRef] [Green Version]
  5. Martínez, J.; Silva, H.; Ledent, J.; Pinto, M. Effect of drought stress on the osmotic adjustment, cell wall elasticity and cell volume of six cultivars of common beans (Phaseolus vulgaris L.). Eur. J. Agron. 2007, 26, 30–38. [Google Scholar] [CrossRef]
  6. Toaldo, D.; De Morais, P.P.P.; Battilana, J.; Coimbra, J.L.M.; Guidolin, A.F. Selection in early generations and the occurrence of heterosis for the character root distribution. Euphytica 2012, 190, 335–344. [Google Scholar] [CrossRef]
  7. Boutraa, T.; Sanders, F.E. Influence of Water Stress on Grain Yield and Vegetative Growth of Two Cultivars of Bean (Phaseolus vulgaris L.). J. Agron. Crop. Sci. 2001, 187, 251–257. [Google Scholar] [CrossRef]
  8. Araújo, S.S.; Beebe, S.; Crespi, M.; Delbreil, B.; González, E.M.; Gruber, V.; Lejeune-Henaut, I.; Link, W.; Monteros, M.J.; Prats, E.; et al. Abiotic Stress Responses in Legumes: Strategies Used to Cope with Environmental Challenges. Crit. Rev. Plant Sci. 2015, 34, 237–280. [Google Scholar] [CrossRef]
  9. Migliorini, P.; Spagnolo, S.; Torri, L.; Arnoulet, M.; Lazzerini, G.; Ceccarelli, S. Agronomic and quality characteristics of old, modern and mixture wheat varieties and landraces for organic bread chain in diverse environments of northern Italy. Eur. J. Agron. 2016, 79, 131–141. [Google Scholar] [CrossRef]
  10. Ficiciyan, A.; Loos, J.; Sievers-Glotzbach, S.; Tscharntke, T. More than Yield: Ecosystem Services of Traditional versus Modern Crop Varieties Revisited. Sustain. J. Rec. 2018, 10, 2834. [Google Scholar] [CrossRef] [Green Version]
  11. Tsegaye, B.; Berg, T. Utilization of durum wheat landraces in East Shewa, central Ethiopia: Are home uses an incentive for on-farm conservation? Agric. Hum. Values 2007, 24, 219–230. [Google Scholar] [CrossRef]
  12. Abenavoli, M.R.; Leone, M.; Sunseri, F.; Bacchi, M.; Sorgona, A. Root Phenotyping For Drought Tolerance in Bean Landraces From Calabria (Italy). J. Agron. Crop. Sci. 2015, 202, 1–12. [Google Scholar] [CrossRef]
  13. Cortés, A.J.; Blair, M.W. Genotyping by Sequencing and Genome–Environment Associations in Wild Common Bean Predict Widespread Divergent Adaptation to Drought. Front. Plant Sci. 2018, 9, 128. [Google Scholar] [CrossRef] [PubMed] [Green Version]
  14. Farooq, M.; Gogoi, N.; Barthakur, S.; Baroowa, B.; Bharadwaj, N.; Alghamdi, S.S.; Siddique, K.H.M. Drought Stress in Grain Legumes during Reproduction and Grain Filling. J. Agron. Crop. Sci. 2016, 203, 81–102. [Google Scholar] [CrossRef]
  15. Santos, M.G.; Ribeiro, R.V.; Machado, E.C.; Pimentel, C. Photosynthetic parameters and leaf water potential of five common bean genotypes under mild water deficit. Biol. Plant. 2009, 53, 229–236. [Google Scholar] [CrossRef]
  16. Lynch, J.; Van Beem, J.J. Growth and Architecture of Seedling Roots of Common Bean Genotypes. Crop. Sci. 1993, 33, 1253–1257. [Google Scholar] [CrossRef]
  17. Casaroli, D.; Jong van Lier, Q. Critérios para determinação da capacidade de vaso. Rev. Bras. Cienc. Solo 2008, 32, 59–66. [Google Scholar] [CrossRef] [Green Version]
  18. Allen, R.G.; Pereira, L.S.; Raes, D.; Smith, M. Crop Evapotranspiration: Guidelines for Computing Crop Water Requirements; FAO irrigation and drainage paper 56; FAO: Rome, Italy, 1998; p. D05109. [Google Scholar]
  19. Bouyoucos, G.J. Hydrometer Method Improved for Making Particle Size Analyses of Soils 1. Agron. J. 1962, 54, 464–465. [Google Scholar] [CrossRef]
  20. Rossi, A.M.; Hirmas, D.R.; Graham, R.C.; Sternberg, P.D. Bulk Density Determination by Automated Three-Dimensional Laser Scanning. Soil Sci. Soc. Am. J. 2008, 72, 1591–1593. [Google Scholar] [CrossRef] [Green Version]
  21. Saxton, K.E.; Rawls, W.J. Soil Water Characteristic Estimates by Texture and Organic Matter for Hydrologic Solutions. Soil Sci. Soc. Am. J. 2006, 70, 1569–1578. [Google Scholar] [CrossRef] [Green Version]
  22. Faiguenbaum, H. Labranza, Siembra y Producción de los Principales Cultivos de Chile; Facultad de Ciencias Agrícolas y Forestales, Universidad de Chile: Santiago, Chile, 2003; p. 760. [Google Scholar]
  23. Meyer, W.S.; Reicosky, D. Enclosing leaves for water potential measurement and its effect on interpreting soil-induced water stress. Agric. For. Meteorol. 1985, 35, 187–192. [Google Scholar] [CrossRef] [Green Version]
  24. SAS Institute Inc. Using JMP 11. 2013. Available online: http://support.sas.com/documentation/onlinedoc/jmp/11/UsingJMP.pdf (accessed on 12 March 2021).
  25. Beebe, S.; Ramírez, J.; Jarvis, A.; Rao, I.M.; Mosquera, G.; Bueno, J.M.; Blair, M.W. Genetic improvement of common beans and the challenges of climate change. In Crop Adaptation to Climate Change; Yadav, S., Redden, R., Hatfield, J., Lotze-Campen, H., Hall, A., Eds.; John Wiley & Sons. Ltd: Chichester, UK, 2011; pp. 356–369. [Google Scholar]
  26. Muñoz-Perea, C.G.; Allen, R.G.; Westermann, D.T.; Wright, J.L.; Singh, S.P. Water use efficiency among dry bean landraces and cultivars in drought-stressed and non-stressed environments. Euphytica 2007, 155, 393–402. [Google Scholar] [CrossRef]
  27. Sezen, S.M.; Yazar, A.; Akyildiz, A.; Dasgan, H.Y.; Gencel, B. Yield and quality response of drip irrigated green beans under full and deficit irrigation. Sci. Hortic. 2008, 117, 95–102. [Google Scholar] [CrossRef]
  28. Beauzamy, L.; Nakayama, N.; Boudaoud, A. Flowers under pressure: Ins and outs of turgor regulation in development. Ann. Bot. 2014, 114, 1517–1533. [Google Scholar] [CrossRef] [PubMed]
  29. Mathobo, R.; Marais, D.; Steyn, J.M. The effect of drought stress on yield, leaf gaseous exchange and chlorophyll fluorescence of dry beans (Phaseolus vulgaris L.). Agric. Water Manag. 2017, 180, 118–125. [Google Scholar] [CrossRef] [Green Version]
  30. Emam, Y.; Shekoofa, A.; Salehi, F.; Jalali, A.H.; Pessarakli, M. Drought stress effects on two common bean cultivars with contrasting growth habits. Arch. Agron. Soil Sci. 2012, 58, 527–534. [Google Scholar] [CrossRef]
  31. González, A.M.; Yuste-Lisbona, F.J.; Saburido, S.; Bretones, S.; De Ron, A.M.; Lozano, R.; Santalla, M. Major Contribution of Flowering Time and Vegetative Growth to Plant Production in Common Bean As Deduced from a Comparative Genetic Mapping. Front. Plant Sci. 2016, 7. [Google Scholar] [CrossRef] [Green Version]
  32. Emam, Y.; Seghatoleslami, M.J. Crop Yield: Physiology and Processes, 1st ed.; Shiraz University Inc.: Shiraz, Iran, 2005; p. 593. [Google Scholar]
  33. Tardieu, F. Plant tolerance to water deficit: Physical limits and possibilities for progress. C. R. Geosci. 2005, 337, 57–67. [Google Scholar] [CrossRef]
  34. Larcher, W. Physiological Plant Ecology: Ecophysiology and Stress Physiology of Functional Groups, 4th ed.; Springer: Berlin, Germany, 2001; p. 513. [Google Scholar]
  35. Nleya, T.M.; Slinkard, A.E.; Vandenberg, A. Differential performance of pinto bean under varying levels of soil moisture. Can. J. Plant Sci. 2001, 81, 233–239. [Google Scholar] [CrossRef]
  36. Medrano, H.; Escalona, J.M.; Bota, J.; Gulías, J.; Flexas, J. Regulation of Photosynthesis of C3 Plants in Response to Progressive Drought: Stomatal Conductance as a Reference Parameter. Ann. Bot. 2002, 89, 895–905. [Google Scholar] [CrossRef]
  37. Flexas, J.; Bota, J.; Cifre, J.; Escalona, J.M.; Galmés, J.; Gulías, J.; Medrano, H. Understanding down-regulation of photosynthesis under water stress: Future prospects and searching for physiological tools for irrigation management. Ann. Appl. Biol. 2004, 144, 273–283. [Google Scholar] [CrossRef]
  38. Barradas, V.L.; Jones, H.G.; Clark, J.A. Stomatal responses to changing irradiance in Phaseolus vulgaris L. J. Exp. Bot. 1994, 45, 931–936. [Google Scholar] [CrossRef]
  39. Rosales, M.A.; Ocampo, E.; Rodríguez-Valentín, R.; Olvera-Carrillo, Y.; Acosta-Gallegos, J.; Covarrubias, A.A. Physiological analysis of common bean (Phaseolus vulgaris L.) cultivars uncovers characteristics related to terminal drought resistance. Plant Physiol. Biochem. 2012, 56, 24–34. [Google Scholar] [CrossRef]
  40. Zlatev, Z.S.; Yordanov, I.T. Effects of soil drought on photosynthesis and chlorophyll fluorescence in bean plants. Bulg. J. Plant Physiol. 2005, 30, 3–18. [Google Scholar]
  41. Pastenes, C.; Pimentel, P.; Lillo, J. Leaf movements and photoinhibition in relation to water stress in field-grown beans. J. Exp. Bot. 2004, 56, 425–433. [Google Scholar] [CrossRef] [PubMed] [Green Version]
  42. Wentworth, M.; Murchie, E.H.; Gray, J.E.; Villegas, D.; Pastenes, C.; Pinto, M.; Horton, P. Differential adaptation of two varieties of common bean to abiotic stress II. Acclimation of photosynthesis. J. Exp. Bot. 2006, 57, 699–709. [Google Scholar] [CrossRef] [Green Version]
  43. Webber, H.; Madramootoo, C.; Bourgault, M.; Horst, M.; Stulina, G.; Smith, D. Water use efficiency of common bean and green gram grown using alternate furrow and deficit irrigation. Agric. Water Manag. 2006, 86, 259–268. [Google Scholar] [CrossRef]
  44. Sánchez-Reinoso, A.D.; Ligarreto-Moreno, G.A.; Restrepo-Díaz, H. Chlorophyll α Fluorescence Parameters as an Indicator to Identify Drought Susceptibility in Common Bush Bean. Agronomy 2019, 9, 526. [Google Scholar] [CrossRef] [Green Version]
Figure 1. Effect of water stress on stomatal conductance (gs) in pot experiments. The upper panel shows gs for Cimarrón and L. Cimarrón under irrigation treatments. Dates with statistical differences between irrigation treatments are denoted by an asterisk; in theses dates only T30 resulted significant different to the other treatments (n = 3) after Tukey’s test (p ≤ 0.05). The lower panel shows pots volumetric soil moisture (θv) and the vapor pressure deficit (VPD, -x-). The grey bar indicates the period in which the water restriction was applied.
Agronomy 11 00562 g001
Figure 2. Effect of water stress on stomatal conductance (gs) in pot experiments. The upper panel shows gs for Coscorrón and Rubí under irrigation restriction treatments. Dates with statistical differences between irrigation treatments are denoted by an asterisk; in theses dates only T30 resulted significant different to the other treatments (n = 3) after Tukey’s test (p ≤ 0.05). The lower panel shows pots volumetric soil moisture (θv) and the vapor pressure deficit (VPD, -x-). The grey bar indicates the period in which the water restriction was applied.
Agronomy 11 00562 g002
Table 1. Yields and yields components of two cultivars of green-shelled beans under pot capacity or water restriction conditions during vegetative stage of development.
TreatmentsSeed Yield
(g m−2)
100-Seed Weight (g)Biomass
(g Plant−1)
Pods Length (cm)N° (Number)
Pods Plant−1
N° Seeds Pods−1Harvest Index (HI)
Water stress (WS)
T100647.4 ± 41.9 a89.8 ns28.5 ± 2.9 a10.9 ± 0.1 ns18.9 ± 1.2 a4.4 ± 0.1 a0.50 ± 0.04 a
T50409.1 ± 53.9 b92.2 ns21.5 ± 2.3 a10.7 ± 0.1 ns14.4 ± 1.3 b4.0 ± 0.2 ab0.42 ± 0.06 b
T30235.9 ± 40.0 c92.2 ns15.1 ± 2.0 b10.6 ± 0.2 ns9.2 ± 1.4 c3.7 ± 0.1 b0.31 ± 0.01 c
Cultivar (C)
Cimarrón467.3 ± 62.5 ns 92.7 ns24.1 ± 2.8 ns10.8 ± 0.1 ns15.4 ± 1.6 ns4.1 ± 0.1 ns0.38 ± 0.25 ns
L. Cimarrón394.3 ± 51.2 ns89.4 ns19.2 ± 2.7 ns10.7 ± 0.1 ns12.9 ± 1.2 ns4.0 ± 0.1 ns0.43 ± 0.31 ns
IR × Cns-ns-nsnsns
The table shows mean values for irrigation regimes (main plot: T100, T50, T30), cultivars (subplot: Cimarrón and L. Cimarrón), and as their interactions (IR × C: irrigation regime by cultivar). Each value represents mean ± SEM (n = 3). Means follow by different letters in the same column indicate significant differences (p ≤ 0.05) according to Tukey’s test; ns = non-significant difference (p > 0.05).
Table 2. Yields and yields components of two cultivars of green-shelled beans under pot capacity or water restriction conditions during reproductive stage of development.
TreatmentsSeed Yield
(g m−2)
100-Seed Weight (g)Biomass
(g Plant−1)
Pods Length
(cm)
N° Pods Plant−1N° Seeds Pods−1HI
Water stress (WS)
T100398.0 ± 55.9 a92.8 ns16.6 ± 1.6 a11.8 ± 0.1 a12.6 ± 1.5 a4.1 ± 0.2 a0.42 ± 0.23 ns
T50223.9 ± 27.8 b84.7 ns10.3 ± 1.1 b11.2 ± 0.1 b8.6 ± 0.8 b3.7 ± 0.2 ab0.39 ± 0.20 ns
T30140.3 ± 18.1 c79.9 ns5.9 ± 0.9 b10.8 ± 0.2 b6.4 ± 0.8 b3.3 ± 0.2 b0.37 ± 0.18 ns
Cultivar (C)
Coscorrón256.4 ± 46.8 ns84.0 ns11.8 ± 1.7 ns11.3 ± 0.1 ns9.8 ± 1.2 ns3.4 ± 0.2 b0.38 ± 0.28 ns
Rubí251.7 ± 35.6 ns85.6 ns10.1 ± 1.4 ns11.5 ± 0.1 ns8.6 ± 1.0 ns4.0 ± 0.2 a0.41 ± 0.23 ns
IR × Cns-nsnsnsns-
The table shows mean values for irrigation regimes (main plot: T100, T50, T30), cultivars (subplot: Coscorrón and Rubí), and as their interactions (IR × C: irrigation regime by cultivar). Each value represents mean ± SEM (n = 3). Means follow by different letters in the same column indicate significant differences (p ≤ 0.05) according to Tukey’s test; ns = non-significant difference (p > 0.05).
Table 3. Yields and yields components of four green-shelled bean cultivars under field capacity or water restriction conditions during the reproductive stage of development.
TreatmentsSeed Yield
(Kg m−2)
100-Seed Weight
(g)
Biomass
(g Plant−1)
Pods Length (cm)N° Pods Plant−1N° Seeds Pods−1HI
Water stress (WS)
I1001.99 ± 0.3 ns106.4 a369 ± 46.1 a13.5 ± 0.1 a16.4 ± 2.3 ns5.7 ± 0.1 a0.38 ± 0.01 ns
I401.64 ± 0.2 ns93.5 b297 ± 30.2 b13.3 ± 0.1 b16.6 ± 1.9 ns5.4 ± 0.1 b0.39 ± 0.02 ns
Cultivar (C)
Cimarrón1.65 ± 0.1 ns88.2 c322 ± 7.3 ns12.7 ± 0.1 b16.6 ± 1.2 ns5.6 ± 0.1 ns0.36 ± 0.01 ns
L. Cimarrón 1.81 ± 0.4 ns97.5 b335 ± 63.5 ns 12.8 ± 0.1 b17.9 ± 3.4 ns5.7 ± 0.1 ns0.38 ± 0.01 ns
Coscorrón1.91 ± 0.2 ns108.3 a336 ± 55.3 ns14.1 ± 0.1 a16.4 ± 1.6 ns5.4 ± 0.1 ns0.41 ± 0.01 ns
Rubí1.89 ± 0.3 ns106.0 a341 ± 55.3 ns14.1 ± 0.1 a14.9 ± 2.1 ns5.5 ± 0.1 ns 0.40 ± 0.03 ns
IR × C-nsnsns-ns-
The table shows mean values for irrigation regimes (main plot: I100, I40), cultivars (subplot: Cimarrón, L. Cimarrón, Coscorrón, and Rubí), and as their interactions (IR × C: irrigation regime by cultivar). Each value represents mean ± SEM (n = 3). Means follow by different letters in the same column indicate significant differences (p ≤ 0.05) according to Newman–Keuls test; ns = non-significant difference (p > 0.05).
Table 4. Mean comparisons of interaction effects between cultivar and irrigation levels on stomatal conductance (gs) and chlorophyll fluorescence (Fv/Fm) under field conditions.
Treatmentsgs (mmol m−2 s−1)Fv/Fm
Water stress (WS)
I100205.5 ± 10.6 a0.72 ± 0.04 a
I40161.6 ± 13.3 b0.59 ± 0.09 b
Cultivar (C)
Cimarrón206.9 ± 12.4 a0.63 ± 0.08 ns
L. Cimarrón181.2 ± 8.7 ab0.64 ± 0.09 ns
Coscorrón166.7 ± 14.0 b0.65 ± 0.03 ns a
Rubí178.8 ± 12.7 b0.69 ± 0.06 ns
IR × Cnsns
The table shows mean values for irrigation regimes (main plot: I100, I40), cultivars (subplot: Cimarrón, L. Cimarrón, Coscorrón, and Rubí), and as their interactions (IR × C: irrigation regime by cultivar). Each value represents mean ± SEM (n = 3). Means follow by different letters in the same row indicate significant differences (p ≤ 0.05) according to Newman–Keuls test; ns = non-significant difference (p > 0.05).
Table 5. Water use efficiency of biomass (WUEb) and grain (WUEg) of four green-shelled bean cultivars in pot experiments.
CultivarIrrigation Regime TreatmentTotal ETc (mm)WUEb
(g mm−1)
WUEg
(g mm−1)
CimarrónT100418.60.192 ± 0.022 A a ab0.055 ± 0.005 A a
T50387.70.159 ± 0.026 A a0.038 ± 0.010 B a
T30341.30.117 ± 0.031 B a0.028 ± 0.008 B a
L. CimarrónT100423.70.168 ± 0.015 A a0.049 ± 0.005 A a
T50375.80.128 ± 0.003 A a0.034 ± 0.002 B a
T30351.40.088 ± 0.002 B a0.018 ± 0.001 B a
RubíT100363.20.118 ± 0.022 A a0.035 ± 0.007 A a
T50272.60.117 ± 0.031 AB a0.029 ± 0.002 AB a
T30225.30.082 ± 0.015 B a0.021 ± 0.003 B a
CoscorrónT100359.20.142 ± 0.021 A a0.039 ± 0.008 A a
T50269.80.110 ± 0.018 AB a0.026 ± 0.007 AB a
T30243.60.083 ± 0.016 B a0.019 ± 0.004 B a
The table shows mean values for irrigation regimes (main plot: T100, T50, T30). Each value represents the mean ± SE (n = 3). Upper case letters indicate differences between irrigation regimes for the same cultivar. Lower case letters indicate differences between cultivars for the same irrigation regime (Tukey’s test, p ≤ 0.05). No interactions between plots (IR × C: irrigation regime by cultivar) were observed for crop evapotranspiration (ETc), WUEb, and WUEg (p > 0.05).
Table 6. Water use efficiency of biomass (WUEb) and grain (WUEg) of four green-shelled bean cultivars in field experiments.
CultivarIrrigation Regime TreatmentTotal ETc (mm)WUEb
(g mm−1)
WUEg
(g mm−1)
CimarrónI100191.416.506 ± 0.650 B a5.771 ± 0.495 B a
I4076.5632.119 ± 0.230 A a12.236 ± 0.245 A a
L. CimarrónI100191.418.916 ± 4.947 B a7.383 ± 2.322 B a
I4076.5630.260 ± 3.310 A a11.540 ± 1.353 A a
RubíI100191.422.122 ± 3.613 B a8.700 ± 1.224 B a
I4076.5625.632 ± 4.128 A a10.239 ± 1.958 A a
CoscorrónI100191.421.622 ± 0.801 B a8.621 ± 0.307 B a
I4076.5625.644 ± 3.968 A a10.738 ± 1.883 A a
The table shows mean values for irrigation regimes (main plot: I100, I40). Each value represents the mean ± SE (n = 3). Upper case letters indicate differences between irrigation regimes for the same cultivar. Lower case letters indicate differences between cultivars for the same irrigation regime (Newman–Keuls test, p ≤ 0.05). No interactions between plots (IR × C: irrigation regime by cultivar) were observed for ETc, WUEb, and WUEg (p > 0.05).
Publisher’s Note: MDPI stays neutral with regard to jurisdictional claims in published maps and institutional affiliations.

