Abstract
Recently, the interest in improving the content of bioactive compounds for enhancing the nutritional value of cereal-based products has largely increased, and several strategies, both genetic and agronomic, were proposed. Here, we report the preliminary results of the effect of two sowing periods (winter and spring) on the accumulation of bioactive compounds (i.e., anthocyanins, carotenoids, minerals) and grain morphology in three pigmented cereal species (barley, bread and durum wheat). The results showed that with delayed sowing time, a significant reduction in yield was observed in all species, less in barley (50.4%) than in wheat (70.3% and 66.5% for bread and durum, respectively). On the contrary, the carotenoids accumulation was favored (increased by 12.2%, 15.7% and 27.8% for barley, bread and durum wheat, respectively), as well as those of anthocyanins although strongly dependent on the genotype (i.e., considering only the purple genotypes, the anthocyanins increase by 4.6%, 35.4% and 72.8% in barley, bread and durum wheat, respectively). For minerals compounds, our study highlighted a strong environmental influence even when the pigmented genotypes accumulated more minerals than commercial ones, while the morphometric seed traits were less influenced by this agronomic practice. Therefore, by exploiting the genetic variability for the accumulation of anthocyanins and carotenoids in the grain and by optimizing the sowing time, it could be possible to increase the nutritional value of the final cereal-based products.
1. Introduction
Barley (Hordeum vulgare L.) and wheat (Triticum spp.) are some of the most common cereal crops in terms of area and production worldwide [1,2]. Bread and durum wheats are mainly intended for human consumption, while barley is mainly used for animal feed and for brewing, although recently its use as food is growing [3]. They can be grown under many different soil properties and topography, being adaptable to contrasting weather conditions. For that reason, more research for adaptation strategies should be explored to reduce the problem of this increasing gap, especially under the predicted future climatic changes. Appropriate sowing time of various field crops results in higher economic yield without involving extra cost, as it helps genotypes to express their full growth potential. From this perspective, several investigations were conducted to evaluate the effect of the sowing date on the yield and its component in cereals, especially in wheat [4,5,6,7,8]. These studies highlighted that the choice of proper sowing date for each wheat genotype, under specific climatic conditions, can help to increase the yield.
In the last decade, the interest in improving the content of bioactive compounds to enhance the nutritional value of cereal crops has largely increased [9]. Among the bioactive compounds, the characterization of pigments (anthocyanins and carotenoids) in cereal crops has a pivotal role. Several investigations were conducted to quantify the anthocyanins and carotenoids in pigmented cereals, including barley [10,11], bread wheat [12] and durum wheat [13,14,15].
Anthocyanins are accumulated in a genotype-specific manner in pigmented seeds of cereal crops and legumes [16], participate in the formation of non-specific disease resistance in plants [17] and plant protection against biotic and abiotic stress factors [18,19] and are responsible for antioxidant [20,21] and photoprotective functions [22]. They have been shown to have many other properties like anti-inflammatory [23], antimutagenic and anticarcinogenic [24], antibacterial and hepatotoxicity activities [25], and they have multiple effects in several diseases associated with oxidative stress [26,27].
Carotenoids are the most important natural pigments, having a wide distribution, different structures and numerous biological functions, including their role as a precursor of vitamin A [28], their antioxidant activity [29], their increasing of iron adsorption and their protection against age-related macular degeneration and some types of cancer [30,31]. The accumulation of pigments in plants, such as carotenoids and anthocyanins, is affected by environmental conditions [15,32,33], and for both classes of compounds, a significant genetic variability has been shown [34,35,36,37].
The presence of a high amount of minerals (especially micronutrients) has an important impact on human health [38], and several studies have investigated the minerals’ variability in different cereals including wheat [39,40,41,42,43,44]. Unfortunately, most of the minerals present in the kernels are complexed with phytic acid, which reduces their nutritional availability [45]. In addition to the health benefits, minerals are essential in helping the plants better resist diseases and environmental stresses, and seeds rich in micronutrient are associated with greater seedling vigor and hence higher plant yield [46].
The success in crop improvement through breeding depends on the existence of genetic variation for bioactive compounds as well as by the moderate genotype-by-environment interaction (G × E) [47].
The carotenoid pigments concentration in wheat grain is a typical quantitative trait controlled by a complex genetic system (quantitative trait loci, QTL) and influenced by environmental factors. As confirmed by the high value of heritability, the genetic component is predominant, and this has facilitated the success of breeding programs [48]. Moreover, a significant effect of water stress on carotenoids and tocols accumulation in durum wheat was reported, suggesting that some of the genotypes were more sensitive than others [49].
Variable effects of genotype and environment on phenylpropanoid compounds were also reported in wheat. Some studies showed a greater contribution of the environment than genotypes on flavonoid and phenolic content [50], while others reported greater genotypic than environmental effects on polyphenols [37,51].
In barley, several phenolic compounds were affected by location and genotype, including flavonoids and proanthocyanidins, such as prodelphinidins [52]. Yang et al. [53] and Abdel-Aal and Choo [54] examined blue highland and hull-less barley, respectively, and found that genotype and climatic factors influenced the phenolic composition of barley. Several studies reported the environmental effect on the mineral’s accumulation in cereals [41,55,56]; however, it is necessary to confirm these data in several environments, also using genetic materials of different origin and provenance, in order to promote the development and consumption of cereal-based foods according to the changing needs of consumers.
In this context, the agronomic management of crop species could have a significant effect on the accumulation of bioactive compounds in cereal grains. Therefore, the aim of this research was to investigate the effect of sowing date on grain yield, seed morphology, as well as anthocyanins, carotenoids and minerals contents of pigmented barley, bread and durum wheat genotypes.
2. Materials and Methods
2.1. Plant Material and Growth Conditions
A collection of 24 genotypes belonging to three cereal species (S), including barley (Hordeum vulgare L. (genome H, 2n = 2x = 14)), bread wheat (Triticum aestivum L. (genome BBAADD, 2n = 6x = 42)) and durum wheat (Triticum turgidum subsp. durum Desf. (genome BBAA, 2n = 4x = 28)) were evaluated (Table 1). Among the genotypes considered for each species, commercial varieties with non-pigmented seeds were considered. All the genotypes were grown at the experimental farm of Council for Agricultural Research and Economics (CREA) Research Centre for Cereal and Industrial Crops at Foggia (41°27′30″ N; 15°33′06″ E) during the growing season of 2013-2014 in two different sowing dates (Sd): 7 December 2013 and 17 February 2014 (named from here on as winter and spring, respectively) according to a complete randomized blocks design with three replicates and plots of 5 m2. The genetic materials were grown in two adjacent experimental field trials adopting the same agronomic management except for the sowing date. The harvesting dates were 30 June and 9 July 2014 for winter and spring, respectively, corresponding to the same phenological stage (mature grain). The monthly rainfall and the mean, minimum and maximum temperature from November 2013 to July 2014 is shown in Figure S1. After harvesting the seeds were stored at 4 °C, just before the analyses, the seeds of the hulled accessions were de-hulled with a micro-thresher (Colombini S., Abbiategrasso (MI), Italy).

Table 1.
List of genotypes of barley, bread wheat and durum wheat.
2.2. Determination of Agronomical Traits and Seed Morphological Parameters
For each sample, the grain yield (GY) and the thousand-kernel weight (TKW), the latter calculated as the mean weight of three sets of 500 grains per plot, were recorded. The grain protein content (PC) was determined by Dumas combustion using a nitrogen/protein determinator (Leco FP-528; LECO Corp., St. Joseph, MI, USA) according to the Association of Official Analytical Chemists, Official Method 990.03 [57].
Seed morphological (length, width, thickness) and colorimetric parameters (CIE L, a and b coordinates) were determined by means of Image Analysis System based on reflectance measurements (SeedCount SC5000R, Next Instruments, Condell Park, Australia). The system consists of a high-resolution scanner for acquiring images using several grids for measuring different types of cereals.
2.3. Determination of Total Anthocyanin and Carotenoid Contents
The samples collected were ground to whole meal using a Cyclotec mill (Foss Tecator 1093, International PBI, Milan, Italy) with a sieve with 0.5 mm holes and scored for total anthocyanin content (TAC) and total carotenoid content reported as yellow pigments content (YPC).
The TAC was evaluated by a colorimetric test using the pH differential method [13] and expressed as Cy-3-Glc equivalents as micrograms per gram on dry matter.
The YPC was analyzed according to the method 14–50 of the American Association of Cereal Chemists (AACC ) International, as modified for micro-samples [58] and expressed as micrograms per gram on dry matter of β-carotene.
2.4. Determination of Macro- and Microelements
For the determination of the content of the macro- (Na, K, P, S, Ca, Mg) and microelement (Mn, Fe, Cu, Zn, Mo), the dried samples were milled using a Pulverisette® 7 Planetary Micro Mill, Classic Line, Fritsch, with an agate jar and balls, and twenty milligrams of each sample were used for the analysis.
The macro- and microelements were determined on samples digested and added up to 50 mL in polypropylene disposable tubes with high purity deionized water. Then, their content was determined using an inductively coupled plasma mass spectrometer (ICP-MS) (Agilent 7700x, Agilent Technologies, Santa Clara, CA, USA), equipped with an ASX-500 auto-sampler, as previously described [41]. The ICP-MS was tuned in standard mode and with collision gas (He) to remove many of the simple solvent and argon-based polyatomic spectral interferences. The plasma power was operated at 1550 ± 50 W, and the carrier and make-up gases were typically set at 0.83 and 0.17 L min−1. Sample uptake was maintained at approximately 0.1 mL min−1 by the self-aspirating PFA (Perfluoroalkoxy) nebulizer. A reference material was included randomly in analytical batches from digestion on ward (RM 1573a, from the National Institute of Standards and Technology, Gaithersburg, MD, USA). Data were processed by MassHunter WorkStation Software (Agilent Technologies, Santa Clara, CA, USA).
2.5. Statistical Analysis
Analysis of variance (ANOVA) was carried out with respect to each seed parameter (morphological and colorimetric) and mineral detected in the samples of three species. Mean discrimination was performed by applying Student’s t-test or Tukey’s multiple tests, and statistically significant differences were determined at the probability level of p ≤ 0.05. Relationships between individual variables were examined using Spearman’s rank correlation coefficients (p ≤ 0.05). To obtain a general comprehensive characterization of the samples of each species, the traits were subjected to principal component analysis (PCA) based on correlations. All the statistical analyses were performed using the JMP software, version 8.0 (SAS Institute Inc., Cary, NC, USA).
3. Results
3.1. Evaluated Traits among Species
Significant differences were observed between the species considered: barley showed the highest mean value of TKW, together with durum wheat, kernel length and width and of almost the minerals except for P and Mn, whose contents were highest in bread and durum wheat (Table S1). Bread wheat showed the highest PC and TAC, which was 1.2-fold and 3.6-fold of barley and durum wheat, respectively. Regarding the sowing date effect, an increase for all parameters evaluated was observed in spring field trial except for GY and Ca content that in spring decreased about 2.7- and 1.6-fold, respectively (Table 2).
Table 2.
Mean value ± SE of each variable investigated in the two different sowing data relating to the whole data set and specific to each species.
The common result among the three species due to the sowing data effect was that the yield drastically fell, with a loss of −50.4%, −70.3% and −66.5% for barley, bread wheat and durum wheat, respectively. For barley, the highest content of Na, Ca and Zn was observed in winter and for P and S in spring. Moreover, PC, TKW, mean length of kernels and YPC were significantly greater in spring. Concerning bread wheat, apart from TAC, S, Ca and Cu contents, which were higher in winter, all other traits, which significantly varied due to the Sd effect, were higher in spring. Finally, regarding durum wheat, with the GY, only the CIE L coordinate and S content were highest in winter (Table 2).
A PCA analysis was also conducted to confirm the behavior of the three species (Figure 1A, all species). The PCA plot showed the large effect of the S × Sd interaction where the PC1 and PC2 explained the 61.2% and 10.9% of total variability, respectively. Several traits had positive loading on PC1, including TAC and minerals, while the yield, the colorimetric coordinates and the morphological parameters were negatively loaded on PC1 (Figure 1B, all species). On the PC2, the most relevant traits that showed a positive loading were the yield and the Ca, while that with a negative loading was the PC. As shown, a general differentiation among the pigmented genotypes and the commercial ones was observed on the first component, while the differentiation for the sowing date was generally represented on the second component.
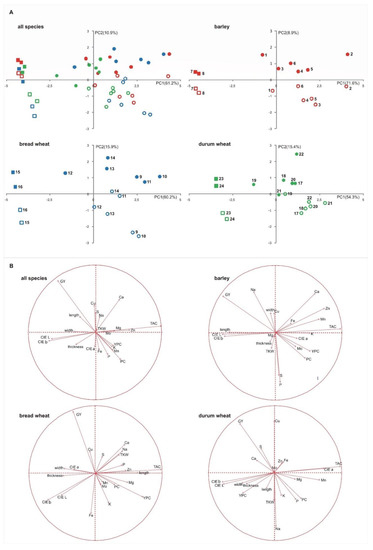
Figure 1.
PCA score plots (A) showing the distribution of the genotypes investigated. Each genotype was numbered according to Table 1, pigmented genotypes are represented by circle, commercial varieties are represented by square. Full shape, winter sowing; empty shape, spring sowing. PCA loading plots (B) showing the distribution of the analyzed variables.
3.2. Evaluated Traits among the Genotypes within Each Species
Table 3 reports the mean values of the parameters detected in each genotype within each species. In barley, the two commercial varieties (Dasio and Diomede) had the highest values of yield, length, CIE L and CIE b parameters, while the pigmented genotypes showed the highest values for the other traits. In particular, the genotype CLHO1312 showed the highest mean value for thickness and Mn content; the genotype CLHO14016 for TAC, Ca and Zn content; the genotype CLHO14726 for thickness and CIE a parameter; the genotype PI234851 for PC, YPC, Mg, Ca, Mn and Mo; the genotype PI566040 for thickness, CIE a and K; and PI573629 for TKW and Cu content.
Table 3.
Mean value ± SE of each variable investigated in the genotypes of the three species considered.
In bread wheat, the highest yield value was recorded by Violet (commercial variety), while the pigmented genotypes showed higher amounts of PC (PI542453 accession), TKW (PI 634540 and PI542453 accessions) and length in blue genotypes and in a purple (PI542453). The last one was characterised also by major width and thickness. The accession PI634539 showed the highest TAC, YPC, Ca, Fe and Cu content, while the accession CLTR14953 those of Mg, P, K, Mn and Zn. In durum wheat as well, the yield was greater in the two commercial varieties (PR22D89 and Preco) as well as the kernel width, thickness, YPC, CIE L, CIE b, Na and Mo; on the contrary, the pigmented durum wheat genotypes showed the highest content of PC (PI 352395 accession), TKW (CLTR14097 accession), length (PI 352445 and CLTR14097 accessions), CIE a (PI352395 accession), TAC (all with the exception of CLTR 14097 accession), P (all with the exception of CLTR17240 and CLTR17346 accessions), K (CLTR17346 accession) and Mn (CLTR14435 accession).
A multifactorial PCA analysis was conducted within each species to highlight the different behavior of the single genotypes considered (Figure 1). For barley, bread and durum wheat, the first two components accounted for 80.5%, 76.1% and 69.7% of variability, respectively. When we considered the species separately, it was observed that a similar behavior to that reported for the entire data set, with pigmented genotypes and commercial varieties differentiated on the first component and the sowing date differentiated principally on the second component. This was since, in all species, the TAC had positive loading on PC1, while the colorimetric coordinates (CIE L, b) and the morphological parameters (width and thickness) had negative loading. For all species, yield and PC were negatively and positively loaded to PC1 and vice versa to PC2. The G × Sd interaction was principally different for the behavior of some minerals (see Figure 1B).
3.3. Analysis of Variance
ANOVA for the whole data set as well as for each species analyzed individually is shown in Table 4. Considering the whole data set, a significant effect of the cereal species (S) was observed for several evaluated parameters as PC, TKW, kernel length and width, CIE a, TAC, macroelements, Mn, Fe and Mo. The sowing date (Sd) showed a significant impact on grain yield, PC, TKW, YPC and macroelements (except for Na), while a significant effect of S × Sd interaction was observed only for minerals content, especially macroelements, and for iron and zinc.
Table 4.
Significances of the mean differences for each variable investigated relating to the whole data set and specific to each species, grown with two different sowing dates.
Considering the three species separately, the ANOVA showed some differences among barley, bread and durum wheats. In barley, the genotype (G) represented the main source of variation, explaining on average 61% of variability, while in bread and durum wheat, the percentages were 60 and 46%, respectively (Figure 2). In bread wheat, the content of zinc and phosphorus were affected exclusively by G (Table 4). The Sd effect represented on average about the 8%, 11% and 16% of variability in barley, bread wheat and durum wheat, respectively (Figure 2). Of the 22 traits analyzed, Sd was significant for 11 traits (GY, PC, TKW, length, CIE b, YPC, and the contents of Na, P, S, Ca and Zn) in barley, for 15 parameters (GY, PC, thickness, CIE L, CIE a, CIE b, TAC, YPC, Mg, S, K, Ca, Mn, Fe, Cu) in bread wheat, while in durum wheat, the Sd affected 13 traits among those measured (GY, PC, TKW, CIE L, CIE a, TAC, YPC, Na, Mg, P, S, K, Mn).
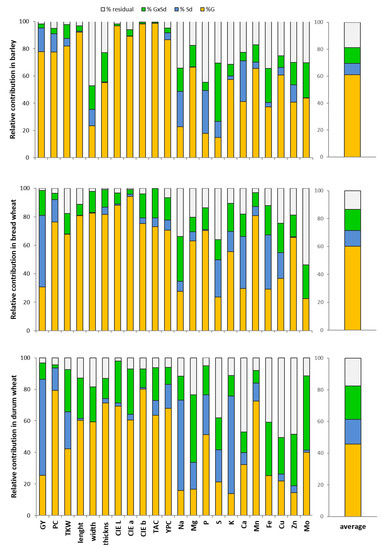
Figure 2.
Percentages of the contributions of G, Sd and G × Sd to the variability for all the parameters for each species (barley, bread wheat, durum wheat).
Finally, the G × Sd interaction represents on average approximately 12%, 15% and 21% of the variance for the three species affecting 6, 12 and 15 parameters, respectively (Figure 2, Table 4).
When focusing on the percentage of contribution to variance of G, Sd and G × Sd interaction for each trait investigated in each species, it is possible to note that, for all species, the effect of G is prevalent for all analyzed characters except for those related to minerals. In barley, bread and durum wheat, the highest contribution of G was reported for PC and all morphological and colorimetric parameters regarding the seed color. The genotype also fully explained the amount of variance observed for the TAC and YPC. For most of the mineral compounds, the observed variance was not explained (% residual) or was explained by the G × Sd interaction, with some exceptions such as Mn, among the microelements, and Mg in bread wheat and barley and P in bread and durum wheat among the macroelements (Figure 2).
3.4. Relationships between Yield and All Parameters Evaluated
The yield correlated negatively with almost all the parameters analyzed (Table 5). The least influenced traits were those related to the seed morphology, in which the correlation was absent or even positive (i.e., yield versus kernel length and width in barley and bread wheat, respectively). As expected, a significant and negative correlation was found with PC in barley and durum wheat (−0.689 p < 0.0001 and −0.502 p < 0.0034 for barley and durum wheat, respectively). These two species showed a similar response for TAC, which was negatively correlated to yield (−0.701 p < 0.0001 and −0.465 p < 0.0073 for barley and durum wheat, respectively) while YPC was negatively correlated with yield in barley (−0.548 p < 0.0012) and bread wheat (0.435 p < 0.0129). The correlations with minerals were also almost all negative, with some exceptions concerning Na for barley and S, Ca and Cu for durum wheat (Table 5). Only K showed a significant negative correlation in all species. The analysis highlighted a greater effect of yield on macroelements accumulation in durum wheat than in other species. For this species, in fact, all macroelements were significantly associated with yield. The microelements behaviour was not uniform among the species, so that in barley, only Mn was negatively associated with yield, in bread wheat, it was Fe and Mo, while in durum wheat Mn and Zn were negatively insured and Cu correlated positively with the yield.
Table 5.
Variables with significant Spearman correlation to grain yield (GY) in the three species. P = Spearman’s rank correlation coefficient; Prob = probability approximated to t-distribution; n.s. = not significant.
4. Discussion
Environmental conditions, including altitude, temperature and light, can positively or negatively affect the concentration of bioactive molecules in different crop species. In this study, we evaluated the effect of the sowing date on the accumulation of some important bioactive compounds in cereal grains. To this end, we considered a set of pigmented genotypes belonging to three cereal species. The genetic materials were sown in an optimal (winter) and delayed sowing date (spring) in order to simulate a severe stress condition and to verify if the expected yield penalty would be compensated by a significant increase in the accumulation of bioactive compounds. In general, the weather conditions of the entire growing season (November-July) were in line with those observed in the long period 1998–2019 (Figure S1).
Our results showed that sowing date affected all traits evaluated among the cereal species and genotypes. Several studies reported the strong effect of the sowing date on the performance of some bread wheat cultivars [56,59], as well as in durum wheat [60,61] and barley [62,63], and generally, a delay in sowing date has a negative effect on the production regardless of cultivar grown. In agreement with these results, we registered a significant yield decrease in spring sowing for species and genotypes considered. On average, the lowest yield decrease was observed in barley with respect to wheat species according to its reputation as a stress-tolerant crop [1]. However, the loss of yield of the colored genotypes compared to the commercial ones was mainly greater in barley, variable in bread wheat and lower in durum wheat. The only genotype that increases its yield with a delayed sowing is the bread wheat accession (PI634540) characterized by a blue pericarp; for all the others the loss of production was confirmed, although to different extents. The trend observed in the durum wheat group could be related to the fact that the colored accessions were not subjected to human selection, resulting in a lower production potential, which also translates into a smaller yield gap between the different agronomic conditions considered.
In general, the pigmented genotypes for each species showed a higher PC in comparison to the commercial genotypes and are comparable to previous studies [11,13,64]. The delayed sowing resulted in increased grain quality traits (i.e., grain protein) [65]. In durum wheat, a delayed sowing time positively affects some healthy aspects, including the protein content [66]. In another study it was shown that the climatic conditions of the spring period had a positive impact on the protein content of the grain, inducing an increase of 2% [67]. Accordingly, we observed an increase in the protein content in each genotype not only in durum wheat but also in the other two species, with a mean percentage of 9.5, 11.7 and 8.3 for barley, bread wheat and durum wheat, respectively. However, the percentage of increase for the pigmented genotypes ranged from 2.9 to 20.6 in barley, from 2.2 to 22.1 in bread wheat and from 1.6 to 10.6 in durum wheat.
Regarding the TKW, a significant increase in barley and durum wheat was observed with delay in sowing date, while in bread wheat, the variation among genotypes might be attributed to their genetic diversity. These results are in line with those reported in the literature [59,68], since the reduced yield recorded in spring sowing probably mainly depended on the lower number of seeds per unit of surface area. In fact, the late sowing of cereals leads to a reduction in the number of seeds per unit of area due to the lower number of spikes per square meter and of spikelets per spike [69]. This lower number of seeds per spike could result in a greater seed weight, more evident in barley and durum wheat than in bread wheat.
Compared to the accumulation of bioactive compounds, we focused principally on total content of anthocyanins, carotenoids and minerals due to their important role in health benefits [9,11,14,70].
During the last few years, to define the anthocyanin composition of different color cereals (including barley, bread and durum wheat), many genotypes have been studied, and the genetic diversity has been recorded [71]. In our study of barley, the TAC ranged from 11.84 to 199.98 ppm according to a previous investigation [11], and for bread wheat, our results are in line with those reported in the literature, highlighting the highest values of the genotypes with blue pericarp [12,13,65]. Very few comparisons of durum wheat TAC are available in the literature; however, the mean values for the purple genotypes investigated ranged from 20.18 to 73.62 and are comparable to those previously reported by other studies [13,70,71,72]. The quantity and composition of the anthocyanins can also be affected by the growing environments [73], so, it is important for breeding programs to study the interaction of genotype by environment (GxE).
Differently from anthocyanins, for carotenoids, several studies have reported that in cereals, these metabolites occur naturally either in free or esterified forms as a consequence of the cereal genotype used [35,74,75,76]. In accordance with the literature [13,64,77], the carotenoid content was lower than the anthocyanin content in the pigmented cereals, and here, no significant differences were observed among the three pigmented cereal groups. Nevertheless, if we consider the species separately, the pigmented genotypes of barley and bread wheat showed a carotenoid content similar or higher compared to the respective commercial varieties, as also reported before [36]. Differently, in durum wheat, except for PI 352445, the commercial varieties showed the higher YPC in comparison to the pigmented genotypes in line with the expectations, as a consequence of the long process of genetic improvement to increase the semolina yellow color in modern durum wheat varieties [14,35,78,79].
Because the contribution of the TAC and YPC to the antioxidant activity of wheat and other crop species is well established [10,80,81], a central result of this study is the different accumulation observed in relation to the sowing date among the three species considered. With a delayed sowing date, the YPC significantly increased in all the three species considered (12.2%, 15.7% and 27.8% for barley, bread and durum wheat, respectively), as well as for the TAC, although with some differences among species and genotypes. In fact, considering only the purple genotypes, a small TAC increase was observed in barley (4.6%), whereas a significant increase for bread and durum wheat (35.4% and 72.8%, respectively) was recorded. These results revealed a similar response to sowing date for all genotypes with purple pericarp, even if with a different magnitude. On the contrary, for blue wheats, the delay in sowing resulted in a significant reduction in TAC (−44.5%), suggesting a different response to environmental conditions. The different and recent origin of blue wheats and their lower ability to adapt to extreme climatic conditions compared to purple wheats [13,16,34] could be the cause that makes these accessions less suitable for late sowing, although the TAC was higher than purple genotypes in all agronomic conditions.
For the mineral concentrations across the entire collection, the data in the present study are within the ranges defined previously on tetraploid wheat [39]. Except for Cu, the concentrations of Mn, Zn and Fe in purple wheats were higher than those of the commercial varieties (3.0, 5.8 and 3.9%, respectively). Interestingly, the mineral contents in the blue wheats analyzed in the present study are characterized by the highest Fe content (46.13 mg/kg), with a limited range of variation, whereas the purple wheats are characterized by the highest Zn content, which is more variable and in agreement with previous results [39]. Interestingly, a significant negative correlation was found in durum wheat between the yield and some macroelements (i.e., Na, Mg, P and K).
Generally, it is reported that during the grain filling, the combination of stress conditions induced a substantial decrease in yield in several crops, including cereals [82,83], and this reduction is associated with an increase in protein content [84], as well as a significant association of minerals content [85]. For these compounds, our study highlighted a strong environmental influence even if the pigmented genotypes, accumulating more minerals, represent promising starting materials for breeding efforts, which should also focus on improving mineral nutrients to further enhance quality, particularly under future climate changes.
5. Conclusions
Our results confirm that delayed sowing leads to exposing plants to water and thermal stress conditions, reducing yield and favoring the accumulation of anthocyanins, carotenoids and minerals, since cultivation in non-optimal conditions can favorably influence accumulation of bioactive substances in wheat. On the contrary, the morphometric seed traits appear less influenced by this agronomic practice. Genetic materials characterized by a low yield potential (i.e., landraces, old cultivars, ancient wheats), or in any case genotypes that were not subjected to a strong breeding activity (i.e., pigmented accessions), seem to be the most suitable for this agronomic management, as the yield losses compared to optimal sowing conditions are limited in the face of the significant increase in bioactive compounds. Although preliminary, the results of this study allowed us to gather information regarding the variability of anthocyanins, carotenoids and minerals in relation to different cereal species and genotypes grown under optimal and sub-optimal sowing date. The large genetic component associated with the accumulation of anthocyanins and carotenoids in the grain could contribute to developing breeding programs aimed at increasing the content of bioactive compounds by bridging the production gap between pigmented and commercial varieties. In addition, the optimization of the agronomic management of the crop species (i.e., sowing time) could contribute to increasing the concentration of micronutrients in the grain and increasing the nutritional value of the final products.
Supplementary Materials
The following are available online at https://www.mdpi.com/2073-4395/11/3/591/s1, Figure S1 Rainfall and air temperature at CREA-CI experimental station during the growing season (November 2013 to July 2014), compared with the long-term mean over 1998-2019. Monthly and daily data were used for rainfall (mm) and temperatures (°C), respectively. The sowing and harvesting dates were highlighted in red for winter and green for spring, respectively. (A) Temperature (°C): dashed line = growing season; continuous line = long-term; grey (T max), red (T mean) dark grey (T min). (B) Monthly rain (mm): dashed line = growing season; bars = long-term. Table S1 Mean value ± SE of each variable investigated in the thrpee species considered.
Author Contributions
Conceptualization, D.V.P. and B.R. and F.D.B.M.; methodology, B.R., C.S.A., F.D.B.M., P.I., G.V., N.F., and D.V.P.; data analysis and visualization, B.R.; writing—original draft preparation, B.R.; writing—review and editing B.R.; supervision, D.V.P. All authors have read and agreed to the published version of the manuscript.
Funding
The research was carried out in the frame of the project “Impiego di grani pigmentati per lo sviluppo di prodotti alimentari tracciabili ad alto valore aggiunto naturalmente ricchi di molecole bioattive—PIGRANI” financed by Ministry of Economy Development (MiSE) N. F/200072/03/X45 and by the project “An integrated approach to the challenge of sustainable food systems: adaptive and mitigatory strategies to address climate change and malnutrition—SYSTEMIC” financed by the Ministry of Agricultural, Food and Forestry Policies (MIPAAF) EoI N. 967.
Institutional Review Board Statement
Not applicable.
Informed Consent Statement
Not applicable.
Conflicts of Interest
The authors declare no conflict of interest.
References
- Newton, A.C.; Flavell, A.J.; George, T.S.; Leat, P.; Mullholland, B.; Ramsay, L.; Revoredo-Giha, C.; Russell, J.; Steffenson, B.J.; Swanston, J.S.; et al. Crops that feed the world 4. Barley: A resilient crop? Strengths and weaknesses in the context of food security. Food Secur. 2011, 3, 141–178. [Google Scholar] [CrossRef]
- De Vita, P.; Taranto, F. Durum Wheat (Triticum turgidum ssp. durum) Breeding to Meet the Challenge of Climate Change. In Advances in Plant Breeding Strategies: Cereals; Springer International Publishing: New York, NY, USA, 2019; pp. 471–524. [Google Scholar]
- Derakhshani, Z.; Malherbe, F.; Panozzo, J.F.; Bhave, M. Evaluation of Diverse Barley Cultivars and Landraces for Contents of Four Multifunctional Biomolecules with Nutraceutical Potential. Curr. Res. Nutr. Food Sci. J. 2020, 8, 380–390. [Google Scholar] [CrossRef]
- Shah, W.A.; Bakht, J.; Ullah, T.; Khan, A.W.; Zubair, M.; Khakwani, A.A. Effects of sowing dates on the Yield and Yield components of different wheat varieties. J. Agron. 2006, 5, 106–110. [Google Scholar] [CrossRef]
- Ali, M.A.; Ali, S.M.; Sattar, M.; Ali, L. Sowing date effect on yield of different wheat varieties. J. Agric. Res. 2010, 48, 157–162. [Google Scholar]
- Fayed, T.B.; El-Sarag, E.I.; Hassanein, M.K.; Magdy, A. Evaluation and prediction of some wheat cultivars productivity in relation to different sowing dates under North Sinai region conditions. Ann. Agric. Sci. 2015, 60, 11–20. [Google Scholar] [CrossRef]
- Shaaban, A.S.A.; Wahbi, A.; Sinclair, T.R. Sowing date and mulch to improve water use and yield of wheat and barley in the Middle East environment. Agric. Syst. 2018, 165, 26–32. [Google Scholar] [CrossRef]
- Wyzińska, M.; Grabiński, J. The influence of autumn sowing date on the productivity of spring wheat (Triticum aestivum L.). In Research for Rural Development 2018, Proceeding of the 24th Annual International Scientific Conference Research for Rural Development; Latvia University of Life Sciences and Technologies: Jelgava, Latvia, 2018; Volume 2, pp. 35–41. [Google Scholar] [CrossRef]
- Gani, A.; Wani, S.M.; Masoodi, F.A.; Gousia, H. Whole-grain cereal bioactive compounds and their health benefits: A review. J. Food Process. Technol. 2012, 3, 146–155. [Google Scholar] [CrossRef]
- Kim, M.J.; Hyun, J.N.; Kim, J.A.E.; Park, J.C.; Kim, M.Y.; Kim, J.G.; Lee, S.J.; Chun, S.C.; Chung, I.M. Relationship between Phenolic Compounds, Anthocyanins Content and Antioxidant Activity in Colored Barley Germplasm. J. Agric. Food Chem. 2007, 55, 4802–4809. [Google Scholar] [CrossRef]
- Eticha, F.; Grausgrever, H.; Berghoffer, E. Multivariate analysis of agronomic and quality traits of hull-less spring barley (Hordeum vulgare L.). J. Plant. Breed. Crop. Sci. 2010, 2, 81–95. [Google Scholar]
- Žofajová, A.; Pšenáková, I.; Havrlentová, M.; Piliarová, M. Accumulation of Total Anthocyanins in Wheat Grain. Agriculture 2012, 58, 50–56. [Google Scholar] [CrossRef]
- Ficco, D.B.M.; De Simone, V.; Colecchia, S.A.; Pecorella, I.; Platani, C.; Nigro, F.; Finocchiaro, F.; Papa, R.; De Vita, P. Genetic Variability in Anthocyanin Composition and Nutritional Properties of Blue, Purple, and Red Bread (Triticum aestivum L.) and Durum (Triticum turgidum L. ssp.turgidumconvar.durum) Wheats. J. Agric. Food Chem. 2014, 62, 8686–8695. [Google Scholar] [CrossRef]
- Ficco, D.B.M.; Mastrangelo, A.M.; Trono, D.; Borrelli, G.M.; De Vita, P.; Fares, C.; Beleggia, R.; Platani, C.; Papa, R. The colours of durum wheat: A review. Crop. Pasture Sci. 2014, 65, 1–15. [Google Scholar] [CrossRef]
- De Leonardis, A.M.; Fragasso, M.; Beleggia, R.; Ficco, D.B.M.; De Vita, P.; Mastrangelo, A.M. Effects of Heat Stress on Metabolite Accumulation and Composition, and Nutritional Properties of Durum Wheat Grain. Int. J. Mol. Sci. 2015, 16, 30382–30404. [Google Scholar] [CrossRef]
- Abdel-Aal, E.S.M.; Young, J.C.; Rabalski, I. Anthocyanin Composition in Black, Blue, Pink, Purple, and Red Cereal Grains. J. Agric. Food Chem. 2006, 54, 4696–4704. [Google Scholar] [CrossRef]
- Treutter, D. Significance of flavonoids in plant resistance: A review. Environ. Chem. Lett. 2006, 4, 147–157. [Google Scholar] [CrossRef]
- Khlestkina, E.; Antonova, E.; Pershina, L.; Soloviev, A.; Badaeva, E.; Börner, A.; Salina, E. Variability ofRc(red coleoptile) alleles in wheat and wheat-alien genetic stock collections. Cereal Res. Commun. 2011, 39, 465–474. [Google Scholar] [CrossRef]
- Shoeva, O.; Khlestkina, E. Anthocyanins participate in the protection of wheat seedlings against cadmium stress. Cereal Res. Commun. 2018, 46, 242–252. [Google Scholar] [CrossRef]
- Kong, J.M.; Chia, L.S.; Goh, N.K.; Chia, T.F.; Brouillard, R. Analysis and biological activities of anthocyanins. Phytochemistry 2003, 64, 923–933. [Google Scholar] [CrossRef]
- Abdel-Aal, E.S.M.; Abou-Arab, A.A.; Gamel, T.H.; Hucl, P.; Young, J.C.; Rabalski, I. Fractionation of Blue Wheat Anthocyanin Compounds and Their Contribution to Antioxidant Properties. J. Agric. Food Chem. 2008, 56, 11171–11177. [Google Scholar] [CrossRef] [PubMed]
- Ryan, K.G.; E Swinny, E.; Winefield, C.; Markham, K.R. Flavonoids and UV Photoprotection in Arabidopsis Mutants. J. Nat. Res. 2001, 56, 745–754. [Google Scholar] [CrossRef] [PubMed]
- Bowen-Forbes, C.S.; Zhang, Y.; Nair, M.G. Anthocyanin content, antioxidant, anti-inflammatory and anticancer properties of blackberry and raspberry fruits. J. Food Compos. Anal. 2010, 23, 554–560. [Google Scholar] [CrossRef]
- Wang, L.S.; Stoner, G.D. Anthocyanins and their role in cancer prevention. Cancer Lett. 2008, 269, 281–290. [Google Scholar] [CrossRef]
- Mazza, G. Anthocyanins and heart health. Ann. Ist. Super. Sanità 2007, 43, 369–374. [Google Scholar] [PubMed]
- Baublis, A.J.; Clydesdale, E.M.; Decker, E.A. Antioxidants in wheat-based breakfast cereals. Cereal Foods World 2000, 45, 71–74. [Google Scholar]
- De Pascual-Teresa, S.; Moreno, D.A.; García-Viguera, C. Flavanols and Anthocyanins in Cardiovascular Health: A Review of Current Evidence. Int. J. Mol. Sci. 2010, 11, 1679–1703. [Google Scholar] [CrossRef] [PubMed]
- Yeum, K.J.; Russell, R.M. Carotenoid bioavailability and bioconversion. Annu. Rev. Nutr. 2002, 22, 483–504. [Google Scholar] [CrossRef] [PubMed]
- Mueller, L.; Boehm, V. Antioxidant Activity of β-Carotene Compounds in Different in Vitro Assays. Molecules 2011, 16, 1055–1069. [Google Scholar] [CrossRef] [PubMed]
- Landrum, J.T.; Bone, R.A. Dietary lutein & zeaxanthin: Reducing the risk for macular degeneration. Agron. Food Ind. Hitech. 2004, 15, 22–25. [Google Scholar]
- Nishino, H.; Murakoshi, M.; Tokuda, H.; Satomi, Y. Cancer prevention by carotenoids. Arch. Biochem. Biophys. 2009, 483, 165–168. [Google Scholar] [CrossRef] [PubMed]
- Jing, P.; Noriega, V.; Schwartz, S.J.; Giusti, M.M. Effects of Growing Conditions on Purple Corncob (Zea mays L.) Anthocyanins. J. Agric. Food Chem. 2007, 55, 8625–8629. [Google Scholar] [CrossRef]
- Rao, S.; Schwarz, L.J.; Santhakumar, A.B.; Chinkwo, K.A.; Blanchard, C.L. Cereal phenolic contents as affected by variety and environment. Cereal Chem. J. 2018, 95, 589–602. [Google Scholar] [CrossRef]
- Knievel, D.C.; Abdel-Aal, E.S.M.; Rabalski, I.; Nakamura, T.; Hucl, P.J. Grain colour development and the inheritance of high anthocyanin blue aleurone and purple pericarp in spring wheat (Triticum aestivum L.). J. Cereal Sci. 2009, 50, 113–120. [Google Scholar] [CrossRef]
- Digesù, A.; Platani, C.; Cattivelli, L.; Mangini, G.; Blanco, A. Genetic variability in yellow pigment components in cultivated and wild tetraploid wheats. J. Cereal Sci. 2009, 50, 210–218. [Google Scholar] [CrossRef]
- Paznocht, L.; Kotíková, Z.; Šulc, M.; Lachman, J.; Orsák, M.; Eliášová, M.; Martinek, P. Free and esterified carotenoids in pigmented wheat, tritordeum and barley grains. Food Chem. 2018, 240, 670–678. [Google Scholar] [CrossRef] [PubMed]
- Zrckova, M.; Capouchova, I.; Eliášová, M.; Paznocht, L.; Pazderů, K.; Dvořák, P.; Konvalina, P.; Orsák, M.; Štěrba, Z.; Monika, Z.; et al. The effect of genotype, weather conditions and cropping system on antioxidant activity and content of selected antioxidant compounds in wheat with coloured grain. Plant Soil Environ. 2018, 64, 530–538. [Google Scholar] [CrossRef]
- Slavin, J. Whole grains and human health. Nutr. Res. Rev. 2004, 17, 99–110. [Google Scholar] [CrossRef]
- Ficco, D.; Riefolo, C.; Nicastro, G.; De Simone, V.; Di Gesù, A.; Beleggia, R.; Platani, C.; Cattivelli, L.; De Vita, P. Phytate and mineral elements concentration in a collection of Italian durum wheat cultivars. Field Crop. Res. 2009, 111, 235–242. [Google Scholar] [CrossRef]
- Garcia-Oliveira, A.L.; Chander, S.; Ortiz, R.; Menkir, A.; Gedil, M. Genetic Basis and Breeding Perspectives of Grain Iron and Zinc Enrichment in Cereals. Front. Plant Sci. 2018, 9, 937. [Google Scholar] [CrossRef] [PubMed]
- Beleggia, R.; Fragasso, M.; Miglietta, F.; Cattivelli, L.; Menga, V.; Nigro, F.; Pecchioni, N.; Fares, C. Mineral composition of durum wheat grain and pasta under increasing atmospheric CO2 concentrations. Food Chem. 2018, 242, 53–61. [Google Scholar] [CrossRef] [PubMed]
- Balk, J.; Connorton, J.M.; Wan, Y.; Lovegrove, A.; Moore, K.L.; Uauy, C.; Sharp, P.A.; Shewry, P.R. Improving wheat as a source of iron and zinc for global nutrition. Nutr. Bull. 2019, 44, 53–59. [Google Scholar] [CrossRef] [PubMed]
- Kenzhebayeva, S.; Abekova, A.; Atabayeva, S.; Yernazarova, G.; Omirbekova, N.; Zhang, G.; Turasheva, S.; Asrandina, S.; Sarsu, F.; Wang, Y. Mutant Lines of Spring Wheat with Increased Iron, Zinc, and Micronutrients in Grains and Enhanced Bioavailability for Human Health. BioMed. Res. Int. 2019, 2019, 1–10. [Google Scholar] [CrossRef] [PubMed]
- Ficco, D.B.; Beleggia, R.; Pecorella, I.; Giovanniello, V.; Frenda, A.S.; De Vita, P. Relationship between Seed Morphological Traits and Ash and Mineral Distribution along the Kernel Using Debranning in Durum Wheats from Different Geographic Sites. Foods 2020, 9, 1523. [Google Scholar] [CrossRef] [PubMed]
- Gupta, R.K.; Gangoliya, S.S.; Singh, G.S. Reduction of phytic acid and enhancement of bioavailable micronutrients in food grains. J. Food Sci. Technol. 2015, 52, 676–684. [Google Scholar] [CrossRef] [PubMed]
- Rengel, Z.; Graham, R.D. Importance of seed zinc content for wheat growth on Zn-deficient soil. Plant Soil 1995, 173, 259–266. [Google Scholar] [CrossRef]
- Oury, F.-X.; Leenhardt, F.; Rémésy, C.; Chanliaud, E.; Duperrier, B.; Balfourier, F.; Charmet, G. Genetic variability and stability of grain magnesium, zinc and iron concentrations in bread wheat. Eur. J. Agron. 2006, 25, 177–185. [Google Scholar] [CrossRef]
- Elouafi, I.; Nachit, M.M.; Martin, L.M. Identification of a microsatellite on chromosome 7B showing a strong linkage with yellow pigment in durum wheat (Triticum turgidum L. var. durum). Hereditas 2004, 135, 255–261. [Google Scholar] [CrossRef]
- Fratianni, A.; Giuzio, L.; Di Criscio, T.; Zina, F.; Panfili, G. Response of Carotenoids and Tocols of Durum Wheat in Relation to Water Stress and Sulfur Fertilization. J. Agric. Food Chem. 2013, 61, 2583–2590. [Google Scholar] [CrossRef]
- Fernandez-Orozco, R.; Li, L.; Harflett, C.; Shewry, P.R.; Ward, J.L. Effects of Environment and Genotype on Phenolic Acids in Wheat in the HEALTHGRAIN Diversity Screen. J. Agric. Food Chem. 2010, 58, 9341–9352. [Google Scholar] [CrossRef]
- Martini, D.; Taddei, F.; Ciccoritti, R.; Pasquini, M.; Nicoletti, I.; Corradini, D.; D’Egidio, M.G. Variation of total antioxidant activity and of phenolic acid, total phenolics and yellow coloured pigments in durum wheat (Triticum turgidum L. var. durum) as a function of genotype, crop year and growing area. J. Cereal Sci. 2015, 65, 175–185. [Google Scholar] [CrossRef]
- Rao, S.; Santhakumar, A.B.; Chinkwo, K.A.; Blanchard, C.L. Investigation of phenolic compounds with antioxidant activity in barley and oats affected by variation in growing location. Cereal Chem. J. 2020, 97, 772–782. [Google Scholar] [CrossRef]
- Yang, X.J.; Dang, B.; Fan, M.T. Free and Bound Phenolic Compound Content and Antioxidant Activity of Different Cultivated Blue Highland Barley Varieties from the Qinghai-Tibet Plateau. Molecules 2018, 23, 879. [Google Scholar] [CrossRef]
- Abdel-Aal, E.S.M.; Choo, T.M. Differences in compositional properties of a hulless barley cultivar grown in 23 environments in eastern Canada. Can. J. Plant. Sci. 2014, 94, 807–815. [Google Scholar] [CrossRef]
- Magallanes-López, A.M.; Hernandez-Espinosa, N.; Velu, G.; Posadas-Romano, G.; Ordoñez-Villegas, V.M.G.; Crossa, J.; Ammar, K.; Guzmán, C. Variability in iron, zinc and phytic acid content in a worldwide collection of commercial durum wheat cultivars and the effect of reduced irrigation on these traits. Food Chem. 2017, 237, 499–505. [Google Scholar] [CrossRef]
- Singh, S.; Gupta, A.K.; Kaur, N. Influence of Drought and Sowing Time on Protein Composition, Antinutrients, and Mineral Contents of Wheat. Sci. World J. 2012, 2012, 1–9. [Google Scholar] [CrossRef] [PubMed]
- AOAC International. AOAC official method 990.03, protein (crude) in animal feed, combustion method. In AOAC Official Methods of Analysis, 17th ed.; Association of Official Analytical Chemists: Arlington, VA, USA, 2000; Volume 1. [Google Scholar]
- Beleggia, R.; Platani, C.; Nigro, F.; Cattivelli, L. A micro-method for the determination of Yellow Pigment Content in durum wheat. J. Cereal Sci. 2010, 52, 106–110. [Google Scholar] [CrossRef]
- Tahir, M.; Ali, A.; Nadeem, M.A.; Hussain, A.; Khalid, F. Effect of different sowing dates on growth and yield of wheat (Triticum aestivum L.) varieties in district Jhang, Pakistan. Pak. J. Life Soc. Sci. 2009, 7, 66–69. [Google Scholar]
- Forster, S.M.; Ransom, J.K.; Manthey, F.A.; Rickertsen, J.R.; Mehring, G.H. Planting Date, Seeding Rate, and Cultivar Impact Agronomic Traits and Semolina of Durum Wheat. Am. J. Plant Sci. 2017, 8, 2040–2055. [Google Scholar] [CrossRef]
- Bassu, S.; Asseng, S.; Motzo, R.; Giunta, F. Optimising sowing date of durum wheat in a variable Mediterranean environment. Field Crop. Res. 2009, 111, 109–118. [Google Scholar] [CrossRef]
- Pal, P.; Reddy, M.D.; Pandey, G.; Kumar, A. Effect of different dates of sowing on barley (Hordeum Valgare L.) varieties under limited irrigation. J. Pharm. Phytochem. 2018, SP2, 88–91. [Google Scholar]
- Ram, H.; Singh, B.; Sharma, A. Effect of time of sowing on the field performance of barley (Hordeum vulgare L.). Punjab Agric. Univ. Agric. Res. J. 2010, 47, 132–135. [Google Scholar]
- Eticha, F.; Grausgruber, H.; Siebenhandl-Ehn, S.; Berghofer, E. Some agronomic and chemical traits of blue aleurone and purple pericarp wheat (Triticum L.). J. Agric. Sci. Technol. 2001, B1, 48–58. [Google Scholar]
- Ahmed, M.; Hassan, F.U. Response of Spring Wheat (Triticum aestivum L.) Quality Traits and Yield to Sowing Date. PLoS ONE 2015, 10, e0126097. [Google Scholar] [CrossRef] [PubMed]
- Motzo, R.; Fois, S.; Giunta, F. Protein content and gluten quality of durum wheat (Triticum turgidum subsp.durum) as affected by sowing date. J. Sci. Food Agric. 2007, 87, 1480–1488. [Google Scholar] [CrossRef]
- Rascio, A.; Codianni, P.; Colecchia, S.; Miullo, V.; Rinaldi, M.; De Santis, G. Caratterizzazione e valorizzazione di una collezione di frumenti pigmentati. Dal Seme 2014, 14, 62–65. [Google Scholar]
- Shahzad, K.; Bakht, J.; Shah, W.A.; Shafi, M.; Jabeen, N. Yield and yield components of various wheat cultivars as affected by different sowing dates. Asian J. Plant Sci. 2002, 1, 522–525. [Google Scholar] [CrossRef][Green Version]
- Ozturk, A.; Caglar, O.; Bulut, S. Growth and Yield Response of Facultative Wheat to Winter Sowing, Freezing Sowing and Spring Sowing at Different Seeding Rates. J. Agron. Crop. Sci. 2006, 192, 10–16. [Google Scholar] [CrossRef]
- Ficco, D.B.M.; De Simone, V.; De Leonardis, A.M.; Giovanniello, V.; Del Nobile, M.A.; Padalino, L.; Lecce, L.; Borrelli, G.M.; De Vita, P. Use of purple durum wheat to produce naturally functional fresh and dry pasta. Food Chem. 2016, 205, 187–195. [Google Scholar] [CrossRef] [PubMed]
- Escribano-Bailón, M.T.; Santos-Buelga, C.; Rivas-Gonzalo, J.C. Anthocyanins in cereals. J. Chromatogr. A 2004, 1054, 129–141. [Google Scholar] [CrossRef] [PubMed]
- Jaafar, S.N.S.; Baron, J.; Siebenhandl-Ehn, S.; Rosenau, T.; Böhmdorfer, S.; Grausgruber, H. Increased anthocyanin content in purple pericarp × blue aleurone wheat crosses. Plant Breed. 2013, 132, 546–552. [Google Scholar] [CrossRef]
- Zhu, F. Anthocyanins in cereals: Composition and health effects. Food Res. Int. 2018, 109, 232–249. [Google Scholar] [CrossRef] [PubMed]
- Suriano, S.; Iannucci, A.; Codianni, P.; Fares, C.; Menga, V.; Russo, M.; Marciello, U.; Troccoli, A. Carotenoids and tocols content in genotypes of colored barley. J. Cereal Sci. 2020, 96, 103110. [Google Scholar] [CrossRef]
- Trono, D. Carotenoids in Cereal Food Crops: Composition and Retention throughout Grain Storage and Food Processing. Plants 2019, 8, 551. [Google Scholar] [CrossRef]
- Colasuonno, P.; Marcotuli, I.; Blanco, A.; Maccaferri, M.; Condorelli, G.E.; Tuberosa, R.; Parada, R.; De Camargo, A.C.; Schwember, A.R.; Gadaleta, A. Carotenoid Pigment Content in Durum Wheat (Triticum turgidum L. var durum): An Overview of Quantitative Trait Loci and Candidate Genes. Front. Plant Sci. 2019, 10, 1347. [Google Scholar] [CrossRef] [PubMed]
- Abdel-Aal, E.S.M.; Hucl, P. A Rapid Method for Quantifying Total Anthocyanins in Blue Aleurone and Purple Pericarp Wheats. Cereal Chem. J. 1999, 76, 350–354. [Google Scholar] [CrossRef]
- Blanco, A.; Colasuonno, P.; Gadaleta, A.; Mangini, G.; Schiavulli, A.; Simeone, R.; Digesù, A.M.; De Vita, P.; Mastrangelo, A.M.; Cattivelli, L. Quantitative trait loci for yellow pigment concentration and individual carotenoid compounds in durum wheat. J. Cereal Sci. 2011, 54, 255–264. [Google Scholar] [CrossRef]
- Groth, S.; Wittmann, R.; Longin, C.F.H.; Böhm, V. Infuence of variety and growing location on carotenoid and vitamin E contents of 184 different durum wheat varieties (Triticum turgidum ssp. durum) in Germany. Eur. Food Res. Technol. 2020, 246, 2079–2092. [Google Scholar] [CrossRef]
- Ku, K.M.; Kim, H.S.; Kang, Y.H. Correlation Analysis Between Antioxidant Activity and Phytochemicals in Korean Colored Corns Using Principal Component Analysis. J. Agric. Sci. 2014, 6, 1. [Google Scholar] [CrossRef]
- Sharma, S.; Chunduri, V.; Kumar, A.; Kumar, R.; Khare, P.; Kondepudi, K.K.; Bishnoi, M.; Garg, M. Anthocyanin bio-fortified colored wheat: Nutritional and functional characterization. PLoS ONE 2018, 13, e0194367. [Google Scholar] [CrossRef] [PubMed]
- Djanaguiraman, M.; Prasad, P.V.; Seppanen, M. Selenium protects sorghum leaves from oxidative damage under high tem-perature stress by enhancing antioxidant defense system. Plant. Physiol. Biochem. 2010, 48, 999–1007. [Google Scholar] [CrossRef] [PubMed]
- Sehgal, A.; Sita, K.; Siddique, K.H.M.; Kumar, R.; Bhogireddy, S.; Varshney, R.K.; Hanumantharao, B.; Nair, R.M.; Prasad, P.V.V.; Nayyar, H. Drought or/and Heat-Stress Effects on Seed Filling in Food Crops: Impacts on Functional Biochemistry, Seed Yields, and Nutritional Quality. Front. Plant Sci. 2018, 9, 1705. [Google Scholar] [CrossRef]
- Ashraf, M. Stress-Induced Changes in Wheat Grain Composition and Quality. Crit. Rev. Food Sci. Nutr. 2014, 54, 1576–1583. [Google Scholar] [CrossRef] [PubMed]
- Chaturvedi, A.K.; Bahuguna, R.N.; Pal, M.; Shah, D.; Maurya, S.; Jagadish, K.S. Elevated CO2 and heat stress interactions affect grain yield, quality and mineral nutrient composition in rice under field conditions. Field Crop. Res. 2017, 206, 149–157. [Google Scholar] [CrossRef]


Publisher’s Note: MDPI stays neutral with regard to jurisdictional claims in published maps and institutional affiliations. |
© 2021 by the authors. Licensee MDPI, Basel, Switzerland. This article is an open access article distributed under the terms and conditions of the Creative Commons Attribution (CC BY) license (http://creativecommons.org/licenses/by/4.0/).