1. Introduction
The gap between genetic potential and the average producer soybean (
Glycine max (L.) Merr.) yield at the farm level has previously been investigated in the north-central USA region. In the north-central USA region, the states North Dakota, South Dakota, and Minnesota comprised 19% of USA soybean production in 2020 [
1] with an average profit of
$230 USD ha
−1 in southern North Dakota [
2]. A grower survey of 524 soybean fields in North Dakota by Rattalino Edreira et al. [
3] found yield differences between the highest and average-yielding (1200 kg ha
−1) fields were due to three primary factors, including planting date (PD) [
3], relative maturity (RM) [
4], and seeding rate (SR) [
5]. Mourtzinis et al. [
4] stated that RS practices in North Dakota were about equally split between narrow (~25 cm) and wide (~76 cm) spacings in surveyed soybean fields. The effects of PD, RM, SR, and RS on soybean production have been individually well-investigated. Current North Dakota management trends of second-half of May planting, cultivars with RM not best-adapted for the region, and 408,000 seed ha
−1 SR can be improved upon [
6], with narrow RS providing yield benefits compared to wide RS in northern growing regions [
7]. The potential synergistic effects of early planting, cultivars with longer RM [
6], and SR higher than 408,000 seed ha
−1 require further exploration, especially in northern USA soybean production environments [
8,
9].
The soybean planting date is considered the most important cultural management factor to production [
10]. Delaying soybean planting from 1 May to 15 May decreased yield by 0.5% d
−1 in Minnesota [
11]. Delaying soybean planting beyond May resulted in declining yields in the north-central USA region [
3,
12,
13,
14,
15,
16]. In addition, Stanley [
6] reported a 0.4% d
−1 yield loss when delaying planting beyond 1 May (up to 1 June) in North Dakota. However, soybean yield response to PD can vary considerably from year-to-year, especially depending on the magnitude of environmental constraints [
15,
16].
The length of the cropping season in the north-central USA has increased by 5 to 20 d since the 1950s, according to Kucharik et al. [
17], generating uncertain optimal soybean maturity recommendations [
18]. Soybean cultivar RM groups in the USA range from 00.0 to 10.0 [
19], with the suggested maturity groups for production in North Dakota ranging from 00.0 to 1.0 [
20]. Mourtzinis and Conley [
21] delineated optimal soybean maturity group zones and noted a range of RM 0.0 to 1.5 is more suited for North Dakota production. To maximize yield, current production recommendations suggest utilizing a cultivar with the longest maturity group suitable for a growing region [
22].
With similar SR, the distance between soybean rows has an impact on plant density within the row and soybean seed yield. Narrow rows can cause earlier in-season canopy closure [
23], resulting in greater accumulated light interception compared to wider RS [
24,
25]. In the northern and central soybean growing regions in the USA, narrow RS can improve soybean yields in normal environmental conditions [
9,
25,
26,
27,
28,
29,
30]. Narrow rows can increase soybean yield when planted late or under no-till conditions [
14]. In contrast, wide soybean RS improves yields under soil water deficit conditions [
29,
31].
Various SR have been reported as optimal for yield and typically differ between growing regions. Seeding rates below 560,197 seeds ha
−1 in Iowa [
32], 284,050 to 573,000 seeds ha
−1 in high yield conditions in Kansas [
29], and 444,600 to 494,000 seeds ha
−1 in North Dakota [
9], all of which have been found to produce the greatest yield. Soybean iron deficiency chlorosis (IDC) in IDC-prone North Dakota soils can be reduced by increasing plant density from 300,000 to 600,000 plants ha
−1, resulting in increased seed yield [
33]. To produce similar yields around 3600 kg ha
−1, Lee et al. [
34] reported optimal SR for planting in May in Kentucky was as low as 171,000 seed ha
−1, where SR in Wisconsin was as high as 741,000 seeds ha
−1 [
14]. Gaspar et al. [
5] found SR below the agronomical optimal SR exponentially increased risk and potential yield loss. Reducing risk for soybean yield loss may be circumvented by optimizing canopy cover through management, which would require a greater understanding of the effect of management practices on canopy cover.
Canopy cover is a useful proxy measurement for light interception and crop productivity [
35]. Maximum photosynthesis is achieved when plants maximize light interception and utilization of photosynthetic radiation [
36,
37]. Light interception can be quantified with methods such as quantum line sensors [
38], approximated by fractional green canopy cover (FGCC) from pictures using the Canopeo app [
39], and leaf area index.
Estimating and predicting crop yields using canopy cover measurements is of high relevance to producers. Crop growth stage [
40], RS [
41], and canopy structure [
42] can affect FGCC. Green canopy cover may allow for better yield prediction and a useful application in soybean production. To our knowledge, no previous research in the northern USA soybean growing region has evaluated the combined effect of management factors and their potential for synergism to increase soybean yields, and their use in yield prediction based on canopy cover.
The objectives of the research were to determine how PD, SR, RM, and RS, as individual factors and when combined, affect seed yield, and agronomic characteristics, if combining factors are more economical than current practices, and to evaluate if FGCC can predict soybean yield.
2. Materials and Methods
Field experiments were conducted in 2019 and 2020 in Fargo, North Dakota, USA (46.932° N, 96.513° W). Each year the location had two experiments: one tile-drained, as described by Kandel et al. [
43], and one non-tile-drained. Each experiment and year combination were called an environment, for a total of four environments.
The experimental design was a randomized complete block (RCB) with a split-plot arrangement with four replicates. The whole plot was PD, and the sub-plots were a factorial combination of RM of cultivars, SR, and RS, with the combination of all factors described as a package. Planting dates were at an optimal time, which is no earlier than 5 d before the last projected spring frost in mid-May and a late PD two weeks thereafter (
Table 1). Cultivars were from the same company and differed by 0.3 RM units and were described as early or late RM relative to the cultivars grown in that environment (
Table 2). Seeding rates were 408,000 and 457,000 pure live seeds (germinable seeds) ha
−1 and adjusted using a 98% germination average. The RS widths were narrow (30.5 cm) and wide (61 cm). The four factors of PD, RM, SR, and RS were combined over 2019 and 2020, with the main effects analyzed individually. To answer if a combination of factors provided higher yield compared to conventional practices, individual factors were combined into ‘packages’, combined across environments, and analyzed by packages using an RCB. The ‘improved package’ consisted of an early PD, late RM, 457,000 seeds ha
−1, and narrow RS factors, whereas the ‘conventional package’ was a late PD, early RM, 408,000 seeds ha
−1, and wide RS.
Experimental units were seeded using a Hege 1000 no-till planter (Hege Company, Waldenberg, Germany). Seeds were sown to a depth of approximately 3 cm, with the experimental unit size being 1.52 m by 5.47 m. Soils were tested (
Table 3) for plant essential nutrients before seeding to ensure fertility was not a limiting factor based on North Dakota State University recommendations [
20]. Soil fertility levels were sufficient and no additional fertilizer was applied. Soybean seed was pre-treated with Acceleron seed treatment, (Bayer CropScience, Monheim, Germany). Seeds were inoculated with
Bradyrhizobium jamponicum using Vault SP (BASF, Ludwigshafen, Germany) at a rate of 40 g per 23 kg of seed.
Two applications of Roundup PowerMAX (Bayer CropScience, Monheim, Germany) at a rate of 1.6 L ha
−1 were applied during the season for weed control. Soybean aphid (
Aphis glycines Matsumura) and grasshopper (Orthoptera: Acrididae) were controlled when pest densities surpassed the economic threshold [
44] using the insecticide Mustang Maxx (FMC Corporation, Philadelphia, PA, USA) at a rate of 1.75 L ha
−1.
After planting, a number of established plants per experimental unit were recorded at the V2 or two trifoliolate stage [
45]. Established plant density was determined by counting a 0.91 m length from the middle soybean rows, and the final plant density was determined by counting plants from the same length before harvest. During the growing season, soil cover percent was recorded using the Canopeo app (Oklahoma State University, Stillwater, OK, USA). Fractional green canopy cover photos were processed to determine a canopy coverage percentage [
39]. Canopy pictures were taken approximately 1.5 m from the soil surface in the center of each plot using an iPad (Apple, Cupertino, CA, USA). Matlab software (MathWorks, Inc., Natick, MA, USA) was used to estimate canopy cover by FGCC. The FGCC measurements were recorded when soybean plants in the early PD were at the V2, V4, R1, R3, R5, or R7 growth stage (two trifoliolate, four trifoliolate, beginning of flowering, beginning of pod formation, beginning of bean development, and pod and leaf yellowing), respectively [
45]).
Experimental units were harvested after physiological maturity [
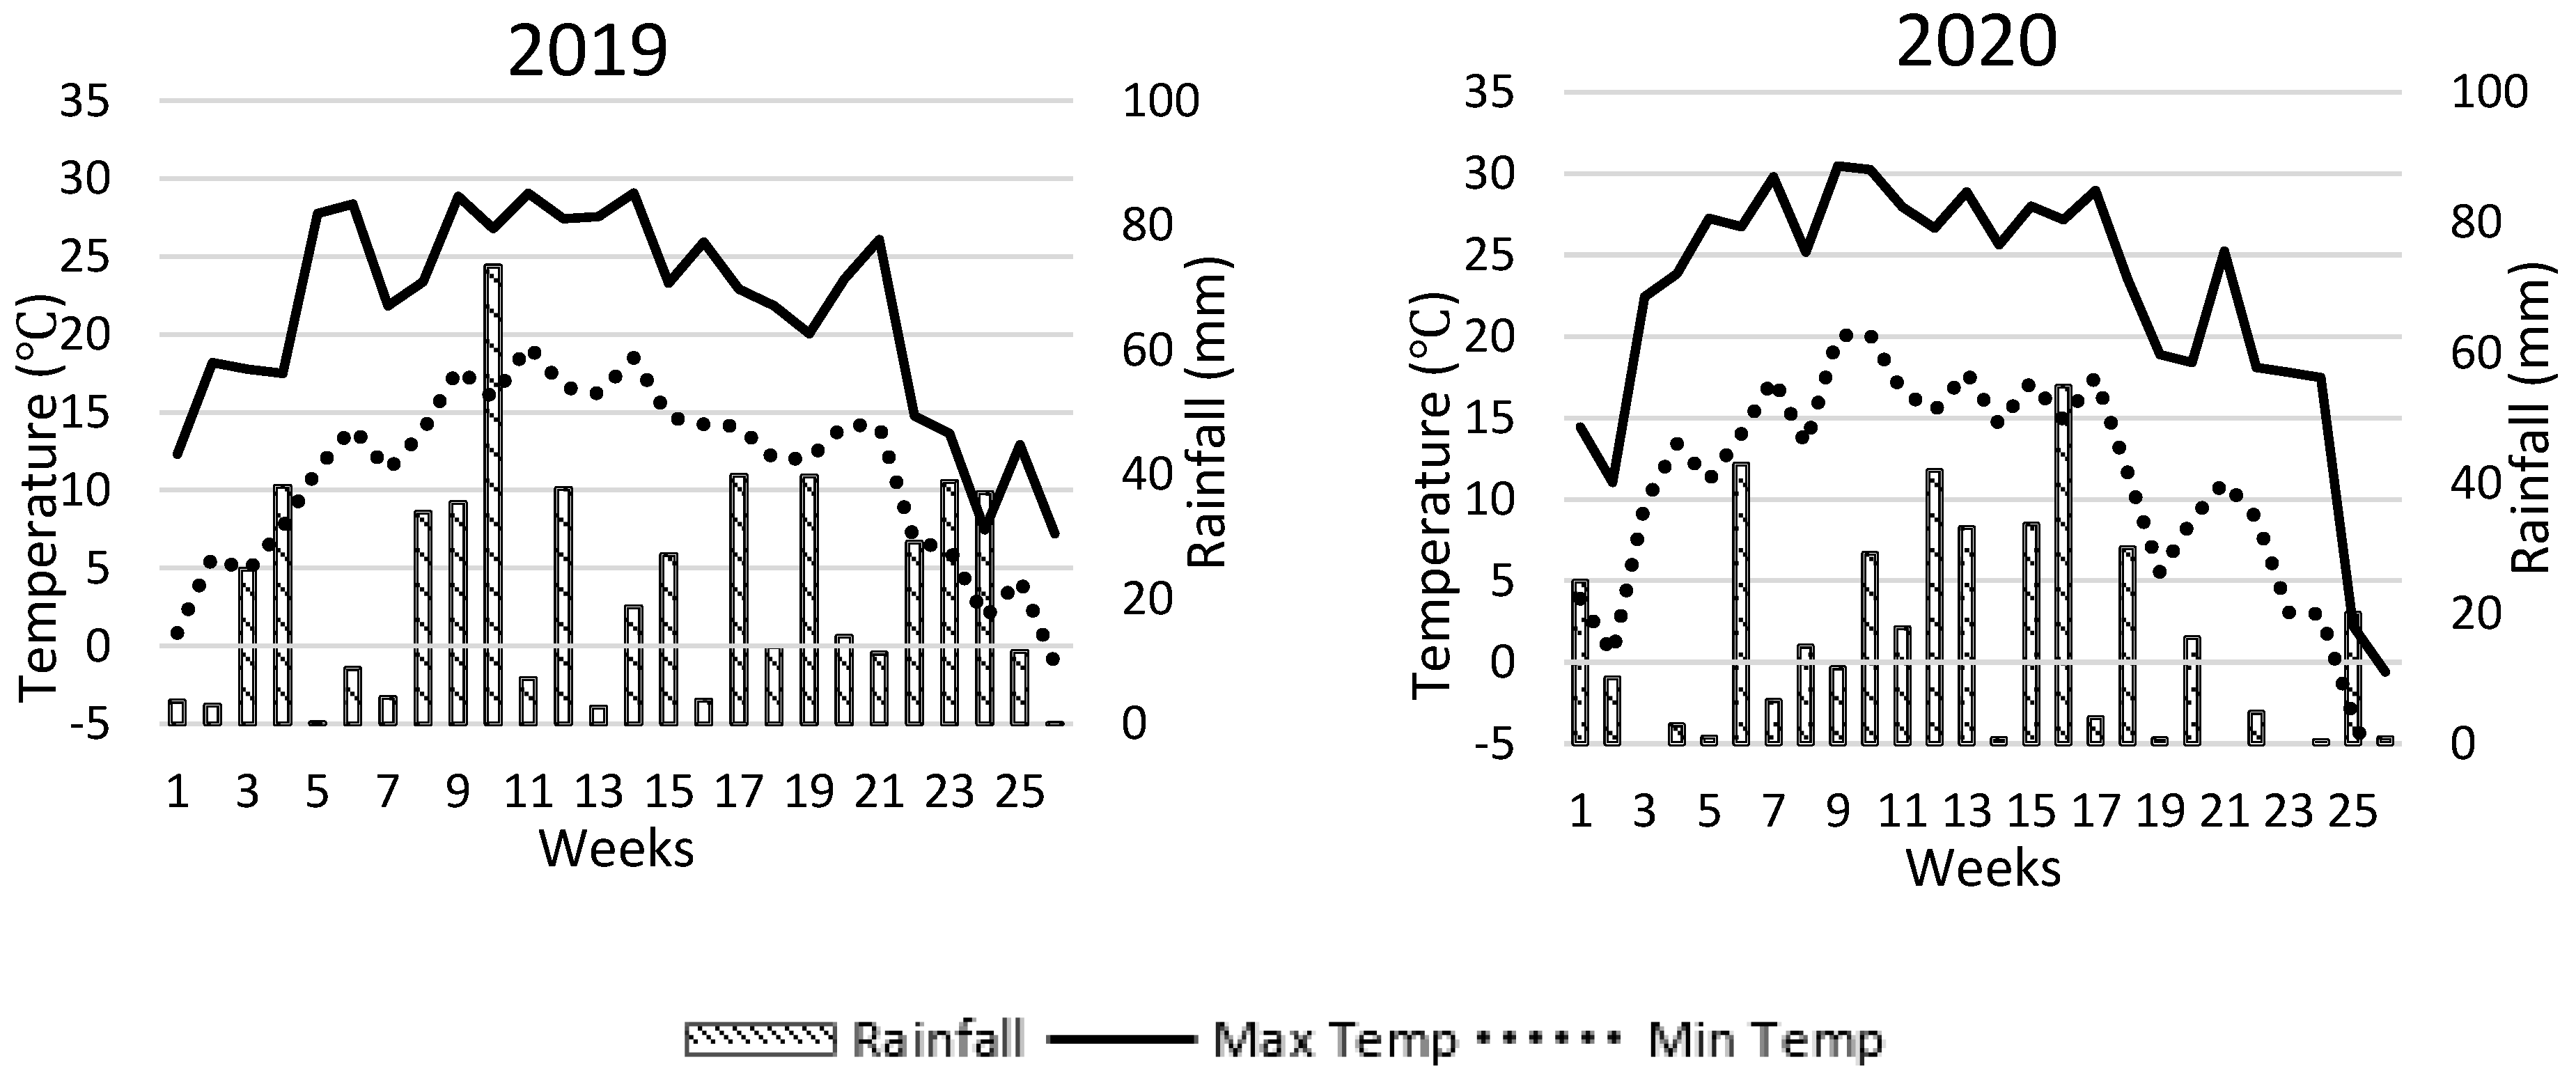
45] using a Wintersteiger classic plot combine (Wintersteiger AG, Ried, Austria). Seed samples were cleaned and weighed post-harvest and analyzed for oil and protein content using a Perten Instruments DA 7250 NIR analyzer (Perten Instruments, Inc., Springfield, IL, USA). Moisture and test weight were determined using a GAC 2100 moisture tester (DICKEY-John Corp., Minneapolis, MN, USA) and observations were corrected to 13% moisture content. Seed weights were obtained by counting 1000 seeds using an electric counter and weighing them. Weather data were collected using the North Dakota Agricultural Weather Network [
46] providing weekly maximum and minimum air temperature and rainfall using the Fargo NDAWN weather station.
Normality and homogeneity of variance assumptions of ANOVA were met, as determined by residual histograms and the ratio of the highest and lowest error mean square being less than 10 [
47]. Analysis of variance was performed for 2019 and 2020 environments using the GLIMMIX procedure in SAS 9.4 (SAS Institute, SAS Circle, Cary, NC, USA). The individual factor analysis used fixed and random effect designations described by Carmer et al. [
48], where PD, RM, SR, and RS were considered fixed effects, while environment, and replicate within environment, were considered random. Analysis of variance of dependent variables for packages were performed using the GLIMMIX procedure, where package was considered a fixed effect, and environment a random effect. The FGCC dependent variable was analyzed as a repeated measure over time using the design structure similar to the respective analysis [
49]. Simple linear correlations between FGCC and yield were performed using the CORR procedure. Orthogonal contrasts were made using Proc GLIMMIX to compare improved and conventional management packages. Means were separated using a Tukey’s HSD with
p = 0.05.
A partial net profit economic analysis for the individual factors and packages were only included costs associated with seed and no other costs, such as machinery and labor which do not affect the economics of SR. The partial net profit was calculated by subtracting seed cost (price per seed (PPS)⨯ live seeding rate (SR)) from gross revenue (seed yield (SY)⨯ market price (MP)):
. Price per seed was calculated by dividing a
$49.20 seed cost unit
−1 by 140,000 seeds [
50]. Gross revenue calculations used the 2010–2020 soybean market price average of
$0.41 kg
−1 from the Chicago Board of Trade. Means were separated using Tukey’s HSD with
p = 0.05.


